Educational Inequality in India: An Analysis of Gender ... · Educational Inequality in India: An...
46
1 | Page Working Paper No. 2016-2 Educational Inequality in India: An Analysis of Gender Differences in Reading and Mathematics Gregory White University of Maryland, College Park [email protected] Matt Ruther University of Louisville Joan Kahn University of Maryland College Park March 25, 2016 India Human Development Survey fieldwork, data entry and analyses have been funded through a variety of sources including the US National Institutes of Health (grant numbers R01HD041455 and R01HD061048), UK Department of International Development, the Ford Foundation, and the World Bank.
Transcript of Educational Inequality in India: An Analysis of Gender ... · Educational Inequality in India: An...
1 | P a g e
Working Paper No. 2016-2
Educational Inequality in India:
An Analysis of Gender Differences in
Reading and Mathematics
Gregory White
University of Maryland, College Park
Matt Ruther
University of Louisville
Joan Kahn
University of Maryland College Park
March 25, 2016
India Human Development Survey fieldwork, data entry and analyses have been funded through a variety of sources including the US National Institutes of Health (grant numbers R01HD041455 and R01HD061048), UK Department of International Development, the Ford Foundation, and the World Bank.
ABSTRACT This paper analyzes gender differences in reading and mathematics among Indian
children ages 8-11 using data from the 2005 India Human Development Survey.
Employing descriptive statistics and ordered logistic regression techniques, this study
examines how social background, access to learning resources, time devoted to formal
learning activities, and cultural attitudes are associated with gender inequality in
educational outcomes. It is hypothesized that gender inequality may result from historical
attitudes regarding the education of girls as well as certain parents choosing to prioritize
sons’ education over daughters’ education. This may be due to a hidden opportunity cost
of engaging girls in activities (e.g. childcare) that have economic value for the family,
particularly for girls in rural areas and from the lowest income families. The results
provide some evidence to support these theories. Relative to boys, the presence of
younger siblings reduces the likelihood of girls advancing in both reading and
mathematics. In addition, higher levels of household assets increase the likelihood of girls
advancing in reading. Unfortunately, mixed findings related to rural/urban status provide
less insight than desired regarding this factor. Finally, attitudes supportive of female
education are found to benefit girls’ reading achievement.
INTRODUCTION
Gender inequality in education is a persistent problem in Indian society,
especially for girls from rural areas and lower socioeconomic backgrounds. During the
past several decades, India has achieved success in moving toward universal school
enrollment and in enacting policies to address educational inequalities such as those
2
based on gender. However, education gaps still exist. This paper seeks to identify the
factors through which educational gender inequality operates and the social contexts that
are associated with those girls who may be left behind academically.
Using data from the 2005 India Human Development Survey (IHDS), this study
analyzes how social background factors, access to learning resources, time devoted to
formal learning activities, and cultural attitudes regarding the education of girls may
contribute to ongoing gender gaps in learning. This study is an attempt to go beyond
more commonly found descriptive studies of country-wide achievement and attainment
patterns by measuring a more diverse set of indicators newly available through the IHDS.
A primary aim of this study is to identify statistical interactions among key variables. We
hope the results will provide increased insight into the current status of educational
inequality in India, offer useful information to policymakers as they develop targeted
policies to address persistent gender inequality, and identify areas for further study using
more fine-grained analyses among a narrower range of variables.
Prior research reveals educational disparities by various demographic and school-
related factors such as gender, social background, and access to educational resources. To
build on this foundation, additional research is needed to further examine factors and
moderating influences that are associated with gender gaps, and to assess how the effects
of India’s increasing educational attainment, public policies targeted to girls, and
changing educational landscape are having an impact.
Several important questions emerge from the literature regarding gender
inequality in education. For example, although socioeconomic and other family
3
background factors have been shown to influence educational attainment, it is less clear
how these factors may differentially affect boys and girls. Time devoted to learning and
other educational resources are also important to investigate, and it may be the case that
parents are prioritizing sons’ education over daughters’ education through the allocation
of these factors. Finally, the role of attitudes toward the education of girls is
underexplored. Female students with parents who look favorably upon the education of
girls might be expected to exhibit higher educational achievement relative to those
without such parents. In order to answer these questions, this paper will explore the
relative contributions that social background factors, learning resources, time devoted to
learning, and cultural attitudes make to academic learning.
Educational reform in India
Attempts to increase the educational achievement of girls are taking place amidst
a backdrop of sweeping educational expansion in India. During the last half of the
twentieth century, India made great strides in improving its education infrastructure – an
achievement representative of a post-war educational expansion by newly independent
states and the importance of education within the emerging nation-state model (Meyer,
Ramirez, and Soysal 1992). India’s educational expansion is also reflective of the United
Nation’s Economic, Social, and Cultural Organization (UNESCO) program Education for
All and the push to achieve universal primary education by the year 2015 under the
Millennium Development Goals program (Govinda 2002; United Nations 2010). In
addition, expansion efforts are guided by India’s Constitution, which mandates universal
education for those under the age of fourteen, a 1986 National Policy on Education which
4
increased educational investments for girls and lower-caste children, and a 1993 Supreme
Court decision that upheld education as a fundamental right of citizens. Complementing
these policy imperatives are other government and NGO efforts to universalize
enrollment, improve learning, and promote gender equality in education. Specific policies
have included the expansion of educational funding, the provision of free educational
resources such as textbooks and uniforms, an increase in the number of female teachers,
and the introduction of local schools, single sex schools, and special facilities (including
in non-formal settings) for girls and the non-enrolled (Government of India (GOI) 2000;
Govinda 2002; Kingdon 2007; Nayar 2002; Rao, Cheng, and Narain 2003).
A primary outcome of this increased focus on education and learning has been a
sizable increase in literacy rates among the Indian population from approximately 18% to
65% in the fifty years ending in 2001. However, a significant gender gap of nearly 22%
still remained at the beginning of the 21st century (GOI 2000; GOI 2011). According to
census estimates, the literacy rate has continued to climb to 73% in 20111; however, the
gender gap has only narrowed slightly, with women still at literacy levels 16% below
men (GOI 2011). Literacy rates among youths age 15-24 were higher still, at 81% in
2005-2008, yet a 14% gender gap remained (UNESCO 2011).
The continued presence of educational gaps is perhaps unsurprising, given the
historical prevalence of gender inequality in a patriarchal Indian society (Desai et al.
2010). However, educational disparities in India are striking given their contrast to a
worldwide pattern of less marked gender inequality in education. The gap in reading
skills in India is especially noteworthy as girls in most other countries (including
5
developing nations) typically outscore boys in reading as measured on international tests
of comparative educational achievement (Lynn and Mikk 2009; Organization for
Economic Cooperation and Development (OECD) 2010; United States Department of
Education 2007) 2.
It is important to remedy educational inequalities since they can lead to inequality
in economic and other adult domains. Education is linked to increased future wages for
women (Kingdon 2007), and is seen as a protective factor that is associated with child
investments as well as other health and civic outcomes (Desai et al. 2010). Importantly,
educational inequalities have been shown to be amenable to remediation through policies
geared toward increasing girls’ academic achievement (Marks 2008).
Factors associated with educational achievement
Social background factors
The education research literature has focused on the relative contributions of both
social background and school environment to learning and academic achievement. In the
United States, the Coleman report from 1966 was among the first to establish the
importance of students’ family backgrounds to the academic success of children
(Coleman et al. 1966). Recent scholarship also reveals that achievement gaps based on
family background factors such as income level continued to expand in the U.S. during
the last several decades of the twentieth century (Duncan and Murnane 2011; Reardon
2011). In India, despite improvements in educational access over the past several
decades, social background is still found to be associated with learning outcomes.
Achievement gaps based on gender, region, and other social background factors often
6
arise in primary school, and many Indian children struggle against historical inequality
such as that based on gender and caste (Desai et al. 2010; Rao, Cheng, and Narain 2003;
Probe Team 1999). First generation learners and those from impoverished backgrounds
may also enter school with a diminished readiness to learn (Kaul 2002).
Within India, large regional differences in educational outcomes also exist, with
rural females and those living in urban poverty largely representing those who are
illiterate and those who are not enrolled in school (Nayar 2002). Sundaram and
Vanneman (2008) consider regional variation in educational achievement and find that
the level of economic development is associated with a narrowing of gender gaps in
literacy, with level of district wealth as well as number of teachers in a district as largely
being responsible for this difference. Additional state specific initiatives (not addressed
by this analysis), such as the successful social and political efforts to promote female
literacy and education in the state of Kerala, have also resulted in the achievement of
higher literacy levels for both boys and girls (Probe Team 1999).
Access to high-quality education resources
Educational research highlights the importance of school-level resources in
student learning (Greenwald, Hedges, and Laine 1996; Hedges, Laine, and Greenwald
1994), although some question whether additional resources are associated with
improvements in school quality and educational outcomes once family background
factors are considered (Banerjee et al. 2007; Hanushek 1989, 1995, 1997). In addition,
research indicates that the influences of socioeconomic background and the availability
of educational resources are often interrelated (Duncan and Murnane 2011). Moreover,
7
research in developing countries such as India indicates that quality schooling may be
especially influential in promoting the academic achievement of students (Gamoran and
Long 2006; Heyneman and Loxley 1983).
School quality is important to consider given research that suggests Indian girls
may experience lower quality school environments than boys. In particular, girls are
enrolled in private schools at somewhat lower rates than boys and are less engaged with
private tutoring. Together these factors contribute to higher overall education
expenditures for boys than for girls, even with the existence of special fee reduction
policies for girls in some areas (Desai, Dubey, Vanneman, and Banerji 2009; Desai et al.
2010). In addition to gender, social background factors such as caste also influence
school quality differentials and contribute to the unequal treatment students may receive
within schools from teachers (Probe Team 1999). Furthermore, the expansion of higher
quality, fee-based private schools may continue to expand these gaps in access and
learning (Kingdon 2007).
Girls’ under-enrollment in private schools is of special concern given that private
schools and government schools may differ in educational quality and outcomes. Studies
have found that, after controlling for student intake factors, attendance at a private school
(relative to a government school) is associated with a higher level of student achievement
(Kingdon 2007). In the development of reading and mathematics skills, higher beneficial
returns of private school attendance are found for rural students, lower income students,
and students with the least educated parents (Desai, Dubey, Vanneman, and Banerji
2009; Desai et al. 2010)3.
8
Research also finds that differences in educational expenditure on boys and girls
are related to the level of urbanization. Kingdon (2005) finds that inequality in
educational expenditure within households in rural areas is primarily the result of
enrollment differentials between boys and girls. Using data from the IHDS, Azam and
Kingdon (2011) also reveal that gender disparities in educational expenditure are more
prevalent in rural areas and within certain states. In addition, these authors suggest that an
important factor related to gaps in education expenditure is the higher level of private
school enrollment among boys.
Finally, lower-income families may struggle to fund educational expenses and
may have a higher demand for child labor. Lower-income parents may find the additional
cost of sending a child to school (e.g. paying for school materials, uniforms) a financial
hardship in addition to the opportunity cost of girls not fulfilling other time intensive
household and child care responsibilities (GOI 2000; Probe Team 1999; Rao et al. 2003).
Time devoted to school-related learning activities
Historically, Indian girls enrolled in school at lower rates than boys (GOI, 2000),
and when they did enroll, they tended to “enter late and dropout earlier” (Nayar 2002:
38). Girls also did not progress to or enroll in upper primary levels at the same rate as
boys with major impediments to their continued progression being the lack of a nearby
upper primary school, cultural attitudes toward female education, and being diverted to
household and childrearing tasks that may have economic value for the family (GOI
2000; Probe Team 1999).
9
More recently, girls have achieved near equal primary school enrollment parity
with boys as primary school intake and enrollment rates approached near universal levels
by 20074. Both boys and girls are also transitioning from primary school to higher
education levels at nearly equal rates (84% of girls and 86% of boys in 2006), however
despite this improvement, girls still lag overall behind boys at the secondary level5
(UNESCO, 2011).
Despite this progress, certain subgroups of Indian girls (such as those from rural
backgrounds) may be at higher risk for school withdrawal or absenteeism due to cultural
beliefs about gender roles. They may also devote less time to out-of-school learning
activities such as completing homework. Reasons for diminished engagement in school-
related activities include the need to fulfill household responsibilities such as domestic
work and caring for younger siblings. These competing demands for girls’ time may
present an opportunity cost for parents who wish to employ girls in activities that permit
the economic survival of the family. Other reasons cited for girls dropping out or
spending less time in school-related activities include the burden of school expenses, a
lack of parental interest in educating girls, girls not being allowed to travel to distant
schools, and the dearth of female teachers (Govinda 2002; Nayar 2002; Probe Team
1999). Of special note, the issue of caring for younger siblings is exacerbated in India by
a scarcity of early education and care facilities, which can have particularly negative
consequences for older girls in large rural families (Govinda 2002; Kaul 2002; Probe
Team 1999). However, improvement in the availability of early care facilities may be
10
partially responsible for the recent success in girls’ enrollment, in addition to the overall
decline in fertility rates in India (GOI 2000; United States Census Bureau 2014).
Motiram and Osberg (2010) add further insight into the time available for learning
in their analysis of the Central Statistical Organization of India’s 1999 Indian Time Use
Survey. Overall, they find that girls attending school shared a higher burden for
performing household chores than did boys, regardless of age or urban/rural status. These
authors also found that the overall time devoted to household chores for both rural and
urban girls increased with age, however, rural girls (ages 6-14 and who were attending
school) devoted more time to household chores than their urban counterparts. Rural girls
also experienced the lowest rates for both enrollment and school attendance, with higher
percentages of rural girls missing from school as they got older. In addition, the
percentage of all children who do any homework is lowest for rural girls. This provides
evidence for the hypothesis that the opportunity cost of sending children to school (as
opposed to engaging them in household activities) is higher for girls than for boys, and
highest for rural girls.
Cultural attitudes regarding the education of girls
There is a fairly robust research literature that establishes the link between
cultural attitudes and academic achievement. Weiner (1985) finds that achievement
motivation, or the striving and persistence to learn, is related to both an individual’s own
belief, as well as the beliefs and attributions of others, that one can be a successful
learner. According to the expectancy value model, girls’ achievement-related decisions
are also influenced by whether learning is consistent with self-image, and whether
11
learning fits with other interests and the perceived utility and cost of engaging in learning
activities (Eccles 2005). In addition, Steele (1997) finds that expectations of gender roles
and gender stereotypes can have an effect on an individual’s educational achievement.
And finally, the beliefs and aspirations of parents and teachers in particular are found to
influence perceived self-efficacy, and the perception of inequity can reduce girls’ self-
confidence in their capabilities as learners (Bandura et al. 1996; Bussey and Bandura
1999).
Gender differences in educational outcomes are also related to community and
family attitudes regarding the education of girls. These attitudes are embedded in cultural
norms and are influenced by marriage and kinship patterns which may lead parents to
invest more emotional and financial resources in educating sons rather than daughters
(Desai et al. 2010). The centrality of preparing girls for marriage is pronounced in the
north of India where parents have historically held lower aspirations for educating
daughters rather than sons (Probe Team 1999).
Several factors influence negative attitudes toward the education of girls. One
concern relates to savings for dowry, which may limit the amount of funds that parents
have to spend on daughters’ education or create a fear that having educated daughters
may result in having to pay higher marriage costs and dowry. In addition, differences in
educational investment may result from parents’ reliance upon a son’s support in old age,
leading to a differential investment in the child who would be responsible for the parents’
financial security as they grow older (Desai et al. 2010; Probe Team 1999).
12
Within schools, girls may experience a less challenging curriculum than boys,
reflecting the traditional expectation that schools should prepare women for a more
traditional gendered role of homemaking and motherhood. In addition to this alienating
curriculum, girls may have fewer female teachers to serve as role models (especially in
rural areas), and may experience gender stereotyping and less attention from their
teachers (Basu 1996; Jeffery and Basu 1996; Nayar 2002; Probe Team 1999; Rampal
2002).
An emphasis on promoting a more diverse curriculum and increasing female
teachers is an attempt to reverse gender bias that girls experience in schools (GOI 2000).
At the same time, social changes are challenging traditional beliefs and practices in the
home. Education may increasingly be seen as important in the marriage prospects of
girls, who may be valued for their higher earning potential as well as their improved
ability of finding better-educated husbands, although these factors are still subject to
community specific norms. Education may also be seen as a social norm of good child-
rearing, and the skills developed through education may serve as a protective factor in
widowhood (Behrman et al. 1999; Probe Team 1999; Rao et al. 2003). Mothers’
aspirations for having educated daughters is also seen as increasing amid rising
educational aspirations overall (Desai et al. 2010; Probe Team 1999). In light of these
changing social norms and trends, an open question for research is how cultural attitudes
toward female education in India are currently associated with girls’ learning.
Given historical gender discrimination in India, and a research base showing the
negative influence that cultural attitudes can have on educational achievement, it is
13
important to understand how and under what circumstances gender bias may affect the
educational trajectories of Indian girls. India has experienced large gains in expanding
educational access to its children nationwide. The result has been the achievement of
nearly universal primary school enrollment for boys and girls and reduced gender
differences in literacy and other educational outcomes. However, previous research
reviewed in this section has shown persistent educational gaps based on gender and other
social background factors, such as caste, income, and level of urbanization. Rural girls
appear to be the most disadvantaged, as research indicates that they spend the least
amount of time in educational activities. Given the trend toward improved educational
equity over the past few decades, and taking into consideration these persistent gaps, it is
important to understand how factors historically linked to educational inequality for girls,
including the financial and emotional investments that parents make, are currently related
to girls’ educational achievement.
CONCEPTUAL FRAMEWORK AND RESEARCH DESIGN
This analysis will explore the primary factors of gender bias in Indian education
with a specific focus on the development of literacy and numeracy skills. The preceding
review indicates that many Indian girls experience lower quality school environments, are
afforded fewer educational resources to support their learning, and struggle with family
attitudes that do not encourage them to excel academically. Girls’ time may also be
diverted to household and childrearing tasks, leading to a decreased amount of time
available for learning. As a population of special concern, girls from rural areas appear to
14
have the least time devoted to learning, and have the lowest rates of enrollment, school
attendance, and homework completion.
Given that the quality of learning opportunities available to girls may be
fundamentally distinct from those of boys, gender will serve as a primary factor to be
analyzed in this study. This paper will also explore the impact of four sets of factors
thought to influence the educational outcomes of boys and girls. These factors include
social background and socioeconomic status, access to learning resources, time devoted
to formal learning activities, and cultural attitudes regarding the education of girls. Social
background and socioeconomic status are quantified by the child’s age, number of
younger siblings in the household, rural/urban residence, level of household education,
family assets, and caste. Access to learning resources is measured by the type of school
attended and the level of household educational expenditures. A child’s time available for
learning is assessed by homework completion rates, school absenteeism, and amount of
accumulated schooling. Lastly, household cultural attitudes will be explored to determine
whether higher aspirations for girls’ achievement translate into improved educational
success. Cultural attitudes are measured by two relevant variables available in the dataset:
(1) an adult household female’s attitude regarding girls’ education, and (2) a school
distance variable, which is considered important since many families are reluctant to
permit girls to travel long distances.
It is hypothesized that gender inequality in education is a result of negative
cultural attitudes regarding the education of girls, as well as parents choosing to prioritize
sons’ education over daughters’ education due to a hidden opportunity cost of engaging
15
girls in out of school activities that have practical and economic value for the family.
Given these competing demands for girls’ time, it is further hypothesized that gender
differences will be the highest for girls for whom time demands are the greatest, which
would include girls from rural environments, girls with a larger number of younger
siblings, and girls from families with lower incomes. These hypotheses lead to the
following research questions to be explored. First, how is educational inequality
influenced by social context, and are gender differences in educational outcomes affected
by family size, income, and level of urbanization? Second, how is access to school
resources (e.g. type of school attended and educational expenditure) and the time devoted
to formal learning activities (e.g. homework completion and school attendance)
associated with learning outcomes? Finally, to what extent are family aspirations for
girls’ learning responsible for differences in the development of reading and mathematics
skills? Since gender roles emerge from interdependent social influences, including the
roles played by both parents and schools (Bussey and Bandura 1999), this analysis will
investigate the unique contribution of each independent variable and explore how
inequality may result from the intersection (or in statistical terms “interaction”) of
multiple categorical dimensions of social influences (Riley and Desai 2007).
DATA AND METHODS
The data used in this analysis is from the 2005 India Human Development Survey
(IHDS), an instrument designed and administered by researchers from the University of
Maryland and the National Council of Applied Economic Research. The purpose of the
survey is to assess the socioeconomic conditions and human development needs of Indian
16
society (Desai, Dubey, Joshi, Sen, Shariff, and Vanneman 2009). The comprehensive
nature of the social, economic, and cultural variables that are measured in the IHDS
provide an excellent opportunity to expand the educational research literature in India by
permitting the investigation of how social and contextual factors influence educational
outcomes based on gender.
The IHDS was administered by trained interviewers to 41,554 households within
1,503 villages, as well as 971 urban neighborhoods located throughout India. The survey
included embedded reading and mathematics assessments that were administered to
household children ages 8-11. Approximately 92% of the children in the dataset were
enrolled in school during the time of the survey. In all, the IHDS dataset includes 17,061
children between the ages of 8-11, 72.4% of whom completed the reading assessment
(12,356) and 72.1% of whom completed the mathematics assessment (12,306). Nearly
equal proportions of boys and girls in the dataset completed the assessments. Children
with missing data on either the reading or mathematics assessments were excluded from
each respective analysis6. Reasons for missing data include lack of consent from parents
and/or agreement to participate by children and lack of time to administer the assessment
after a long household interview (Desai, Dubey, Vanneman, and Banerji 2009). The
sampling design of the IHDS also contains a complex combination of rural and urban
samples. As such, a design weight is included in all analyses (Desai, Dubey, Joshi, Sen,
Shariff, and Vanneman 2009).
Broad administration of reading and mathematics assessments is difficult to
perform in India given the wide disparity of educational attainment among children. To
17
address this concern, survey designers based the reading and mathematics assessments on
those that have been successfully developed and used by Pratham, a non-governmental
organization which conducts the Annual Status of Education Report (ASER) (Pratham
2005). The reading and mathematics assessments in the IHDS were designed to be simple
enough to be administered across a wide range of ability, and the educational assessments
were also translated into twelve languages common among the sampled population in
addition to English. Finally, interviewers were carefully trained by Pratham to administer
the assessments, and were taught to distinguish behaviors such as shyness, which may
affect the ability to complete the academic assessments (Desai, Dubey, Vanneman, and
Banerji 2009).
The dependent variables used in this analysis are literacy and numeracy skill
assessment scores for children ages 8-11 and who are residing throughout India. The
reading assessment score is a five-level ordinal variable which reflects the following
assessment determination made by the interviewer administering the reading test:
0= Cannot read; 1=Recognizes letters; 2= Recognizes words; 3=Can successfully read
and comprehend a paragraph; and 4=Can successfully read and comprehend a story. As
the dependent variable for the second set of analyses, the mathematics assessment score
is a four-level ordinal variable that represents the following assessment determination
made by the interviewer administering the mathematics test: 0=Cannot perform
mathematics; 1=Recognizes numbers; 2=Can perform subtraction problems; and 3=Can
successfully perform division problems. Although both measures are coded as ordinal
variables, they represent latent underlying continuums within each learning domain.
18
Independent variables that are explored in these analyses represent
socioeconomic, time for learning, school resource, and attitudinal factors that may have
an impact on how gender interacts with the development of reading and mathematics
skills. The social background factors that will be examined include: gender, age, number
of younger siblings, level of urbanization7 (Rural, Urban), highest level of household
education for any adult age 21+ in the household (None, 1-4 Years, 5-9 Years, 10-11
Years, 12 Years, Graduate), a household asset index (an SES measure coded as a numeric
index of the number of household possessions held by a family from a standard list), and
caste (High Caste, Dalit, Adivasi, Muslim, Other Backward Classes, Other Religion). The
following independent variables measure time engaged in learning factors: average
number of hours spent on homework and private tutoring in a week, average number of
days absent per month, and highest education level attained by the student. School
resource factors that will be explored include type of school attended (Government,
Private, Other) and per child expenditure on school-related fees (measured continuously).
Finally, an attitudinal measure is included that represents an attribution that an adult
female in the household makes regarding the importance of educating girls relative to
boys (Same, Boys should be more educated, Girls should be more educated), as well as a
variable measuring the distance between home and school (Less than 1 km, 1-2 km, More
than 2 km).
An ordered logit model is used to assess the relationships between gender and
other covariates with the two outcome variables, the reading assessment score and
mathematics assessment score. An ordered logistic regression model can estimate ordinal
19
outcome values along an underlying continuum as a function of each model’s
independent variables in which the latent outcome variables (ranging from -∞ to ∞) are
mapped to observable ordinal outcome variables (Cohen et al. 2003; Long 1997; Winship
and Mare 1984). The model is described by:
= + where = m if m for m = 1 to J
The notation represents cut points or thresholds of moving from one ordinal category
to another (Long 1997).
An important assumption underlying the ordered logit regression model is that of
proportional odds, in which the effect of a covariate on the odds of moving from one
outcome to the next is the same between all possible outcomes. Because this assumption
may be violated in this data, generalized ordered logit models – which allow the coefficients
to vary between outcomes – are also run (Williams 2006).
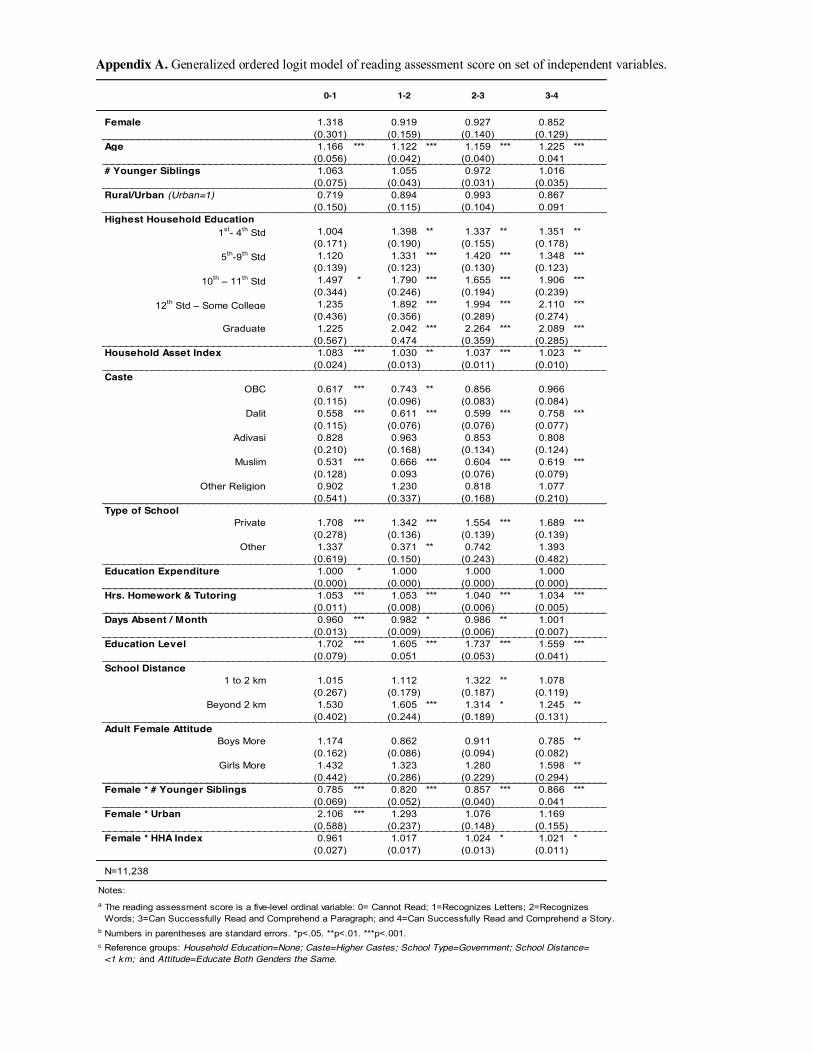
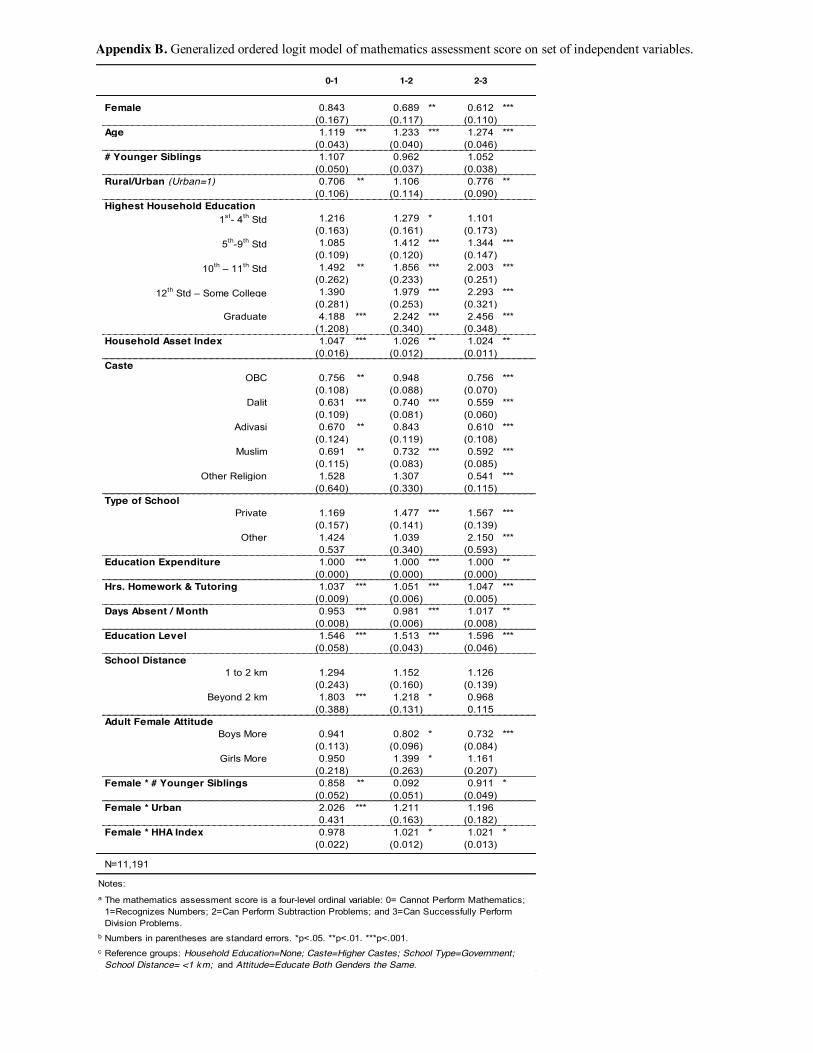
The results of the ordered logistic regression models are presented in full model
form and include the results of tested gender interactions. Models stratified by gender are
also presented to facilitate a comparison of effects for boys and girls. The results from the
generalized ordered logit models, which largely support the findings from the ordered logit
models discussed in the next section, are shown in Appendices A and B.
20
RESULTS
Descriptive statistics
Table 1 displays the mean values (or distributions) by gender for each of the
explanatory variables used in the analysis. Girls and boys are both well-represented in the
survey, with boys representing a slightly higher proportion (53%) of the sample. The
majority of the sample is rural, and the children are predominantly enrolled in government
schools.
Tables 2a and 2b present the distribution of reading and mathematics assessment
scores broken down by age and gender and display the percentage of each group attaining
a given score category. A Wilcoxon non-parametric test was also performed on these
results and shows that boys outperform girls at every age except age 9 in reading and at
every age in mathematics.
(TABLES 1, 2A & 2B ABOUT HERE)
Regression results for reading assessment scores
Table 3 shows odds ratios and gender interactions from the ordered logit models
for the reading assessment score, with models stratified by gender shown in Table 4.
(TABLES 3 AND 4 ABOUT HERE)
21
In reviewing the results related to social background, the reading assessment
model shows a positive association between level of household education and reading
skills with increasingly larger odds ratios as household education level increases. The full
model also shows a strong negative association of lower caste background and reading
scores for Dalit and Muslim children. Indeed, both Dalit and Muslim children are
approximately a third less likely than those from higher castes of moving from one
reading assessment category to the next highest level. In addition, level of urbanization
does not appear to have a significant association with reading attainment.
In measuring access to high-quality resources and its impact on reading skill
differences, there is a strong positive relation between private school attendance and
reading skills. Children attending private school are approximately 60% more likely to be
in a higher reading assessment category than are their government-schooled peers.
However, educational expenditure appears to exhibit little relation with reading score net
of the effect of other factors included in the model.
In terms of time available for learning activities, the number of hours per week
devoted to both private tuitions and homework appears to have a small positive
association with reading score. In addition, the number of days absent per month does not
bear a statistically significant relationship. Not surprisingly, education level attained by
the child has a strong positive relation with reading score.
The next set of reading results relate to the extent that family aspirations for girls’
learning and school distances are responsible for differences in the development of
reading skills. The full model shows a strong positive association between prioritizing
22
girls’ education and reading skill development. Children who have an adult female in the
household agreeing that girls should be educated more are approximately 45% more
likely to be in a higher reading assessment category than are children with an adult
female who does not hold this belief. Lastly, there is an unexpected finding in that boys
and girls who live more than 2 km from school have a 33% increased likelihood of being
in a higher assessment category.
While the coefficient for gender is not significant, several interesting gender
interactions are found and reported with the full model of reading assessment score on the
set of independent variables. There is a highly significant interaction between being
female and number of younger siblings. With each additional younger sibling, girls are
less likely than boys to move from one reading assessment category to the next. There is
also a significant gender interaction with the household asset index variable, suggesting
that an increased level of household assets benefits the reading scores of girls to a greater
extent than boys.
Regression results for mathematics assessment scores
A similar set of analyses were conducted using mathematics assessment score as
the dependent variable. Table 5 displays the results from the full model and associated
gender interactions, and Table 6 shows the gender-stratified models.
(TABLE 5 & 6 ABOUT HERE)
23
The significant full model odds ratio for being female is 0.682 (p<0.05), which
translates to girls being 32% less likely than boys of moving from one mathematics
assessment category to the next. There is again a significant negative interaction between
gender and the number of younger siblings; with each additional younger sibling, girls
are less likely than boys to move from one mathematics assessment category to the next.
Unlike the results for reading, the mathematics assessment results show a positive
interaction between gender and urban status with urban girls more likely to be in a higher
assessment category than their male peers. Although the gender-stratified models reveal
that urban girls are not significantly more likely to move to a higher mathematics
category than are rural girls, urban boys are significantly less likely to do so than are rural
boys. Household education again exhibits a pattern of increasingly larger odds ratios for
higher levels of household education. Lastly, the full model for mathematics confirms a
negative association between lower caste background and mathematics score, as well as a
small positive association between household assets and mathematics score.
In terms of educational resources, the full model yields a similarly strong positive
association between private school attendance and mathematics skill attainment, with
both boys and girls benefiting from private school attendance. As with reading, time
devoted to private tutoring and homework appears to have a small positive association
with mathematics score. However, unlike reading, the full model for mathematics
generates a statistically significant, small negative relation between number of absences
per month and mathematics score. Education expenditure again appears to have no
discernible impact.
24
Finally, the association of gender attitudes on mathematics skill development is
similar to that found for reading. However, in this model there is a statistically significant
negative association between mathematics assessment score for all students and the
presence of an adult female in the household who agrees that boys should be educated
more.
DISCUSSION
The results of this analysis reveal that in 2005, 8-11 year-old Indian girls were
underperforming boys on tests of reading and mathematics achievement. The results also
reiterate findings from the Indian educational literature that show persistent learning gaps
operating along social background lines despite improvements in educational access.
The descriptive statistics and ordered logit regressions performed in this study
also offer insight into the factors historically linked to gender inequality in education and
provide evidence to address the research questions that have motivated this study.
First, it does appear that the development of reading and mathematics skills is influenced
by social context, and that gender differences are more pronounced for girls burdened
with increased time demands outside of school. Girls with a larger number of younger
siblings are less likely to advance to higher levels of reading and mathematics than boys
from similarly sized families. As family size grows, many girls may be disproportionately
spending time caring for their younger siblings at the expense of their academic learning.
In addition, the interaction related to household assets (for reading) points to this variable
serving as a factor that may encourage girls’ achievement, since those from more
resourced homes have an elevated chance of being in a higher reading assessment
25
category than their male peers. Finally, the set of interaction results related to gender and
urban status provide less insight than desired. While a significant gender interaction
indicates that urban status increases the likelihood of girls advancing in mathematics
relative to boys, the results do not provide clear evidence regarding the association of
level of urbanization on girls’ achievement overall. In fact, urban boys are found to be
faltering compared to their rural counterparts in mathematics and may be a population of
special concern for further research.
This analysis provides mixed results regarding the roles of high quality school
resources and time devoted to formal learning activities. The findings strongly indicate
that students who attend private schools are scoring higher in reading and mathematics.
However surprisingly, the level of educational expenditure does not appear to exhibit any
discernable relation once other variables are controlled for in the models. In addition,
time devoted to homework and private tuitions has modest positive associations with both
reading and mathematics scores, while the number of school absences has a small
negative association with mathematics only.
The last set of results address the role of family attitudes and aspirations in
promoting achievement, and in particular, whether pro-female attitudes may be beneficial
for the educational development of girls. For the ordered logit models focused on
reading, there is a strong positive association between an adult female prioritizing girls’
learning and reading skill development overall, although this outcome appears to be most
consequential for girls. There is also a negative association between mathematics score
26
and having an adult female in the household agreeing that boys should be educated more,
revealing that such an attitude depresses mathematics skill development for both genders.
In summary, this analysis adds further evidence that gender inequality persists in
the development of reading and mathematics skills for 8-11 year-old children in
India. The research findings confirm that gender gaps remain for girls with many younger
siblings who are faring worse academically than similarly situated boys. In addition, the
results show that household asset level is associated with girls advancing in reading, and
that having a positive attitude towards girls’ education may be an important contributor to
learning outcomes, especially for the reading achievement of girls. Unfortunately, the
results related to rural residence have yielded less understanding than desired for this
hypothesized factor.
Future investigations may build upon these findings and further explore the
effect of socioeconomic, cultural, and other schooling factors on girls’ academic
achievement in India. This analysis may also serve as an important baseline for future
comparative studies using second-wave IHDS data that is in the final stages of being
released. Given the confirmation of persistent gender gaps for certain populations of girls,
the results may also be useful to policymakers in developing targeted policies to address
gender inequality where it still remains, particularly in support of lower income girls and
those with many younger siblings. Finally, this study has revealed the importance of
attitudes that prioritize girls’ education, and the positive consequence that these may have
for learning.
27
NOTES 1 Literacy rates for 1951 represent aged 5 and above; rates for 2001 and 2011 represent
population aged 7 and above.
2 Although India does not participate in the PISA or PIRLS international comparative
assessments in reading, girls outscore boys in every participating country in both studies.
3 However, other scholars have found that the benefit of private school attendance may
disappear when using propensity score matching techniques to improve the
representativeness of data samples (Chudgar and Quin, 2012).
4 Source: UNESCO 2011 EFA Global Monitoring Report. The Gender Parity Index (GPI)
for the Gross Intake Rate (GIR) in Primary Education improved from .86 (females/males)
in 1999 to .94 in 2007. The Gender Parity Index (GPI) for Gross Enrollment Ratio (GER)
in Primary Education improved from .84 in 1999 to .97 in 2007. The GER in Primary
Education in 2007 is 111% girls and 115% boys. (GER figures can include grade
repeaters as well as early/late entrants.)
5 Gross Enrollment Ratio (GER) in Secondary Education data used. The Gender Parity
Index (GPI) for Gross Enrollment Ratio (GER) in Secondary Education improved from
.70 (females/males) in 1999 to .86 in 2007.
6 There is potential concern that children not attending school (and who may have thus
scored the lowest on these assessments) may be disproportionately missing from the data.
An earlier analysis of this data performed by Desai, Dubey, Vanneman, and Banerji
(2009) determined that children not enrolled in school had the lowest proportion
completing the reading and mathematics assessments. These authors did not otherwise
28
find large differences in test completion between children of different background
characteristics including gender.
7 The India Human Development Survey uses the 2001 Census of India designation to
determine rural or urban status. “The unit of classification in this regard is 'town' for
urban areas and 'village' for rural areas. In the Census of India 2001, the definition of
urban area adopted is as follows: (a) All statutory places with a municipality, corporation,
cantonment board or notified town area committee, etc. (b) A place satisfying the
following three criteria simultaneously: i) a minimum population of 5,000; ii) at least 75
per cent of male working population engaged in non-agricultural pursuits; and iii) a
density of population of at least 400 per sq. km. (1,000 per sq. mile).” Accessed at:
http://censusindia.gov.in/Metadata/Metada.htm#2b .
REFERENCES Azam, Mehtabul and Geeta Kingdon. 2011. Are girls the fairer sex in India? Revisiting
intra-household allocation of education expenditure. Discussion Paper 5706,
IZA.
Bandura, Albert, Claudio Barbaranelli, Gian Vittorio Caprara, and Concetta Pastorelli.
1996. “Multifaceted impact of self-efficacy beliefs on academic functioning.”
Child Development 67: 1206-1222.
Banerjee, Abhijit.V., Shawn Cole, Esther Duflo, and Leigh Linden. (2007). “Remedying
Education: Evidence from Two Randomized Experiments in India.” Quarterly
Journal of Economics 122:1235-1264.
Basu, Alaka M. 1996. “Girls’ schooling, autonomy, and fertility change: What do these
words mean in South Asia?” Pp. 48-71 in Girls’ Schooling, Women’s Autonomy,
and Fertility Change in South Asia, edited by R. Jeffery and A.M. Basu. New
Delhi: Sage Publications.
Behrman, Jere R., Andrew D. Foster, Mark R. Rosenzweig, and Prem Vashishtha. 1999.
“Women’s schooling, home teaching, and economic growth.” Journal of Political
Economy 107: 682-714.
Bussey, Kay & Albert Bandura. 1999. “Social cognitive theory of gender development
and differentiation.” Psychological Review 106:676-713.
Chudgar, A. and Elizabeth Quin. 2012. “Relationship between private schooling and
achievement: Results from rural and urban India.” Economics of Education
Review 31: 376-390.
Cohen, Jacob, Patricia Cohen, Stephen G. West, and Leona S. Aiken. 2003. Applied
multiple regression/correlation analysis for the behavioral sciences, third edition.
Mahwah, NJ: Lawrence Erlbaum Associates.
Coleman, James S., Ernest Q. Campbell, Carol J. Hobson, James McPartland, Alexander
M. Mood, Frederic D. Weinfeld, and Robert L. York. 1966. Equality of
Educational Opportunity. Washington DC: Department of Health, Education, and
Welfare.
Desai, Sonalde, Amaresh Dubey, Brijlal Joshi, Mitali Sen, Abusaleh Shariff, and Reeve
D. Vanneman. 2010. Human Development in India: Challenges for a Society in
Transition. New York: Oxford University Press.
Desai, Sonalde, Amaresh Dubey, Brijlal Joshi, Mitali Sen, Abusaleh Shariff, and Reeve
D. Vanneman. 2009. India Human Development Survey (IHDS) [Computer file].
ICPSR22626-v2. University of Maryland and National Council of Applied
Economic Research, New Delhi [producers], 2007. Ann Arbor, MI: Inter-
university Consortium for Political and Social Research [distributor], 30 June
2009. Retrieved at http://ihds.umd.edu/survey.html.
Desai, Sonalde, Amaresh Dubey, Reeve Vanneman, & Rukmini Banerji. 2009. “Private
schooling in India: A new educational landscape.” Pp. 1-58 in India Policy Forum
Volume 5, edited by S. Bery, B. Bosworth, and A. Panagariya. New Delhi: Sage.
Duncan, Greg and Richard Murnane, eds. 2011. Whither opportunity? Rising inequality,
schools, and children’s life chances. New York: Russell Sage Foundation.
Eccles, Jacquelynne. 2005. “Subjective task value and the Eccles et al. model of
achievement-related choices.” Pp. 105-21I in Handbook of competence and
motivation, edited by A.J. Elliot & C.S. Dweck. New York: Guilford Press.
Gamoran, Adam and Daniel A. Long. 2006. “Equality of Educational Opportunity: A 40-
year Retrospective .” WCER Working Paper No. 2006-9. Madison, WI:
University of Wisconsin-Madison, Wisconsin Center for Education Research.
Retrieved at
http://www.wcer.wisc.edu/publications/workingpapers/Working_Paper_No_2006
_09.php.
Government of India (GOI). 2000. Education for all: The year 2000 assessment report:
India. New Delhi: Ministry of Human Resource Development, Government of
India. Retrieved at http://www.unesco.org/education/wef/countryreports/
india/contents.html.
------. 2011. Census of India. New Delhi: Ministry of Home Affairs, Office of the
Registrar General & Census Commissioner, India. Retrieved at
http://censusindia.gov.in/.
Govinda, R. 2002. “Providing education for all in India.” Pp. 1-20 in India Education
Report, edited by R. Govinda. New Delhi: National Institute of Educational
Planning and Administration and Oxford University Press.
Greenwald, Rob, Larry V. Hedges, and Richard D. Laine. 1996. “The effect of school
resources on student achievement.” Review of Educational Research 66: 361-396.
Hanushek, Eric A. 1989. The impact of differential expenditures on school performance.
Educational Researcher 18: 45-65.
Hanushek, Eric A. 1995. “Interpreting recent research on schooling in developing
countries.” World Bank Research Observer 10: 227-247.
Hanushek, Eric A. 1997. “Assessing the Effects of School Resources on Student
Performance: An Update.” Educational Evaluation and Policy Analysis 19: 141-
161.
Hedges, Larry V., Richard D. Laine, and Rob Greenwald. 1994. “An exchange: Part I:
Does money matter? A meta-analysis of studies of the effects of differential
school inputs on student outcomes.” Educational Researcher 23: 5-14.
Heyneman, Stephen P. and William A. Loxley. 1983. “The Effect of Primary-School
Quality on Academic Achievement Across Twenty-nine High- and Low-Income
Countries.” The American Journal of Sociology 88: 1162-1194.
Jeffery, Roger and Alaka M. Basu. 1996. Schooling as contraception? Pp. 15-47 in Girls’
Schooling, Women’s Autonomy, and Fertility Change in South Asia, edited by R.
Jeffery and A.M. Basu. New Delhi: Sage Publications.
Kaul, Venita. 2002. “Early Childhood Care and Education.” Pp. 23-34 in India
Education Report, edited by R. Govinda. New Delhi: National Institute of
Educational Planning and Administration and Oxford University Press.
Kingdon, Geeta G. 2005. “Where has all the bias gone? Detecting gender bias in the
intrahousehold allocation of educational expenditure.” Economic Development
and Cultural Change 53:409-52.
Kingdon, Geeta G. 2007. “The progress of school education in India.” Oxford Review of
Economic Policy 23:168-195.
Long, J.Scott. 1997. Regression models for categorical and limited dependent variables.
Thousand Oaks, CA: SAGE Publications.
Lynn, Richard. & Jaan Mikk. 2009. “Sex differences in reading achievement.” Trames-
Journal of the humanities and the social sciences 13:3-13.
Marks, Gary N. 2008. Accounting for the gender gaps in student performance in reading
and mathematics: evidence from 31 countries. Oxford Review of Education 34:
89-109.
Meyer, John W., Francisco O. Ramirez, & Yasemin N. Soysal. 1992. “World expansion
of mass education, 1870-1980.” Sociology of Education 65:128-149.
Motiram, Sripad and Lars Osberg. 2010. “Gender inequalities in tasks and instruction
opportunities within Indian families.” Feminist Economics 16:141-167.
Nayar, Usha. 2002. “Education of girls in India: An assessment.” Pp. 35-46 in India
Education Report, edited by R. Govinda. New Delhi: National Institute of
Educational Planning and Administration and Oxford University Press.
Organization for Economic Cooperation and Development (OECD). 2010. PISA 2009
Results: What Students Know and Can Do: Student Performance in Reading,
Mathematics and Science (Volume I). Retrieved at:
http://www.oecd.org/document/53/0,3746,en_32252351_46584327_46584821_1_
1_1_1,00.html .
Pratham. 2005. Annual Status of Education Report. New Delhi: Pratham Documentation
Center. Pratham.
Probe Team. 1999. Public report on basic education in India. New Delhi: Oxford
University Press.
Rampal, Anita. 2002. “Texts in context: Development of curricula, textbooks, and
teaching learning materials.” Pp. 153-166 in India Education Report, edited by R.
Govinda. New Delhi: National Institute of Educational Planning and
Administration and Oxford University Press.
Rao, Nirmala, Kai-Ming Cheng, and Kirti Narain. 2003. “Primary schooling in China and
India: Understanding how socio-contextual factors moderate the role of the state.”
International Review of Education 49:153-176.
Reardon, Sean. 2011. “The Widening Academic Achievement Gap Between the Rich and
the Poor: New Evidence and Possible Explanations.” Pp 91-116 in Whither
Opportunity? Rising Inequality, Schools, and Children’s Life Chances, edited by
Greg Duncan and Richard Murnane. New York: Russell Sage.
Riley, Nancy E., & Sonalde Desai. 2007. “The numbers question in feminism: Bridging
the disciplinary divide.” Paper presented at the 2007 Annual Meeting of the
Population Association of America.
Sundaram, Aparna and Reeve Vanneman. 2008. “Gender differentials in literacy in India:
The intriguing relationship with women’s labor force participation.” World
Development 36:128-143.
Steele, Claude M. 1997. “A threat in the air: How stereotypes shape intellectual identity
and performance.” American Psychologist 52:613-629.
United Nations. 2010. We Can End Poverty 2015. Millennium Development Goals.
Retrieved at http://www.un.org/millenniumgoals/.
United Nations Educational, Scientific, and Cultural Organization (UNESCO). 2011.
EFA Global Monitoring Report. Retrieved at
http://www.unesco.org/new/en/education/themes/leading-the-international-
agenda/efareport/.
United States Census Bureau. 2014. International Data Base. Retrieved at
http://www.census.gov/population/international/data/.
United States Department of Education Institute of Education Sciences. 2007. Progress
in International Reading Literacy Study. National Center for Education Statistics.
Retrieved at http://nces.ed.gov/surveys/pirls/pirls2006.asp.
Weiner, Bernard. 1985. “An attributional theory of achievement motivation and
emotion.” Psychological Review 92:548-573.
Williams, Richard. 2006. “Generalized ordered logit/partial proportional odds models for
ordinal dependent variables.” The Stata Journal 6(1):58-82.
Winship, Christopher and Robert D. Mare. 1984. Regression models with ordinal
variables. American Sociological Review 49:512-525.
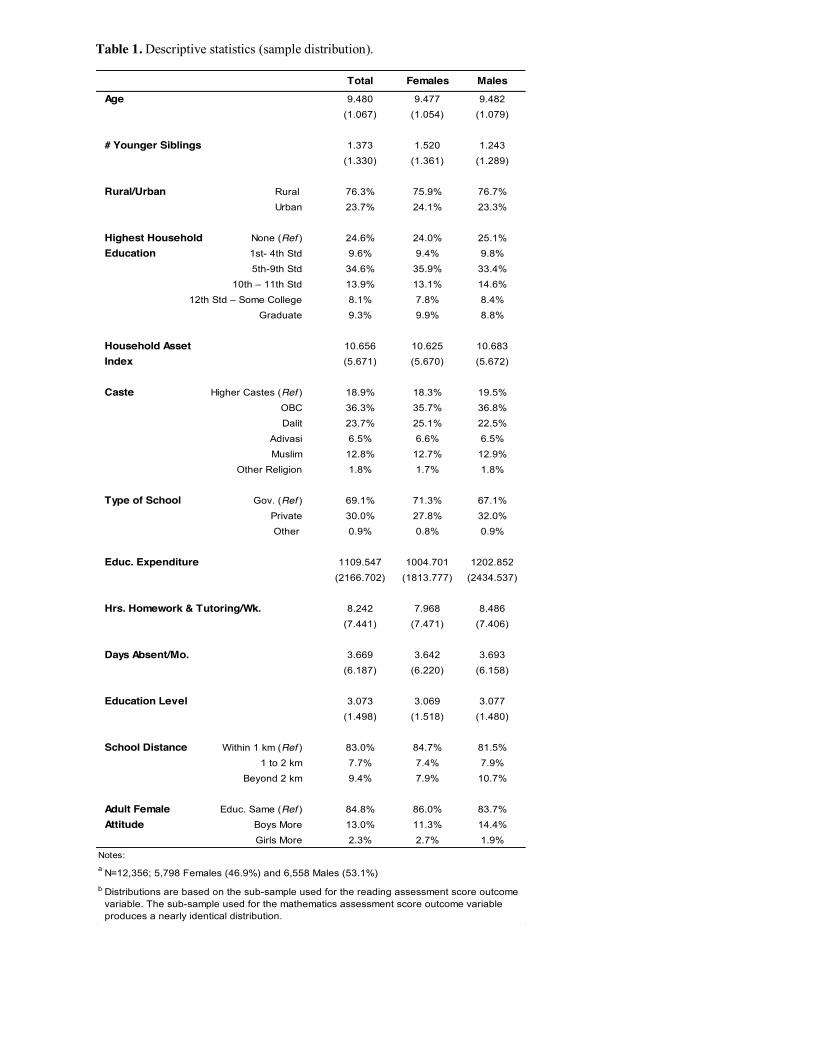
Table 1. Descriptive statistics (sample distribution).
Total Females Males
Age 9.480 9.477 9.482(1.067) (1.054) (1.079)
# Younger Siblings 1.373 1.520 1.243(1.330) (1.361) (1.289)
Rural/Urban Rural 76.3% 75.9% 76.7%Urban 23.7% 24.1% 23.3%
Highest Household None (Ref ) 24.6% 24.0% 25.1%Education 1st- 4th Std 9.6% 9.4% 9.8%
5th-9th Std 34.6% 35.9% 33.4%10th – 11th Std 13.9% 13.1% 14.6%
8.1% 7.8% 8.4%Graduate 9.3% 9.9% 8.8%
Household Asset 10.656 10.625 10.683Index (5.671) (5.670) (5.672)
Caste Higher Castes (Ref ) 18.9% 18.3% 19.5%OBC 36.3% 35.7% 36.8%Dalit 23.7% 25.1% 22.5%
Adivasi 6.5% 6.6% 6.5%Muslim 12.8% 12.7% 12.9%
Other Religion 1.8% 1.7% 1.8%
Type of School Gov. (Ref ) 69.1% 71.3% 67.1%Private 30.0% 27.8% 32.0%Other 0.9% 0.8% 0.9%
Educ. Expenditure 1109.547 1004.701 1202.852(2166.702) (1813.777) (2434.537)
Hrs. Homework & Tutoring/Wk. 8.242 7.968 8.486(7.441) (7.471) (7.406)
Days Absent/Mo. 3.669 3.642 3.693(6.187) (6.220) (6.158)
Education Level 3.073 3.069 3.077(1.498) (1.518) (1.480)
School Distance Within 1 km (Ref ) 83.0% 84.7% 81.5%1 to 2 km 7.7% 7.4% 7.9%
Beyond 2 km 9.4% 7.9% 10.7%
Adult Female Educ. Same (Ref ) 84.8% 86.0% 83.7%Attitude Boys More 13.0% 11.3% 14.4%
Girls More 2.3% 2.7% 1.9%
a
b Distributions are based on the sub-sample used for the reading assessment score outcome variable. The sub-sample used for the mathematics assessment score outcome variable produces a nearly identical distribution.
N=12,356; 5,798 Females (46.9%) and 6,558 Males (53.1%)
12th Std – Some College
Notes:
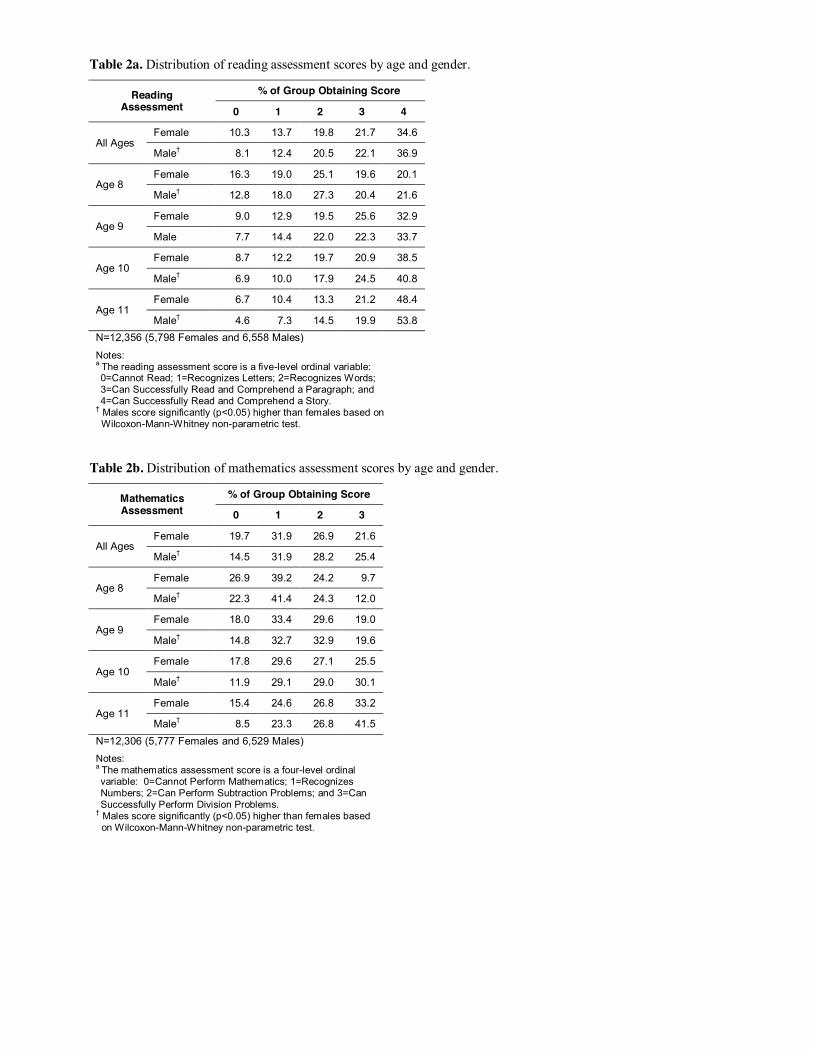
Table 2a. Distribution of reading assessment scores by age and gender.
Reading Assessment
% of Group Obtaining Score
0 1 2 3 4
All Ages Female 10.3 13.7 19.8 21.7 34.6
Male† 8.1 12.4 20.5 22.1 36.9
Age 8 Female 16.3 19.0 25.1 19.6 20.1
Male† 12.8 18.0 27.3 20.4 21.6
Age 9 Female 9.0 12.9 19.5 25.6 32.9
Male 7.7 14.4 22.0 22.3 33.7
Age 10 Female 8.7 12.2 19.7 20.9 38.5
Male† 6.9 10.0 17.9 24.5 40.8
Age 11 Female 6.7 10.4 13.3 21.2 48.4
Male† 4.6 7.3 14.5 19.9 53.8 N=12,356 (5,798 Females and 6,558 Males)
Notes: a The reading assessment score is a five-level ordinal variable: 0=Cannot Read; 1=Recognizes Letters; 2=Recognizes Words; 3=Can Successfully Read and Comprehend a Paragraph; and 4=Can Successfully Read and Comprehend a Story.
† Males score significantly (p<0.05) higher than females based on Wilcoxon-Mann-Whitney non-parametric test.
Table 2b. Distribution of mathematics assessment scores by age and gender.
Mathematics Assessment
% of Group Obtaining Score
0 1 2 3
All Ages Female 19.7 31.9 26.9 21.6
Male† 14.5 31.9 28.2 25.4
Age 8 Female 26.9 39.2 24.2 9.7
Male† 22.3 41.4 24.3 12.0
Age 9 Female 18.0 33.4 29.6 19.0
Male† 14.8 32.7 32.9 19.6
Age 10 Female 17.8 29.6 27.1 25.5
Male† 11.9 29.1 29.0 30.1
Age 11 Female 15.4 24.6 26.8 33.2
Male† 8.5 23.3 26.8 41.5 N=12,306 (5,777 Females and 6,529 Males)
Notes: a The mathematics assessment score is a four-level ordinal variable: 0=Cannot Perform Mathematics; 1=Recognizes Numbers; 2=Can Perform Subtraction Problems; and 3=Can Successfully Perform Division Problems.
† Males score significantly (p<0.05) higher than females based on Wilcoxon-Mann-Whitney non-parametric test.
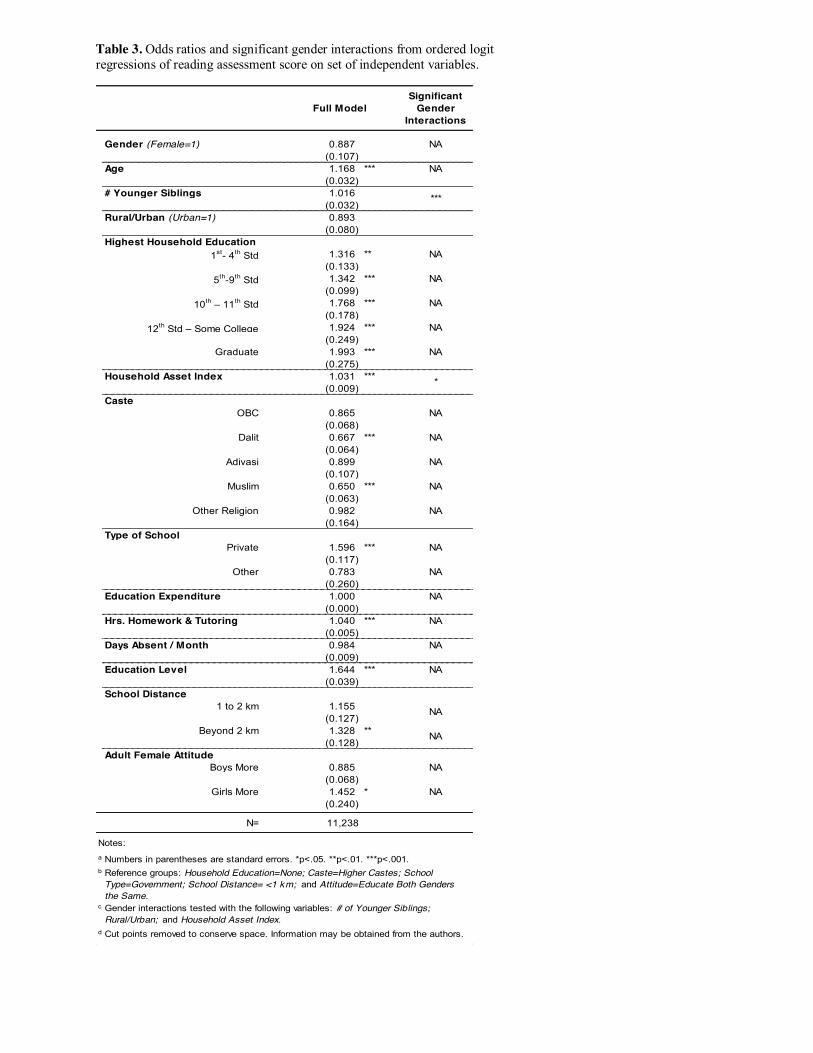
Table 3. Odds ratios and significant gender interactions from ordered logit regressions of reading assessment score on set of independent variables.
Full Model Significant
Gender Interactions
Gender (Female=1) 0.887 NA(0.107)
Age 1.168 *** NA(0.032)
# Younger Siblings 1.016(0.032)
Rural/Urban (Urban=1) 0.893(0.080)
Highest Household Education 1st- 4th Std 1.316 ** NA
(0.133)5th-9th Std 1.342 *** NA
(0.099)10th – 11th Std 1.768 *** NA
(0.178)12th Std – Some College 1.924 *** NA
(0.249)Graduate 1.993 *** NA
(0.275)Household Asset Index 1.031 ***
(0.009)Caste
OBC 0.865 NA(0.068)
Dalit 0.667 *** NA(0.064)
Adivasi 0.899 NA(0.107)
Muslim 0.650 *** NA(0.063)
Other Religion 0.982 NA(0.164)
Type of SchoolPrivate 1.596 *** NA
(0.117)Other 0.783 NA
(0.260)Education Expenditure 1.000 NA
(0.000)1.040 *** NA
(0.005)Days Absent / Month 0.984 NA
(0.009)Education Level 1.644 *** NA
(0.039)School Distance
1 to 2 km 1.155(0.127)
Beyond 2 km 1.328 **(0.128)
Boys More 0.885 NA(0.068)
Girls More 1.452 * NA(0.240)
N= 11,238
a Numbers in parentheses are standard errors. *p<.05. **p<.01. ***p<.001. b
c
d Cut points removed to conserve space. Information may be obtained from the authors.
Reference groups: Household Education=None; Caste=Higher Castes; School Type=Government; School Distance= <1 km; and Attitude=Educate Both Genders the Same.
Adult Female Attitude
Notes:
***
*
Hrs. Homework & Tutoring
NA
NA
Gender interactions tested with the following variables: # of Younger Siblings; Rural/Urban; and Household Asset Index.
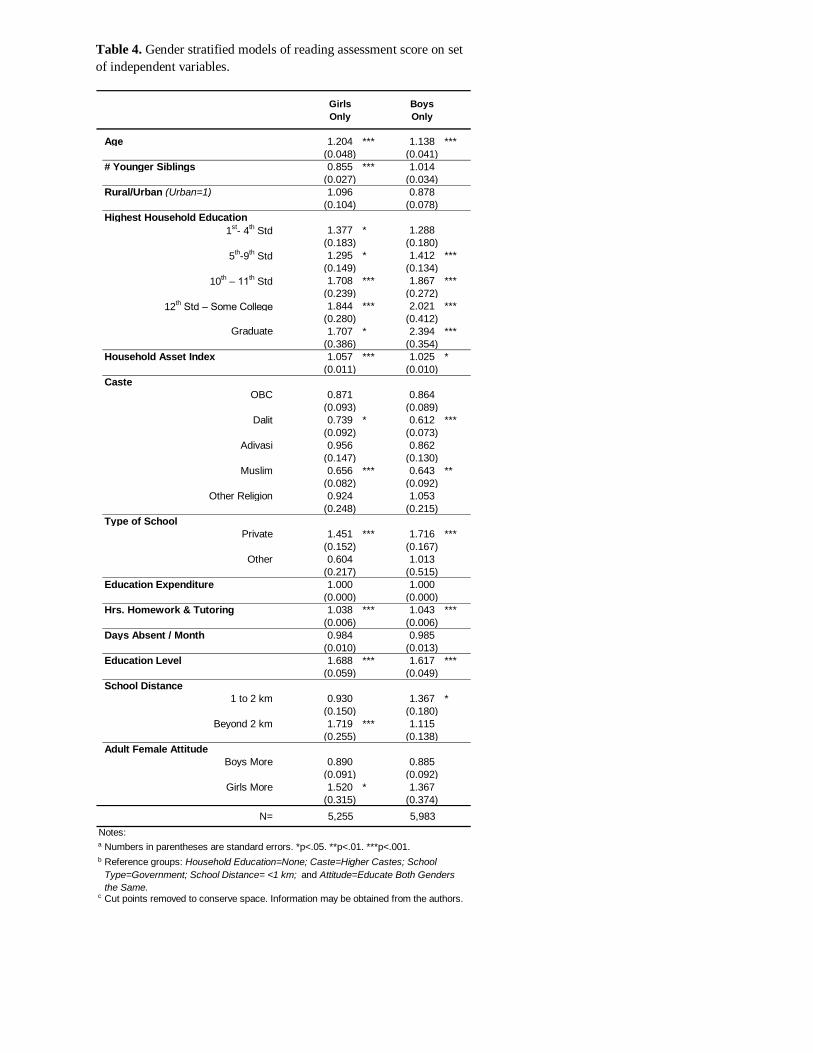
Table 4. Gender stratified models of reading assessment score on set
of independent variables.
Girls
Only
Boys
Only
Age 1.204 *** 1.138 ***
(0.048) (0.041)
# Younger Siblings 0.855 *** 1.014
(0.027) (0.034)
Rural/Urban (Urban=1) 1.096 0.878
(0.104) (0.078)
Highest Household Education
1st- 4
th Std 1.377 * 1.288
(0.183) (0.180)
5th-9
th Std 1.295 * 1.412 ***
(0.149) (0.134)
10th – 11
th Std 1.708 *** 1.867 ***
(0.239) (0.272)
12th Std – Some College 1.844 *** 2.021 ***
(0.280) (0.412)
Graduate 1.707 * 2.394 ***
(0.386) (0.354)
Household Asset Index 1.057 *** 1.025 *
(0.011) (0.010)
Caste
OBC 0.871 0.864
(0.093) (0.089)
Dalit 0.739 * 0.612 ***
(0.092) (0.073)
Adivasi 0.956 0.862
(0.147) (0.130)
Muslim 0.656 *** 0.643 **
(0.082) (0.092)
Other Religion 0.924 1.053
(0.248) (0.215)
Type of School
Private 1.451 *** 1.716 ***
(0.152) (0.167)
Other 0.604 1.013
(0.217) (0.515)
Education Expenditure 1.000 1.000
(0.000) (0.000)
1.038 *** 1.043 ***
(0.006) (0.006)
Days Absent / Month 0.984 0.985
(0.010) (0.013)
Education Level 1.688 *** 1.617 ***
(0.059) (0.049)
School Distance
1 to 2 km 0.930 1.367 *
(0.150) (0.180)
Beyond 2 km 1.719 *** 1.115
(0.255) (0.138)
Adult Female Attitude
Boys More 0.890 0.885
(0.091) (0.092)
Girls More 1.520 * 1.367
(0.315) (0.374)
N= 5,255 5,983
a
b
c Cut points removed to conserve space. Information may be obtained from the authors.
Notes:
Hrs. Homework & Tutoring
Numbers in parentheses are standard errors. *p<.05. **p<.01. ***p<.001.
Reference groups: Household Education=None; Caste=Higher Castes; School
Type=Government; School Distance= <1 km; and Attitude=Educate Both Genders
the Same.
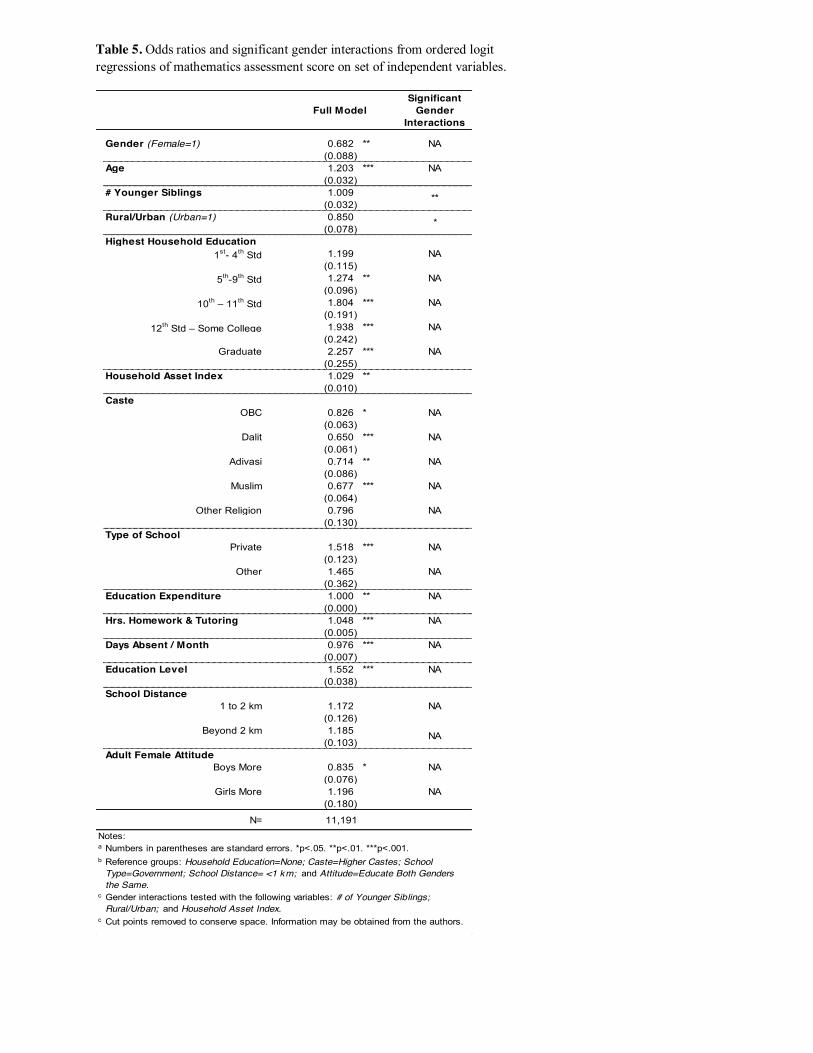
Table 5. Odds ratios and significant gender interactions from ordered logit regressions of mathematics assessment score on set of independent variables.
Full Model Significant
Gender Interactions
Gender (Female=1) 0.682 ** NA(0.088)
Age 1.203 *** NA(0.032)
# Younger Siblings 1.009(0.032)
Rural/Urban (Urban=1) 0.850(0.078)
Highest Household Education 1st- 4th Std 1.199 NA
(0.115)5th-9th Std 1.274 ** NA
(0.096)10th – 11th Std 1.804 *** NA
(0.191)12th Std – Some College 1.938 *** NA
(0.242)Graduate 2.257 *** NA
(0.255)Household Asset Index 1.029 **
(0.010)Caste
OBC 0.826 * NA(0.063)
Dalit 0.650 *** NA(0.061)
Adivasi 0.714 ** NA(0.086)
Muslim 0.677 *** NA(0.064)
Other Religion 0.796 NA(0.130)
Type of SchoolPrivate 1.518 *** NA
(0.123)Other 1.465 NA
(0.362)Education Expenditure 1.000 ** NA
(0.000)1.048 *** NA
(0.005)Days Absent / Month 0.976 *** NA
(0.007)Education Level 1.552 *** NA
(0.038)School Distance
1 to 2 km 1.172 NA(0.126)
Beyond 2 km 1.185(0.103)
Boys More 0.835 * NA(0.076)
Girls More 1.196 NA(0.180)
N= 11,191
a Numbers in parentheses are standard errors. *p<.05. **p<.01. ***p<.001. b
c
c
Notes:
Reference groups: Household Education=None; Caste=Higher Castes; School Type=Government; School Distance= <1 km; and Attitude=Educate Both Genders the Same.
Cut points removed to conserve space. Information may be obtained from the authors.
**
*
Hrs. Homework & Tutoring
NA
Adult Female Attitude
Gender interactions tested with the following variables: # of Younger Siblings; Rural/Urban; and Household Asset Index.
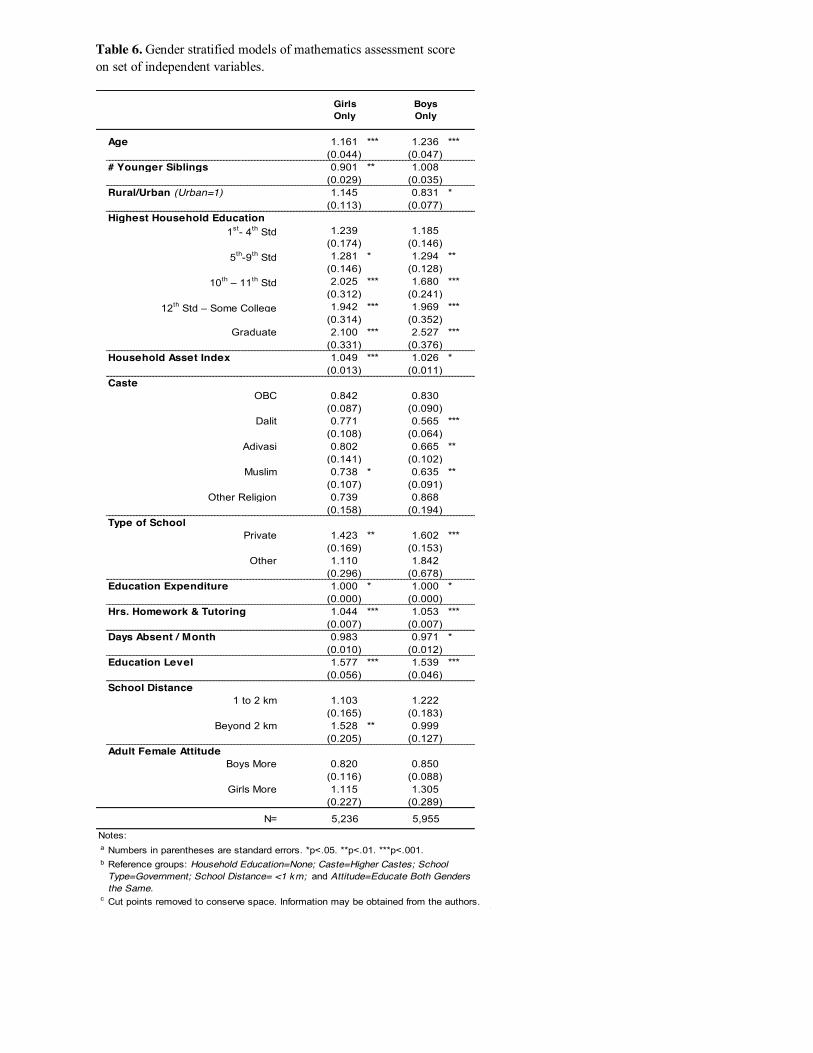
Table 6. Gender stratified models of mathematics assessment score on set of independent variables.
Girls Only
Boys Only
Age 1.161 *** 1.236 ***(0.044) (0.047)
# Younger Siblings 0.901 ** 1.008(0.029) (0.035)
Rural/Urban (Urban=1) 1.145 0.831 *(0.113) (0.077)
Highest Household Education 1st- 4th Std 1.239 1.185
(0.174) (0.146)5th-9th Std 1.281 * 1.294 **
(0.146) (0.128)10th – 11th Std 2.025 *** 1.680 ***
(0.312) (0.241)12th Std – Some College 1.942 *** 1.969 ***
(0.314) (0.352)Graduate 2.100 *** 2.527 ***
(0.331) (0.376)Household Asset Index 1.049 *** 1.026 *
(0.013) (0.011)Caste
OBC 0.842 0.830(0.087) (0.090)
Dalit 0.771 0.565 ***(0.108) (0.064)
Adivasi 0.802 0.665 **(0.141) (0.102)
Muslim 0.738 * 0.635 **(0.107) (0.091)
Other Religion 0.739 0.868(0.158) (0.194)
Type of SchoolPrivate 1.423 ** 1.602 ***
(0.169) (0.153)Other 1.110 1.842
(0.296) (0.678)Education Expenditure 1.000 * 1.000 *
(0.000) (0.000)Hrs. Homework & Tutoring 1.044 *** 1.053 ***
(0.007) (0.007)Days Absent / Month 0.983 0.971 *
(0.010) (0.012)Education Level 1.577 *** 1.539 ***
(0.056) (0.046)School Distance
1 to 2 km 1.103 1.222(0.165) (0.183)
Beyond 2 km 1.528 ** 0.999(0.205) (0.127)
Boys More 0.820 0.850(0.116) (0.088)
Girls More 1.115 1.305(0.227) (0.289)
N= 5,236 5,955
a Numbers in parentheses are standard errors. *p<.05. **p<.01. ***p<.001. b
c
Notes:
Reference groups: Household Education=None; Caste=Higher Castes; School Type=Government; School Distance= <1 km; and Attitude=Educate Both Genders the Same.Cut points removed to conserve space. Information may be obtained from the authors.
Adult Female Attitude
Appendix A. Generalized ordered logit model of reading assessment score on set of independent variables.
0-1 1-2 2-3 3-4
Female 1.318 0.919 0.927 0.852(0.301) (0.159) (0.140) (0.129)
Age 1.166 *** 1.122 *** 1.159 *** 1.225 ***(0.056) (0.042) (0.040) 0.041
# Younger Siblings 1.063 1.055 0.972 1.016(0.075) (0.043) (0.031) (0.035)
Rural/Urban (Urban=1) 0.719 0.894 0.993 0.867(0.150) (0.115) (0.104) 0.091
Highest Household Education 1st- 4th Std 1.004 1.398 ** 1.337 ** 1.351 **
(0.171) (0.190) (0.155) (0.178)5th-9th Std 1.120 1.331 *** 1.420 *** 1.348 ***
(0.139) (0.123) (0.130) (0.123)10th – 11th Std 1.497 * 1.790 *** 1.655 *** 1.906 ***
(0.344) (0.246) (0.194) (0.239)12th Std – Some College 1.235 1.892 *** 1.994 *** 2.110 ***
(0.436) (0.356) (0.289) (0.274)Graduate 1.225 2.042 *** 2.264 *** 2.089 ***
(0.567) 0.474 (0.359) (0.285)Household Asset Index 1.083 *** 1.030 ** 1.037 *** 1.023 **
(0.024) (0.013) (0.011) (0.010)Caste
OBC 0.617 *** 0.743 ** 0.856 0.966(0.115) (0.096) (0.083) (0.084)
Dalit 0.558 *** 0.611 *** 0.599 *** 0.758 ***(0.115) (0.076) (0.076) (0.077)
Adivasi 0.828 0.963 0.853 0.808(0.210) (0.168) (0.134) (0.124)
Muslim 0.531 *** 0.666 *** 0.604 *** 0.619 ***(0.128) 0.093 (0.076) (0.079)
Other Religion 0.902 1.230 0.818 1.077(0.541) (0.337) (0.168) (0.210)
Type of SchoolPrivate 1.708 *** 1.342 *** 1.554 *** 1.689 ***
(0.278) (0.136) (0.139) (0.139)Other 1.337 0.371 ** 0.742 1.393
(0.619) (0.150) (0.243) (0.482)Education Expenditure 1.000 * 1.000 1.000 1.000
(0.000) (0.000) (0.000) (0.000)1.053 *** 1.053 *** 1.040 *** 1.034 ***
(0.011) (0.008) (0.006) (0.005)Days Absent / Month 0.960 *** 0.982 * 0.986 ** 1.001
(0.013) (0.009) (0.006) (0.007)Education Level 1.702 *** 1.605 *** 1.737 *** 1.559 ***
(0.079) 0.051 (0.053) (0.041)School Distance
1 to 2 km 1.015 1.112 1.322 ** 1.078(0.267) (0.179) (0.187) (0.119)
Beyond 2 km 1.530 1.605 *** 1.314 * 1.245 **(0.402) (0.244) (0.189) (0.131)
Adult Female AttitudeBoys More 1.174 0.862 0.911 0.785 **
(0.162) (0.086) (0.094) (0.082)Girls More 1.432 1.323 1.280 1.598 **
(0.442) (0.286) (0.229) (0.294)Female * # Younger Siblings 0.785 *** 0.820 *** 0.857 *** 0.866 ***
(0.069) (0.052) (0.040) 0.041 Female * Urban 2.106 *** 1.293 1.076 1.169
(0.588) (0.237) (0.148) (0.155)Female * HHA Index 0.961 1.017 1.024 * 1.021 *
(0.027) (0.017) (0.013) (0.011)
N=11,238
a
b
c
Hrs. Homework & Tutoring
Notes:
Numbers in parentheses are standard errors. *p<.05. **p<.01. ***p<.001. Reference groups: Household Education=None; Caste=Higher Castes; School Type=Government; School Distance= <1 km; and Attitude=Educate Both Genders the Same.
The reading assessment score is a five-level ordinal variable: 0= Cannot Read; 1=Recognizes Letters; 2=Recognizes Words; 3=Can Successfully Read and Comprehend a Paragraph; and 4=Can Successfully Read and Comprehend a Story.
Appendix B. Generalized ordered logit model of mathematics assessment score on set of independent variables.
0-1 1-2 2-3
Female 0.843 0.689 ** 0.612 ***(0.167) (0.117) (0.110)
Age 1.119 *** 1.233 *** 1.274 ***(0.043) (0.040) (0.046)
# Younger Siblings 1.107 0.962 1.052(0.050) (0.037) (0.038)
Rural/Urban (Urban=1) 0.706 ** 1.106 0.776 **(0.106) (0.114) (0.090)
Highest Household Education 1st- 4th Std 1.216 1.279 * 1.101
(0.163) (0.161) (0.173)5th-9th Std 1.085 1.412 *** 1.344 ***
(0.109) (0.120) (0.147)10th – 11th Std 1.492 ** 1.856 *** 2.003 ***
(0.262) (0.233) (0.251)12th Std – Some College 1.390 1.979 *** 2.293 ***
(0.281) (0.253) (0.321)Graduate 4.188 *** 2.242 *** 2.456 ***
(1.208) (0.340) (0.348)Household Asset Index 1.047 *** 1.026 ** 1.024 **
(0.016) (0.012) (0.011)Caste
OBC 0.756 ** 0.948 0.756 ***(0.108) (0.088) (0.070)
Dalit 0.631 *** 0.740 *** 0.559 ***(0.109) (0.081) (0.060)
Adivasi 0.670 ** 0.843 0.610 ***(0.124) (0.119) (0.108)
Muslim 0.691 ** 0.732 *** 0.592 ***(0.115) (0.083) (0.085)
Other Religion 1.528 1.307 0.541 ***(0.640) (0.330) (0.115)
Type of SchoolPrivate 1.169 1.477 *** 1.567 ***
(0.157) (0.141) (0.139)Other 1.424 1.039 2.150 ***
0.537 (0.340) (0.593)Education Expenditure 1.000 *** 1.000 *** 1.000 **
(0.000) (0.000) (0.000)1.037 *** 1.051 *** 1.047 ***
(0.009) (0.006) (0.005)Days Absent / Month 0.953 *** 0.981 *** 1.017 **
(0.008) (0.006) (0.008)Education Level 1.546 *** 1.513 *** 1.596 ***
(0.058) (0.043) (0.046)School Distance
1 to 2 km 1.294 1.152 1.126(0.243) (0.160) (0.139)
Beyond 2 km 1.803 *** 1.218 * 0.968(0.388) (0.131) 0.115
Adult Female AttitudeBoys More 0.941 0.802 * 0.732 ***
(0.113) (0.096) (0.084)Girls More 0.950 1.399 * 1.161
(0.218) (0.263) (0.207)Female * # Younger Siblings 0.858 ** 0.092 0.911 *
(0.052) (0.051) (0.049)Female * Urban 2.026 *** 1.211 1.196
0.431 (0.163) (0.182)Female * HHA Index 0.978 1.021 * 1.021 *
(0.022) (0.012) (0.013)
N=11,191
a
b
c
Numbers in parentheses are standard errors. *p<.05. **p<.01. ***p<.001.
Reference groups: Household Education=None; Caste=Higher Castes; School Type=Government; School Distance= <1 km; and Attitude=Educate Both Genders the Same.
Hrs. Homework & Tutoring
Notes:
The mathematics assessment score is a four-level ordinal variable: 0= Cannot Perform Mathematics; 1=Recognizes Numbers; 2=Can Perform Subtraction Problems; and 3=Can Successfully Perform Division Problems.