Educational Data Mining and Problem-Based Learning · Educational Data Mining and Problem-Based...
16
Informatics in Education, 2014, Vol. 13, No. 1, 141–156 © 2014 Vilnius University 141 Educational Data Mining and Problem-Based Learning Sari WALLDÉN, Erkki MÄKINEN University of Tampere, School of Information Sciences FIN-33014 Tampere, Finland e-mail: Sari.Wallden@uta.fi, Erkki.Makinen@uta.fi Received: May 2013 Abstract. This paper considers the use of log data provided by learning management systems when studying whether students obey the problem-based learning (PBL) method. Log analysis turns out to be a valuable tool in measuring the use of the learning material of interest. It gives reliable figures concerning not only the number of use sessions but also the interlocking of various course activities. The longitudinal study based on log analysis makes use of a new software tool, SPY US. Our study concentrates on using log data analysis in improving the PBL method used in learning diagnostic skills with the help of Virtual Patients. Keywords: learning management system, problem-based learning, educational data mining. 1. Introduction Problem-based learning (PBL) is a widely used method in medical education. PBL is a student-centered pedagogy in which students learn both thinking strategies and domain knowledge through problem solving. It starts with a problem and uses a cyclic process acquiring and processing information, and in order to reach the learning outcomes, it is important that students obey the fixed process. (Albanese, 2010; Hmelo-Silver, 2004). Typically, university courses use software tools called learning management systems (LMSs) – also known as course management systems – for various practical purposes. LMSs offer a great variety of functions to collect data about students and their activities in a course (Romero et al., 2008). They can record student activities including reading, writing, taking tests, performing tasks, and communicating with peers (Mostow et al., 2005). The line of research making use of the recorded data of LMSs is called educa- tional data mining (Romero et al., 2008). The definition and methods of educational data mining are further considered, e.g., by Baker and Yacef (2009), Romero and Ventura (2010), and Lile (2011). We follow the four step process of educational data mining proposed by Romero et al. (2008): collecting data, pre-processing data, applying data mining methods, and interpreting, evaluating and deploying the results. The stakehold-
-
Upload
truonglien -
Category
Documents
-
view
213 -
download
0
Transcript of Educational Data Mining and Problem-Based Learning · Educational Data Mining and Problem-Based...
Informatics in Education, 2014, Vol. 13, No. 1, 141–156© 2014 Vilnius University
141
Educational Data Mining and Problem-Based Learning
Sari WALLDÉN, Erkki MÄKINENUniversity of Tampere, School of Information SciencesFIN-33014 Tampere, Finlande-mail: [email protected], [email protected]
Received: May 2013
Abstract. This paper considers the use of log data provided by learning management systems when studying whether students obey the problem-based learning (PBL) method. Log analysis turns out to be a valuable tool in measuring the use of the learning material of interest. It gives reliable figures concerning not only the number of use sessions but also the interlocking of various course activities. The longitudinal study based on log analysis makes use of a new software tool, SPY US. Our study concentrates on using log data analysis in improving the PBL method used in learning diagnostic skills with the help of Virtual Patients.
Keywords: learning management system, problem-based learning, educational data mining.
1. Introduction
Problem-based learning (PBL) is a widely used method in medical education. PBL is a student-centered pedagogy in which students learn both thinking strategies and domain knowledge through problem solving. It starts with a problem and uses a cyclic process acquiring and processing information, and in order to reach the learning outcomes, it is important that students obey the fixed process. (Albanese, 2010; Hmelo-Silver, 2004).
Typically, university courses use software tools called learning management systems (LMSs) – also known as course management systems – for various practical purposes. LMSs offer a great variety of functions to collect data about students and their activities in a course (Romero et al., 2008). They can record student activities including reading, writing, taking tests, performing tasks, and communicating with peers (Mostow et al., 2005). The line of research making use of the recorded data of LMSs is called educa-tional data mining (Romero et al., 2008). The definition and methods of educational data mining are further considered, e.g., by Baker and Yacef (2009), Romero and Ventura (2010), and Lile (2011). We follow the four step process of educational data mining proposed by Romero et al. (2008): collecting data, pre-processing data, applying data mining methods, and interpreting, evaluating and deploying the results. The stakehold-
S. Walldén, E. Mäkinen142
ers of educational data mining are instructors, students, course developers, educational researchers, and various kinds of administrators and related organizations (Romero and Ventura, 2010).
In this paper we apply educational data mining by gathering data in the form of user logs to be used when studying the ascent of a course, especially the degree with which students follow the intended PBL method. Our study is related to Moodle system and its use as a platform for so called Virtual Patients. The log data is handled with new software called SPY US.
It is challenging in medical education to evaluate the process of learning to apply theories as a skill, e.g., to be able to define the status of the patient, to perform the right examinations, and to conclude the correct diagnosis. In the case of PBL, this would include, for example, to check whether a single student or the students in a course in general really utilize the learning material in the proposed order. Hence, this paper con-siders the use of log data provided by LMSs when studying whether students follow the PBL method. Surprisingly, there seems to be no literature on this topic in the connection with PBL. Ku and Chang (2010) have considered the integration of PBL and LMSs, but from a completely different viewpoint than in this paper.
We demonstrate the use of Moodle log data with International Virtual Medical School’s (IVIMEDS) (2013) Virtual Patient (VP) applications at the Tampere Medi-cal School. VPs are used for the first time during the second year of studies as optional learning resource and later in some other courses (they call them blocks), too. One of the main goals of the course in question is to learn to conclude diagnoses; the students are preparing to start their clinical training where they meet real patients for the first time. The School follows the PBL method in all its teaching, and VPs are used as the sample problems of the method. On one hand, VPs are an alternative for traditional learning ma-terial (e.g., books), and on the other hand, they serve as a tool for students’ self-reflection (VP’s Stydy Guides, leaning test). Some VPs even contain so called Study Guides which are intended to reflect students’ learning. The course used eight VPs which related to different medical problems but were technically similar.
VPs are used in the Moodle platform and Moodle’s logs are utilized when studying to use of VPs. The log analysis turns out to be valuable in many respects giving more reli-The log analysis turns out to be valuable in many respects giving more reli-able information about the use than subjective self-reporting, for example, self reports may be biased by tendencies to report socially desirable behaviours and deny performing socially undesirable behaviours (Straub et al., 1995). We formulate the research question as follows:
Can the log data (here, Virtual Patient logs) provided by an LMS (here, Moodle) ●be integrated with the PBL method to support teaching (instructors) and learning (students)? If so, how?
In addition to plain log data we obtained background information concerning the stu-dents via a questionnaire. The purpose of the questionnaire was to find out, for example, the motivation to study (intrinsic vs. extrinsic), whether students study alone or with each other, or where they used VPs. The background information helped us to integrate the log based information to the use of the PBL method. The questionnaire was filled in by 113 students out of 116 participants of the course.
Educational Data Mining and Problem-Based Learning 143
Our result can be formulated as follows: Log analysis is useful in studying the de-gree with which students follow the PBL method, but it requires a proper software which gives regular feedback to instructors and students.
We propose a new method, i.e., PBL augmented with the feedback provided by the log information. Hence, we should (1) compare the new method against competing ones, and (2) make sure of its overall suitability to the task it is proposed to. In the latter ques-tion we use the criteria given by March and Smith (1995). They state that evaluation of methods considers operationality (the ability to perform the intended task or the ability of humans to effectively use the method), efficiency, generality (the extent with which the method can be applied), and ease of use. We shall see that our method does well in these evaluations.
This paper is organized as follows. In the next section, we recall the basics of PBL. In Section 3 we discuss Moodle logs and in Section 4 we introduce our study context, the use of VPs at the Tampere Medical School. In Sections 5-8 we show how students’ certain activities in a course can be recorded from the viewpoint of PBL learning by us-ing the log data. In Section 9 we evaluate the proposed method in the sense of March and Smith (1995), and finally, in Section 10 we conclude our findings.
2. Problem-Based Learning
In PBL students learn through the experience of problem solving. The purpose is to help the students to develop flexible knowledge, effective problem solving skills, self-directed learning, effective collaboration skills and intrinsic motivation. (Hmelo-Silver, 2004). Students work in groups (whose optimal size is difficult to determine, typically less than ten) with a tutor, who facilitates the sessions. The tutor provides appropriate scaffolding, supports of the learning process and monitors the learning (Albanese, 2010).
PBL is heavily used on medical education from where it also originates. Albanese (2010) even defines PBL “as an instructional method that uses patient problems as a context for students to acquire knowledge about the basic and clinical sciences”.
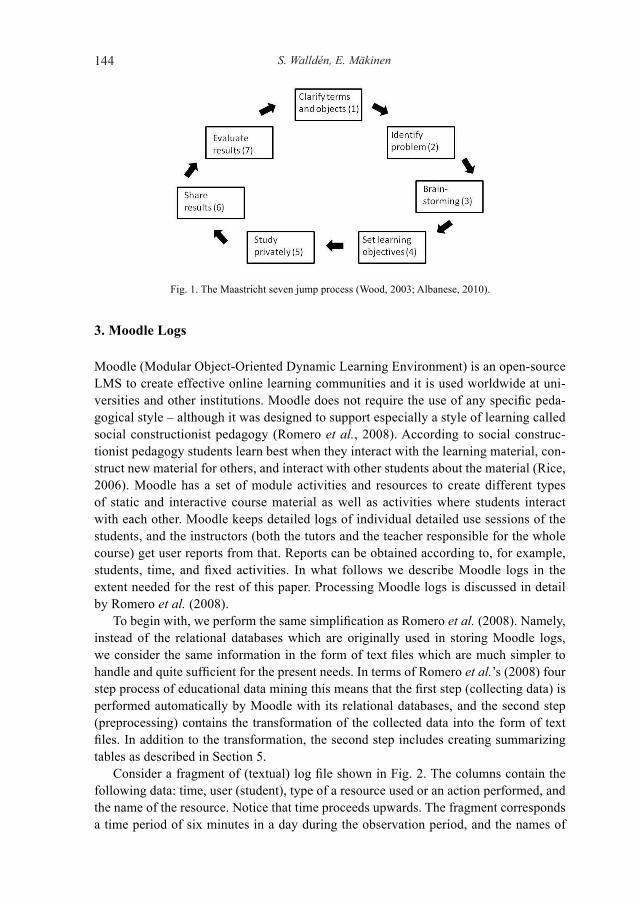
A PBL tutorial can be organized as Maastricht “seven jump” process (Wood, 2003; Albanese, 2010): Unfamiliar terms are clarified (1), the problem is identified (2) and dis-cussed with brainstorming method (3), possible answers are reviewed as tentative solu-tions, and after that, the group reaches consensus on learning objectives (4) and the tutor ensures that the objectives are appropriate. The students gather privately information related to the learning objectives (5) and, then the group shares the results of the private studies of each student (6), and the tutor evaluates learning results (7). See Fig. 1.
The process may vary from school to school, but the main characteristics are the fol-lowing three: problems as a stimulus of learning, tutors as facilitators and group work (Dolmans et al., 2005).
The instance of the Attack/Defense course (block) studied here took totally 10 weeks. Its activities included lectures (31 hours), tutor sessions twice a week, private study re-lated to tutor sessions, and group works. In the course, eight problems on infections were identified with the help of VPs.
S. Walldén, E. Mäkinen144
3. Moodle Logs
Moodle (Modular Object-Oriented Dynamic Learning Environment) is an open-source LMS to create effective online learning communities and it is used worldwide at uni-versities and other institutions. Moodle does not require the use of any specific peda-gogical style – although it was designed to support especially a style of learning called social constructionist pedagogy (Romero et al., 2008). According to social construc-tionist pedagogy students learn best when they interact with the learning material, con-struct new material for others, and interact with other students about the material (Rice, 2006). Moodle has a set of module activities and resources to create different types of static and interactive course material as well as activities where students interact with each other. Moodle keeps detailed logs of individual detailed use sessions of the students, and the instructors (both the tutors and the teacher responsible for the whole course) get user reports from that. Reports can be obtained according to, for example, students, time, and fixed activities. In what follows we describe Moodle logs in the extent needed for the rest of this paper. Processing Moodle logs is discussed in detail by Romero et al. (2008).
To begin with, we perform the same simplification as Romero et al. (2008). Namely, instead of the relational databases which are originally used in storing Moodle logs, we consider the same information in the form of text files which are much simpler to handle and quite sufficient for the present needs. In terms of Romero et al.’s (2008) four step process of educational data mining this means that the first step (collecting data) is performed automatically by Moodle with its relational databases, and the second step (preprocessing) contains the transformation of the collected data into the form of text files. In addition to the transformation, the second step includes creating summarizing tables as described in Section 5.
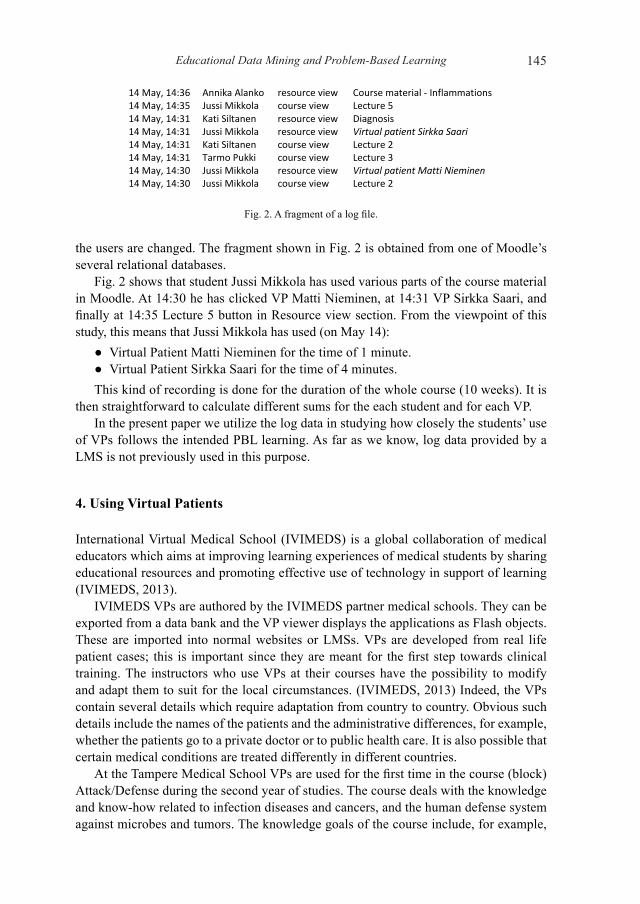
Consider a fragment of (textual) log file shown in Fig. 2. The columns contain the following data: time, user (student), type of a resource used or an action performed, and the name of the resource. Notice that time proceeds upwards. The fragment corresponds a time period of six minutes in a day during the observation period, and the names of
Fig. 1. The Maastricht seven jump process (Wood, 2003; Albanese, 2010).
Educational Data Mining and Problem-Based Learning 145
the users are changed. The fragment shown in Fig. 2 is obtained from one of Moodle’s several relational databases.
Fig. 2 shows that student Jussi Mikkola has used various parts of the course material in Moodle. At 14:30 he has clicked VP Matti Nieminen, at 14:31 VP Sirkka Saari, and finally at 14:35 Lecture 5 button in Resource view section. From the viewpoint of this study, this means that Jussi Mikkola has used (on May 14):
Virtual Patient Matti Nieminen for the time of 1 minute. ●Virtual Patient Sirkka Saari for the time of 4 minutes. ●
This kind of recording is done for the duration of the whole course (10 weeks). It is then straightforward to calculate different sums for the each student and for each VP.
In the present paper we utilize the log data in studying how closely the students’ use of VPs follows the intended PBL learning. As far as we know, log data provided by a LMS is not previously used in this purpose.
4. Using Virtual Patients
International Virtual Medical School (IVIMEDS) is a global collaboration of medical educators which aims at improving learning experiences of medical students by sharing educational resources and promoting effective use of technology in support of learning (IVIMEDS, 2013).
IVIMEDS VPs are authored by the IVIMEDS partner medical schools. They can be exported from a data bank and the VP viewer displays the applications as Flash objects. These are imported into normal websites or LMSs. VPs are developed from real life patient cases; this is important since they are meant for the first step towards clinical training. The instructors who use VPs at their courses have the possibility to modify and adapt them to suit for the local circumstances. (IVIMEDS, 2013) Indeed, the VPs contain several details which require adaptation from country to country. Obvious such details include the names of the patients and the administrative differences, for example, whether the patients go to a private doctor or to public health care. It is also possible that certain medical conditions are treated differently in different countries.
At the Tampere Medical School VPs are used for the first time in the course (block) Attack/Defense during the second year of studies. The course deals with the knowledge and know-how related to infection diseases and cancers, and the human defense system against microbes and tumors. The knowledge goals of the course include, for example,
14 May, 14:36 Annika Alanko resource view Course material - Inflammations 14 May, 14:35 Jussi Mikkola course view Lecture 5 14 May, 14:31 Kati Siltanen resource view Diagnosis 14 May, 14:31 Jussi Mikkola resource view Virtual patient Sirkka Saari 14 May, 14:31 Kati Siltanen course view Lecture 2 14 May, 14:31 Tarmo Pukki course view Lecture 3 14 May, 14:30 Jussi Mikkola resource view Virtual patient Matti Nieminen 14 May, 14:30 Jussi Mikkola course view Lecture 2
Fig. 2. A fragment of a log file.
S. Walldén, E. Mäkinen146
concepts related to infectious diseases, different types of microbes, the structure and metabolism of bacteria, the anatomy and histology of organs involving the immune de-fense, and different diseases (the pathology of acute and chronic infections, skin as a part of the defense mechanism, and allergy). The knowledge goals include also the validity of diagnosis, the concepts of random and systematic errors, and estimating causal rela-tionships. The know-how goals include aseptic technology (”hygiene”) and the basic methods of epidemiology. Moreover, the students are practicing interaction with real patients, making anamnesis, and defining the status of a patient.
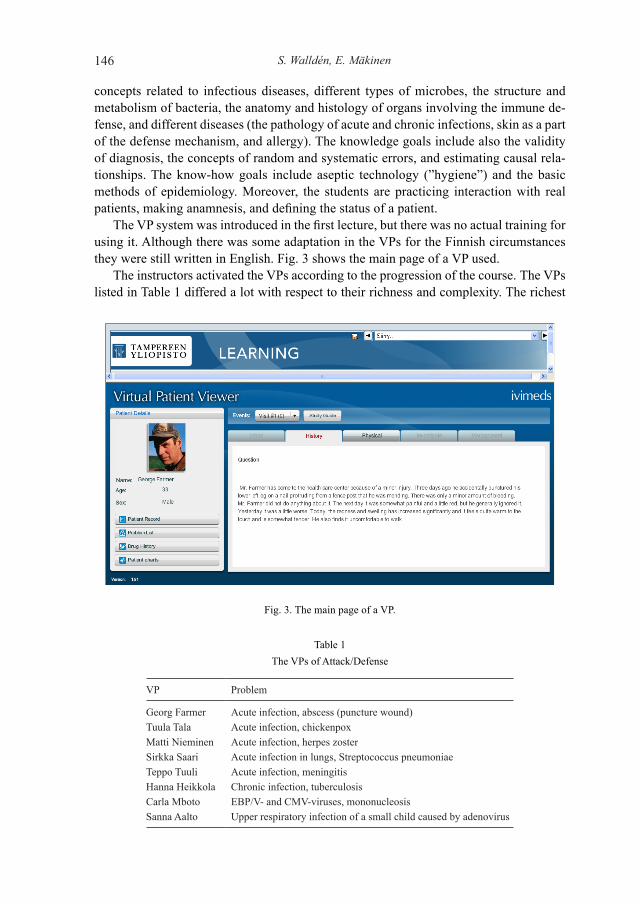
The VP system was introduced in the first lecture, but there was no actual training for using it. Although there was some adaptation in the VPs for the Finnish circumstances they were still written in English. Fig. 3 shows the main page of a VP used.
The instructors activated the VPs according to the progression of the course. The VPs listed in Table 1 differed a lot with respect to their richness and complexity. The richest
Table 1The VPs of Attack/Defense
VP Problem
Georg Farmer Acute infection, abscess (puncture wound)Tuula Tala Acute infection, chickenpoxMatti Nieminen Acute infection, herpes zosterSirkka Saari Acute infection in lungs, Streptococcus pneumoniaeTeppo Tuuli Acute infection, meningitisHanna Heikkola Chronic infection, tuberculosisCarla Mboto EBP/V- and CMV-viruses, mononucleosis Sanna Aalto Upper respiratory infection of a small child caused by adenovirus
Fig. 3. The main page of a VP.
Educational Data Mining and Problem-Based Learning 147
VPs were Sirkka Saari and Hanna Heikkola which both contained information of several medical examinations and laboratory results, and Carla Mboto and Sanna Aalto contained assignment section (so called Study Guide), while some of the VPs were quite simple. Table 1 shows the VPs in the order they were used.
5. Creating Summarizing Tables With SPY US
The log data stored by Moodle allows us to make observation concerning the use of VPs at several different levels. At the most general level we obtain overall statistics (number of users, number of use sessions, their duration, etc.) about the use. This is a part of the sec-ond step of data mining process (pre-processing) and it makes use of SPY US software.
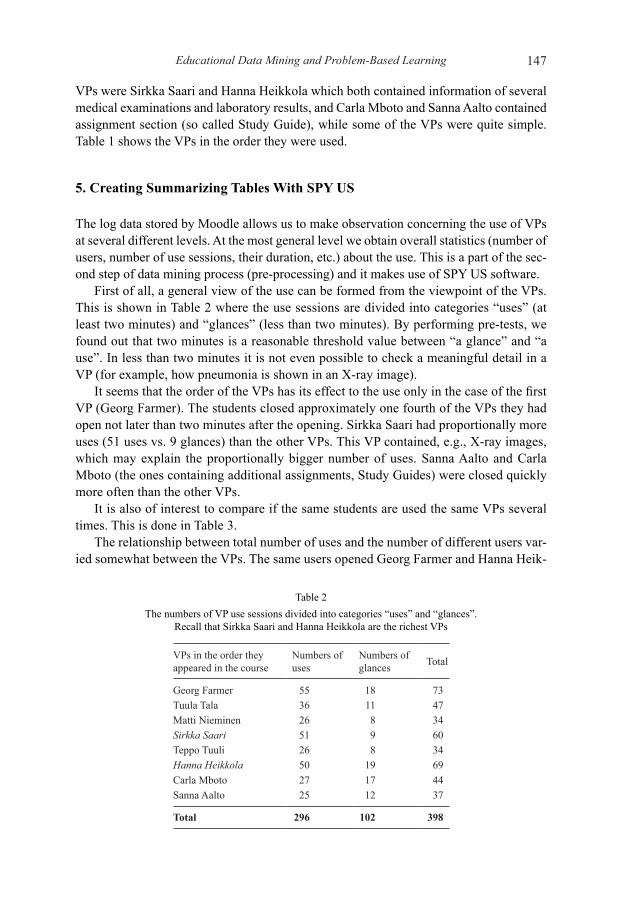
First of all, a general view of the use can be formed from the viewpoint of the VPs. This is shown in Table 2 where the use sessions are divided into categories “uses” (at least two minutes) and “glances” (less than two minutes). By performing pre-tests, we found out that two minutes is a reasonable threshold value between “a glance” and “a use”. In less than two minutes it is not even possible to check a meaningful detail in a VP (for example, how pneumonia is shown in an X-ray image).
It seems that the order of the VPs has its effect to the use only in the case of the first VP (Georg Farmer). The students closed approximately one fourth of the VPs they had open not later than two minutes after the opening. Sirkka Saari had proportionally more uses (51 uses vs. 9 glances) than the other VPs. This VP contained, e.g., X-ray images, which may explain the proportionally bigger number of uses. Sanna Aalto and Carla Mboto (the ones containing additional assignments, Study Guides) were closed quickly more often than the other VPs.
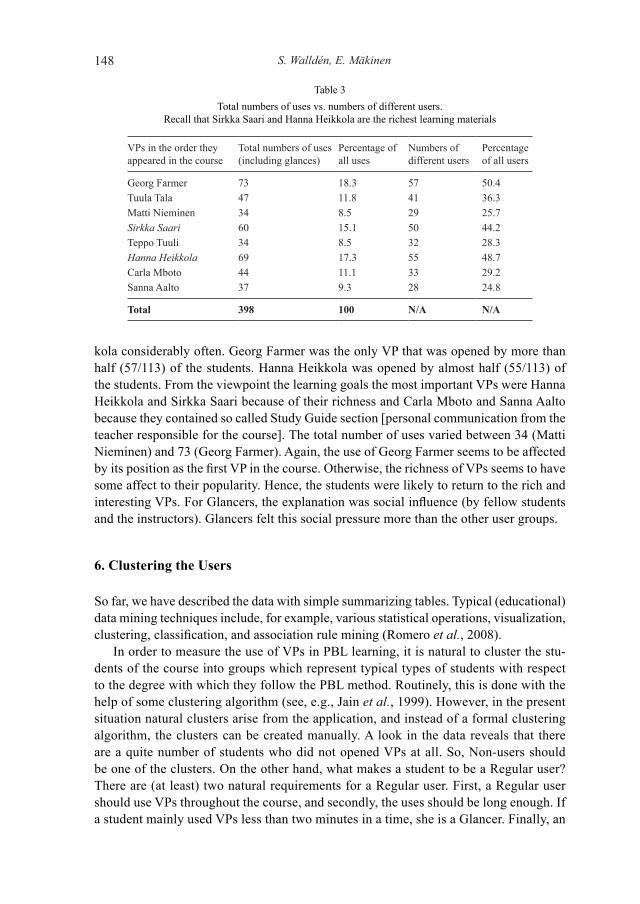
It is also of interest to compare if the same students are used the same VPs several times. This is done in Table 3.
The relationship between total number of uses and the number of different users var-ied somewhat between the VPs. The same users opened Georg Farmer and Hanna Heik-
Table 2 The numbers of VP use sessions divided into categories “uses” and “glances”.
Recall that Sirkka Saari and Hanna Heikkola are the richest VPs
VPs in the order they appeared in the course
Numbers of uses
Numbers of glances Total
Georg Farmer 55 18 73Tuula Tala 36 11 47Matti Nieminen 26 8 34Sirkka Saari 51 9 60Teppo Tuuli 26 8 34Hanna Heikkola 50 19 69Carla Mboto 27 17 44Sanna Aalto 25 12 37
Total 296 102 398
S. Walldén, E. Mäkinen148
kola considerably often. Georg Farmer was the only VP that was opened by more than half (57/113) of the students. Hanna Heikkola was opened by almost half (55/113) of the students. From the viewpoint the learning goals the most important VPs were Hanna Heikkola and Sirkka Saari because of their richness and Carla Mboto and Sanna Aalto because they contained so called Study Guide section [personal communication from the teacher responsible for the course]. The total number of uses varied between 34 (Matti Nieminen) and 73 (Georg Farmer). Again, the use of Georg Farmer seems to be affected by its position as the first VP in the course. Otherwise, the richness of VPs seems to have some affect to their popularity. Hence, the students were likely to return to the rich and interesting VPs. For Glancers, the explanation was social influence (by fellow students and the instructors). Glancers felt this social pressure more than the other user groups.
6. Clustering the Users
So far, we have described the data with simple summarizing tables. Typical (educational) data mining techniques include, for example, various statistical operations, visualization, clustering, classification, and association rule mining (Romero et al., 2008).
In order to measure the use of VPs in PBL learning, it is natural to cluster the stu-dents of the course into groups which represent typical types of students with respect to the degree with which they follow the PBL method. Routinely, this is done with the help of some clustering algorithm (see, e.g., Jain et al., 1999). However, in the present situation natural clusters arise from the application, and instead of a formal clustering algorithm, the clusters can be created manually. A look in the data reveals that there are a quite number of students who did not opened VPs at all. So, Non-users should be one of the clusters. On the other hand, what makes a student to be a Regular user? There are (at least) two natural requirements for a Regular user. First, a Regular user should use VPs throughout the course, and secondly, the uses should be long enough. If a student mainly used VPs less than two minutes in a time, she is a Glancer. Finally, an
Table 3 Total numbers of uses vs. numbers of different users.
Recall that Sirkka Saari and Hanna Heikkola are the richest learning materials
VPs in the order they appeared in the course
Total numbers of uses (including glances)
Percentage of all uses
Numbers of different users
Percentage of all users
Georg Farmer 73 18.3 57 50.4Tuula Tala 47 11.8 41 36.3Matti Nieminen 34 8.5 29 25.7Sirkka Saari 60 15.1 50 44.2Teppo Tuuli 34 8.5 32 28.3Hanna Heikkola 69 17.3 55 48.7Carla Mboto 44 11.1 33 29.2Sanna Aalto 37 9.3 28 24.8
Total 398 100 N/A N/A
Educational Data Mining and Problem-Based Learning 149
Interrupter started to use VPs but then ceases to do so. Hence, the students are clustered according to the existence of use, its duration, and distribution during the course. Dis-tribution is not a standard measure of use, but is needed to check whether students used VPs throughout the course. Intensity is often used to measure use (see, e.g. Burton-Jones, 2005), but it is not applicable here because Moodle logs do not give information about students’ actions inside VPs.
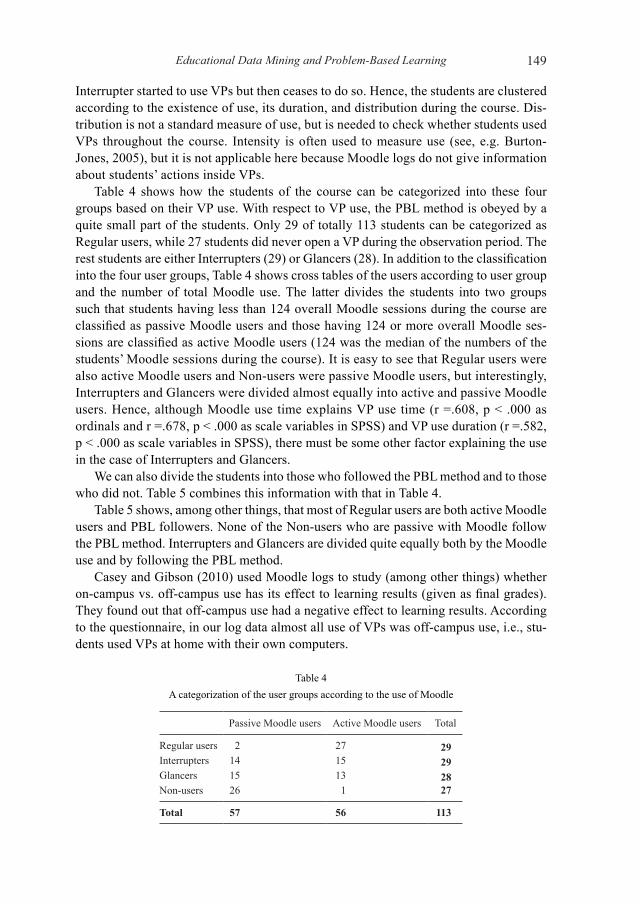
Table 4 shows how the students of the course can be categorized into these four groups based on their VP use. With respect to VP use, the PBL method is obeyed by a quite small part of the students. Only 29 of totally 113 students can be categorized as Regular users, while 27 students did never open a VP during the observation period. The rest students are either Interrupters (29) or Glancers (28). In addition to the classification into the four user groups, Table 4 shows cross tables of the users according to user group and the number of total Moodle use. The latter divides the students into two groups such that students having less than 124 overall Moodle sessions during the course are classified as passive Moodle users and those having 124 or more overall Moodle ses-sions are classified as active Moodle users (124 was the median of the numbers of the students’ Moodle sessions during the course). It is easy to see that Regular users were also active Moodle users and Non-users were passive Moodle users, but interestingly, Interrupters and Glancers were divided almost equally into active and passive Moodle users. Hence, although Moodle use time explains VP use time (r =.608, p < .000 as ordinals and r =.678, p < .000 as scale variables in SPSS) and VP use duration (r =.582, p < .000 as scale variables in SPSS), there must be some other factor explaining the use in the case of Interrupters and Glancers.
We can also divide the students into those who followed the PBL method and to those who did not. Table 5 combines this information with that in Table 4.
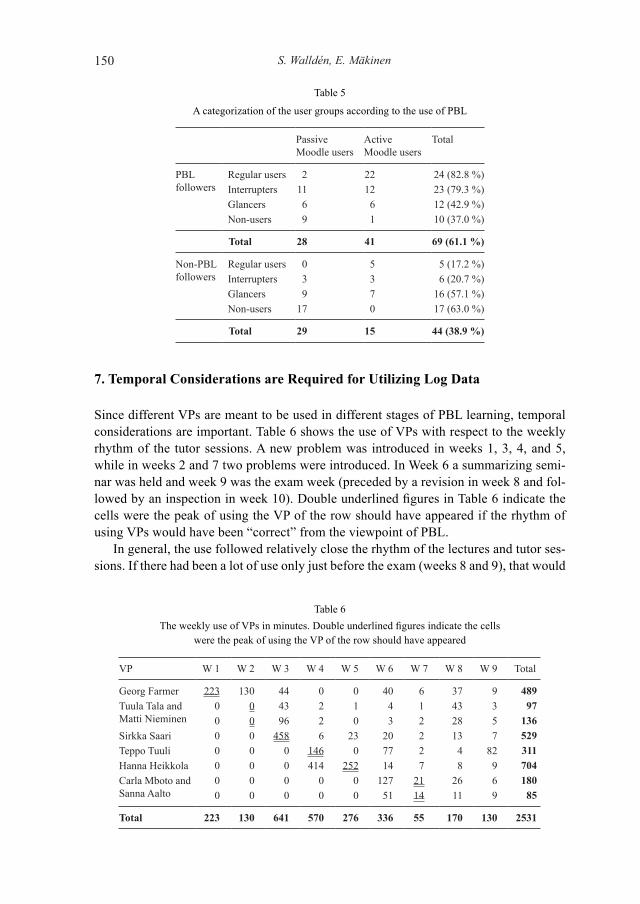
Table 5 shows, among other things, that most of Regular users are both active Moodle users and PBL followers. None of the Non-users who are passive with Moodle follow the PBL method. Interrupters and Glancers are divided quite equally both by the Moodle use and by following the PBL method.
Casey and Gibson (2010) used Moodle logs to study (among other things) whether on-campus vs. off-campus use has its effect to learning results (given as final grades). They found out that off-campus use had a negative effect to learning results. According to the questionnaire, in our log data almost all use of VPs was off-campus use, i.e., stu-dents used VPs at home with their own computers.
Table 4A categorization of the user groups according to the use of Moodle
Passive Moodle users Active Moodle users Total
Regular users 2 27 29Interrupters 14 15 29Glancers 15 13 28Non-users 26 1 27
Total 57 56 113
S. Walldén, E. Mäkinen150
7. Temporal Considerations are Required for Utilizing Log Data
Since different VPs are meant to be used in different stages of PBL learning, temporal considerations are important. Table 6 shows the use of VPs with respect to the weekly rhythm of the tutor sessions. A new problem was introduced in weeks 1, 3, 4, and 5, while in weeks 2 and 7 two problems were introduced. In Week 6 a summarizing semi-nar was held and week 9 was the exam week (preceded by a revision in week 8 and fol-lowed by an inspection in week 10). Double underlined figures in Table 6 indicate the cells were the peak of using the VP of the row should have appeared if the rhythm of using VPs would have been “correct” from the viewpoint of PBL.
In general, the use followed relatively close the rhythm of the lectures and tutor ses-sions. If there had been a lot of use only just before the exam (weeks 8 and 9), that would
Table 5
A categorization of the user groups according to the use of PBL
Passive Moodle users
Active Moodle users
Total
PBL followers
Regular users 2 22 24 (82.8 %) Interrupters 11 12 23 (79.3 %)Glancers 6 6 12 (42.9 %)Non-users 9 1 10 (37.0 %)
Total 28 41 69 (61.1 %)
Non-PBL followers
Regular users 0 5 5 (17.2 %)Interrupters 3 3 6 (20.7 %)Glancers 9 7 16 (57.1 %)Non-users 17 0 17 (63.0 %)
Total 29 15 44 (38.9 %)
Table 6The weekly use of VPs in minutes. Double underlined figures indicate the cells
were the peak of using the VP of the row should have appeared
VP W 1 W 2 W 3 W 4 W 5 W 6 W 7 W 8 W 9 Total
Georg Farmer 223 130 44 0 0 40 6 37 9 489Tuula Tala andMatti Nieminen
0 0 43 2 1 4 1 43 3 970 0 96 2 0 3 2 28 5 136
Sirkka Saari 0 0 458 6 23 20 2 13 7 529Teppo Tuuli 0 0 0 146 0 77 2 4 82 311Hanna Heikkola 0 0 0 414 252 14 7 8 9 704Carla Mboto andSanna Aalto
0 0 0 0 0 127 21 26 6 1800 0 0 0 0 51 14 11 9 85
Total 223 130 641 570 276 336 55 170 130 2531
Educational Data Mining and Problem-Based Learning 151
have been a violation against PBL. However, Table 6 shows only a small peak in the use during that time. Week 3 was the one with the longest durations of use sessions. A pos-sible external cause is that there was a visiting lecturer in that week.
The richest VPs (Sirkka Saari and Hanna Heikkola) were used for the longest times. The third popular VP was the first one (George Farmer). Excluding the first flush (week 1), we can conclude the rich VPs were used more than the simple ones. Weeks 3 and 4 were clearly the busiest periods with VPs. When preparing to the exam in week 8, the most popular VPs were Tuula Tala and Georg Farmer (the two first VPs) and not the richest VPs. It is interesting that Teppo Tuuli (82) was the most popular VP during exam week 9. Unfortunately, log analysis does not explain its popularity.
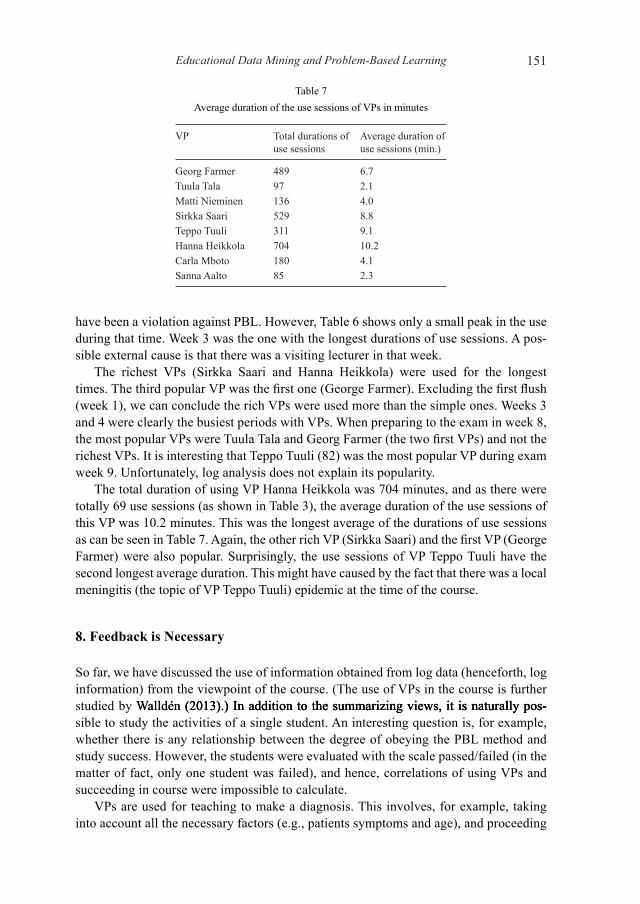
The total duration of using VP Hanna Heikkola was 704 minutes, and as there were totally 69 use sessions (as shown in Table 3), the average duration of the use sessions of this VP was 10.2 minutes. This was the longest average of the durations of use sessions as can be seen in Table 7. Again, the other rich VP (Sirkka Saari) and the first VP (George Farmer) were also popular. Surprisingly, the use sessions of VP Teppo Tuuli have the second longest average duration. This might have caused by the fact that there was a local meningitis (the topic of VP Teppo Tuuli) epidemic at the time of the course.
8. Feedback is Necessary
So far, we have discussed the use of information obtained from log data (henceforth, log information) from the viewpoint of the course. (The use of VPs in the course is further studied by Walld�n (2013).) In addition to the summarizing views, it is naturally pos-Walld�n (2013).) In addition to the summarizing views, it is naturally pos-(2013).) In addition to the summarizing views, it is naturally pos-sible to study the activities of a single student. An interesting question is, for example, whether there is any relationship between the degree of obeying the PBL method and study success. However, the students were evaluated with the scale passed/failed (in the matter of fact, only one student was failed), and hence, correlations of using VPs and succeeding in course were impossible to calculate.
VPs are used for teaching to make a diagnosis. This involves, for example, taking into account all the necessary factors (e.g., patients symptoms and age), and proceeding
Table 7Average duration of the use sessions of VPs in minutes
VP Total durations of use sessions
Average duration of use sessions (min.)
Georg Farmer 489 6.7Tuula Tala 97 2.1Matti Nieminen 136 4.0Sirkka Saari 529 8.8Teppo Tuuli 311 9.1Hanna Heikkola 704 10.2Carla Mboto 180 4.1Sanna Aalto 85 2.3
S. Walldén, E. Mäkinen152
in the correct order with the examinations. In order to progress in the learning process, the student needs feedback for reflecting her present knowledge and skills.
It would be easy to develop SPY US so that it could automatically give the following kind of motivation and reflective feedback to students:
Non-users should be motivated to begin to use VPs by sending messages stressing ●their usefulness.Glancers should be urged to reflect (and change) their way of learning, if needed. ●Interrupters should be reminded that studying requires perseverance. ●Regular users should be applauded. ●
And the following feedback to the instructors for supporting teaching:Are the VPs used at all? ●Are the VPs used in the correct order with respect to the problems of the tutor ●sessions?Are the VPs used in a proper time with respect to other learning material used, i.e., ●do students’ use paths form meaningful entireties for solving the problems?
To be really useful, the feedback should be given online during the course, not only afterwards.
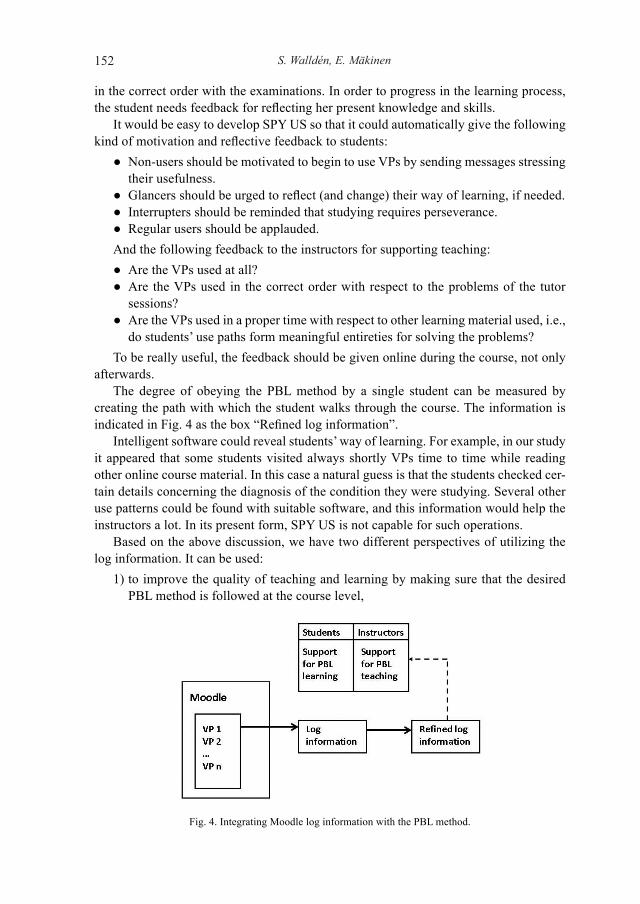
The degree of obeying the PBL method by a single student can be measured by creating the path with which the student walks through the course. The information is indicated in Fig. 4 as the box “Refined log information”.
Intelligent software could reveal students’ way of learning. For example, in our study it appeared that some students visited always shortly VPs time to time while reading other online course material. In this case a natural guess is that the students checked cer-tain details concerning the diagnosis of the condition they were studying. Several other use patterns could be found with suitable software, and this information would help the instructors a lot. In its present form, SPY US is not capable for such operations.
Based on the above discussion, we have two different perspectives of utilizing the log information. It can be used:
to improve the quality of teaching and learning by making sure that the desired 1) PBL method is followed at the course level,
Fig. 4. Integrating Moodle log information with the PBL method.
Educational Data Mining and Problem-Based Learning 153
to improve the quality of teaching and learning by making sure that an individual 2) student follows the PBL method.
Notice that the above recommendations consists the fourth step of the Romero et al.’s (2008) description of educational data mining process.
Result 1) gives a tool for the tutor to observe how actively her students use VPs (or other similar learning material) when preparing for the tutor sessions. She can also con-clude whether active VP users have better learning results than the other students (what, in turn, helps her to estimate the success of the VPs in question and their integration with the other course material and arrangements).
Also result 2) helps the instructor. The use pattern of an individual student is valuable when the instructor gives feedback to her students, typically at the end of the course. The use pattern can also help the student to self-reflect her way of learning. Result 2) also helps the student to reflect her learning.
Obviously, it is not possible to utilize items 1) – 2) above just based on log analysis, but additional information is needed. We acquired further information by a questionnaire in order to find out, for example, the ways of learning obeyed by the student, their pre-paredness for using the system, alternative learning material, and so on. Combining the results with the log analysis this additional information makes it possible to improve the quality of learning and teaching. The use of VPs can depend also on their usability and usefulness, but these considerations are outside the scope of this paper.
9. Evaluating the Method
We have proposed the use of log information in studying how students obey the PBL method. In order to validate the usefulness of the proposed method, we (a) compare the new method against competing ones, and (b) make sure of its overall suitability to the task it is proposed to. For the latter question March and Smith (1995) suggest to use the following criteria: operationality, efficiency, generality, and ease of use.
To be exact, the method under evaluation is PBL augmented with the use of log in-formation (the items 1) and 2) described in the previous section). Alternative, competing methods to augment PBL in order to obtain the same effects include at least observa-tion, different kinds of interviewing techniques, questionnaires, videotaping, and diaries. The long observation periods make observation and videotaping impossible. Interviews, questionnaires, and diaries are possible methods for figuring out the use. Log analysis automatically and objectively stores the information concerning the use. Hence, in this respect it clearly outperforms the three alternative methods mentioned.
Very recently, there has been some research on utilizing LMS (most often Moodle) log information in pedagogical work (see Mazza et al. (2012) and the references given there). Typically, the information refined from the logs is given in summary tables show-ing the total use of certain online learning material (see, for example, (Urwin, 2011)). Mazza et al. (2012) examined almost 30 plugins to be used in analyzing LMS logs. Our software (called SPY US) is hard-coded to recognize and analyze the use of VPs in a Moodle log file. SPY US finds the sessions of VP use in a course and performs certain
elementary statistical operations, including temporal classifications of the sessions. As SPY US is fitted for VPs, it is easy and efficient to use, but, in its present form, not a gen-eral tool for analyzing Moodle logs. On the other hand, the settings are easy to change for analyzing other Moodle actions, as well.
Next we evaluate the method of using log analysis by SPY US to augment PBL in terms of March and Smith‘s (1995) criteria. Before checking the four criteria, we shortly summarize what we are evaluating. SPY US gets as input a Moodle log listing containing all the activities of a course and outputs the following information: for each VP, the total number of uses, their exact date and duration, the number of users using a fixed VP, and the identification of the users; for each student, the total number of uses, their exact date and time, duration, and the number of using a fixed VP. All the information can be ob-tained for any time period. Moreover, simple statistics (e.g., averages and medians) of the figures are produced. Also Moodle provides some statistics about the users and uses. All the above information can then be used to evaluate and improve the course in question.
Now we check the four criteria by Marsh and Smith (1995):Operationality. An instructor obeying PBL makes use of the information concern-
ing the numbers of uses, their duration and distribution. The main missing feature of the present system is that of constructing complete use paths of the students. Such paths would help the instructor to support students’ learning. There are some practical prob-lems related to using Moodle logs if accurate times of use are needed, but in the present application this problem is not severe.
Generality. The present system is hard-coded to handle VPs, but it would be easy to parameterize the functions to a more general form. The information provided is general in the sense that its feasibility is by no means limited to PBL but the information could be used with all kinds of study methods.
Efficiency. Naturally, the SPY US software outperforms any manual system in terms of efficiency. In the matter of fact, Moodle logs are so extensive that their manual treat-ment is simply impossible. As SPY US is hard-coded for treating VPs, it is very efficient and handy for its purpose. On the other hand, there is an obvious trade-off situation be-tween efficiency and generality: a more general system would not be as efficient as the present one in handling VP related information.
Ease of use. In its present hard-coded form the system is ease to use for purpose it is intended. However, a Windows interface would further improve the usability of the present UNIX implementation, and that would also be a prerequisite for its wider use.
10. Concluding Remarks
We have proposed the use of log analysis in studying PBL method, especially in a medi-cal school course using VPs. This is an important topic because it is challenging to sup-port teaching to apply applying theories as skills. In the case of PBL, the utilization of log information is at least threefold: log information can be used at the student’s level and at the course’s level. We have shown that the new method of augmenting PBL by using log information does well with respect to March and Smith’s (1995) criteria for methods.
Educational Data Mining and Problem-Based Learning 155
Log analysis reliably registers all the actions made by the users. Hence, self-report-ing does not skew the results. Log information can be processed statistically. This al-lows us to thoroughly study the effects of the PBL method, e.g., with respect to various individual properties of the students.
Presently, SPY US does not support analyzing use path which would be reveal details about an individual student’s way of using Moodle and VPs. This would be an interest-ing additional feature for the log analysis software. For example, the fundamental PBL cycle (see Fig. 1) could be studied more carefully with the help of a proper software than with manually investigating the log files.
A significant topic for further work is actual use of VPs. The goal of using VPs is to promote students’ ability to choose right examinations based on patient’s symptoms and to conclude the correct diagnosis. The log data indicated that about 75 % of students used VPs. However, closer log analysis revealed that all use did not fit to the goals of the course. For example, glances (less than two minutes) at VPs cannot contribute to diag-nostic abilities. On the other hand, students who had only glances had strong behavioral intention to use VPs. For some reason, this intention did not imply actual use. We can think that these students rejected VPs several times but their intention to use them as optional learning material remained.
Acknowledgements
The authors wish to thank prof. Kati Hakkarainen for her kind support for collecting the data, prof. emer. Pertti Järvinen for his useful comments, and Tuomas Pellonperä for his help in implementing SPY US.
References
Albanese, M.A. (2010). Problem-based learning. In: T. Swanwick (ed.), Evidence, Theory and Practice. As-sociation for the Study of Medical Education, 37–51.
Baker, R., Yacef, K. (2009). The state of educational data mining in 2009: a review and future visions. Journal of Educational Data Mining, 1(1), 3–17.
Burton-Jones, A. (2005). New perspectives on the system usage construct. Computer Information Systems Dissertations. Paper 3. Georgia State University.
Casey, K., Gibson, P. (2010). (m)Oodles of data mining Moodle to understand student behavious. In: Interna-tional Conference on Engaging Pedagogy. National University of Ireland, Maynooth.
Dolmans, D.H.J., De Grave, W., Wolfhagen, I.H.A.P., Van Der Vleuten, C.P.M. (2005). Problem-based learn-ing: future challenges for educational practice and research. Medical Education, 39(7), 732–741.
Hmelo-Silver, C.E. (2004). Problem-based learning: What and how do students learn?. Educational Psychol-ogy Review, 16(3), 235–266.
IVIMEDS. (2013). The International Virtual Medical School. http://www.ivimeds.org/ Jain, A.K., Murty, M.N., Flynn, P.J. (1999). Data clustering: a review. ACM Computing Surveys, 31(3),
264–323.Ku, D.T., Chang, C.-S. (2010). A framework of PBL strategy integrated in LMS and a ubiquitous learning
environment. In: Proc. of the Sixth International Conference on Networked Computing and Advanced Information Management (NCM), 2010. IEEE, 722–726.
Lile, A. (2011). Analyzing e-learning systems using educational data mining techniques. Mediterranean Jour-nal of Social Sciences, 2(3), 403–419.
S. Walldén, E. Mäkinen156
March, S.T., Smith, G.F. (1995). Design and natural science research on information technology. Decision Support Systems, 15, 251–266.
Mazza, R., Bettoni, M., Far�, M., Mazzola, L. (2012). MOCLog – Monitoring online course with log data. In: Proc. of the 1st Moodle Research Conference.
Mostow, J., Beck, J., Cen, H., Cuneo, A., Gouvea, E., Heiner, C. (2005). An educational data mining tool to browse tutor-student interactions: time will tell! In: Proc. of the Workshop on Educational Data Mining. 15–22.
Rice, W.H. (2006). Moodle E-learning Course Development. A Complete Guide to Successful Learning Using Moodle. Packt Publishing.
Romero, C., Ventura S. (2010). Educational data mining: a review of the state of art. IEEE Transactions on Systems, Man, and Cybernetics – Part C: Applications and Reviews, 40, 601–618.
Romero, C., Ventura, S., García, E. (2008). Data mining in course management systems: moodle case study and tutorial. Computers & Education, 51, 368–384.
Straub, D., Limayem. M., Karahanna-Evaristo, E. (1995). Measuring system usage: implications for IS theory testing. Management Science, 41, 1328–1342.
Urwin, J. (2011). Engagement with virtual learning environments: a case study across faculties. Blended Learning in Practice, January 2011, 8–21.
Walld�n, S. (2013). What does user acceptance mean? Work in progress.Wood, D.F. (2003). ABC of learning and teaching in medicine: problem based learning. British Medical Jour-
nal, 326, 328–330.
S. Walldén graduated in Eduction (M. Ed.) and Interactive Technology (Lic. Phil.) from University of Tampere, Finland. She is a Ph.D. student at School of Information Sciences, University of Tampere. Her reserach interests include usability, smart envi-ronments, health information systems, and technology adoption.
E. Mäkinen graduated in Computer Science (Ph. D.) from University of Tampere, Fin-land. He is a professor of Computer Science at School of Information Sciences, Univer-sity of Tampere. His reserach interests include algorithmics and formal languages.
Edukacinių duomenų tyryba ir probleminis mokymasisSari WALLDÉN, Erkki MÄKINEN
Straipsnyje nagrinėjami virtualiųjų mokymosi sistemų generuojami transakciniai vartotojų duo-menys, kuriais siekiama ištirti, ar besimokantieji taiko probleminį mokymosi metodą. Transakcinių duomenų analizė yra naudinga siekiant išsiaiškinti mokymosi medžiagos naudingumą, įdomumą besimokantiesiems. Naudojantis sukaupta informacija, galima ne tik skaičiuoti prisijungimų prie sistemos dažnumą ar trukmę, bet ir stebėti įvairias besimokančiųjų veiklas. Straipsnyje pristatomas longitudinis tyrimas, sukaupti transakciniai vartotojų duomenys apdorojami pasitelkus SPY US programinę įrangą. Tyrime pagrindinis dėmesys skiriamas transakcinių duomenų analizei, siekia-ma patobulinti probleminį mokymosi metodą, taikant jį mokymosi įgūdžiams nustatyti pasitelkus virtualiuosius pacientus.