

Educational assessments in Korea - UNESCO...
55
Educational assessments in Korea
Transcript of Educational assessments in Korea - UNESCO...

Educational assessments in Korea

Education in Korea: school system

Central Level
Ministry of Education
Base Level
183 District Office of Education
Metropolitan and Provincial Office of Education
Great – Sphere Level
Metropolitan ( 8 )
Provincial ( 9 )
Seoul, Pusan, Taegu, Incheon, Kwangju, Taejeon, Ulsan, Sejong
Gyunggi, Kangwon, Chungbuk, Chungnam, Chonbuk, Chonnam,
Kyungbuk, Kyungnam, Jeju
Organization of Educational Administration

0.0 0.0
0.4 0.5 0.6 0.5 0.5
0.3 0.6
0.6 0.6
1.0 1.0 1.0 0.8 0.9 1.0 1.0
0.8 1.0 0.9 0.9
1.9
2.5
1.5 1.3
1.6 1.8 1.8 1.8
2.0 1.9 1.8
0.0
0.5
1.0
1.5
2.0
2.5
3.0
1990 1995 2000 2005 2006 2007 2008 2009 2010 2011 2012
Primary Lower Secondary Upper Secondary
17.4 19.2
20.9 21.9 22.9 24.4
25.7 26.9 27.9 27.5 29.2
30.9 32.2 33.3 34.5 35.7 36.8 37.3 32.3
34.0 35.3
36.6 37.2 38.0 39.0 39.9 40.2
10.0
15.0
20.0
25.0
30.0
35.0
40.0
45.0
2005 2006 2007 2008 2009 2010 2011 2012 2013
Primary Lower Secondary Upper Secondary
35.8
31.8 30.9 30.2
29.2 27.8
26.6 25.5
24.3 23.2
38.0 35.3 35.3 35.0 34.7 34.4 33.9
33.0 32.4 31.7
42.7
32.7 32.5 33.1 33.7 34.2
33.7 33.1 32.5 31.9
20.0
23.0
26.0
29.0
32.0
35.0
38.0
41.0
44.0
2000 2005 2006 2007 2008 2009 2010 2011 2012 2013
Primary Lower Secondary Upper Secondary
Various education indexes in Korea
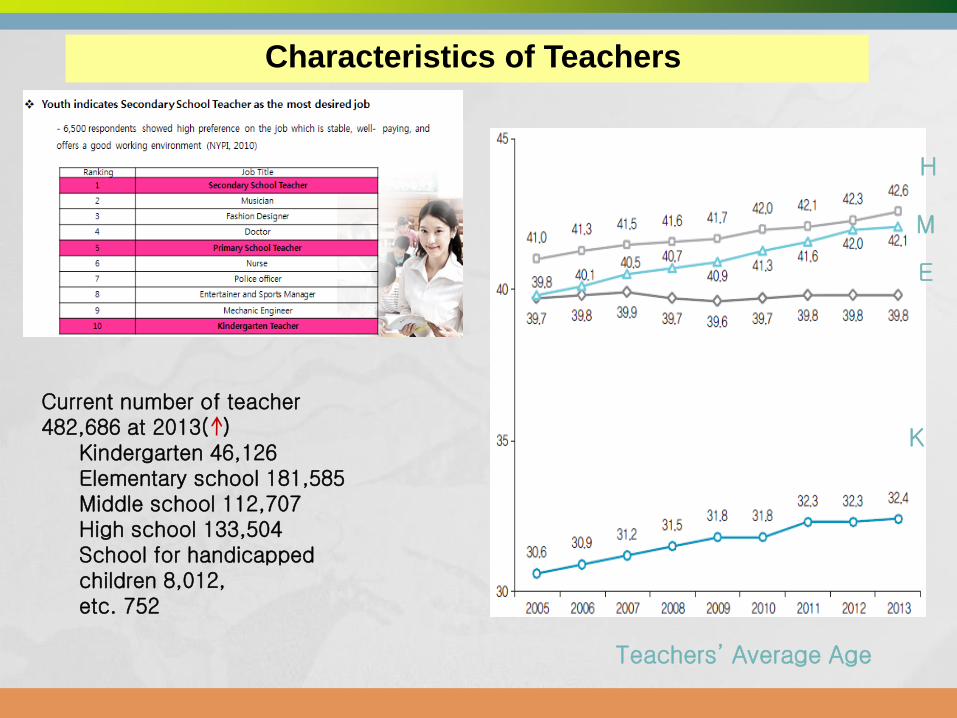
Current number of teacher 482,686 at 2013( )
Kindergarten 46,126Elementary school 181,585Middle school 112,707 High school 133,504School for handicapped children 8,012, etc. 752
K
E
M
H
Teachers’ Average Age
Characteristics of Teachers

Established on January 1, 1998 under the KICE Act
Government-funded educational research institution
Goal:
Research carried out by KICE covers
the National Curriculum and educational evaluation, the improvement of teaching and learning techniques, development and authorization of textbooks, and the implementation of national-level educational
testing.
To contribute to the qualitative improvement of primary and secondary
education and the nation’s educational development through the research,
development and implementation of curriculum and educational evaluations.
Introduction of KICE

Research & Development
Curriculum
Educational Evaluation
Teaching &
Learning
Primary & Secondary Education
Textbook Authorisation
Achievement
Test, CSAT, etc.
Operating Central
Teaching & Learning Centre
National Education
Policy
Feedback
Input
Implementation & Management
Leader of Public Education inKnowledge-based Society
Adjusting
Social Change
&
Reflecting
User
Requirements
Constructing
Worldwide
Education
Network
Management System

Student Assessments in Korea
School level - Teacher
Metropolitan/Provincial Offices of Education
- Pre-CSAT- Learning Diagnostic Test
National level-NAEA-CSAT
International level-PISA-TIMSS-ICILS

Types of Assessment
whom: school, teacher, student, policy maker
area : cognitive, emotional, behavioral
function(time): diagnostic, formative, summative
time limit: Power test or Speed Test

Purpose of Assessment
Improving the educational objectives or teaching
and learning method
Finding strength and weakness of learners and
reflecting in teaching and learning
Learning/career counseling
Selecting/Assigning data application

An accountability assessment intended to ensure the responsibility of schools for our students’ academic performance and monitor the quality of the K-12 education
Conducted annually as a tool for quality management of school educational achievements at the national level
Census test for all students in 6th, 9th, and 11th grades
since 2008~ 2011
National Assessment of Educational Achievement(NAEA)
6th graders who take social studies and science are selected by random sampling in 2012.

NAEA
Purposes of NAEA
NAEA
DIAGNOSING
Academic
achievement
PROVIDING
Data and
information
IMPROVING
Teaching and
learning
EXPLORING
New research
design and
methods
ENHANCING
School’s
accountability

To diagnose the educational achievements of elementary, middle and high school students and the trends of the achievements systematically and scientifically.
To provide data and information for enhancement of curriculum
To improve the teaching and learning, monitoring the quality of education
To enhance the accountability of schools and support school education
To guide the school towards better assessment methods and explore new research design and methods
The Purposes of NAEA

Enforcement Decree of the Act (November 17, 2008)
Act on the Disclosure of Information of Education-related Institutions (May 25, 2007)
“Zero Below-Basic Plan (2008~2012)”“Upward Equalization”
- The nation should perform NAEA for the all students compulsorily every year.(except Elementary school)
- Individual schools should announce the results in public.
Sample-based test 2008 Census test for all the students
Change of NAEA

Grades Subjects Contents
9th grade
Korean language, Social Studies, Mathematics,
Science, English, and Questionnaires
All the content covered from the 7th to the 9th
grade, 1st semester
11th grade Korean language,
Mathematics, English, and Questionnaires
All the content covered in the 10th grade
* Social Studies and Science for 6th grade are assessed in a sample survey(since 2012)
. Assessment Framework
Assessing academic achievement based on national curriculum
16

Achievement Standards:
- Statements specifying the objectives and content of the national curriculum enough to guideline in teaching and learning

Reviewing, revising and supplementing achievement and assessment standards
Setting a guideline for item development
Appointing and training item writers
Developing items by the item writers
Reviewing, revising, and supplementing the item by reviewers
Selecting the items, assembling tests and printing booklets
Deciding upon the assessment tools for NAEA
Steps of Developing NAEA test
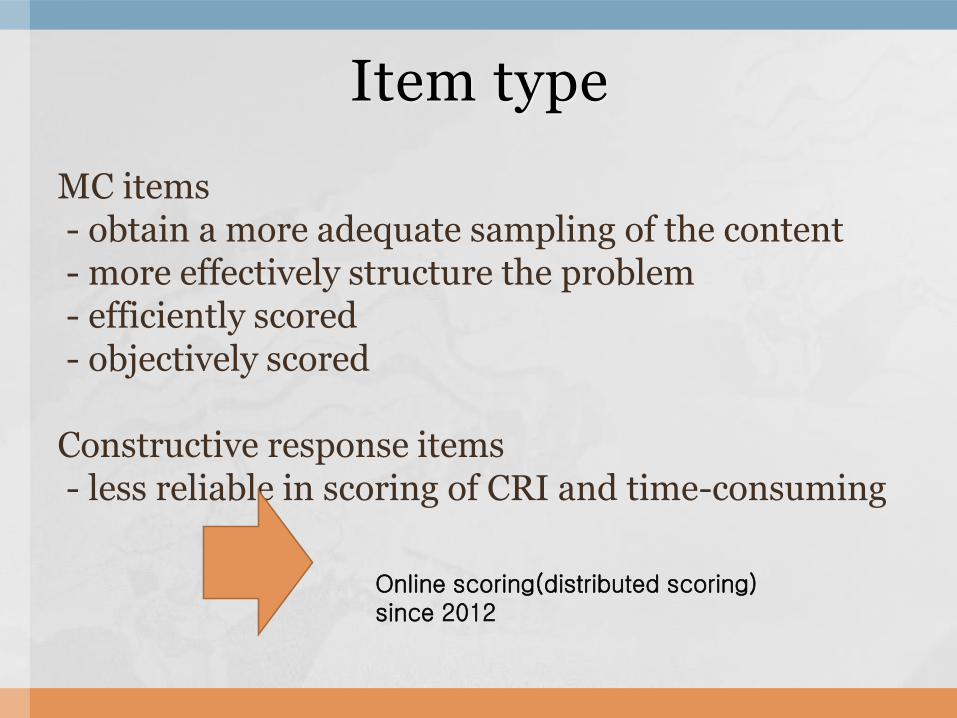
MC items- obtain a more adequate sampling of the content- more effectively structure the problem- efficiently scored- objectively scored
Constructive response items- less reliable in scoring of CRI and time-consuming
Item type
Online scoring(distributed scoring) since 2012

NAEA Survey
Survey of educational contextual variables to analyze the relationship with academic achievement
- School Features
- School Facilities
- School-Level Curriculum Management
- School Climate
SCHOOLS
- Personal Background
- Teaching Activities Related to Each Subject
- Job’s SatisfactionTEACHERS
- Personal and Family Background
- Extracurricular Activities
- Learning Method and Attitude
- School Life
- Learning Related to Each Subject
STUDENTS
20
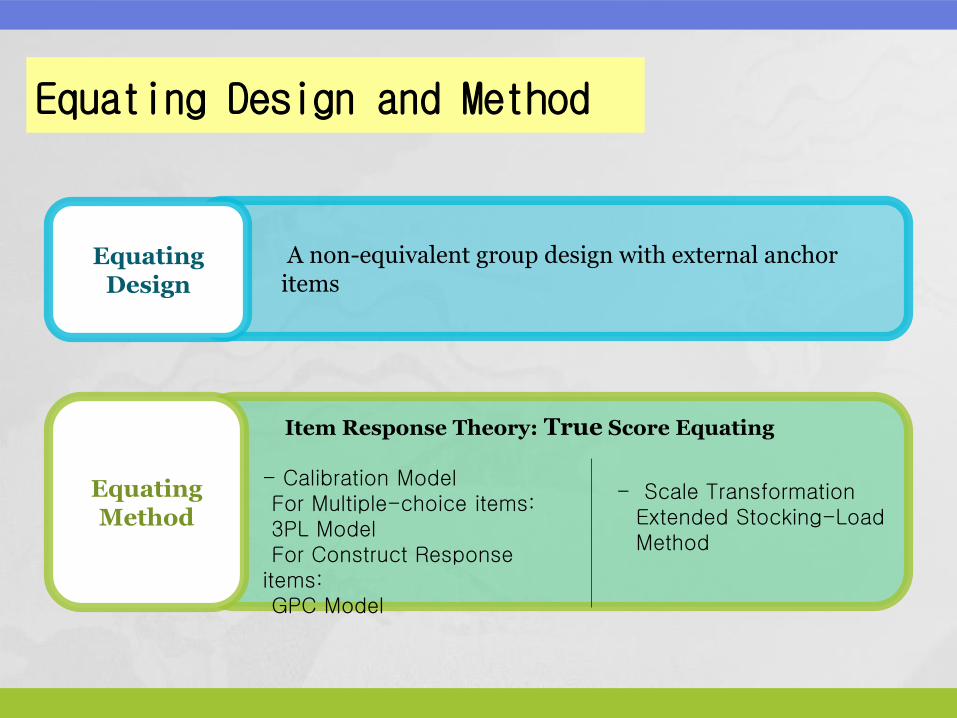
A non-equivalent group design with external anchor items
Item Response Theory: True Score Equating
Equating Method
Equating Design
- Calibration Model For Multiple-choice items: 3PL Model For Construct Response
items: GPC Model
- Scale Transformation Extended Stocking-Load Method
Equating Design and Method

Advanced level
Proficient level
Basic level
Below-Basic level
Standard Setting
Cut-scores to divide achievement
levels Performance Level
Descriptions
Advanced cut-off score
Proficient cut-off score
Basic cut-off score
Standard Setting

• Produce scale score and achievement level
• Raw Score → Scale Score → Performance Level
• Report the national card of educational achievement level for each subject in each grade
• No report of any of norm referenced interpretation such as rank, percentile, standard score, etc.
Scoring and reporting

Achievement Levels of NAEA
ADVANCED
Level
PROFICIENT
Level
BASIC
Level
Superior academic performance of required
knowledge and skills
(Above 80% reached to the desired performance that
must be achieved in each content and grade )
Solid academic performance of required
knowledge and skills
(50 – 80% reached to the desired performance that
must be achieved in each content and grade )
Partial mastery of required knowledge and skills
(20 – 50% reached to the desired performance that
must be achieved in each content and grade )
BELOW- BASIC
Base Line of basic academic achievement

NAEA
Achievement Progress in Five Subjects: Grade 6 (2009 ~ 2012)
44.836.2
42.1
32.2
46.2 44.4
61.5
49.858.6
40.831.1
43.5
15.0 17.1 17.2 16.1
35.3
42.5
40.852.5 24.6 29.4
25.9
26.6
21.4
39.1 58.540.9
69.4 66.171.2 74.2
17.6 20.0 16.4 14.7
28.0 24.7
11.2
22.4 18.9 19.2
9.214.2 13.8 14.7 10.9 9.0
2.3 1.20.6 0.5
1.31.5
1.3
1.21.0 0.9
1.2
1.5 1.8 2.10.7 0.8
60
40
20
0
20
40
60
80
'09 '10 '11 `12 '09 '10 '11 `12 '09 '10 '11 `12 '09 '10 '11 `12 '09 '10 '11 `12
Korean Language Social Studies Mathematics Science English
Percentage(%)

NAEA
Achievement Progress in Five Subjects: Grade 9 (2009 ~ 2012)
51.7 49.9 50.3 52.5 50.0 46.9 49.1 49.0
34.8 37.744.0
50.0
39.2 36.943.9 44.3 45.1 42.4 38.5
45.9
17.1 23.131.0
31.1
13.5 16.6 14.618.9
21.421.6
20.616.6
19.719.9
17.3 13.5
26.125.4 32.2
27.9
26.5 23.717.2 15.2
29.0 30.1 29.6 26.632.9 34.6 31.5 29.8 33.4 35.0 33.7 37.2
23.828.3 28.0
23.9
4.63.2
1.41.0
7.6 6.5 6.75.0
10.9 6.14.0
3.4
7.7 8.15.1
4.8
5.03.9 1.3
2.2
60
40
20
0
20
40
60
80
'09 '10 '11 `12 '09 '10 '11 `12 '09 '10 '11 `12 '09 '10 '11 `12 '09 '10 '11 `12
Korean Language Social Studies Mathematics Science English
Percentage(%)
NAEA
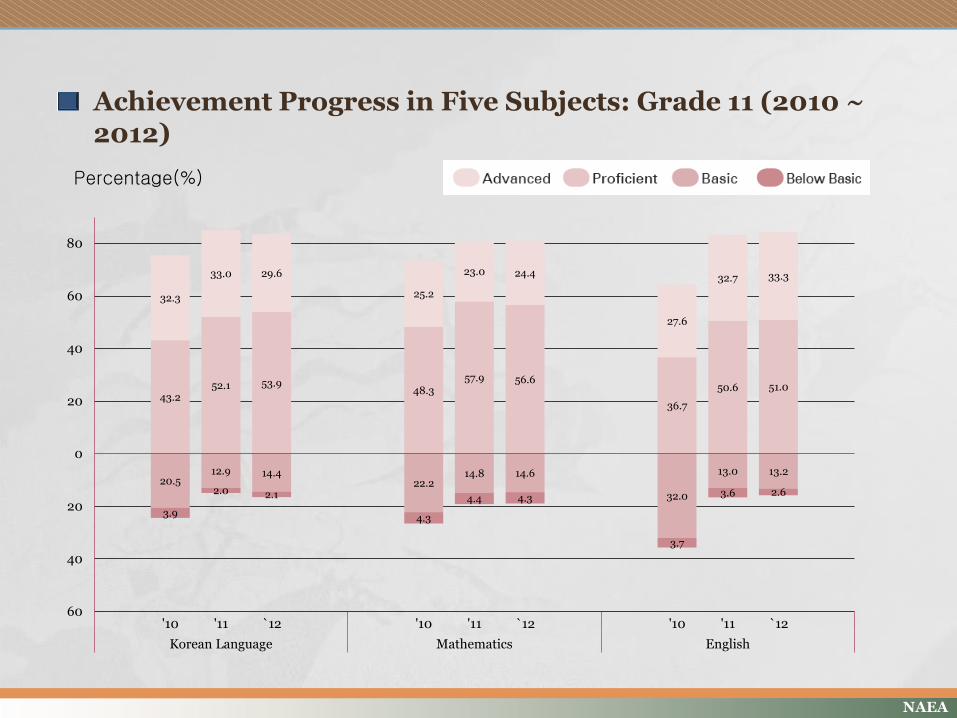
Achievement Progress in Five Subjects: Grade 11 (2010 ~ 2012)
Percentage(%)
43.252.1 53.9
48.357.9 56.6
36.7
50.6 51.0
32.3
33.0 29.6
25.2
23.0 24.4
27.6
32.7 33.3
20.512.9 14.4
22.214.8 14.6
32.0
13.0 13.2
3.9
2.0 2.1
4.3
4.4 4.3
3.7
3.6 2.6
60
40
20
0
20
40
60
80
'10 '11 `12 '10 '11 `12 '10 '11 `12
Korean Language Mathematics English

Supporting system for low-performing schools
Main Strategy for SFI(Schools for Improvement)
Administrative and financial supports are
provided by designating schools where below-basic
students are
concentrated as SFI.
The government’s school supporting policies,
namely “School for Improvement(SFI) ” turned out to
be quite successful

Outcomes of “School For Improvement” Policy (2009 ~ 2012)
2.8
2.1
1.1 1.2
1.7 1.5
0.8 0.7
0.0
0.5
1.0
1.5
2.0
2.5
3.0
2009 2010 2011 2012
(%)
YEAR
11.0
7.1
3.9 3.9
6.4
4.2
2.2 2.2
0.0
2.0
4.0
6.0
8.0
10.0
12.0
2009 2010 2011 2012
(%)
YEAR
18.4
10.5
8.1
6.8 5.6 3.5
3.1 2.9
0.0
4.0
8.0
12.0
16.0
20.0
2009 2010 2011 2012
(%)
YEAR
6th 9th
11th
29

Change of percentage of below-basic students - average % of all subjects
Provided by MOE(2013)

Student Report for high school student
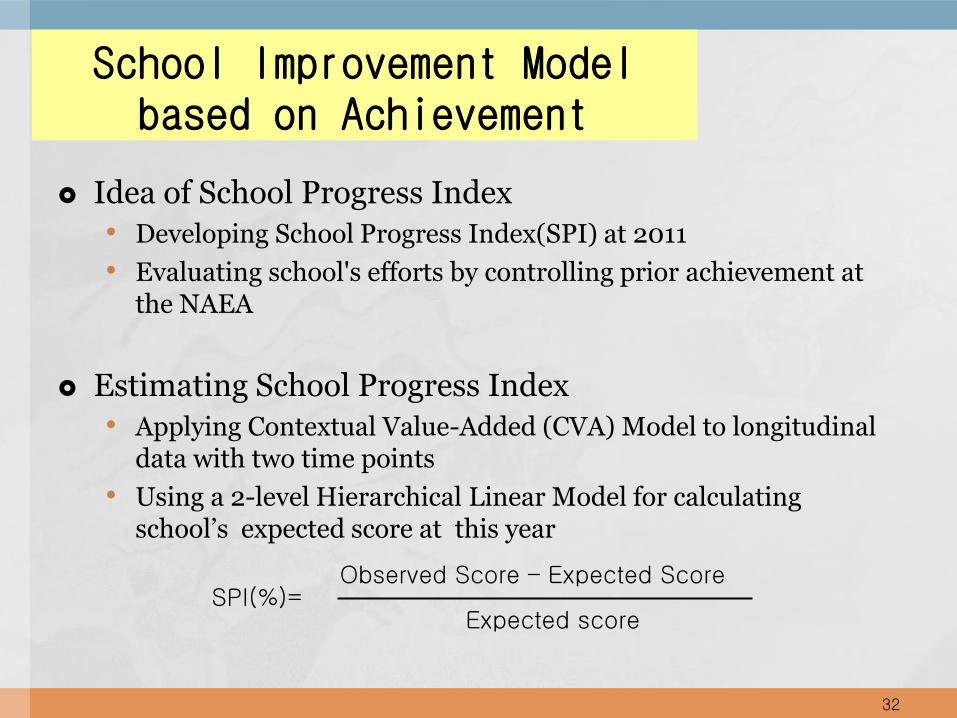
School Improvement Model based on Achievement
Idea of School Progress Index
• Developing School Progress Index(SPI) at 2011
• Evaluating school's efforts by controlling prior achievement at the NAEA
Estimating School Progress Index
• Applying Contextual Value-Added (CVA) Model to longitudinal data with two time points
• Using a 2-level Hierarchical Linear Model for calculating school’s expected score at this year
32
SPI(%)=Observed Score – Expected Score
Expected score

Reporting Of Results
Uploading achievement levels and SPI on “School Reporter” for the public
• Based on Public Announcement Law of Education Information (2007; 2008)
• School Reporter: www.schoolinfo.go.kr
Achievement levels of all schools since 2010• Elementary, Middle, & High schools
School Progress Index for all middle & high schools since 2011


Key findings from Achievement Results
Academic Achievement of students in all levels have
been improved for recently 4 years.
Proportion of Below-Basic students tends to decrease
dramatically every year for all subjects.
Gender differences decreased in middle and high
school.
Regional differences among Advanced groups deepened
in English.
35

Use of the results
Provided by KICE

NAEA
For Students
For Schools
Discover academic performance at the national level Understand the strengths and weaknesses of domains for each subject Ask for opportunity to learn
Discover the achievement differences among students and among subjects
Improve methods of teaching and learning Calculate the indicators for input, process, and output for educational
academic progress

NAEA
For Publics (educators, researchers, etc)
Research various themes and methodologies to reanalyze the data
Analyze relationship among background variables affecting academic performance and compare with international results
Contribute to academic findings and use important basic data for establishing educational policies

NAEA
For Education Policy
Discover academic achievement levels of each school within the district
Investigate the differences in academic performance based on the characteristics of schools based on contextual variables
Support schools via budgets and programs for improving academic achievement
Examine the effectiveness of the support system Discover academic achievement levels of all students in the
relevant school year Set up educational policies and plans for a support system
including criteria, budget, and programs Inspect accountability of schools and offices of education Improve the national curriculum and methods of teaching and
learning

NAEA
Implications from NAEA
Inspecting accountability of schools and offices of
education
Improving the national curriculum and methods of
teaching and learning
Research various themes and methodologies to
reanalyze the data
Analyzing relationship among background variables
affecting academic performance and compare with
international results
Contributing to academic findings and use important
basic data for establishing educational policies

College Scholastic Ability Test (CSAT)

What is the CSAT?
Key characteristics
- College Scholastic Ability Test
- An assessment tool designed to measure students’ academic readiness for college education
- An achievement test that also measures high-order thinking skills
Administration
- The CSAT is administered once a year (in Nov.).
- Commissioned by the Ministry of Education, KICE develops and implements the test each year.

Test composition
5 Tests & 7 Areas of Study
Test-takers can select all or some of the 5 tests
Korean Language
Math English Inquiries
Social Studies
Sciences
Vocational Education
2nd Foreign Languages/
Chinese Characters & Classics

Tests & Subjects
Test Associated National Curriculum subjects
Number of Items
Testing Time(min)
Item type
KoreanLanguage
Type A Speech & Writing I, Reading & Grammar I, Literature I
45 80 Multiple choiceType B Speech & Writing II, Reading &
Grammar II, Literature II
Math
Type A Mathematics I, Pre-Calculus and Pre-Statistics
30 100
Multiple choice(70%)
short answer (30%)
Type BMathematics I, Mathematics Ⅱ,Integration and Statistics, Geometry and Vector
EnglishEnglish, English I
English II,
45(including
22 listening
items)
70 Multiple choice
- The two tests types for Korean, Math, & English are newly introduced (CSAT 2014)

Tests Subjects (cont.)
Test Subjects (NC)Number of Items
Testing Time(min)
Item type
Inquiries
Social Studies
Life & Ethics, Ethics & Thought, Korean History, Korean Geography, World
Geography, East Asian History, World History, Law & Politics, Economics,
Society & Culture (up to 2 of the 10)
20per
subject
30 per subject
Multiple choiceSciences
Physics I, Chemistry I, Life Science I, Earth Science I, Physics II, Chemistry II,
Life Science II, Earth Science II(up to 2 of the 8)
Vocational Education
Agricultural Bio Industry, Industry, Commerce & Information, Fishery &
Shipping, Home Economics & Business(1 of the 5)
2nd Foreign Languages/Chinese
Characters and Classics
German I, French I, Spanish I, Chinese I, Japanese I, Russian I, Arabic I, Basic
Vietnamese, Chinese Characters and Classics
(1 of the 9)
30per
subject40 min Multiple
choice
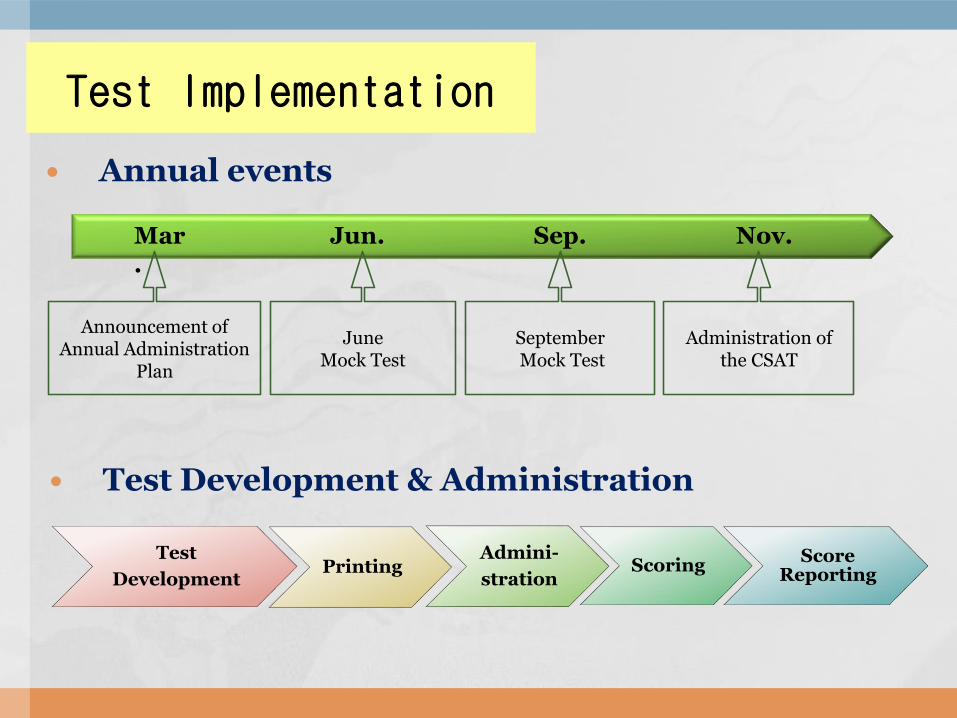
Test Implementation
Annual events
Test Development & Administration
Announcement of Annual Administration
Plan
JuneMock Test
SeptemberMock Test
Administration of the CSAT
Mar.
Jun. Sep. Nov.
Test
DevelopmentPrinting
Admini-
strationScoring
Score Reporting

Consistency with revision of the national curriculum and textbook
Opening of the various test results to public
Secondary analysis of the CSAT results
Role of the CSAT results in recent changes of “Admission Officer” system for university/college admission
Future Challenges for CSAT

International Studies on Student Assessment
Problem

PISA 2000(43countries)
PISA2003(41 countries)
PISA 2006(57 countries)
PISA 2009(65countries)
PISA 2012
(65countries)
Reading
Mean score
525 534 556 539 536
Rank 6 2 1 2~4 3~5
Math
Mean score
547 542 547 546 554
Rank 2 3 1~4 3~6 3~5
Science
Mean score
552 538 522 538 538
Rank 1 4 7~13 4~7 5~8
Trends of Korean Students in PISA

Percentage of students at different levels

International Studies on Student Assessment

Trends of Korean Students in TIMSS
4th Grades
1995 2 581 1 576
2011 2 605 1 587
1995 3 581 4 546
1999 2 587 5 549
2003 2 589 3 558
2007 2 597 4 553
2011 1 613 3 560
8th Grades
TIMSS
Mathematics Science
RankMean Score
RankMeanScore

Roles of PISA/TIMSS and Its Implication _1
They are not high stakes assessments of a big influence in Korean
society. Korea has generally achieved good results from
international assessment such as PISA and TIMSS, so that its effect
did not lead to an extensive educational reform.
Korea reflected part of the results on establishment of
educational policies or improvement of curriculum,
teaching and learning.
For example, decreased science performance in PISA 2006 has an
impact of conducting a policy to strengthen science education to
improve primary and secondary science and mathematics
education.

Roles of PISA/TIMSS and Its Implication _2
Continuously the performance of students has been standardized
upward.
- developing educational excellence program
Challenges on affective domain
Reading (2009)
- Lower affective properties such as reading enjoyment, the diversity
reading materials
Mathematics (2012)
- Lower affective properties such as interest / Self-concept / Self-
confidence/ Self-efficacy/ Motivation/ Anxiety
Science (2006)
- Lower affective properties such as interest / self-concept/
Motivation


