Educational and Psychological Measurement Kindermann... · Educational and Psychological...
34
http://epm.sagepub.com/ Measurement Educational and Psychological http://epm.sagepub.com/content/69/3/493 The online version of this article can be found at: DOI: 10.1177/0013164408323233 14 November 2008 2009 69: 493 originally published online Educational and Psychological Measurement Ellen A. Skinner, Thomas A. Kindermann and Carrie J. Furrer Participation in Academic Activities in the Classroom Emotional Conceptualization and Assessment of Children's Behavioral and A Motivational Perspective on Engagement and Disaffection : Published by: http://www.sagepublications.com at: can be found Educational and Psychological Measurement Additional services and information for http://epm.sagepub.com/cgi/alerts Email Alerts: http://epm.sagepub.com/subscriptions Subscriptions: http://www.sagepub.com/journalsReprints.nav Reprints: http://www.sagepub.com/journalsPermissions.nav Permissions: http://epm.sagepub.com/content/69/3/493.refs.html Citations: What is This? - Nov 14, 2008 Proof - May 7, 2009 Version of Record >> at PORTLAND STATE UNIV on October 27, 2011 epm.sagepub.com Downloaded from
Transcript of Educational and Psychological Measurement Kindermann... · Educational and Psychological...
http://epm.sagepub.com/Measurement
Educational and Psychological
http://epm.sagepub.com/content/69/3/493The online version of this article can be found at:
DOI: 10.1177/0013164408323233
14 November 2008 2009 69: 493 originally published onlineEducational and Psychological Measurement
Ellen A. Skinner, Thomas A. Kindermann and Carrie J. FurrerParticipation in Academic Activities in the Classroom
EmotionalConceptualization and Assessment of Children's Behavioral and A Motivational Perspective on Engagement and Disaffection :
Published by:
http://www.sagepublications.com
at: can be foundEducational and Psychological MeasurementAdditional services and information for
http://epm.sagepub.com/cgi/alertsEmail Alerts:
http://epm.sagepub.com/subscriptionsSubscriptions:
http://www.sagepub.com/journalsReprints.navReprints:
http://www.sagepub.com/journalsPermissions.navPermissions:
http://epm.sagepub.com/content/69/3/493.refs.htmlCitations:
What is This?
- Nov 14, 2008Proof
- May 7, 2009Version of Record >>
at PORTLAND STATE UNIV on October 27, 2011epm.sagepub.comDownloaded from
AMotivational Perspective
on Engagement and Disaffection
Conceptualization and Assessment
of Children’s Behavioral and
Emotional Participation in
Academic Activities in the Classroom
Ellen A. Skinner
Thomas A. KindermannPortland State University, Oregon
Carrie J. FurrerNPC Research
This article presents a motivational conceptualization of engagement and disaffection:
First, it emphasizes children’s constructive, focused, enthusiastic participation in the
activities of classroom learning; second, it distinguishes engagement from disaffec-
tion, as well as behavioral features from emotional features. Psychometric properties
of scores from teacher and student reports of behavioral engagement, emotional
engagement, behavioral disaffection, and emotional disaffection were examined using
data from 1,018 third through sixth graders. Structural analyses of the four indicators
confirm that a multidimensional structure fits the data better than do bipolar or unidi-
mensional models. Validity of scores is supported by findings that teacher reports are
correlated with student reports, with in vivo observations in the classroom, and with
markers of self-system and social contextual processes. As such, these measures cap-
ture important features of engagement and disaffection in the classroom, and any
comprehensive assessment should include markers of each. Additional dimensions are
identified, pointing the way to future research.
Educational and
Psychological Measurement
Volume 69 Number 3
June 2009 493-525
© 2009 SAGE Publications
10.1177/0013164408323233
http://epm.sagepub.com
hosted at
http://online.sagepub.com
Authors’ Note: We express our gratitude to the Motivation Research Group—especially, Edward Deci
and Richard Ryan. We would also like to appreciate James Wellborn and James Connell for their earlier
work on conceptualization and measures of engagement. In terms of the research project, we thank the
Brockport School District and its superintendent, principals, teachers, students, and parents for their gen-
erous participation. The hard work and good spirits of the research team members are gratefully
acknowledged, including Jeff Altman, Michael Belmont, Helen Dorsett, Matt Hall, Jennifer Herman,
Marianne Miserandino, Brian Patrick, Cara Regan, Hayley Sherwood, and Peter Usinger. We acknowl-
edge support from the W. T. Grant Foundation, from Research Grant No. HD19914 from the National
Institute of Child Health and Human Development, and from Training Grant No. 527594 from the
National Institutes of Mental Health. Address correspondence to Ellen Skinner, Psychology Department,
Portland State University, PO Box 751, Portland, OR 97207-751; e-mail: [email protected].
493
at PORTLAND STATE UNIV on October 27, 2011epm.sagepub.comDownloaded from

Keywords: academic engagement; disaffection; achievement motivation; classroom
participation; emotional engagement; on-task behavior
In recent years, enthusiasm for the concept of academic engagement has emerged
from many lines of theory, research, and practice (Fredricks, Blumenfeld, &
Parks, 2004). At its most general, engagement refers to the quality of a student’s
connection or involvement with the endeavor of schooling and hence with the peo-
ple, activities, goals, values, and place that compose it. Educators are attracted to
the concept because (compared to status indicators like student SES or race)
engagement represents a potentially malleable proximal influence shaping chil-
dren’s academic retention, achievement, and resilience. Despite emerging consen-
sus about the big picture, however, work on engagement, because it reflects
multiple perspectives, has brought with it a profusion of conceptual and operational
definitions (Fredricks et al., 2004; Jimerson, Campos, & Greif, 2003; Libbey, 2004;
O’Farrell & Morrison, 2003).
At the core of many conceptualizations is a construct that captures the quality of
students’ participation with learning activities in the classroom, ranging from ener-
gized, enthusiastic, focused, emotionally positive interactions with academic tasks
to apathetic withdrawal. This feature of engagement is of interest to educational
researchers because it reflects the kind of interactions with activities and materials
that should produce (or interfere with) actual learning. Even if youth stay emotion-
ally attached or physically present in school, unless they become engaged with
learning opportunities, their academic careers cannot be considered a success. This
facet of engagement is especially important to motivational researchers, many of
whom consider it to be the outward manifestation of a motivated student (e.g.,
Connell & Wellborn, 1991; Deci & Ryan, 1985, 2000; Skinner, Kindermann,
Connell, & Wellborn, in press; Wentzel, 1993).
In this article, we aim to contribute to ongoing discussions about the meaning of
engagement in three ways. First, we present a conceptualization of engagement in
the classroom that fits within motivational traditions, and distinguishes engagement
from disaffection, as well as behavioral features from emotional features. Second,
we describe two brief assessments (teacher reports and student reports) designed to
capture these four indicators of engagement and we test the psychometric and struc-
tural properties of their scores in a sample of third through sixth graders. Third, we
examine the validity and utility of scores from these measures by analyzing their
connections with each other and with in vivo observations of engagement in the
classroom, and by exploring their links to a set of self-system and social contextual
factors. We do not argue that this conceptualization represents a comprehensive
overview of all indicators of engagement, only that the features it includes are core
indicators of engagement in the classroom and meet the definitional criteria specified
in recent authoritative reviews of the concept (Fredricks et al., 2004).
494 Educational and Psychological Measurement
at PORTLAND STATE UNIV on October 27, 2011epm.sagepub.comDownloaded from

Conceptualization and Assessment ofEngagement Versus Disaffection
The conceptualization of engagement has been part of a larger model of human
motivation developed and elaborated over the last several decades (Connell &
Wellborn, 1991; Deci & Ryan, 1985, 2000; Skinner, 1991; Wellborn, 1991). To
use the model’s conceptualization of engagement, it is not necessary to agree with
its organismic and contextual assumptions about fundamental human needs. How-
ever, research inspired by these assumptions (as well as research conducted outside
this framework) has shown that children’s active enthusiastic effortful participation
in learning activities in the classroom predicts their achievement in and completion
of school (e.g., Connell, Halpern-Felsher, Clifford, Crichlow, & Usinger, 1995;
Connell, Spencer, & Aber, 1994; Pierson & Connell, 1992; Skinner, Wellborn, &
Connell, 1990; Skinner, Zimmer-Gembeck, & Connell, 1998; see Fredricks et al.,
2004, for a review). This motivational conceptualization has two notable features:
the idea that engagement includes behavioral and emotional participation in the
classroom and the idea that engagement requires a conceptualization of its oppo-
site, which we term disaffection (Connell & Wellborn, 1991).
Engaged Behavior and Engaged Emotion
Like other motivational conceptualizations, ours includes key markers of
engaged behaviors, including effort exertion and persistence. In addition, we
include indicators of mental effort, such as attention and concentration. This aspect
of engagement has been referred to as on-task behavior, academic behavior, and
class participation. Unlike some conceptualizations of engagement, ours also
includes engaged emotions. These do not encompass the entire range of positive
academic emotions (Meyer & Turner, 2002; Pekrun, Goetz, Titz, & Perry, 2002;
Schutz & DeCuir, 2002; Weiner, 1985), only those that reflect energized emotional
states, such as enthusiasm, interest, and enjoyment. As opposed to more compre-
hensive theories of interest (Hidi, Renninger, & Krapp, 2004; Schiefele, 2001) that
include personal and situational interest and an analysis of the factors that catch
and hold interest, our conceptualization of engagement includes only the state of
being caught and held.
Disaffected Behavior and Disaffected Emotion
Conceptually, the opposite of engagement is disengagement, which implies the
absence of engagement, including the absence of effort or persistence. Hence, dis-
engagement is typically operationalized as passivity, lack of initiation, and giving
up (Murdock, 1999; Vallerand, 1997), sometimes accompanied by the emotions of
Skinner et al. / A Motivational Perspective on Engagement and Disaffection 495
at PORTLAND STATE UNIV on October 27, 2011epm.sagepub.comDownloaded from
dejection, discouragement, and apathy (as depicted in theories of learned helpless-
ness; e.g., Peterson, Maier, & Seligman, 1993). However, there are other pathways
to disengagement besides helplessness. Participation can also be undercut by
coercion (Deci & Ryan, 1985), exclusion (Merton, 1953; Newmann, 1991), or
boredom. A fuller account is especially important in describing disengagement in
enterprises from which an individual cannot voluntarily exit, such as school. The
normal reaction to helplessness or exclusion is avoidance. However, when physical
withdrawal is prohibited, forms of participation may develop that reflect mental or
emotional withdrawal, such as frustration, disruptive noncompliance, or simply
going through the motions (Finn, Pannozzo, & Voelkl, 1995).
Hence, the motivational conceptualization employs the term disaffection
(Connell & Wellborn, 1991). Disaffected behaviors include the core behaviors of
disengagement—namely, passivity, lack of initiation, lack of effort, and giving up.
In addition, they include mental withdrawal and ritualistic participation, such as
lack of attention and going through the motions. Disaffected emotions include
those that reflect enervated emotion (tired, sad, bored), alienated emotion (frustra-
tion, anger), and pressured participation (anxiety). We expected that the range of
forms of disaffection included might result in a multidimensional construct.
Purposes of the Current Study
Based on a conceptualization of engagement that incorporates behavior and
emotion as well as engagement and disaffection, this study was designed to (a)
examine the structural properties of scores from brief student and teacher reports
of engagement and (b) explore their correlations with one another, as well as with
in vivo observations of engagement in the classroom and with a set of personal and
contextual factors hypothesized to facilitate motivation.
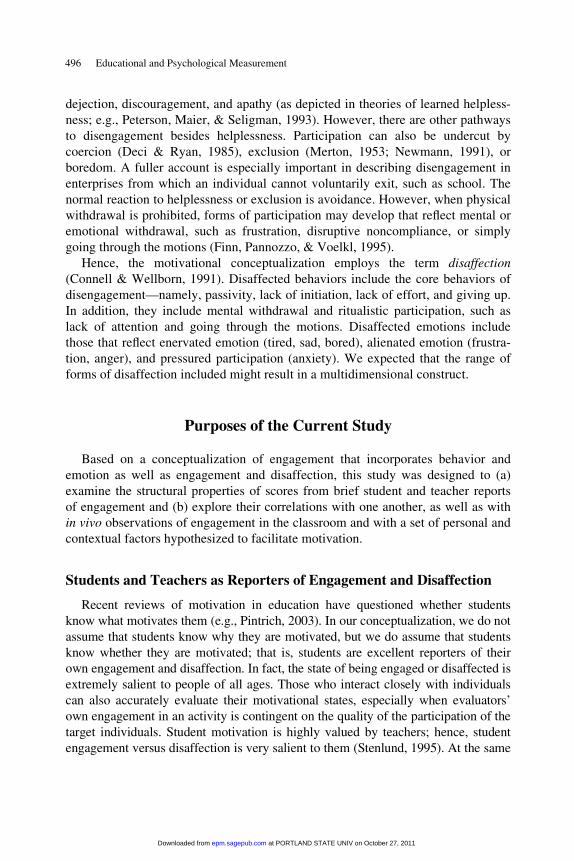
Students and Teachers as Reporters of Engagement and Disaffection
Recent reviews of motivation in education have questioned whether students
know what motivates them (e.g., Pintrich, 2003). In our conceptualization, we do not
assume that students know why they are motivated, but we do assume that students
know whether they are motivated; that is, students are excellent reporters of their
own engagement and disaffection. In fact, the state of being engaged or disaffected is
extremely salient to people of all ages. Those who interact closely with individuals
can also accurately evaluate their motivational states, especially when evaluators’
own engagement in an activity is contingent on the quality of the participation of the
target individuals. Student motivation is highly valued by teachers; hence, student
engagement versus disaffection is very salient to them (Stenlund, 1995). At the same
496 Educational and Psychological Measurement
at PORTLAND STATE UNIV on October 27, 2011epm.sagepub.comDownloaded from
time, however, accurate assessment by teachers is made more difficult if students
attempt to conceal their disaffection by masking their negative emotions or by pre-
senting compliant instead of engaged behaviors.
Structure of Engagement and Disaffection
By assessing all four indicators of engagement, we were able to analyze several
features of its structure. First, we examined whether the item sets designed to tap each
aspect of engagement were unidimensional. We expected that, if multidimensionality
were detected, it would be in emotional disaffection. Second, we examined the struc-
ture among indicators of the four components, as depicted in Figure 1. We tested
whether indicators of the behavioral and emotional features of engagement and
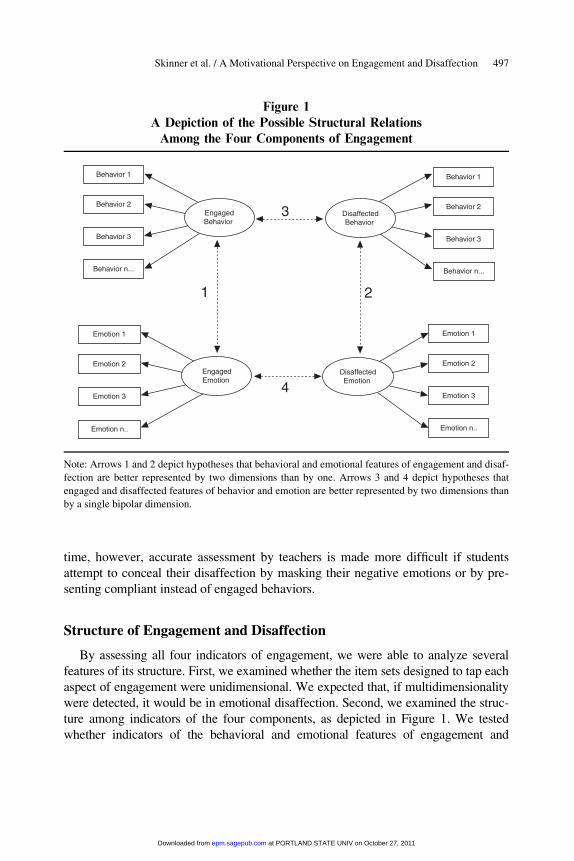
Figure 1
A Depiction of the Possible Structural Relations
Among the Four Components of Engagement
Emotion n..
EngagedEmotion
Behavior 1
Behavior 2
Behavior n...
Behavior 3
Emotion 1
Emotion 2
Emotion 3
EngagedBehavior
1 2
3
4
Emotion 1
Emotion 2
Emotion n..
Emotion 3
DisaffectedEmotion
Behavior 1
Behavior 2
Behavior n...
Behavior 3
DisaffectedBehavior
Note: Arrows 1 and 2 depict hypotheses that behavioral and emotional features of engagement and disaf-
fection are better represented by two dimensions than by one. Arrows 3 and 4 depict hypotheses that
engaged and disaffected features of behavior and emotion are better represented by two dimensions than
by a single bipolar dimension.
Skinner et al. / A Motivational Perspective on Engagement and Disaffection 497
at PORTLAND STATE UNIV on October 27, 2011epm.sagepub.comDownloaded from
disaffection are better represented by two dimensions or by a single dimension
(arrows 1 and 2 in the figure). We expected that they would be better represented by
two dimensions that would be highly positively intercorrelated. Next we tested
whether indicators of the engaged and disaffected features of behavior and emotion
are better represented by two dimensions or by a single bipolar dimension (arrows 3
and 4). We expected that they would be better represented by two dimensions that
would be moderately negatively intercorrelated. Finally, we tested markers of all four
components at once, expecting that a model of four interrelated dimensions would
provide a better fit than one- or two-factors models.
Theoretical Rationale for the Structural Hypotheses
It is not intuitively obvious why the components of engagement and disaffection
would not be expected to form a single bipolar construct. The most important rea-
son is that students’ engagement in the classroom does not reflect a stable personal-
ity trait that should consistently express itself across situations and time. Instead,
it is made up of thousands of different interactions between a developing child and his
or her changing assignments on different school subjects and days in a fluctuating
social context. Reports of engagement, which reflect the patterns of such involvement
cumulated over episodes and subjects (e.g., Marks, 2000), would not necessarily be
unidimensional; they would likely be more complex and therefore multidimensional
(Fredricks et al., 2004). However, even without a unidimensional structure, it makes
sense that the components would be related in ways (i.e., behavior and emotion, posi-
tively; engagement and disaffection, negatively) systematic enough to allow a mean-
ingful aggregate to be created. Its lowest point would depict negatively toned
passivity, which could be considered a risk factor for (or the first step of) dropout, and
its highest point would represent enthusiastic energetic participation, found to promote
learning and healthy development. Distinguishable components would also suggest
that other combinations might be of interest (e.g., Finn et al., 1995; Furrer, Skinner,
Marchand, & Kindermann, 2006; Patrick, Skinner, & Connell, 1993).
Correspondence Between Student and TeacherReports of Engagement
Because engagement and disaffection are both observable and salient, we
expected scores from teacher and student reports to be moderately correlated with
each other. Given that behaviors are more easily observable, we expected that
behavioral components would be more highly inter-correlated than emotional com-
ponents. In terms of mean level correspondence, we expected students to be more
optimistic in their reports of their behavioral engagement, compared to teachers’
498 Educational and Psychological Measurement
at PORTLAND STATE UNIV on October 27, 2011epm.sagepub.comDownloaded from

reports; we also expected teachers to overestimate the state of students’ emotional
engagement relative to students’ own reports.
Correlations With In Vivo Observations ofEngagement and Disaffection in the Classroom
Because engagement and disaffection are observable manifestations of motiva-
tion, it is easy to assume that direct observations would be the optimal indicator of
engagement in the classroom. In fact, some researchers have successfully captured
some features of engagement in the classroom through direct observation (e.g.,
Center for the Organization and Restructuring of Schools, 1992, as cited in Marks,
2000). However, taking the entire body of research into consideration, we conclude
that the behavioral features of engagement are more easily captured by direct
observations than the emotional features, and the active features (active on-task
and active off-task) are more easily captured by observations than their passive
counterparts (e.g., Bolstad & Johnson, 1977). That is, it can be difficult to distin-
guish passive behavior that is off-task from passive behavior that is on-task. It can
also be difficult to classify children with a high activity level who show high levels
of both actively engaged and actively disaffected behaviors.
Correlations With Hypothesized Predictors of Motivation
We expected that student engagement and disaffection would be correlated with
indicators of a variety of individual and contextual processes (Fredricks et al.,
2004). Although no study can include markers from all theories of motivation, we
included constructs from several theories focusing on individual factors such as
perceived control (10 different strategy and capacity beliefs; Skinner et al., 1998),
autonomy orientations reflecting four self-regulatory styles (external, introjected,
identified, and intrinsic; Ryan & Connell, 1989), sense of relatedness to four social
partners (teachers, parents, friends, and classmates; Furrer & Skinner, 2003; Lynch
& Cicchetti, 1997), academic optimism and pessimism (Carver & Scheier, 1999;
Peterson et al., 1993), goal orientations (Dweck, 1999b; Eliot, 1999; Nicholls,
1984), and reactions following failure (Dweck, 1999a; Skinner & Wellborn, 1997).
We also included indicators of six motivationally supportive and unsupportive fea-
tures of relationships with teachers and parents—namely, involvement/warmth,
structure, autonomy support, neglect/rejection, chaos, and coercion (Murray &
Greenburg, 2000; Reeve, Jang, Carrell, Jeon, & Barch, 2004; Skinner & Belmont,
1993; Skinner, Johnson, & Snyder, 2005). Each of the constructs has a history of
study in its own right, and taken together, they represent markers of the key con-
structs in the motivational model from which this conceptualization of engagement
and disaffection was drawn.
Skinner et al. / A Motivational Perspective on Engagement and Disaffection 499
at PORTLAND STATE UNIV on October 27, 2011epm.sagepub.comDownloaded from

Method
Participants
Participants comprised 1,018 children who had participated in a 4-year longitu-
dinal study on children’s motivation in school (144 third graders, 342 fourth gra-
ders, 168 fifth graders, and 364 sixth graders, approximately equally divided by
gender). Data were utilized from two measurement points: fall (October) and spring
(May) of Year 3. Students and their 53 teachers, drawn from a public elementary
school in a rural–suburban school district, were predominantly Caucasian, with
approximately 5% of the students identifying themselves as non-White. Student
socioeconomic status, as determined by parents’ level of education and occupation,
ranged between working and middle class (for details, see Skinner et al., 1998).
Procedures and Measures
Trained interviewers administered self-report questionnaires to students in
their classrooms, in three 45-min sessions. For the questionnaires, respondents used
a 4-point Likert-type scale: ranging from 1 (not at all true) to 4 (very true). Nega-
tively worded items were reverse-coded, and items in each scale were averaged.
Score reliability information for each scale, along with 90% confidence intervals
(Barnette, 2005), are included in the tables of descriptive statistics. Note that some of
the internal consistency reliabilities for the four- and five-item student report mea-
sures are below the generally accepted standard of .80, indicating that some of the
correlational results may be attenuated due to measurement error (Henson, 2001).
Behavioral and Emotional Engagement Versus Disaffection
Student report assessment. Each student reported on his or her own (a) beha-
vioral engagement, using five items tapping their effort, attention, and persistence
while initiating and participating in learning activities; (b) behavioral disaffection,
using five items tapping their lack of effort and withdrawal from learning activities
while in the classroom; (c) emotional engagement, using six items tapping their
emotions indicating motivated involvement during learning activities; and (d) emo-
tional disaffection, using nine items tapping their emotions indicating motivated
withdrawal or alienation during learning activities. The items from the current ver-
sion of the student report measure are presented in Appendix A (Wellborn, 1991;
see also Connell et al., 1994; Connell et al., 1995; Furrer et al., 2006; Skinner et al.,
1990; Skinner et al., 1998; Skinner, Furrer, Marchand, & Kindermann, in press).
Teacher report assessment. Each student’s teacher reported on that student’s
(a) behavioral engagement, using four items tapping students’ effort, attention, and
500 Educational and Psychological Measurement
at PORTLAND STATE UNIV on October 27, 2011epm.sagepub.comDownloaded from
persistence while initiating and participating in learning activities; (b) behavioral
disaffection, using four items tapping students’ lack of effort and withdrawal from
learning activities while in the classroom; (c) emotional engagement, using four
items tapping students’ emotions indicating motivated involvement during learning
activities; and (d) emotional disaffection, using four items tapping students’ emo-
tions indicating motivated withdrawal or alienation during learning activities. The
items from the current version of the teacher report measure are presented in
Appendix B (Wellborn, 1991; see also Connell et al., 1994; Connell et al., 1995;
Furrer et al., 2006; Skinner et al., 1990; Skinner et al., 1998; Skinner, Furrer, et al.,
in press).
Individual Motivational Factors
Perceived control in the academic domain. Using 10 scales from the Student
Perceptions of Control Questionnaire (Skinner, Chapman, & Baltes, 1988; Skinner
et al., 1990; Skinner et al., 1998), students reported about their (a) control beliefs,
using 6 items tapping their general expectancies about achieving success and
avoiding school failure; (b) strategy beliefs, using 25 items tapping their beliefs
about the effectiveness of five potential causes for success and failure in school
(effort, ability, powerful others, luck, and unknown); and (c) capacity beliefs, using
16 items tapping their beliefs about the extent to which they have access to the four
known causes (effort, ability, powerful others, luck).
Sense of relatedness. Students completed four items, each regarding their sense
of belonging or connectedness to their teachers, their mothers, their fathers, their
friends, and their classmates (Connell & Wellborn, 1991; Furrer & Skinner, 2003).
Autonomy orientation. The measure of academic autonomy comprised 17 items
that tapped whether children engage in activities for (a) external reasons, or doing
work because of rules or fear of punishment; (b) introjected reasons, or doing work
because one ‘‘should’’ and to avoid negative emotions; (c) identified reasons, or
doing work because of a desire to understand and learn; and (d) intrinsic reasons,
or doing work because it is enjoyable (Ryan & Connell, 1989).
Academic optimism and pessimism. Students responded to 7 items tapping their
optimism (e.g., ‘‘When I have trouble with a problem, I usually get it right in the
end’’) and pessimism (e.g., ‘‘If a problem is really hard, I’ll probably miss it.’’)
about success in academic activities.
Goal orientations. Students responded to eight items reflecting the value that
they place on learning (e.g., ‘‘How much do you care about learning new things in
school?’’) and producing good grades (e.g., ‘‘How much do you care about getting
Skinner et al. / A Motivational Perspective on Engagement and Disaffection 501
at PORTLAND STATE UNIV on October 27, 2011epm.sagepub.comDownloaded from

good grades?’’). Performance avoidance goals were not assessed (Elliot &
McGregor, 2001).
Reactions to academic challenges. Students responded to 20 items about their
reactions when encountering academic difficulties. Four items tapped mastery reac-
tions (e.g., ‘‘When I run into a difficult question, I try even harder’’), five items
tapped giving up (e.g., ‘‘If a problem is really hard, I just quit working on it’’), and
eleven items tapped negative emotional reactions (e.g., ‘‘When I get stuck on a pro-
blem, it really bothers me’’).
Social Contextual Factors
Parent motivational support. Students responded to 16 items depicting their
perceptions of the amount of general support provided by their parents, using three
scales tapping parent involvement, structure, and autonomy support (Skinner et al.,
2005).
Teacher motivational support. Students reported on the level of involvement,
structure, and autonomy support that they experienced from their teachers (Skinner
& Belmont, 1993): 16 items tapped involvement, including warmth/affection, dedi-
cation of resources, knowledge about the student and his or her needs, and depend-
ability; 8 items tapped hostility and neglect; 14 items measured the kind and
amount of structure, including clarity of expectations and contingency; 15 items
reflected chaos and confusion; 8 items tapped autonomy support, including teacher
provision of choice, relevance, and respect; and 13 items tapped teacher coercion
and controlling behavior.
Observations of Engagement and Disaffection in the Classroom
Observations were conducted in two fourth-grade classrooms, and focused on
56 children (29 girls and 27 boys). Everyday classroom interactions were video-
taped between the 5th week and the 10th week of school; two prior weeks were
used for warm-up. Observations were conducted during regular classroom lessons:
35% of the observations were recorded during math, 35% during English (or other
language-oriented lessons), 15% during social studies, and 15% during special pro-
jects (e.g., preparation and giving of class presentations). Interactions were video-
taped according to predetermined random schedules, across periods of 15 school
days in each classroom. Each day, a target child was in the camera’s focus for
about 20 min. On average, each child was observed for a total of 2 hr, across 8 days
(ranging from a low of two times, once in math and once in language arts, to a high
of 25 times).
502 Educational and Psychological Measurement
at PORTLAND STATE UNIV on October 27, 2011epm.sagepub.comDownloaded from

Coding system. The coding system consisted of seven exhaustive and mutually
exclusive categories, adapted from systems developed by Charlesworth and Hartup
(1967); Horn, Conners, and Well (1986); and Kerr, Zignmond, Schaeffer, and
Brown (1986). Three categories captured children’s on-task behavior: On-Task
Active Initiative (e.g., a child contributed to a lesson on her own initiative, raised
his hand, or volunteered to go to the board), On-Task Working (e.g., reading, work-
ing on a problem, continuing an activity, answering a question), and On-Task Pas-
sive (e.g., listening to the teacher or a classmate making an on-task contribution).
Three categories captured off-task behavior: Off-Task Initiative (e.g., disrupting a
classmate or interrupting the teacher with a nonacademic issue), Off-Task Working
(e.g., building paper airplanes, participating in a classmate’s active off-task beha-
vior), and Off-Task Passive Behavior (e.g., daydreaming or listening to a class-
mate’s off-task contribution). A category of Other was used for all other events.
Coding procedure and reliability. Codings were sequential in the natural occur-
rence of behavior, and they consisted of registering the respective behavior code,
as well as the running time when a specific event occurred. Each day of observation
was taped on one videotape. Twelve trained observers coded the tapes in a random
sequence. To determine reliability, four 3-minute segments (2 within the first 15
minutes and 2 within the last 15 minutes) of each videotape were coded by two
observers separately. Reliability codings proceeded without observer knowledge
about which parts would be used for reliability checks and without the reliability
observer present. Thus, reliability estimates are conservative when compared to
real-time observations when two observers code simultaneously. Across the 29
days of observation (i.e., 29 videotapes), 200 3-min reliability segments were
coded twice by two observers (a total of 8,000 observations). The average kappa
was .71, with the lowest agreement of 57% (for Off-Task Initiative) and the highest
agreement of 87% (for On-Task Working). Other percentages were as follows: On-
Task Initiative, 70%; On-Task Passive, 74%; Off-Task Working, 76%, Off-Task
Passive, 69% (observer agreement was 91% on Other). There were no indications
of systematic observer differences, observer fatigue, or decay in observers’ reliabil-
ity across time.
Results
Analyses were conducted in four parts. First, multiple models depicting the
structure of the assessments of engagement and disaffection were compared, using
structural equation modeling with AMOS 4.0. Second, the correspondence between
teacher and student reports was determined. Third, for a subset of children, the
links between the assessments and in vivo observations in the classroom were
Skinner et al. / A Motivational Perspective on Engagement and Disaffection 503
at PORTLAND STATE UNIV on October 27, 2011epm.sagepub.comDownloaded from

investigated. Fourth, the correlations between indicators of engagement and
markers of a set of individual and social processes were analyzed.
Structure of Engagement and Disaffection
Testing unidimensionality of the four item sets. The first step was designed to
identify a set of unidimensional and internally consistent items for each of the four
components. Hence, the unidimensionality of each item set was assessed sepa-
rately, using four confirmatory analyses of one-factor models. For student reports
of engagement, using data from the spring time point, three of the four item sets
showed, a good fit to a single-factor model: behavioral engagement (four items),
w2 = 6:59 (2, 1018), p< :05, CFI (comparative fit index)= 1:00, TLI (Tucker–
Lewis index)= 1.00, RMSEA (root mean square error of approximation)= .05
(90% confidence intervals [CI]= .01, .09); behavioral disaffection (four items),
w2 = 16:13 (2, 1018), p< :001, CFI= 1.00, TLI= .99, RMSEA= .08 (90%
CI= .05, .12), and emotional engagement (six items), w2 = 62:08 (9, 1018),
p< :001, CFI= 1.00, TLI= .99, RMSEA= .08 (90% CI= .06, .10). As expected,
the item set for emotional disaffection—which contained items referring to bore-
dom, worry, and general ‘‘badness’’—was better fit by a hierarchical model in
which the disaffected emotions were differentiated. The three latent factors (bore-
dom, worry, and feeling bad) loaded to form a higher-order unidimensional latent
factor (nine items), w2 = 94:25 (24, 1018), p< :001, CFI= 1.00, TLI= .99,
RMSEA= .05 (90% CI= .04, .07). The resulting score reliabilities were adequate
(averaging .79). These results were replicated using data from the fall. For the
teacher report assessments, items had to be deleted from each item set to create uni-
dimensional subscales with two or three items. These saturated models (i.e., com-
pletely unrestricted models with zero degrees of freedom) all fit perfectly (e.g.,
CFI= 1.00, RMSEA= 0.00); hence, we do not report fit statistics for these four
unidimensional subscales. The resulting score reliabilities calculated from the
three-item scales (or inter-item correlation for emotional engagement) were high,
averaging .86.
Correlations among the components of engagement. The observed correlations
among the four components are presented separately for student reports and teacher
reports in Table 1. Of greatest interest were the correlations between emotion and
behavior within engagement and disaffection and between engagement and disaf-
fection within emotion and behavior. As can be seen, all correlations were moder-
ately high and in the expected directions—that is, emotion and behavior were
positively correlated, whereas engagement and disaffection were negatively corre-
lated. For student reports, emotion and behavior were more tightly connected (aver-
age r = :61) than were engagement and disaffection (average r = − :52), but all the
correlations were well below |1:0|, which suggests a multidimensional structure
504 Educational and Psychological Measurement
at PORTLAND STATE UNIV on October 27, 2011epm.sagepub.comDownloaded from
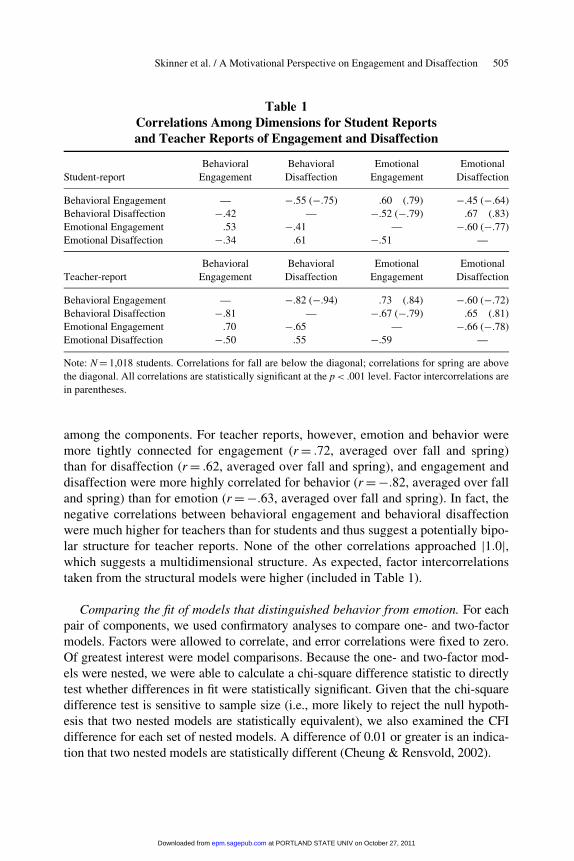
among the components. For teacher reports, however, emotion and behavior were
more tightly connected for engagement (r = :72, averaged over fall and spring)
than for disaffection (r = :62, averaged over fall and spring), and engagement and
disaffection were more highly correlated for behavior (r =−:82, averaged over fall
and spring) than for emotion (r =−:63, averaged over fall and spring). In fact, the
negative correlations between behavioral engagement and behavioral disaffection
were much higher for teachers than for students and thus suggest a potentially bipo-
lar structure for teacher reports. None of the other correlations approached |1:0|,which suggests a multidimensional structure. As expected, factor intercorrelations
taken from the structural models were higher (included in Table 1).
Comparing the fit of models that distinguished behavior from emotion. For each
pair of components, we used confirmatory analyses to compare one- and two-factor
models. Factors were allowed to correlate, and error correlations were fixed to zero.
Of greatest interest were model comparisons. Because the one- and two-factor mod-
els were nested, we were able to calculate a chi-square difference statistic to directly
test whether differences in fit were statistically significant. Given that the chi-square
difference test is sensitive to sample size (i.e., more likely to reject the null hypoth-
esis that two nested models are statistically equivalent), we also examined the CFI
difference for each set of nested models. A difference of 0.01 or greater is an indica-
tion that two nested models are statistically different (Cheung & Rensvold, 2002).
Table 1
Correlations Among Dimensions for Student Reports
and Teacher Reports of Engagement and Disaffection
Student-report
Behavioral
Engagement
Behavioral
Disaffection
Emotional
Engagement
Emotional
Disaffection
Behavioral Engagement — −.55 (−.75) .60 (.79) −.45 (−.64)
Behavioral Disaffection −.42 — −.52 (−.79) .67 (.83)
Emotional Engagement .53 −.41 — −.60 (−.77)
Emotional Disaffection −.34 .61 −.51 —
Teacher-report
Behavioral
Engagement
Behavioral
Disaffection
Emotional
Engagement
Emotional
Disaffection
Behavioral Engagement — −.82 (−.94) .73 (.84) −.60 (−.72)
Behavioral Disaffection −.81 — −.67 (−.79) .65 (.81)
Emotional Engagement .70 −.65 — −.66 (−.78)
Emotional Disaffection −.50 .55 −.59 —
Note: N= 1,018 students. Correlations for fall are below the diagonal; correlations for spring are above
the diagonal. All correlations are statistically significant at the p< .001 level. Factor intercorrelations are
in parentheses.
Skinner et al. / A Motivational Perspective on Engagement and Disaffection 505
at PORTLAND STATE UNIV on October 27, 2011epm.sagepub.comDownloaded from
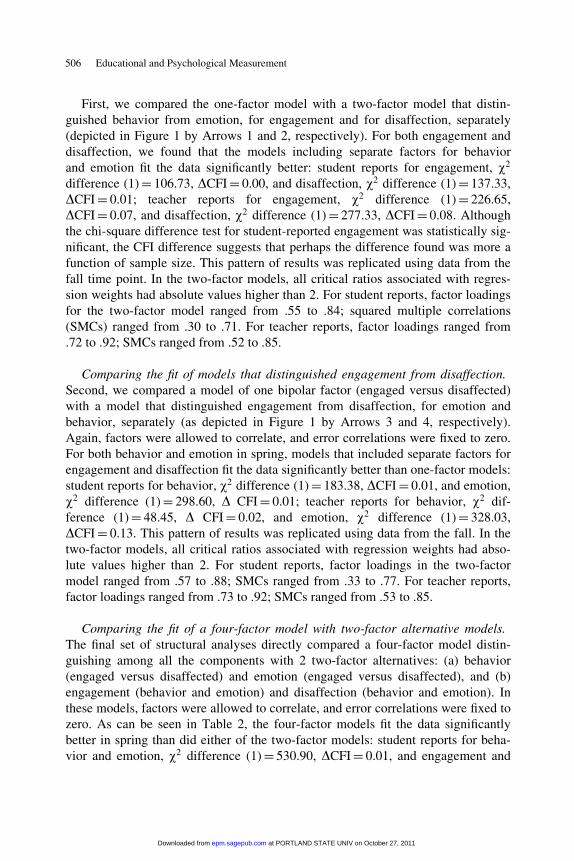
First, we compared the one-factor model with a two-factor model that distin-
guished behavior from emotion, for engagement and for disaffection, separately
(depicted in Figure 1 by Arrows 1 and 2, respectively). For both engagement and
disaffection, we found that the models including separate factors for behavior
and emotion fit the data significantly better: student reports for engagement, w2
difference (1)= 106.73, DCFI= 0.00, and disaffection, w2 difference (1)= 137.33,
DCFI= 0.01; teacher reports for engagement, w2 difference (1)= 226.65,
DCFI= 0.07, and disaffection, w2 difference (1)= 277.33, DCFI= 0.08. Although
the chi-square difference test for student-reported engagement was statistically sig-
nificant, the CFI difference suggests that perhaps the difference found was more a
function of sample size. This pattern of results was replicated using data from the
fall time point. In the two-factor models, all critical ratios associated with regres-
sion weights had absolute values higher than 2. For student reports, factor loadings
for the two-factor model ranged from .55 to .84; squared multiple correlations
(SMCs) ranged from .30 to .71. For teacher reports, factor loadings ranged from
.72 to .92; SMCs ranged from .52 to .85.
Comparing the fit of models that distinguished engagement from disaffection.
Second, we compared a model of one bipolar factor (engaged versus disaffected)
with a model that distinguished engagement from disaffection, for emotion and
behavior, separately (as depicted in Figure 1 by Arrows 3 and 4, respectively).
Again, factors were allowed to correlate, and error correlations were fixed to zero.
For both behavior and emotion in spring, models that included separate factors for
engagement and disaffection fit the data significantly better than one-factor models:
student reports for behavior, w2 difference (1)= 183.38, DCFI= 0.01, and emotion,
w2 difference (1)= 298.60, D CFI= 0.01; teacher reports for behavior, w2 dif-
ference (1)= 48.45, D CFI= 0.02, and emotion, w2 difference (1)= 328.03,
DCFI= 0.13. This pattern of results was replicated using data from the fall. In the
two-factor models, all critical ratios associated with regression weights had abso-
lute values higher than 2. For student reports, factor loadings in the two-factor
model ranged from .57 to .88; SMCs ranged from .33 to .77. For teacher reports,
factor loadings ranged from .73 to .92; SMCs ranged from .53 to .85.
Comparing the fit of a four-factor model with two-factor alternative models.
The final set of structural analyses directly compared a four-factor model distin-
guishing among all the components with 2 two-factor alternatives: (a) behavior
(engaged versus disaffected) and emotion (engaged versus disaffected), and (b)
engagement (behavior and emotion) and disaffection (behavior and emotion). In
these models, factors were allowed to correlate, and error correlations were fixed to
zero. As can be seen in Table 2, the four-factor models fit the data significantly
better in spring than did either of the two-factor models: student reports for beha-
vior and emotion, w2 difference (1)= 530.90, DCFI= 0.01, and engagement and
506 Educational and Psychological Measurement
at PORTLAND STATE UNIV on October 27, 2011epm.sagepub.comDownloaded from

Table
2
Co
mp
ari
son
of
the
Tw
o-
an
dF
ou
r-F
act
or
Mo
del
sfo
rB
eha
vio
ra
nd
Em
oti
on
an
dfo
rE
ng
ag
emen
ta
nd
Dis
aff
ecti
on
Stu
den
tR
eport
Ass
essm
ents
Tea
cher
Rep
ort
Ass
essm
ents
Tw
o-F
acto
rM
odel
Fo
ur-
Fac
tor
Mo
del
Tw
o-F
acto
rM
odel
Fo
ur-
Fac
tor
Mo
del
Go
od
nes
so
f
Fit
Ind
ices
Beh
avio
ral
and
Em
oti
onal
E/D
B/E
En
gag
emen
t
and
Dis
affe
ctio
n
Beh
avio
ral
and
Em
oti
on
alE
/D
B/E
En
gag
emen
t
and
Dis
affe
ctio
n
w21
,83
9.7
11
,614
.16
1,3
08
.81
63
9.1
58
22
.78
19
1.0
8
df
22
62
26
22
14
34
33
9
CF
I.9
7.9
8.9
8.9
3.9
0.9
8
TL
I.9
7.9
7.9
8.8
1.7
5.9
5
RM
SE
A(9
0%
CI)
.08
(.0
8,
.09
).0
8(.
07
,.0
8)
.07
(.0
7,
.07
).1
2(.
11
,.1
3)
.13
(.1
3,
.14
).0
6(.
05
,.0
7)
No
te:
N=
1,0
18
stu
den
ts.
Th
ese
dat
aw
ere
from
the
spri
ng
mea
sure
men
tp
oin
t;p
atte
rns
wer
ere
pli
cate
du
sin
gd
ata
from
the
fall
mea
sure
men
tp
oin
t.In
all
model
s,fa
ctors
wer
eal
low
edto
corr
elat
e,an
der
ror
corr
elat
ions
wer
efi
xed
toze
ro.
E/D
=en
gag
emen
t/dis
affe
ctio
n;
B/E
=b
ehav
iora
l/em
oti
on
al;
Th
eF
ou
r-
Fac
tor
Mo
del=
Beh
avio
ral
En
gag
emen
t,E
mo
tio
nal
En
gag
emen
t,B
ehav
iora
lD
isaf
fect
ion
,an
dE
mo
tio
nal
Dis
affe
ctio
n;
CF
I=
com
par
ativ
efi
tin
dex
;
TL
I=
Tu
cker
–L
ewis
index
;R
MS
EA=
roo
tm
ean
squ
are
erro
ro
fap
pro
xim
atio
n;
CI=
con
fid
ence
inte
rval
s.A
llch
i-sq
uar
ev
alues
sig
nifi
can
tat
the
p<
.00
1
lev
el.
507
at PORTLAND STATE UNIV on October 27, 2011epm.sagepub.comDownloaded from

disaffection, w2 difference (1)= 305.35, DCFI= 0.00; teacher reports for behavior
and emotion, w2 difference (1)= 448.07, DCFI= 0.05, and engagement and disaf-
fection, w2 difference (1)= 631.70, DCFI= 0.08. Although the chi-square differ-
ence test for student-reported behavior and emotion was statistically significant, the
CFI difference suggests that perhaps the difference was more a function of sample
size. This pattern of results was replicated using fall data.
Descriptive statistics for the components from the final model. Table 3 presents
the means, standard deviations, and reliability coefficients for scores from the four
components of engagement, separately for fall and spring, as well as the correla-
tions between fall and spring scores for each assessment. In terms of the student
report scores, internal consistency reliabilities were generally adequate (.70 or
above), with the exception of the four-item Behavioral Engagement subscale in the
fall, although it improved by spring. The cross-time correlations revealed a moder-
ately high level of stability over the school year (average r = :62). Comparison of
mean levels from fall to spring revealed the typical pattern of losses in behavioral
and emotional engagement across the school year.
In terms of teacher reports, score reliabilities were all satisfactory (above .80).
Inter-individual stability over the school year was moderately high (average
r = :74). Comparison of mean levels from fall to spring also revealed a loss in emo-
tional engagement across the school year, although the loss in behavioral engage-
ment seen in student reports was not found. As shown in the last rows of Table 3,
despite the fact that the four components can be distinguished, scores can also be
combined in different ways (e.g., by averaging emotion and behavior or by sub-
tracting disaffection from engagement) to create conceptually interesting scores
that were internally consistent and highly stable.
Multivariate analyses of mean-level differences in the components of engage-
ment as a function of gender and grade revealed the expected statistically signifi-
cant effects: Girls (compared to boys) and younger children (compared to older
children) tended to be motivationally ‘‘better off,’’ showing consistently higher
levels of behavioral and emotional engagement, as well as lower levels of beha-
vioral and emotional disaffection at both time points. At the same time, compari-
sons of the cross-year stability correlations for the four components of engagement
revealed that none differed as a function of gender or grade level.
Comparison of Student and Teacher Reportsof Engagement in the Fall and Spring
Table 4 presents correlations between scores from the student and teacher
reports of the four components of engagement in fall and spring, as well as the
mean-level comparisons. As can be seen, teachers and students showed a modest
508 Educational and Psychological Measurement
at PORTLAND STATE UNIV on October 27, 2011epm.sagepub.comDownloaded from

Table
3
Inte
rna
lC
on
sist
ency
Rel
iab
ilit
ies,
Mea
ns,
Sta
nd
ard
Dev
iati
on
s,
an
dC
ross
-Yea
rS
tab
ilit
ies
of
Stu
den
ta
nd
Tea
cher
Rep
ort
s
Stu
den
t-re
po
rtA
sses
smen
tsT
each
er-r
epo
rtA
sses
smen
ts
Fal
lS
pri
ng
Fal
lS
pri
ng
aM
SD
aM
SD
Cro
ss-
yea
r
stab
ilit
ya
MSD
aM
SD
Con
stru
ct(9
0%
CI)
(90
%C
I)(9
0%
CI)
(90
%C
I)
Cro
ss-
yea
r
stab
ilit
y
Beh
avio
ral
eng
agem
ent
.61
3.3
9.5
4.7
23
.34
.58
.53
.87
3.1
9.7
0.8
83
.18
.71
.82
(.5
8,.6
4)
(.7
0,.7
4)
(.8
6,
.88
)(.
87
,.8
9)
Beh
avio
ral
dis
affe
ctio
n
.71
1.8
4.6
9.7
81
.85
.71
.64
.83
1.8
8.7
7.8
31
.80
.75
.82
(.6
9,.7
3)
(.7
6,.8
0)
(.8
1,
.84
)(.
81
,.8
4)
Em
oti
on
alen
gag
emen
t
.76
3.1
2.5
8.8
23
.03
.62
.64
.84
3.2
4.6
8.8
73
.16
.73
.65
(.7
4,.7
8)
(.8
1,.8
3)
(.8
3,
.85
)(.
86
,.8
8)
Em
oti
on
ald
isaf
fect
ion
.83
1.8
8.6
1.8
51
.86
.60
.68
.81
1.5
3.6
2.8
51
.55
.68
.67
(.8
2,.8
4)
(.8
4,.8
6)
(.7
9,
.83
)(.
84
,.8
6)
Beh
avio
ral
and
emoti
on
alen
gag
emen
t
.79
3.2
5.4
9.8
63
.18
.54
.65
.90
3.2
2.6
4.9
13
.17
.67
.78
(.7
7,.8
1)
(.8
4,.8
8)
(.8
9,
.91
)(.
90
,.9
2)
(con
tin
ued
)
509
at PORTLAND STATE UNIV on October 27, 2011epm.sagepub.comDownloaded from

Table3(continued)
Stu
den
t-re
port
Ass
essm
ents
Tea
cher
-rep
ort
Ass
essm
ents
Fal
lS
pri
ng
Fal
lS
pri
ng
aM
SD
aM
SD
Cro
ss-
yea
r
stab
ilit
ya
MSD
aM
SD
Co
nst
ruct
(90
%C
I)(9
0%
CI)
(90
%C
I)(9
0%
CI)
Cro
ss-
yea
r
stab
ilit
y
Beh
avio
ral
and
emoti
onal
dis
affe
ctio
n
.86
1.8
6.5
8.8
91
.86
.60
.73
.85
1.7
0.6
1.8
91
.67
.65
.81
(.8
5,.8
7)
(.8
8,.9
0)
(.8
4,.8
6)
(.8
8,
.90
)
Beh
avio
ral
engag
emen
tver
sus
dis
affe
ctio
n
.73
3.2
7.5
2.8
23
.24
.57
.70
.85
3.1
6.7
0.9
33
.19
.70
.85
(.7
1,.7
5)
(.8
0,.8
4)
(.8
4,.8
6)
(.9
2,
.94
)
Em
oti
onal
engag
emen
tver
sus
dis
affe
ctio
n
.86
3.1
2.5
2.8
93
.08
.55
.70
.85
3.3
6.5
8.8
13
.31
.64
.73
(.8
5,.8
7)
(.8
8,.9
0)
(.8
4,.8
6)
(.8
0,
.82
)
Engag
emen
tver
sus
dis
affe
ctio
n
.88
3.2
0.4
7.9
23
.16
.51
.75
.93
3.2
6.5
9.9
43
.25
.63
.83
(.8
7,.8
9)
(.9
1,.9
3)
(.9
2,.9
4)
(.9
3,
.95
)
No
te:
N=
1,0
18
studen
ts.A
llco
rrel
atio
ns
(cro
ss-y
ear
stab
ilit
ies)
are
stat
isti
call
ysi
gnifi
cant
atth
ep<
.00
1le
vel
.C
I=
confi
den
cein
terv
als.
510
at PORTLAND STATE UNIV on October 27, 2011epm.sagepub.comDownloaded from

degree of convergence in their ratings of engagement and disaffection (average
r = :30), especially for the behavioral indicators, which were more directly
observable (average r = :36). As would be expected, inter-reporter correlations
were even higher for the aggregated measures—for example, the correlations
between teacher and student ratings of behavioral engagement versus disaffec-
tion averaged .43.
Cross-reporter comparison of mean levels of scores revealed that students felt
that they were more behaviorally engaged (i.e., that they were trying harder and
exerting more effort) than teachers observed them to be. Students and teachers did
not differ in their ratings of behavioral disaffection, perhaps because teachers were
providing direct feedback to students about their behaviors. Teachers and students
did differ on their ratings of student emotions in the classroom: Students indicated
that they were more emotionally disaffected than teachers perceived them to be.
Table 4
Correlations and Mean-Level Differences Between Student and Teacher
Reports of the Components of Engagement in Fall and Spring
Fall Spring
Construct
Correlations
between
Student and
Teacher
Reports
Mean-Level
Differences
between Student
and Teacher
Reports
Correlations
between
Student and
Teacher
Reports
Mean-Level
Differences
between Student
and Teacher
Reports
Behavioral engagement .32 MD= .20, d= .27a .37 MD= .15, d= .21a
Behavioral disaffection .38 MD= –.01, d= .01 .35 MD= .05, d= .06
Emotional engagement .24 MD= –.13, d= .17 .30 MD= –.13, d= .16
Emotional disaffection .21 MD= .36, d= .46a .24 MD= .32, d= .40a
Behavioral and
emotional engagement
.34 MD= .04, d= .06 .38 MD= .01, d= .01
Behavioral and
emotional disaffection
.35 MD= .17, d= .25a .36 MD= .18, d= .25a
Behavioral engagement
versus disaffection
.44 MD= .10, d= .18 .42 MD= .05, d= .07
Emotional engagement
versus disaffection
.26 MD= –.24, d= .36a .33 MD= –.22, d= .32a
Engagement versus
disaffection
.41 MD= –.07, d= .12 .42 MD= –.09, d= .14
Note: N= 1,018 students. MD=mean difference. d=Cohen’s d calculated using pooled standard devia-
tion that accounts for the correlation between student and teacher reports. Positive mean differences indi-
cate higher student report scores; negative mean differences indicate higher teacher report scores. All
correlations are statistically significant at the p< .01 level.
a. An effect size that is small to medium (between .20 and .50).
Skinner et al. / A Motivational Perspective on Engagement and Disaffection 511
at PORTLAND STATE UNIV on October 27, 2011epm.sagepub.comDownloaded from

These differences may reflect the fact that emotions are not as easily observed by
teachers or that students have learned to mask the expression of their emotions. In
the case of emotional disaffection, differences may also be due to the slightly dif-
ferent mix of emotions included in the item sets for students as compared to those
for teachers. Although only a few studies include cross-reporter comparisons, these
findings are consistent with other comparisons that have been reported (Skinner &
Belmont, 1993).
Observations of Engagement and Disaffection in the Classroom
The third goal was to examine whether scores from student and teacher report
assessments of engagement were statistically significantly correlated with in vivo
observations of students’ engagement in the classroom. In total, 46,756 observa-
tions were coded during the 95.5 hr of observations (i.e., averaging about 8.2
codes per minute). Forty percent of all the observations occurred in Mathematics,
40% in Language lessons. Rates per minute were computed, reflecting the length
of time that children were observed to engage in the behaviors of each observation
category each minute. Most of the time, children were observed to be on-task, and
on-task behaviors were typically of a longer duration than off-task behaviors.
Relations between behavior frequencies and self-reported and teacher-reported
engagement. Correlations between children’s observed behavior (rates and dura-
tions per minute) and their engagement in the classroom (self- and teacher-reports)
were modest; strongest relations (ranging from .35 to .40) were found for teacher
ratings; for student reports, ratings of disaffection correlated with only classroom
behaviors, but even these relations were comparably small. The correlational pat-
tern between teacher-rated engagement and observed behaviors was not affected
when children’s gender was controlled.
Figure 2 contains the model of the relations between teacher ratings of engage-
ment (combining all four components) and the behavioral observations, organized
into On-task behaviors (combining on-task initiative, working, passive, and the
maximum time spent off-task) and Off-task behaviors (combining Off-task initia-
tive, working, passive, and the maximum time spent off-task). In this model, total
activity level, duration of negative emotions, and achievement were also included
because it became apparent that some children were just more active and/or
emotionally reactive than others. The highly active children showed more beha-
viors of both types (On-task and Off-task), and the more emotionally reactive chil-
dren showed more emotions of both types (engaged and disaffected). The model
showed a satisfactory fit with the data: w2(df = 56) = 64:66, CFI = :943, CMIN/
df = 1:22 (denoting the minimum chi-square discrepancy per degree of freedom),
RMSEA= .07. As can be seen in Figure 2, children whom teachers rated as more
behaviorally and emotionally engaged (versus disaffected) also showed overall
512 Educational and Psychological Measurement
at PORTLAND STATE UNIV on October 27, 2011epm.sagepub.comDownloaded from

higher amounts and durations of On-task behavior (standardized coefficient= .28)
and lower amounts and durations of Off-task behavior (standardized coefficient=−.34). Models depicting the connection between student ratings of engagement
and their observed behavior in the classroom did not show a good fit with the data.
Correlations With Potential Personal and SocialFacilitators of Motivation
The fourth goal of this study was to examine whether scores from student and
teacher reports of engagement were correlated with a set of variables posited by
motivational theories to facilitate engagement. These included markers of perceived
control, autonomy, relatedness, optimism, pessimism, goal orientations, reactions
Figure 2
A Model of the Relations Between Teacher Ratings of
Student Engagement and In Vivo Behavioral Observations
of Student On-Task and Off-Task Behavior in the Classroom
On-TaskBehavior
.06
Working
Error
.97
Passive
Error
.42
Initiative
Off-TaskBehavior
.97
Working.78
Initiative.08
Passive
.07
MaxTimeOn-Task
Activity Level
.10
Max TimeOff-Task
.99***
Engagement
.80.74
Duration ofNegative Emotions
.65**
.32*
.99***.24
.86*** .89***
.27
–.43* .18
.67** .42***
-.23
.89***.29*
–.17
.21* –.04
.67***
–.57***.58** .06
–.28
–.34*.28*
Error Error Error Error
ErrorError
Action Emotion
Error Error
Achievement
* p< .05. * * p< .01. * * * p< .001.
Skinner et al. / A Motivational Perspective on Engagement and Disaffection 513
at PORTLAND STATE UNIV on October 27, 2011epm.sagepub.comDownloaded from

to academic challenges and difficulties, and interactions with parents and teachers.
The means, standard deviations, internal consistencies, and cross-year stabilities for
all these student-report variables (presented in Table 5) suggest a generally well-
functioning group of third through sixth graders whose inter-individual rankings
remained relatively stable over the school year (average cross-year correlation= .57)
and whose mean levels were consistent with other research on these self-perceptions.
Correlations between engagement and its potential facilitators, also in Table 5,
show the predicted pattern in both fall and spring, in that engagement showed
robust positive correlations with personal and social indicators and negative corre-
lations with factors hypothesized to undermine motivation. Of course, student
ratings of engagement showed a pattern of stronger correlations, given that the
potential facilitators were also reported by students. Consistent with theoretical
expectations, students who were more engaged also showed consistently higher
confidence in their capacities (including effort, ability, powerful others, and luck),
more intrinsic and identified regulatory styles, higher relatedness to all social part-
ners (but, especially, teachers and classmates), higher learning goals, optimism,
and mastery reactions to challenges, as well as more supportive relationships with
parents and teachers. In contrast, students who were more disaffected evinced more
reliance on uncontrollable strategies (including powerful others, luck, and unknown
causes), a more external self-regulatory style, higher pessimism, avoidance, and
negative emotional reactions to challenge, and they experienced interactions with
teachers that were more hostile, chaotic, and controlling. As expected, this pattern
of findings was replicated across reporters at both time points.
Only three variables did not show the expected pattern, and theoretical explana-
tions can be found for these results. First, strategy beliefs for effort did not correlate
with student ratings of engagement (and only marginally correlated with teacher
ratings), suggesting that even though students agreed that effort is an effective
strategy for school success, this belief alone is not sufficient to support constructive
classroom engagement (for similar findings, see Skinner et al., 1988). Second, strat-
egy beliefs for ability were not correlated with teacher ratings of engagement,
although they did show a low negative correlation with student reports of engage-
ment. In general, beliefs in ability as a strategy—because they imply that success
requires ‘‘talent’’—are thought to undermine engagement, especially in the face of
challenge (Dweck, 1999b; Skinner et al., 1998). And, third, an introjected self-
regulatory style was marginally correlated with student ratings (positively) and
with teacher ratings (negatively) but at only one time point. This style of self-
regulation (in which students’ reasons for participating in school work reflect guilt
or internal pressure) seems to be a double-edged sword in that the pressure spurs
on behavior but at the expense of enjoyment and enthusiasm (e.g., Patrick et al.,
1993).
514 Educational and Psychological Measurement
at PORTLAND STATE UNIV on October 27, 2011epm.sagepub.comDownloaded from

Table
5
Mea
ns,
Sta
nd
ard
Dev
iati
on
s,a
nd
Cro
ss-Y
ear
Sta
bil
itie
so
fP
ote
nti
al
Fa
cili
tato
rso
fM
oti
va
tio
n
an
dT
hei
rC
orr
ela
tio
ns
wit
hS
tud
ent
an
dT
each
erR
epo
rts
of
En
ga
gem
ent
at
Tw
oT
ime
Po
ints
Fal
lS
pri
ng
Stu
den
tR
eport
s
of
En
gag
emen
t
Tea
cher
Rep
ort
s
of
En
gag
emen
t
Po
ten
tial
Fac
ilit
ato
rM
SD
MS
Da
(90
%C
I)
Cro
ss-
yea
r
stab
ilit
yF
all
Sp
rin
gF
all
Sp
rin
g
Aca
dem
icP
erce
ived
Con
tro
l
Per
ceiv
edco
ntr
ol
bel
iefs
3.4
2.5
03
.43
0.5
2.7
1(.
69
,.7
3)
.55
.58
.62
.40
.44
Str
ateg
yB
elie
fs
Eff
ort
stra
tegy
bel
iefs
3.0
9.5
83.0
80.5
7.6
5(.
62,
.68)
.45
–.0
1,n
s.0
5,n
s.0
4,n
s.1
4
Ab
ilit
yst
rate
gy
bel
iefs
2.5
4.7
12
.51
0.6
9.6
8(.
65
,.7
1)
.50
–.2
9–
.29
–.0
5,n
s–
.04,n
s
Po
wer
ful
oth
ers
stra
teg
y1
.75
.66
1.7
30
.66
.74
(.7
2,
.76
).5
8–
.48
–.5
5–
.27
–.3
7
Lu
ckst
rate
gy
bel
iefs
1.8
7.6
91
.80
0.6
8.7
5(.
73
,.7
7)
.59
–.4
2–
.45
–.2
5–
.30
Un
kn
ow
nst
rate
gy
bel
iefs
1.9
1.6
61
.84
0.6
7.7
4(.
72
,.7
6)
.54
–.5
0–
.60
–.3
1–
.38
Cap
acit
yB
elie
fs
Eff
ort
capac
ity
bel
iefs
3.3
6.5
33.3
00.5
7.7
2(.
70,
.74)
.59
.64
.71
.38
.47
Ab
ilit
yca
pac
ity
bel
iefs
3.2
9.5
83
.27
0.5
9.7
6(.
74
,.7
8)
.65
.66
.66
.42
.42
Po
wer
ful
oth
ers
capac
ity
3.2
5.5
53
.20
.60
.70
(.6
8,
.72
).5
3.5
2.5
7.3
3.4
8
Lu
ckca
pac
ity
bel
iefs
3.0
8.5
93
.06
.60
.68
(.6
5,
.70
).5
7.5
8.6
2.3
8.5
9
Au
ton
om
yO
rien
tati
on
Ex
tern
alse
lf-r
egu
lato
ryst
yle
2.8
0.7
92
.76
.74
.79
(.7
7,
.81
).8
2–
.26
–.2
8–
.13
–.1
2
Intr
oje
cted
self
-reg
ula
tory
style
2.7
1.7
72
.71
.77
.77
(.7
5,
.79
).5
3–
.09
–.0
1,n
s.0
3,n
s.0
7*
Iden
tifi
edse
lf-r
egu
lato
ryst
yle
3.2
9.6
43
.25
.61
.82
(.8
0,
.83
).6
0.6
8.6
7.2
4.2
7
Intr
insi
cse
lf-r
egu
lato
ryst
yle
2.6
7.9
42
.50
.95
.89
(.8
8,
.90
).6
6.4
7.4
7.1
3.1
3
Sen
seof
Rel
ate
dnes
s
Rel
ated
nes
sto
moth
er3.4
9.6
13.5
2.6
2.8
0(.
78,
.82)
.46
.40
.46
.22
.32
Rel
ated
nes
sto
fath
er3.4
2.6
63.5
0.6
3.8
0(.
78,
.82)
.46
.38
.42
.22
.34
Rel
ated
nes
sto
teac
her
3.0
5.7
53.0
6.7
4.8
1(.
79,
.81)
.53
.53
.60
.28
.34
Rel
ated
nes
sto
frie
nds
3.4
5.6
03.4
8.6
0.7
6(.
74,
.78)
.37
.35
.38
.17
.24
Rel
ated
nes
sto
clas
smat
es3.2
1.7
43.2
3.7
3.8
4(.
83,
.85)
.50
.48
.48
.17
.29
(con
tin
ued
)
515
at PORTLAND STATE UNIV on October 27, 2011epm.sagepub.comDownloaded from

Table5(continued)
Fal
lS
pri
ng
Stu
den
tR
epo
rts
of
En
gag
emen
t
Tea
cher
Rep
ort
s
of
En
gag
emen
t
Po
ten
tial
Fac
ilit
ato
rM
SD
MS
Da
(90
%C
I)
Cro
ss-
yea
r
stab
ilit
yF
all
Sp
rin
gF
all
Sp
rin
g
Op
tim
ism
an
dP
essi
mis
m
Op
tim
ism
3.0
8.5
83
.04
.57
.58
(.5
4,.6
1)
.45
.33
.41
.17
.19
Pes
sim
ism
2.1
8.6
72
.14
.65
.73
(.7
1,.7
5)
.56
–.5
4–
.53
–.2
7–
.32
Go
al
Ori
enta
tio
ns
Lea
rnin
ggoal
s3.4
7.5
33.4
2.5
6.7
7(.
75,.7
9)
.64
.61
.66
.27
.31
Per
form
ance
app
roac
hg
oal
s3
.59
.52
3.6
1.5
0.7
6(.
74
,.7
8)
.47
.40
.47
.17
.23
Rea
ctio
ns
toC
ha
llen
ge
Mas
tery
reac
tions
3.4
7.5
53.3
5.5
7.7
3(.
70,.7
5)
.58
.57
.60
.26
.34
Avoid
ance
reac
tions
1.6
1.6
21.6
6.6
1.7
8(.
76,.8
0)
.65
–.6
9–.7
5–.3
6–.4
0
Neg
ativ
eem
oti
onal
reac
tion
2.4
5.6
72.3
4.6
5.8
9(.
88,.9
0)
.60
–.3
8–.3
7–.1
2–.0
8*
So
cia
lC
on
text
Par
ents
:W
arm
th3
.32
.59
3.2
8.6
2.8
1(.
79
,.8
2)
.65
.57
.59
.33
.35
Str
uct
ure
3.2
1.5
73
.20
.55
.52
(.4
8,.5
6)
.43
.33
.43
.17
.26
Au
ton
om
ysu
pp
ort
3.1
3.5
33
.20
.51
.60
(.5
7,.6
3)
.54
.48
.55
.26
.34
Tea
cher
s:W
arm
th3
.00
.59
2.8
9.6
4.8
6(.
85
,.8
7)
.58
.53
.55
.24
.26
Str
uct
ure
3.1
2.4
73
.06
.49
.83
(.8
2,.8
4)
.60
.50
.55
.22
.28
Au
ton
om
ysu
pp
ort
2.8
1.5
52
.79
.56
.76
(.7
4,.7
8)
.57
.40
.47
.20
.20
Tea
cher
s:H
ost
ilit
y/n
egle
ct2
.00
.62
2.0
3.6
5.8
5(.
83
,.8
6)
.62
–.6
3–
.65
–.3
1–
.35
Ch
aos
2.0
5.6
02
.02
.60
.90
(.8
9,.9
1)
.70
–.6
7–
.68
–.3
4–
.36
Co
erci
on
2.1
0.5
92
.07
.64
.90
(.8
9,.9
1)
.66
–.6
6–
.70
–.3
3–
.34
No
te:
N=
1,0
18
studen
ts.
All
pote
nti
alfa
cili
tato
rsw
ere
mea
sure
dusi
ng
studen
tre
port
s.A
llco
rrel
atio
ns
are
signifi
cant
atth
ep<
.01
lev
el,
un
less
no
ted
.
Cro
nb
ach
’sal
pha
coef
fici
ents
repo
rted
from
the
spri
ng
tim
ep
oin
t.C
I=
con
fid
ence
inte
rval
.
*p<
.05
.n
s=
no
tst
atis
tica
lly
sig
nifi
can
t
516
at PORTLAND STATE UNIV on October 27, 2011epm.sagepub.comDownloaded from

Discussion
A study was conducted to analyze the structure, psychometric properties, valid-
ity, and correlates of scores from two assessments of students’ behavioral and emo-
tional participation in the classroom, referred to as engagement and disaffection. In
general, multidimensional structures were found for scores from student and tea-
cher reports, revealing behavioral and emotional components that are positively
correlated, as well as engaged and disaffected components of each, which are nega-
tively correlated with each other. Moreover, for student reports, indicators of disaf-
fected emotions, although highly intercorrelated, could nevertheless be further
distinguished according to whether students were feeling anxious, bored, or fru-
strated/bad.
The psychometric properties of scores for individual components, tapped by
only three or four items each, were satisfactory for the most part; for a few compo-
nents, additional supplementary items were suggested (see Appendices A and B).
Correlations across the school year revealed that scores were inter-individually
stable, although they tended to worsen in mean level. Comparison of scores from
student and teacher reports showed the predicted pattern: Teachers and students
showed modest agreement, which was higher for behavior than for emotion. Stu-
dents reported that they were more behaviorally engaged than teachers judged them
to be, and teachers underestimated student emotional disaffection relative to stu-
dents’ actual feelings. Despite its multidimensional structure, however, compo-
nents were systematically interrelated in ways that allowed items to be combined
into aggregate scores (with disaffection items reverse-coded) that showed satisfac-
tory internal consistencies, high cross-time stabilities, and good correspondence
between reporters. Scores from teacher reports, but not from student reports, were
correlated with in vivo observations of engagement in the classroom, likely because
teachers are also observers of student engagement. For both reporters, indicators of
engagement and disaffection were consistently linked in theoretically expected
ways with individual and interpersonal factors hypothesized to shape motivation.
Taken together, findings indicate that scores from these two assessments of
engagement and disaffection are satisfactory markers of the quality of children’s
participation in academic activities in the classroom. As such, they should be com-
parable to other teacher or child report assessments of student participation (e.g.,
Berndt & Miller, 1990; Finn et al., 1995) and other measures of student engagement
that focus on involvement in school tasks (Murdock, 1999; Sinclair, Christenson,
Lehr, & Anderson, 2003), academic effort (e.g., O’Donnell, Hawkins, & Abbott,
1995), or effort and interest in the classroom (e.g., Wentzel, 1998). Research has
shown that these features of classroom participation are correlated as expected with
other indices of day-to-day academic involvement, such as attendance/absenteeism,
completion of homework, and preparedness for class (e.g., Finn, 1989; Johnson,
Skinner et al. / A Motivational Perspective on Engagement and Disaffection 517
at PORTLAND STATE UNIV on October 27, 2011epm.sagepub.comDownloaded from

Crosnoe, & Elder, 2001). At the same time, the multidimensional structure of scores
from the current assessments indicates that no one component is a proxy for the
entire construct; comprehensive assessments need to include items that tap all four
components. Moreover, the extent to which components can be distinguished sug-
gests that scores can be created to differentiate children with specific profiles—for
example, children who are behaviorally engaged but emotionally disaffected (Patrick
et al., 1993) or children who are anxiously withdrawn (Finn et al., 1995).
Limitations of the Assessments of Engagement and Disaffection
The current assessments are limited, not only within the footprint of the item
sets included in current versions, but also in relation to other conceptualizations of
engagement. In terms of the current item sets, we should note that more multidi-
mensionality may be present than is depicted by the four components of engage-
ment and disaffection. For example, within children’s reports of emotional
disaffection, we found evidence that multiple negative emotions can be differen-
tiated. Moreover, in the teacher reports, we needed to delete several items from
behavioral and emotional engagement in order to identify unidimensional item sets.
This indicates that additional dimensions might be present, if we had had sufficient
items to detect them. These findings suggest that engagement and disaffection may
eventually be best represented by a hierarchical structure, with multiple dimensions
within each of the four components identified in this study. Conceptually driven
generation of items, combined with the kinds of structural comparisons used in the
present study, may lead to a more complete picture of the structure of engagement
and disaffection.
Other conceptualizations of engagement. We should also note that the current
assessments do not contain all the components that are included as indicators of
classroom participation and academic involvement. Some researchers add student
commitment or ‘‘beyond the call,’’ which refer to preference for challenge or will-
ingness to take on extra work (e.g., Gottfried, 1985; Harter, 1981). To disaffection,
some assessments add student oppositional, disruptive, rebellious, or defiant beha-
vior (e.g., Finn et al., 1995; Roeser, Strobel, & Quihuis, 2002). To both compo-
nents, it is possible to add the assessment of ‘‘re-engagement,’’ or coping with
challenges and setbacks (Skinner & Wellborn, 1997). Future research can examine
how each of these potential features is structurally related to the four components
tapped in this study.
Other motivational perspectives. The current assessment of engagement and dis-
affection, although representing a core feature of most major theories of motiva-
tion, does not include all the features and shadings considered by every framework.
For example, attribution theories include a wider variety of emotions, such as pride
518 Educational and Psychological Measurement
at PORTLAND STATE UNIV on October 27, 2011epm.sagepub.comDownloaded from
and shame (Weiner, 1985); self-determination theory emphasizes experiences of
psychological freedom or pressure (Deci & Ryan, 1985); learned helplessness
includes cognitive and self-esteem deficits (Peterson et al., 1993); volition perspec-
tives focus on cognitive and energetic depletion (Kuhl, 1984); theories of achieve-
ment goals point out their effects on hope, pride, shame, and hopelessness (Pekrun,
Elliot, & Maier, 2006). In fact, a fuller account of motivated action includes not only
ongoing action but also the direction of action, as manifested in choice, selection,
and preference (Wigfield, Eccles, Schiefele, Roeser, & Davis-Kean, 2006) and the
regulation of action, sometimes called self-regulated learning (Schunk & Zimmer-
man, 1994; Zimmerman, 2000) or academic coping (Skinner & Wellborn, 1997).
Conclusion
In sum, we bring to discussions of children’s engagement in school a conceptua-
lization and two assessments of students’ behavioral and emotional involvement in
academic activities in the classroom, which we refer to as engagement and disaffec-
tion. The four components can be distinguished statistically, but practically it may
make more sense to combine them, unless there exists a clear theoretical rationale
for contrasting their individual effects or examining specific combinations. These
assessments capture core constructs key to motivational theories in the field today,
and they may be used as a foundation to create a more complete account of moti-
vated action. Perhaps future work on the conceptualization and assessment of moti-
vated participation in academic activities in the classroom can build on the
conceptual arguments and empirical strategies presented in this article.
Appendix A: Engagement Versus Disaffectionwith Learning: Student Report
Behavioral Engagement
1. I try hard to do well in school.
2. In class, I work as hard as I can.
3. When I’m in class, I participate in class discussions.
4. I pay attention in class.
5. When I’m in class, I listen very carefully.
Emotional Engagement
1. When I’m in class, I feel good.
2. When we work on something in class, I feel interested.
(continued)
Skinner et al. / A Motivational Perspective on Engagement and Disaffection 519
at PORTLAND STATE UNIV on October 27, 2011epm.sagepub.comDownloaded from

Appendix A: (continued)
3. Class is fun.
4. I enjoy learning new things in class.
5. When we work on something in class, I get involved.
Behavioral Disaffection
1. When I’m in class, I just act like I’m working. (–)
2. I don’t try very hard at school. (–)
3. In class, I do just enough to get by. (–)
4. When I’m in class, I think about other things. (–)
5. When I’m in class, my mind wanders. (–)
Emotional Disaffection
1. a. When we work on something in class, I feel bored. (–)
b. When I’m doing work in class, I feel bored. (–)
c. When my teacher first explains new material, I feel bored. (–)
2. a. When I’m in class, I feel worried. (–)
b. When we start something new in class, I feel nervous. (–)
c. When I get stuck on a problem, I feel worried. (–)
3. When we work on something in class, I feel discouraged. (–)
4. Class is not all that fun for me. (–)
5. a. When I’m in class, I feel bad. (–)
b. When I’m working on my classwork, I feel mad. (–)
c. When I get stuck on a problem, it really bothers me. (–)
d. When I can’t answer a question, I feel frustrated. (–)
Note: Adapted from Wellborn (1991). The items added to the Emotional Disaffec-
tion subscale can be used to tap the more differentiated disaffected emotions.
Appendix B: Engagement Versus Disaffectionwith Learning: Teacher Report
Behavioral Engagement
1. In my class, this student works as hard as he/she can.
2. When working on classwork in my class, this student appears involved.
3. When I explain new material, this student listens carefully.
4. In my class, this student does more than required.
5. When this student doesn’t do well, he/she works harder.
(continued)
520 Educational and Psychological Measurement
at PORTLAND STATE UNIV on October 27, 2011epm.sagepub.comDownloaded from

Appendix B: (continued)
Emotional Engagement
1. In my class, this student is enthusiastic.
2. In class, this student appears happy.
3. When we start something new in class, this student is interested.
4. When working on classwork, this student seems to enjoy it.
5. For this student, learning seems to be fun.
Behavioral Disaffection
1. When we start something new in class, this student thinks about other things. (–)
2. In my class, this student comes unprepared. (–)
3. When faced with a difficult assignment, this student doesn’t even try. (–)
4. In my class, this student does just enough to get by. (–)
5. When we start something new in class, this student doesn’t pay attention. (–)
Emotional Disaffection
1. a. When we work on something in class, this student appears to be bored. (–)
b. When doing work in class, this student looks bored. (–)
2. a. When working on classwork, this student seems worried. (–)
b. In my class, this student is anxious. (–)
3. a. In class, this student seems unhappy. (–)
b. In my class, this student appears to be depressed. (–)
4. a. In my class, this student is angry. (–)
b. When working on classwork, this student appears frustrated. (–)
5. a. When I explain new material, this student doesn’t seem to care. (–)
b. When working on classwork in my class, this student seems uninterested. (–)
Note: Adapted from Wellborn (1991). The items added to the Emotional Disaffec-
tion subscale can be used to tap the more differentiated disaffected emotions.
References
Barnette, J. J. (2005). ScoreRel CI: An Excel program for computing confidence intervals for commonly
used score reliability coefficients. Educational & Psychological Measurement, 65, 980-983.
Berndt, T., & Miller, K. E. (1990). Expectancies, values, and achievement in junior high school. Journal
of Educational Psychology, 82, 319-326.
Bolstad, O. D., & Johnson, S. M. (1977). The relationship between teachers’ assessment of students and
the students’ actual behavior in the classroom. Child Development, 48, 570-578.
Carver, C. S., & Scheier, M. F. (1999). Optimism. In C. R. Snyder (Ed.), Coping: The psychology of
what works (pp. 232-251). New York: Oxford University Press
Skinner et al. / A Motivational Perspective on Engagement and Disaffection 521
at PORTLAND STATE UNIV on October 27, 2011epm.sagepub.comDownloaded from

Charlesworth, R., & Hartup, W. W. (1967). Positive social reinforcement in the nursery school peer
group. Child Development, 38, 993-1002.
Cheung, G. W., & Rensvold, R. B. (2002). Evaluating goodness of fit indexes for testing measurement
invariance. Structural Equation Modeling: A Multidisciplinary Journal, 9, 233-255.
Connell, J. P., Halpern-Felsher, B. L., Clifford, E., Crichlow, W., & Usinger, P. (1995). Hanging in
there: Behavioral, psychological, and contextual factors affecting whether African-American adoles-
cents stay in high school. Journal of Adolescent Research, 10, 41-63.
Connell, J. P., Spencer, M. B., & Aber, J. L. (1994). Educational risk and resilience in African American
youth: Context, self, and action outcomes in school. Child Development, 65, 493-506.
Connell, J. P., & Wellborn, J. G. (1991). Competence, autonomy and relatedness: A motivational analy-
sis of self-system processes. In M. Gunnar & L. A. Sroufe (Eds.), Minnesota Symposium on Child
Psychology: Vol. 23. Self processes in development (pp. 43-77). Chicago: University of Chicago
Press.
Deci, E. L., & Ryan, R. M. (1985). Intrinsic motivation and self-determination in human behavior. New
York: Plenum Press.
Deci, E. L., & Ryan, R. M. (2000). The ‘‘what’’ and ‘‘why’’ of goal pursuits: Human needs and the self-
determination of behavior. Psychological Inquiry, 11, 227-268.
Dweck, C. S. (1999a). Mastery-oriented thinking. In C. R. Snyder (Ed.), Coping: The psychology of what
works (pp. 232-251). New York: Oxford University Press.
Dweck, C. S. (1999b). Self-theories: Their role in motivation, personality, and development. Philadel-
phia: Psychology Press.
Elliot, A. J. (1999). Approach and avoidance motivation and achievement goals. Educational Psycholo-
gist, 34, 169-189.
Elliot, A. J., & McGregor, H. (2001). A 2× 2 achievement goal framework. Journal of Personality and
Social Psychology, 80, 501-509.
Finn, J. D. (1989). Withdrawing from school. Review of Educational Research, 59, 117-142.
Finn, J. D., Pannozzo, G. M., & Voelkl, K. E. (1995). Disruptive and inattentive-withdrawn behavior
and achievement among fourth graders. The Elementary School Journal, 95, 421-454.
Fredricks, J. A., Blumenfeld, P. C., & Paris, A. H. (2004). School engagement: Potential of the concept,
state of the evidence. Review of Educational Research, 74, 59-109.
Furrer, C., & Skinner, E. (2003). Sense of relatedness as a factor in children’s academic engagement and
performance. Journal of Educational Psychology, 95, 148-162.
Furrer, C., Skinner, E., Marchand, G., & Kindermann, T. A. (2006, March). Engagement vs. disaffection
as central constructs in the dynamics of motivational development. Paper presented at the Society for
Research on Adolescence, San Francisco.
Gottfried, A. E. (1985). Academic intrinsic motivation in elementary and junior high school students.
Journal of Educational Psychology, 77, 631-645.
Harter, S. (1981). A new self-report scale of intrinsic versus extrinsic orientation in the classroom: Moti-
vational and informational components. Developmental Psychology, 17, 300-312.
Henson, R. K. (2001). Understanding internal consistency reliability estimates: A conceptual primer on
coefficient alpha. Measurement and Evaluation in Counseling and Development, 34, 177-189.
Hidi, S., Renninger, K. A., & Krapp, A. (2004). Interest, a motivational variable that combines affective
and cognitive functioning. In D. Dai & R. Sternberg (Eds.), Motivation, emotion, and cognition: Per-
spectives on intellectual development and functioning (pp. 89-115). Mahwah, NJ: Lawrence
Erlbaum.
Horn, W. F., Conners, C. K., & Well, K. C. (1986). Use of the Abikoff classroom observation coding
system on a children’s inpatient psychiatric unit. Journal of Psychopathology and Behavioral Assess-
ment, 8, 9-23.
Jimerson, S. J., Campos, E., & Greif, J. L. (2003). Towards an understanding of definitions and measures
of school engagement and related terms. The California School Psychologist, 8, 7-27.
522 Educational and Psychological Measurement
at PORTLAND STATE UNIV on October 27, 2011epm.sagepub.comDownloaded from
Johnson, M. K., Crosnoe, R., & Elder, G. H., Jr. (2001). Students’ attachment and academic engagement:
The role of race and ethnicity. Sociology of Education, 74, 318-340.
Kerr, M. M., Zignmond, N., Schaeffer, A. L., & Brown, G. M. (1986). An observational follow-up study
of successful and unsuccessful high school students. The High School Journal, 70, 20-24.
Kuhl, J. (1984). Volitional aspects of achievement motivation and learned helplessness: Toward a com-
prehensive theory of action control. In B. A. Maher & W. A. Maher (Eds.), Progress in experimental
personalities research (pp. 99-171). New York: Academic Press.
Libbey, H. P. (2004). Measuring student relationship to school: Attachment, bonding, connectedness,
and engagement. Journal of School Health, 74, 274-283.
Lynch, M., & Cicchetti, D. (1997). Children’s relationships with adults and peers: An examination of
elementary and junior high school students. Journal of School Psychology, 35, 81-99.
Marks, H. M. (2000). Student engagement in instructional activity: Patterns in the elementary, middle,
and high school years. American Educational Research Journal, 37, 153-184.
Merton, R. K. (1953). Social theory and social structure. London: Free Press of Glencoe.
Meyer, D. K., & Turner, J. C. (2002). Discovering emotion in classroom research. Educational Psychol-
ogist, 37, 107-114.
Murdock, T. B. (1999). The social context of risk: Status and motivational predictors of alienation in
middle school. Journal of Educational Psychology, 91, 62-76.
Murray, C., & Greenberg, M. T. (2000). Children’s relationship with teachers and bonds with school.
Journal of School Psychology, 38, 423-445.
Newmann, F. (1991). Student engagement in academic work: Expanding the perspective of secondary
school effectiveness. In J. R. Bliss & W. A. Firestone (Eds.), Rethinking effective schools: Research
and practice (pp. 58-76). New York: Teachers College Press.
Nicholls, J. G. (1984). Achievement motivation: Conceptions of ability, subjective experience, task
choice, and performance. Psychological Review, 91, 328-346.
O’Donnell, J., Hawkins, J. D., & Abbott, R. D. (1995). Predicting serious delinquency and substance use
among aggressive boys. Journal of Consulting and Clinical Psychology, 63, 529-537.
O’Farrell, S. L., & Morrison, G. M. (2003). A factor analysis exploring school bonding and related con-
structs among upper elementary students. The California School Psychologist, 8, 53-72.
Patrick, B. C., Skinner, E. A., & Connell, J. P. (1993). What motivates children’s behavior and emotion?
The joint effects of perceived control and autonomy in the academic domain. Journal of Personality
and Social Psychology, 65, 781-791.
Pekrun, R., Elliot, A. J., & Maier, M. A. (2006). Achievement goals and discrete achievement emotions:
A theoretical model and prospective test. Journal of Educational Psychology, 98, 583-597.
Pekrun, R., Goetz, T., Titz, W., & Perry, R. P. (2002). Academic emotions in students’ self-regulated
learning and achievement: A program of qualitative and quantitative research. Educational Psychol-
ogist, 37, 91-105.
Peterson, C., Maier, S. F., & Seligman, M. E. P. (1993). Learned helplessness: A theory for the age of
personal control. New York: Oxford University Press.
Pierson, L. H., & Connell, J. P. (1992). Effect of grade retention on self-system processes, school
engagement, and academic performance. Journal of Educational Psychology, 84, 300-307.
Pintrich, P. R. (2003). A motivational science perspective on the role of student motivation in learning
and teaching contexts. Journal of Educational Psychology, 95, 667-686.
Reeve, J., Jang, H., Carrell, D., Jeon, S., & Barch, J. (2004). Enhancing students’ engagement by increas-
ing teachers’ autonomy support. Motivation and Emotion, 28, 147-169.
Roeser, R., Strobel, K. R., & Quihuis, G. (2002). Studying early adolescents’ academic motivation,
social-emotional functioning, and engagement in learning: Variable- and person-centered
approaches. Anxiety, Stress, and Coping, 15, 345-368.
Ryan, R. M., & Connell, J. P. (1989). Perceived locus of causality and internalization: Examining rea-
sons for acting in two domains. Journal of Personality and Social Psychology, 57, 749-761.
Skinner et al. / A Motivational Perspective on Engagement and Disaffection 523
at PORTLAND STATE UNIV on October 27, 2011epm.sagepub.comDownloaded from

Schiefele, U. (2001). The role of interest in motivation and learning. In J. M. Collis & S. Messick (Eds.),
Intelligence and personality: Bridging the gap in theory and measurement (pp. 163-194). Mahwah,
NJ: Lawrence Erlbaum.
Schunk, D. H., & Zimmerman, B. J. (Eds.). (1994). Self-regulation of learning and performance. Hills-
dale, NJ: Lawrence Erlbaum.
Schutz, P. A., & DeCuir, J. T. (2002). Inquiry on emotions in education. Educational Psychologist, 37,
125-134.
Sinclair, M. F., Christenson, S. L., Lehr, C. A., & Anderson, A. R. (2003). Facilitating student learning
and engagement: Lessons learned from Check & Connect longitudinal studies. The California School
Psychologist, 8, 29-41.
Skinner, E. A. (1991). Development and perceived control: A dynamic model of action in context. In
M. Gunnar & L. A. Sroufe (Eds.), Minnesota Symposium on Child Development: Vol. 23. Self pro-
cesses in development (pp. 167-216). Hillsdale, NJ: Lawrence Erlbaum.
Skinner, E. A., & Belmont, M. J. (1993). Motivation in the classroom: Reciprocal effects of teacher
behavior and student engagement across the school year. Journal of Educational Psychology, 85,
571-581.
Skinner, E. A., Chapman, M., & Baltes, P. B. (1988). Control, means-ends, and agency beliefs: A new
conceptualization and its measurement during childhood. Journal of Personality and Social Psychol-
ogy, 54, 117-133.
Skinner, E. A., Furrer, C., Marchand, G., & Kindermann, T. (in press). Engagement and disaffection in
the classroom: Part of a larger motivational dynamic? Journal of Educational Psychology.
Skinner, E. A., Johnson, S., & Snyder, T. (2005). Six dimensions of parenting: A motivational model.
Parenting: Science and Practice, 5, 175-236.
Skinner, E. A., Kindermann, T. A., Connell, J. P., & Wellborn, J. G. (in press). Engagement as an organi-
zational construct in the dynamics of motivational development. In K. Wentzel & A. Wigfield
(Eds.), Handbook of motivation in school. Mahwah, NJ: Lawrence Erlbaum.
Skinner, E. A., & Wellborn, J. G. (1997). Children’s coping in the academic domain. In S. A. Wolchik
& I. N. Sandler (Eds.), Handbook of children’s coping with common stressors: Linking theory and
intervention (pp. 387-422). New York: Plenum Press.
Skinner, E. A., Wellborn, J. G., & Connell, J. P. (1990). What it takes to do well in school and whether
I’ve got it: The role of perceived control in children’s engagement and school achievement. Journal
of Educational Psychology, 82, 22-32.
Skinner, E. A., Zimmer-Gembeck, M. J., & Connell, J. P. (1998). Individual differences and the develop-
ment of perceived control. Monographs of the Society for Research in Child Development, 6(2/3),
1-220.
Stenlund, K. V. (1995). Teacher perceptions across cultures: The impact of students on teacher enthu-
siasm and discouragement in a cross-cultural context. Alberta Journal of Educational Research, 41,
145-161.
Vallerand, R. J. (1997). Toward a hierarchical model of intrinsic and extrinsic motivation. In M. P.
Zanna (Ed.), Advances in experimental social psychology (Vol. 29, pp. 271-360). San Diego, CA:
Academic Press.
Weiner, B. (1985). An attributional theory of achievement motivation and emotion. Psychological
Review, 92, 548-573.
Wellborn, J. G. (1991). Engaged and disaffected action: The conceptualization and measurement of
motivation in the academic domain. Unpublished doctoral dissertation, University of Rochester,
New York.
Wentzel, K. R. (1993). Does being good make the grade? Social behavior and academic competence in
middle school. Journal of Educational Psychology, 85, 357-364.
Wentzel, K. R. (1998). Social relationships and motivation in middle school: The role of parents, tea-
chers, and peers. Journal of Educational Psychology, 90, 202-209.
524 Educational and Psychological Measurement
at PORTLAND STATE UNIV on October 27, 2011epm.sagepub.comDownloaded from

Wigfield, A., Eccles, J. S., Schiefele, U., Roeser, R., & Davis-Kean, P. (2006). Development of achieve-
ment motivation. In W. Damon (Series Ed.) & N. Eisenberg (Volume Ed.), Handbook of child psy-
chology: Vol. 3. Social, emotional, and personality development (6th ed., pp. 933-1002). New York:
John Wiley.
Zimmerman, B. J. (2000). Attaining self-regulation: A social cognitive perspective. In M. Boekaerts,
P. R. Pintrich, & M. Zeidner (Eds.), Handbook of self-regulation (pp. 13-39). San Diego, CA:
Academic Press.
Skinner et al. / A Motivational Perspective on Engagement and Disaffection 525
at PORTLAND STATE UNIV on October 27, 2011epm.sagepub.comDownloaded from