education policy analysis - Redalyc · Education Policy Analysis Archives/Archivos Analíticos de...
28
Education Policy Analysis Archives/Archivos Analíticos de Políticas Educativas ISSN: 1068-2341 [email protected] Arizona State University Estados Unidos An, Brian P.; Taylor, Jason L. Are Dual Enrollment Students College Ready? Evidence from the Wabash National Study of Liberal Arts Education Education Policy Analysis Archives/Archivos Analíticos de Políticas Educativas, vol. 23, 2015, pp. 1-26 Arizona State University Arizona, Estados Unidos Available in: http://www.redalyc.org/articulo.oa?id=275041389028 How to cite Complete issue More information about this article Journal's homepage in redalyc.org Scientific Information System Network of Scientific Journals from Latin America, the Caribbean, Spain and Portugal Non-profit academic project, developed under the open access initiative
Transcript of education policy analysis - Redalyc · Education Policy Analysis Archives/Archivos Analíticos de...
Education Policy Analysis
Archives/Archivos Analíticos de Políticas
Educativas
ISSN: 1068-2341
Arizona State University
Estados Unidos
An, Brian P.; Taylor, Jason L.
Are Dual Enrollment Students College Ready? Evidence from the Wabash National Study
of Liberal Arts Education
Education Policy Analysis Archives/Archivos Analíticos de Políticas Educativas, vol. 23,
2015, pp. 1-26
Arizona State University
Arizona, Estados Unidos
Available in: http://www.redalyc.org/articulo.oa?id=275041389028
How to cite
Complete issue
More information about this article
Journal's homepage in redalyc.org
Scientific Information System
Network of Scientific Journals from Latin America, the Caribbean, Spain and Portugal
Non-profit academic project, developed under the open access initiative

Journal website: http://epaa.asu.edu/ojs/ Manuscript received: 6/27/2014Facebook: /EPAAA Revisions received: 3/19/2015Twitter: @epaa_aape Accepted: 3/19/2015
education policy analysis archivesA peer-reviewed, independent, open access, multilingual journal
Arizona State University
Volume 23 Number 58 June 22nd, 2015 ISSN 1068-2341
Are Dual Enrollment Students College Ready? Evidence from the Wabash National Study of Liberal Arts Education
Brian P. An University of Iowa
&Jason L. Taylor
University of UtahUnited States
Citation: An, B. P., & Taylor, J. L. (2015). Are dual enrollment students college ready? Evidence from the Wabash National Study of Liberal Arts Education. Education Policy Analysis Archives, 23(58). http://dx.doi.org/10.14507/epaa.v23.1781
Abstract: We examine whether dual enrolled students display greater levels of college readiness than nonparticipants. Advocates assert that dual enrollment improves students’ college readiness, but despite these assertions, few researchers have evaluated this relationship. Moreover, researchers that do consider whether dual enrollment improves college readiness examine this relationship while students participate in dual enrollment or shortly thereafter. Unlike traditional measures of college readiness that tend to emphasize the cognitive domain of college readiness, we use measures that integrate both cognitive and noncognitive domains of college readiness. We find that students who participated in dual enrollment tend to be more college ready than those who did not earn college credit in high school. The exception is that there is no statistical difference between dual enrollees and non-accelerators in their key transition knowledge and skills. The magnitude of the dual enrollment effect is second only to gender.Keywords: dual enrollment; concurrent enrollment; accelerated programs; noncognitive factors; college readiness.
epaa aape
Education Policy Analysis Archives Vol. 23 No. 58 2
¿Están los Estudiantes de Matriculas Duales Preparados para Ingresar a la Universidad? Evidencia del Estudio Nacional de Artes de WabashResumen: Examinamos si los estudiantes de matriculas duales muestran mayores niveles de preparación para la universidad que los que no participan en ese programa. Los defensores afirman que la doble inscripción mejora la preparación para la universidad de los estudiantes, pero a pesar de estas afirmaciones, pocos investigadores han evaluado esta relación. Por otra parte, los investigadores que si consideran que la doble matrícula mejora la preparación universitaria examinan esta relación mientras los estudiantes participan en doble inscripción o poco después. A diferencia de las medidas tradicionales de preparación para la universidad que tienden a enfatizar el dominio cognitivo de preparación para la universidad, utilizamos medidas que integran dominios cognitivos y no-cognitivos de preparación para la universidad. Encontramos que los estudiantes que participaron en la doble matrícula tienden a ser más preparados para la universidad que los que no ganan créditos universitarios en la escuela secundaria. La excepción es que no hay diferencia estadística entre los inscritos en matriculas duales y los que no en conocimientos y habilidades importantes para los estudios universitarios. El efecto de magnitud de las matriculas duales sólo es superado por el género.Palabras clave: doble matrícula; inscripción simultánea; programas acelerados; factores no-cognitivos; preparación para la universidad
Estão os Alunos de Matrícula Dupla Preparados para Entrar na Faculdade? Evidências do Estudo Nacional de Artes de WabashResumo: Examinamos se os alunos de inscrição duplas mostram níveis mais elevados de preparação para a faculdade do que aqueles que não participam nesse programa. Os defensores argumentam que a dupla inscrição melhor preparação para os estudantes universitários, mas apesar destas afirmações, poucos pesquisadores avaliaram essa relação. Além disso, os pesquisadores acreditam que, se a dupla prontidão faculdade de inscrição melhora a examinar esta relação, enquanto os alunos participam de matrícula dupla ou pouco depois. Ao contrário de medidas tradicionais de prontidão para faculdade que tendem a enfatizar o domínio cognitivo de preparação para a faculdade, usamos medidas que integram domínios cognitivos e não-cognitivas na preparação para a faculdade. Descobrimos que os alunos que participaram do programa da matrícula dupla tendem a estar mais preparados para a faculdade do que aqueles que não ganham créditos universitários na escola. A exceção é que não há diferença estatística entre os alunos de dupla inscrição e os que não em conhecimentos e habilidades importantes para a faculdade. A magnitude do efeito da dupla inscrição só é superado por gênero.Palavras-chave: matrícula dupla; matrícula concomitante; programas acelerados; fatores não-cognitivos; preparação para a faculdade
Introduction1
Researchers and policy makers typically define dual enrollment as a college course that high school students take and for which they receive college credit upon successful completion. Also referred to as dual credit or concurrent enrollment, dual enrollment policies and programs vary by state, but a similar feature among these programs is that students participate in college-level courses while in high school (Borden, Taylor, Park, & Seiler, 2013; Karp, Bailey, Hughes, & Fermin, 2005). Recent evidence shows dual enrollment is a widespread and growing phenomenon. In 2010,
1 Both authors equally contributed to the study and the authorship order is alphabetical.
Are Dual Enrollment Students College Ready? 3
approximately 82% of public high schools had students who participated in dual enrollment courses, and as of 2012, at least 47 states have polices related to dual enrollment (Borden et al., 2013; Thomas, Marken, Gray, & Lewis, 2013).
Proponents of dual enrollment contend these programs enhance the senior year of high school, increase college access and success, reduce time to a college degree, and save students money (Hoffman, Vargas, & Santos, 2008; Klopfenstein, 2010). Indeed, studies show dual enrollees tend to earn higher grades and are more likely to attain a college degree than non-dual enrollees (Allen & Dadgar, 2012; An, 2013a, 2013b; Karp, Calcagno, Hughes, Jeong, & Bailey, 2007; Taylor, in press). In addition to credit accumulation and degree completion, evidence suggests dual enrollment improves students’ college readiness (An, 2013b; Kim & Bragg, 2008). In this paper, we define college readiness as cognitive factors (e.g., academic achievement and coursework) and noncognitive factors (e.g., commitment to academic goals and effort) that are required to transition to and succeed in college without the need for course remediation (Conley, 2012). Policy makers, social scientists, and advocacy groups have elevated college readiness to the national discourse, partly due to the large number of students participating in remedial education. Research shows 52% of students at two-year colleges and 20% of students at four-year colleges test into and enroll in remediation (Complete College America, 2012).
Some researchers consider dual enrollment as a means to reduce the need for remediation, in particular, and to improve college readiness, more generally. Studies show dual enrollees are less likely to enroll in a remedial course than non-dual enrollees (An, 2013b; Kim & Bragg, 2008). Despite advocates’ assertion that dual enrollment improves students’ college readiness (e.g., Blackboard Institute, 2010; Conklin & Sanford, 2007; Texas P-16 Council, 2007), there is little research on the relationship between dual enrollment and college readiness. Studies showing that dual enrollment decreases the need for remediation generally assume college readiness is the mechanism through which dual enrollment affects academic performance; yet few researchers test this assumption. Moreover, researchers that do consider whether dual enrollment improves college readiness focus on the immediate gains in college readiness while students are participating in dual enrollment or shortly thereafter (Burns & Lewis, 2000; Huntley & Schuh, 2002–2003; Karp, 2012; Medvide, & Blustein, 2010), or measure college readiness using only academic indicators (An, 2013b). In other words, most dual enrollment studies assess outcomes while students are in high school or upon their immediate transition to college using cognitive measures or academic proxies of college readiness such as standardized test scores and placement in remediation. Although important, it is unclear whether dual enrollees display signs of college readiness after they matriculate to college using a more comprehensive definition of college readiness.
Our study addresses this gap in that we examine the relationship between dual enrollment participation and college readiness at the end of students’ first year of college using data from the Wabash National Study of Liberal Arts Education—a large-scale, longitudinal study designed to understand factors that influence the outcomes of a liberal arts education. Although advocates of dual enrollment programs and policies claim these programs increase college readiness, few researchers have empirically tested this assertion. Instead of focusing on students’ gains in college readiness before and after they participated in dual enrollment, as is common of previous studies, we consider whether dual enrollees continue to display higher levels of college readiness than non-dual enrollees at the end of their first year of college. Furthermore, we consider not just cognitive measures of college readiness, but expand college readiness using Conley’s (2007, 2012) model to examine the relationship between dual enrollment and noncognitive measures of college readiness.
This study is timely for several reasons. First, dual enrollment is expanding in scope. The number of students participating in dual enrollment has increased substantially over the past 10
Education Policy Analysis Archives Vol. 23 No. 58 4
years (Thomas et al., 2013; Waits, Setzer, & Lewis, 2005). Second, state dual enrollment policies continue to evolve and vary extensively (Borden et al., 2013), which suggests students’ experience in dual enrollment may differ across institutional contexts. Third, understanding the relationship between dual enrollment and a more comprehensive definition of college readiness could inform policy makers and educators’ efforts to design effective dual enrollment policies and programs. Finally, if policy makers and educators want to promote dual enrollment as a means to raise college readiness, then researchers need to investigate this relationship in college instead of considering it immediately after students completed the program.
In the next section, we provide a literature overview on dual enrollment as well as literature on college readiness. We then highlight the relationship between dual enrollment and college readiness. Finally, we discuss the limitations of previous definitions of college readiness and propose Conley’s (2007, 2012) more comprehensive consideration of college readiness.
Literature ReviewDual Enrollment Programs
As previously noted, dual enrollment is an accelerated program where high school students participate in college-level courses, where they receive either only college credit or both high school and college credit (Allen, 2010; Blackboard Institute, 2010; Hoffman et al., 2008). Although a seemingly straightforward definition, the types of programs described as dual enrollment vary extensively. Bailey and Karp (2003) define three types of credit-based transition programs: 1) singleton programs are stand-alone college courses available to high school students; 2) comprehensive programs include multiple college courses typically offered during the junior and senior year of high school; and 3) enhanced comprehensive programs integrate college-level courses and various support services to high school students. Thus, students’ participation in dual enrollment might occur once or twice in the form of a singleton program or might occur repeatedly during their high school experience that could result in the completion of an associate’s degree at the time of high school graduation, as for example, the case with Early and Middle College High Schools.
Both dual enrollment participation and state policies have expanded in recent years. Parallel surveys administered by the National Center for Education Statistics show the estimated number of students participating in dual enrollment courses increased from approximately 1.2 million students in 2002–03 to 2.0 million students in 2010–11. The percentage of high schools that offer dual enrollment also increased, from 71% to 82%, during the same period (Thomas et al., 2013; Waits et al., 2005). In addition to increased participation in dual enrollment, states with formal legislative or board policies that address dual enrollment increased from 33 states in 2001 to 47 states in 2012 (Borden et al., 2013; Education Commission of the States, 2001).
Policy makers and educators have argued that dual enrollment programs and policies offer students many benefits, which include enriching students’ senior year of high school (Allen, 2010), diversifying the high school curriculum (Boswell, 2001), preparing students for college and increasing students’ college aspirations (Smith, 2007), and reducing time to a college degree and saving students money (Hoffman et al., 2008). Furthermore, there is accumulating evidence that dual enrollment participation positively influences students’ college enrollment, college GPA, college persistence, and college completion (Allen & Dadgar, 2012; An, 2013a, 2013b; Karp et al., 2007; Taylor, In press).

Are Dual Enrollment Students College Ready? 5
Importance of College Readiness on College Success
Under the Obama Administration, the United States Department of Education has prioritized “college and career readiness” for all students (U.S. Department of Education, 2010). Although promoted as a policy goal, policy makers, educators, and researchers have differed in their meaning of college readiness. Traditionally, organizations and researchers have defined college preparation or readiness by students’ academic readiness or academic ability, as measured by the types of courses taken in high school, need for remediation, standardized test scores, and high school grade point averages (ACT, 2012b; Adelman, 2006). The National Association for College Admission Counseling indicates that standardized exam scores, grades in college prep courses, and the strength of students’ curriculum tend to be the most important factors for college admission decisions (Clinedinst & Hawkins, 2010). Even in non-selective institutions such as community colleges, administrators use standardized math, English, and reading placement exams to assess students’ readiness for college coursework (Parsad & Lewis, 2003). Furthermore, recent studies on the college readiness of high school students tend to operationalize college readiness using standardized tests scores or other academic measures (Maruyama, 2012; Porter & Polikoff, 2012; Venezia & Voloch, 2012).
ACT identifies college readiness benchmarks as minimum ACT scores necessary for students’ success in college courses in English, reading, math, and science (ACT, 2012a). The assumption is that high school students who meet these benchmarks are ready for college and likely to be successful in college. That is, ACT benchmark scores predict success in college courses (ACT, 2012a).
The academic rigor of students’ high school coursework strongly determines how well they perform and persist in college. For instance, Adelman (1999) estimates over two-fifths of the contribution precollege academic preparation has on undergraduate degree attainment is due to students’ high school curriculum. Researchers in particular consider math coursework, such as Algebra II or trigonometry, as important gateway courses for students’ college success (Porter & Polikoff, 2012).
A separate but related body of scholarship suggests that noncognitive factors predict college enrollment and retention, such as adjustment and motivation. Sedlacek (2004) identifies eight variables that constitute the noncognitive domain: positive self-concept, realistic self-appraisal, successfully handling the system, preference for long-term goals, availability of strong support person, leadership experience, community involvement, and knowledge acquired in a field. He argues these noncognitive indicators are especially relevant for nontraditional students.
The Relationship between Dual Enrollment and College Readiness
Dual enrollment provides an opportunity for students to transition more seamlessly from high school to college. Dual enrollees are more likely to understand what it means to be a “college student” and are able to navigate the college landscape better than non-dual enrollees (Bailey, Hughes, & Karp, 2002; Karp, 2012). For instance, Karp (2012) argues dual enrollment helps students’ transition from high school to college because students learn the normative rules and behaviors of college from participating in these programs. This transition not only requires students to prepare academically for the rigors of college coursework, students also need to understand better the postsecondary educational system. Therefore, dual enrollees spend less time floundering during the first year of college and they become acclimated to their new role quicker than non-dual enrollees. Karp (2012) shows students who participated in dual enrollment initially had little understanding of the study skills and expectations necessary to succeed in college. As students finish their dual enrollment course, however, they have a better sense of these skills and expectations for

Education Policy Analysis Archives Vol. 23 No. 58 6
college success. Research furthermore shows participation in dual enrollment improves students’ study habits and raises their academic motivation (An, 2015; Karp, 2012; Smith, 2007). Dual-enrolled students are more likely to work harder in their college courses than their high school courses because the dual enrollment courses count toward college (Medvide & Blustein, 2010). Given these improvements in study habits and motivations, dual enrollment participants are able to handle better the expectations of and interactions with college professors than nonparticipants (Andrews, 2004; Huntley & Schuh, 2002–2003; Medvide & Blustein, 2010). Prior research provides some evidence that dual enrollment improves students’ college readiness. The probability of taking a remedial course for students who participated in dual enrollment is lower than those who did not participate in dual enrollment (An, 2013b; Kim & Bragg, 2008).
Despite the insights derived from prior research, research on dual enrollment effects tend to concentrate on two related streams of inquiry. The first considers the influence of dual enrollment on immediate educational outcomes. For example, researchers are interested in whether dual enrollment participation alters a student’s academic motivation, educational expectations, and college readiness immediately after participation or prior to college matriculation. These outcomes serve as conditions of college preparation (before students matriculate to college). The second stream of research focuses on the influence of dual enrollment on college outcomes, such as college enrollment, college grades, or college degree attainment. Here, researchers are interested in whether dual enrollment improves important markers for college success and persistence, which ultimately lead to a college degree.
Although dual enrollment researchers typically agree that one purpose of dual enrollment is to improve college readiness, few researchers have explicitly tested this claim. Our study addresses this gap. Unlike prior research, we do not consider the immediate influence of dual enrollment participation on college readiness (we operationalize college readiness below). If participation in dual enrollment improves college readiness, we would expect dual enrollees to exhibit higher levels of college readiness indicators when enrolled in college compared to non-dual enrollees. Furthermore, instead of traditional measures of college readiness (e.g., ACT scores), we use Conley’s (2007, 2012) framework of college readiness. The significance of Conley’s framework is that: it includes both cognitive and noncognitive measures of college readiness; it is empirically grounded; and practitioners, policy makers, and researchers are increasingly applying it in state and local contexts.
Conley’s Framework of College Readiness
David Conley (2007, 2012) developed a model that defines the knowledge and skills needed for a student to be college and career ready. Conley’s (2007, 2012) model integrates the cognitive and noncognitive domains previously discussed into four primary dimensions: a) key cognitive strategies; b) key content knowledge; c) key learning skills and techniques; and d) key transition knowledge and skills.2
Key cognitive strategies are the intentional and practiced intellectual behaviors important for college-level work, and they include problem formulation, research, interpretation, communication, and verification (Conley, 2007, 2012). The second dimension, key content knowledge, is an understanding of the structure of knowledge and foundational content from core subject areas. This dimension also includes students’ interactions with content knowledge, their perceptions about the value of content knowledge, and their effort and willingness to learn content knowledge. Key learning skills and techniques, the third dimension, includes ownership of learning (e.g., goal setting, motivation, self-efficacy, and help seeking) and learning techniques (e.g., time management, study skills,
2 Conley’s (2007) initial model has changed somewhat (Conley, 2012), but the constructs remain similar and the model is empirically grounded in a national study of college faculty (Conley, 2010).

Are Dual Enrollment Students College Ready? 7
memorization/recall, strategic reading, and collaborative learning). The last dimension is key transition knowledge and skills, privileged information students need to understand how colleges operate. This includes information that students need to transition successfully from high school, such as collegeadmissions, college costs, career and college major awareness, college norms and expectations, and self-advocacy (Conley, 2012). It also includes skills necessary to interact with a diverse array of individuals in college, which includes peers and faculty (Conley, 2007).
Despite the comprehensiveness of Conley’s (2012) model, researchers have yet to develop instruments to measure comprehensively these four dimensions. Conley and his associates developed the College Ready School Diagnostic instrument and have attempted to validate some of the underlying constructs (Lombardi, Conley, Seburn, & Downs, 2013; Lombardi, Seburn, & Conley, 2011). This instrument, however, measures constructs that predict college readiness while students are still in high school and before they matriculate to college. Conley’s premise is that students need to be prepared not only for college enrollment but also for college success. It is therefore important to evaluate college readiness indicators from students’ behaviors and performance in college and not just prior to college. The question then becomes whether the college readiness that students obtain through dual enrollment translates into observable college readiness indicators that are associated with Conley’s model.
Given recent assertions that dual enrollment improves college readiness, it is critical to test empirically this claim. Further, it is relevant to determine if dual enrollment improves college readiness using measures that go beyond cognitive measures and tap into noncognitive dimensions of college readiness (Karp, 2012). We posed the following research question in this study: Do dualenrolled students outperform non-dual enrolled students on cognitive and non-cognitive college readiness indicators during their first year of college?
Data and Methods
We used existing data from the Wabash National Study of Liberal Arts Education (WNSLAE), a longitudinal study of first-year, full-time undergraduate students who entered one of 23 four-year postsecondary institutions in 2008. These postsecondary institutions are located in 14 states and spans across all four Census regions: West, Midwest, Northeast, and South. Despite the multiple regions from which institutions came, the majority of institutions are from the Midwest (26%) and Northeast (57%) regions. The WNSLAE investigators surveyed students in the fall of 2008 (beginning of their first year), and resurveyed them in the spring of 2009 (the end of their first year) (Center of Inquiry at Wabash College, 2011). The primary purpose of WNSLAE is to study the influence of liberal arts colleges and experiences, and as a result, investigators oversampled liberal arts colleges (17 colleges). Despite this oversample of liberal arts colleges, WNSLAE investigators sampled students from six universities, of which 43% of students in the WNSLAE data were derived.
WNSLAE is well suited for our study because investigators administered the National Survey of Student Engagement (NSSE) and the WNSLAE Student Experiences Survey (WSES), both of which include measures related to college readiness. These surveys are designed to capture student engagement and good practices of undergraduate education, which are conceptually related to Conley’s (2007, 2012) college readiness model. For example, NSSE provided us with information on how students spend their time in college. Importantly, investigators collected information of the time and effort students put into their studies as well as how students interact with others (e.g., students) in college. Furthermore, the Student Experience Survey provided information about a
Education Policy Analysis Archives Vol. 23 No. 58 8
student’s academic motivation and peer interactions, such as diversity and critical thinking.
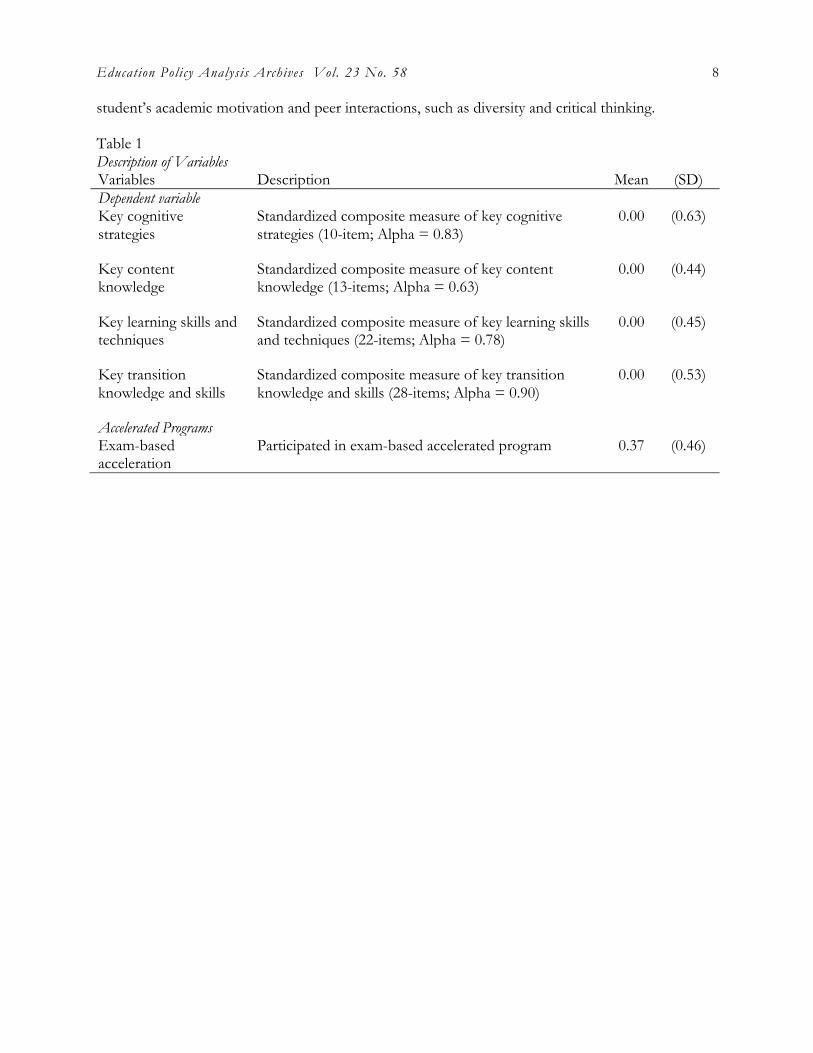
Table 1Description of VariablesVariables Description Mean (SD)Dependent variableKey cognitive strategies
Standardized composite measure of key cognitive strategies (10-item; Alpha = 0.83)
0.00 (0.63)
Key content knowledge
Standardized composite measure of key content knowledge (13-items; Alpha = 0.63)
0.00 (0.44)
Key learning skills and techniques
Standardized composite measure of key learning skills and techniques (22-items; Alpha = 0.78)
0.00 (0.45)
Key transition knowledge and skills
Standardized composite measure of key transition knowledge and skills (28-items; Alpha = 0.90)
0.00 (0.53)
Accelerated ProgramsExam-based acceleration
Participated in exam-based accelerated program 0.37 (0.46)

Are Dual Enrollment Students College Ready? 9
Table 1 (Cont’d.)Description of VariablesVariables Description Mean (SD)Dual enrollment Participated in dual enrollment program (Reference
group are students who did not participate in any accelerated program or who did not earn college credit)
0.14 (0.32)
BackgroundUnderrepresented minority
Student is an underrepresented minority 0.12 (0.32)
Female Student is female 0.63 (0.48)
Parent education (Some college)
At least one parent attended college but did not earn a bachelor’s degree
0.19 (0.39)
Parent education (B.A.)
At least one parent earned a bachelor’s degree 0.31 (0.46)
Parent education (Post-B.A.)
At least one parent earned a post-bachelor’s or advanced degree
0.39 (0.49)
Disability Disability status (blind, deaf, learning, mobility, other, or speech)
0.06 (0.24)
Non-English native language
Student native language is other than English 0.08 (0.28)
Siblings Number of siblings 1.64 (1.03)
ACT scores ACT scores 25.27 (4.48)Notes. WNSLAE 2008. Sample size is 4,213 respondents.
College Readiness Measures
We aligned WNSLAE variables with Conley’s (2012) four dimensions of college readiness (see table 1 for variables’ description and summary statistics). We used a 10-item scale (alpha = 0.83) to capture (1) key cognitive strategies (see appendix for each dimension’s list of items). Some example items include: the time a student spent analyzing basic elements of an idea, experience, or theory; the extent to which a student learned something that altered the way he or she understood an issue; and the extent to which a student spent synthesizing and organizing ideas. (2) Key content knowledge is a 13-item scale (alpha = 0.63) that represents a student’s understanding of the structure of knowledge and foundational content from core subject areas. Some items in this scale include the number of courses a student took in core subject areas, and the extent to which a student works to learn course materials. We captured (3) key learning skills and techniques with 22 items (alpha = 0.78), such as the extent to which students challenged each other’s ideas in class and the degree to which students asked questions in class. Finally (4) key transition knowledge and skills comprised of 28 items (alpha = 0.90), which include skills necessary to interact with diverse faculty and peers (e.g.,
Education Policy Analysis Archives Vol. 23 No. 59 10
the extent to which a student had serious discussions with faculty whose political, social, or religion differ from his or her own). Because the WNSLAE was designed to follow students’ college experiences, the key transition knowledge and skills are restricted to students’ interactions with others such as faculty and peers instead of skills needed for college matriculation.
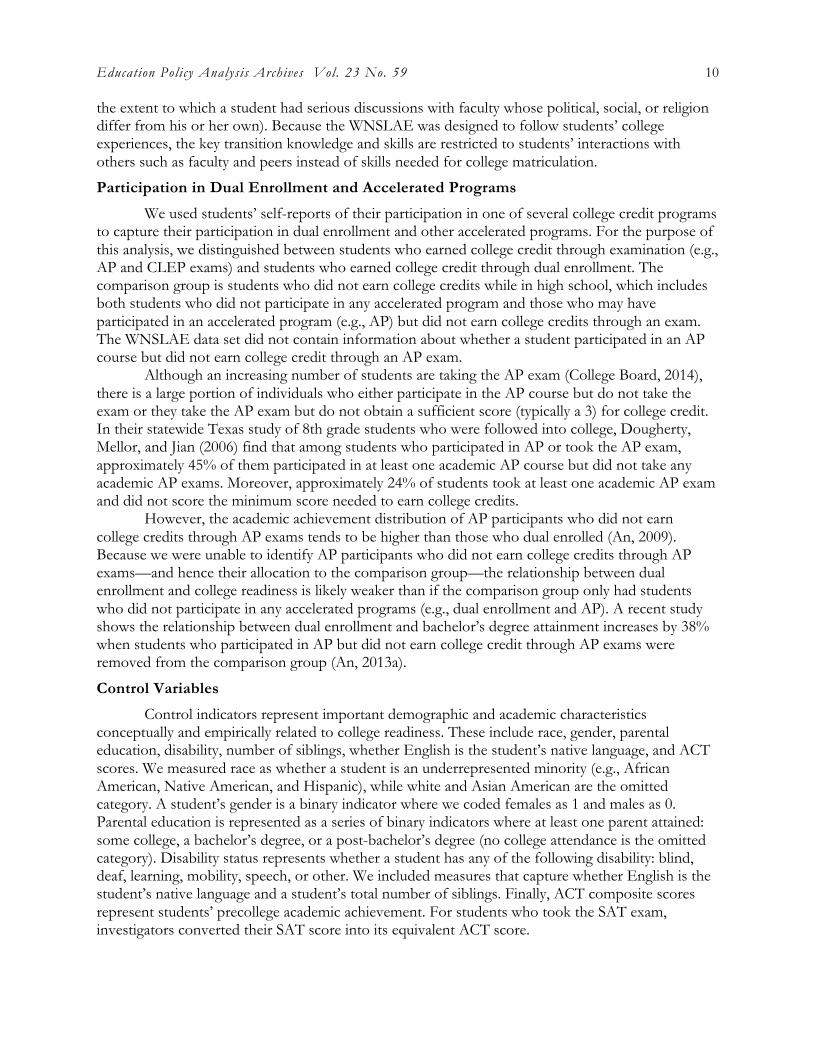
Participation in Dual Enrollment and Accelerated Programs
We used students’ self-reports of their participation in one of several college credit programs to capture their participation in dual enrollment and other accelerated programs. For the purpose of this analysis, we distinguished between students who earned college credit through examination (e.g., AP and CLEP exams) and students who earned college credit through dual enrollment. The comparison group is students who did not earn college credits while in high school, which includes both students who did not participate in any accelerated program and those who may have participated in an accelerated program (e.g., AP) but did not earn college credits through an exam. The WNSLAE data set did not contain information about whether a student participated in an AP course but did not earn college credit through an AP exam.
Although an increasing number of students are taking the AP exam (College Board, 2014), there is a large portion of individuals who either participate in the AP course but do not take the exam or they take the AP exam but do not obtain a sufficient score (typically a 3) for college credit. In their statewide Texas study of 8th grade students who were followed into college, Dougherty, Mellor, and Jian (2006) find that among students who participated in AP or took the AP exam, approximately 45% of them participated in at least one academic AP course but did not take any academic AP exams. Moreover, approximately 24% of students took at least one academic AP exam and did not score the minimum score needed to earn college credits.
However, the academic achievement distribution of AP participants who did not earn college credits through AP exams tends to be higher than those who dual enrolled (An, 2009). Because we were unable to identify AP participants who did not earn college credits through AP exams—and hence their allocation to the comparison group—the relationship between dual enrollment and college readiness is likely weaker than if the comparison group only had students who did not participate in any accelerated programs (e.g., dual enrollment and AP). A recent study shows the relationship between dual enrollment and bachelor’s degree attainment increases by 38% when students who participated in AP but did not earn college credit through AP exams were removed from the comparison group (An, 2013a).
Control Variables
Control indicators represent important demographic and academic characteristics conceptually and empirically related to college readiness. These include race, gender, parental education, disability, number of siblings, whether English is the student’s native language, and ACT scores. We measured race as whether a student is an underrepresented minority (e.g., African American, Native American, and Hispanic), while white and Asian American are the omitted category. A student’s gender is a binary indicator where we coded females as 1 and males as 0. Parental education is represented as a series of binary indicators where at least one parent attained: some college, a bachelor’s degree, or a post-bachelor’s degree (no college attendance is the omitted category). Disability status represents whether a student has any of the following disability: blind, deaf, learning, mobility, speech, or other. We included measures that capture whether English is the student’s native language and a student’s total number of siblings. Finally, ACT composite scores represent students’ precollege academic achievement. For students who took the SAT exam, investigators converted their SAT score into its equivalent ACT score.

Are Dual Enrollment Students College Ready? 11
Data Limitations
As with other studies, the WNSLAE data set has limitations that readers should consider when interpreting the findings. One limitation of our study is the result’s generalizability. Although the WNSLAE data set includes a broad range of institutional types, institutions are overrepresented from the Northeast and Midwest. Moreover, because a main purpose of WNSLAE was to investigate students’ experiences of liberal arts colleges and education, investigators oversampled liberal arts colleges. Therefore, our results may not generalize to undergraduate colleges and universities in the United States. Future research is needed where researchers evaluate the robustness of our findings on a different sample of institutions.
A second possible limitation is that we measure college readiness at the end of students’ first year of college. Students who are not college ready are less likely to be retained in college than students who are college ready (Porter & Polikoff, 2012). Perhaps ideally we would investigate college readiness at the end of the first semester rather than at the end of the first year; unfortunately, our data do not allow us to make such investigation. Although non-ready students are more likely to drop out during the first year of college, this does not imply perfect correspondence between dropping out and college readiness. Moreover, dual enrollees are more likely to persist through the first year of college than non-dual enrollees (Karp et al., 2007). What this suggests is that a comparison group at the end of the first year tends to have characteristics about them that are more favorable for college success than a comparison group at the beginning of the year. As a result, we are likely to produce conservative (weaker) estimates of the relationship between dual enrollment and college readiness.
A third possible limitation of our study is that our measure of race as a binary indicator does not allow us to analyze race and ethnic groups. Our decision to use a single binary indicator for race is due to sample size limitations. However, because the relationship between race and college readiness is not the focus of our study, and therefore included as a control variable, not using more distinctive race and ethnic categories would be problematic if this inclusion would alter the relationship between dual enrollment and college readiness.
A fourth potential limitation of our study is that readers may wonder whether the items we used capture a uni-dimensional construct of each college readiness dimension. Although increasingly popular, Conley has yet to create clear instruments capturing his dimensions of college readiness. However, Conley (2007, 2012) includes exemplars of items within each college readiness dimension, and we construct our measures based on these examples. Our intention was not to verify Conley’s dimensions of college readiness or to use an exploratory factor analysis to generate a new model of college readiness. Rather, our intention was to use Conley’s model for the purpose of investigating the relationship between dual enrollment and a well-known college readiness framework. Therefore, verifying Conley’s dimensions of college readiness is beyond the scope of this paper.
Data Analysis
We employed institutional level fixed-effects models to estimate the influence of dual enrollment on college readiness. These models account for all stable characteristics, both observed and unobserved, that are shared among individuals within a given institution. As a result, fixed-effects models use only within-institution variation to estimate effects (Allison, 2009). For example, institutions may differ in their policies for the scores needed to receive college credit through AP exams. Traditional regression approaches weigh information specific to students with information specific to institutions.
Missing values in variables ranged from 0% to 18%, and listwise deletion reduces the sample by 22%. We implemented a multiple imputation technique to handle missing values where we

Education Policy Analysis Archives Vol. 23 No. 59 12
created 10 replicated data sets. For the independent and control variables, the sample size is 4,213 respondents. However, we removed imputed values of the dependent variable—which differed depending on the measure of college readiness—because imputed values on the dependent variable adds little information to the estimates (von Hippel, 2007). As a result, the sample size ranged from 4,035 to 4,209, depending on the college readiness outcome.3
Table 2Summary Statistics of Students Based on their Participation in Accelerated Programs
Exam-based Dual Non- DifferenceAccelerator (E) Enrollment (D) Accelerator (N) in means?
M (SE) M (SE) M (SE) E–D E–N D–N
Underrepresented minority 0.08 (0.01) 0.13 (0.02) 0.14 (0.01) Yes Yes
Female 0.60 (0.01) 0.66 (0.02) 0.65 (0.01) Yes Yes
Parent education (Some college)
0.13 (0.01) 0.18 (0.02) 0.23 (0.01) Yes Yes Yes
Parent education (B.A.) 0.30 (0.01) 0.34 (0.02) 0.31 (0.01)
Parent education (Post-B.A.)
0.50 (0.01) 0.38 (0.02) 0.33 (0.01) Yes Yes Yes
Disability 0.05 (0.01) 0.06 (0.01) 0.07 (0.01)
Non-English native language
0.07 (0.01) 0.07 (0.01) 0.09 (0.01) Yes
Siblings 1.54 (0.03) 1.66 (0.05) 1.69 (0.02) Yes Yes
3 We also estimated fixed effects models where we restricted the sample to those with information on all four college readiness outcomes (sample size of 4,023) and found that the estimated coefficients did not change substantively as the results we presented in our paper.
Are Dual Enrollment Students College Ready? 13
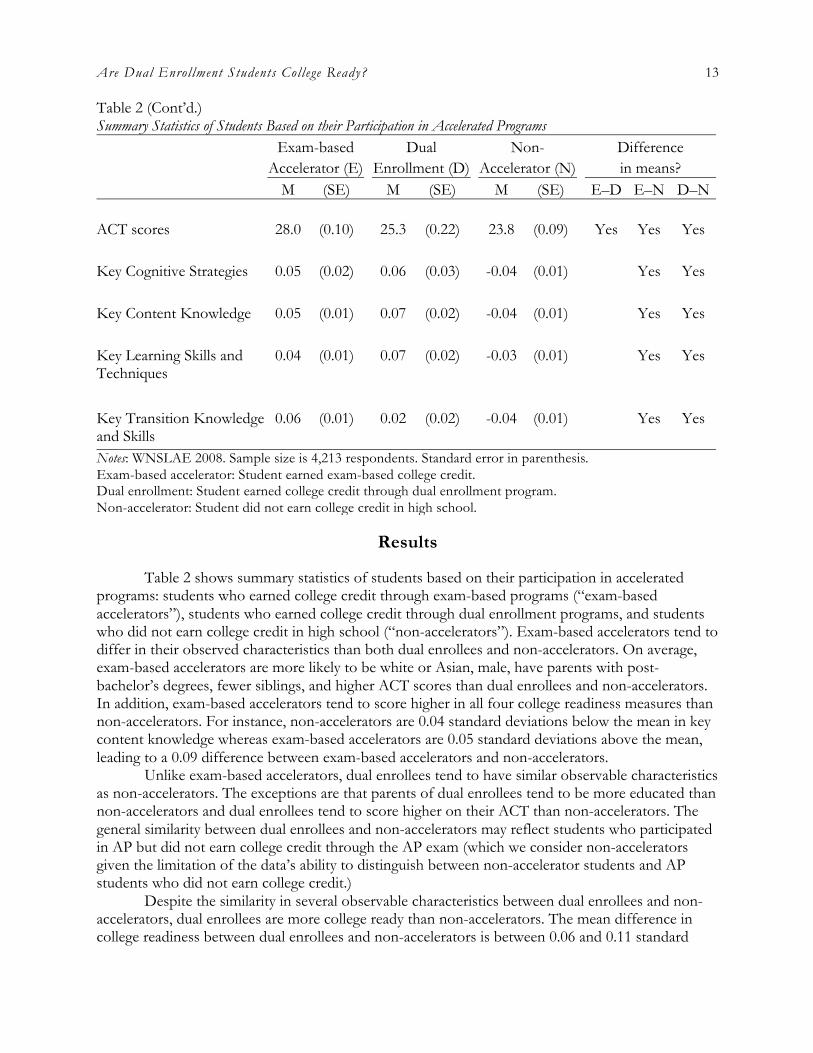
Table 2 (Cont’d.)Summary Statistics of Students Based on their Participation in Accelerated Programs
Exam-based Dual Non- DifferenceAccelerator (E) Enrollment (D) Accelerator (N) in means?
M (SE) M (SE) M (SE) E–D E–N D–N
ACT scores 28.0 (0.10) 25.3 (0.22) 23.8 (0.09) Yes Yes Yes
Key Cognitive Strategies 0.05 (0.02) 0.06 (0.03) -0.04 (0.01) Yes Yes
Key Content Knowledge 0.05 (0.01) 0.07 (0.02) -0.04 (0.01) Yes Yes
Key Learning Skills and Techniques
0.04 (0.01) 0.07 (0.02) -0.03 (0.01) Yes Yes
Key Transition Knowledge and Skills
0.06 (0.01) 0.02 (0.02) -0.04 (0.01) Yes Yes
Notes: WNSLAE 2008. Sample size is 4,213 respondents. Standard error in parenthesis.Exam-based accelerator: Student earned exam-based college credit.Dual enrollment: Student earned college credit through dual enrollment program.Non-accelerator: Student did not earn college credit in high school.
Results
Table 2 shows summary statistics of students based on their participation in accelerated programs: students who earned college credit through exam-based programs (“exam-based accelerators”), students who earned college credit through dual enrollment programs, and students who did not earn college credit in high school (“non-accelerators”). Exam-based accelerators tend to differ in their observed characteristics than both dual enrollees and non-accelerators. On average, exam-based accelerators are more likely to be white or Asian, male, have parents with post-bachelor’s degrees, fewer siblings, and higher ACT scores than dual enrollees and non-accelerators. In addition, exam-based accelerators tend to score higher in all four college readiness measures than non-accelerators. For instance, non-accelerators are 0.04 standard deviations below the mean in key content knowledge whereas exam-based accelerators are 0.05 standard deviations above the mean, leading to a 0.09 difference between exam-based accelerators and non-accelerators.
Unlike exam-based accelerators, dual enrollees tend to have similar observable characteristics as non-accelerators. The exceptions are that parents of dual enrollees tend to be more educated than non-accelerators and dual enrollees tend to score higher on their ACT than non-accelerators. The general similarity between dual enrollees and non-accelerators may reflect students who participated in AP but did not earn college credit through the AP exam (which we consider non-accelerators given the limitation of the data’s ability to distinguish between non-accelerator students and AP students who did not earn college credit.)
Despite the similarity in several observable characteristics between dual enrollees and non-accelerators, dual enrollees are more college ready than non-accelerators. The mean difference in college readiness between dual enrollees and non-accelerators is between 0.06 and 0.11 standard

Education Policy Analysis Archives Vol. 23 No. 58 14
deviations. Moreover, there are little differences in college readiness between exam-based accelerators and dual enrollees. Given that both exam-based accelerators and dual enrollees are more college ready than non-accelerators and the lack of differences in college readiness between exam-based accelerators and dual enrollees, these findings suggest that both accelerated programs are effective strategies to raising college readiness. However, these mean differences of college readiness by accelerated programs do not account for baseline differences among these student groups. Therefore, we use regression-based models to account for student and institutional characteristics that may influence both participation in accelerated programs and college readiness.
Table 3Results From Fixed-Effects Models Of Accelerated Programs On College Readiness
Cognitive Content Learning TransitionCollege Readiness Measure Strategies Knowledge Skills & Tech. Know. & Skills
Exam-based acceleration 0.04 † 0.03 * 0.06 *** 0.05 *(0.02) (0.02) (0.02) (0.02)
Dual enrollment 0.08 * 0.08 *** 0.07 *** 0.03(0.03) (0.02) (0.02) (0.02)
Underrepresented minority 0.06 † 0.04 * 0.02 0.10 ***(0.03) (0.02) (0.02) (0.03)
Female 0.09 *** 0.14 *** 0.09 *** 0.10 ***(0.02) (0.01) (0.02) (0.02)
Parent education (Some college) 0.04 -0.02 0.00 0.03(0.04) (0.02) (0.03) (0.03)
Parent education (B.A.) 0.01 -0.02 0.01 0.04(0.03) (0.02) (0.03) (0.03)
Parent education (Post-B.A.) 0.004 -0.005 0.02 0.03(0.03) (0.02) (0.03) (0.03)
Disability 0.002 0.01 0.003 0.03(0.04) (0.03) (0.03) (0.03)

Are Dual Enrollment Students College Ready? 15
Table 3 (Cont’d.)Results From Fixed-Effects Models Of Accelerated Programs On College Readiness
Cognitive Content Learning TransitionCollege Readiness Measure Strategies Knowledge Skills & Tech. Know. & Skills
Non-English native language 0.02 0.02 0.06 * 0.10 ***(0.04) (0.02) (0.03) (0.03)
Siblings -0.001 0.002 -0.01 0.01(0.01) (0.01) (0.01) (0.01)
ACT scores 0.005 0.004 † -0.01 ** -0.002(0.003) (0.002) (0.002) (0.003)
Constant -0.22 ** -0.21 *** 0.06 -0.12 †(0.08) (0.06) (0.06) (0.07)
Notes: WNSLAE 2008. Sample size is 4,213 respondents. Standard error in parenthesis. † p < .10. * p < .05. ** p < .01. *** p < .001 (two-tailed).Cognitive Strategies = Key Cognitive StrategiesContent Knowledge = Key Content KnowledgeLearning Skills & Tech. = Key Learning Skills and TechniquesTransition Know. & Skills = Key Transition Knowledge and Skills
Table 3 shows results from the fixed effects models. The first observation from these data is the relationship between students’ socio-demographic characteristics and college readiness. All things being equal, female students exhibit higher levels of college readiness than male students. For all four measures, female students are 0.09–0.14 standard deviations higher than male students in college readiness. The relationship between underrepresented minority students and college readiness is similar to white and Asian students for some college readiness measures (e.g., key cognitive strategies, and key learning skills and techniques) but higher for other college readiness measures (e.g., key content knowledge, and key transition knowledge and skills). We find some evidence that a student’s native language is associated with college readiness. In particular, students whose native language is not English exhibit higher levels of key learning skills (β = 0.06), and key transition knowledge and skills (β = 0.10) than English native speakers. Key cognitive strategies and key content knowledge do not differ by whether English is the student’s native language. We find little difference in college readiness by students’ parental education, disability status, and their number of siblings. Moreover, ACT scores are marginally associated with Conley’s (2012) college readiness measures. If anything, we find a negative relationship between ACT scores, and key learning skills and techniques where a one-point increase in ACT scores reduces key learning skills and techniques by 0.01 standard deviations. Although the negative relationship between ACT scores, and key learning skills and techniques is modest, the overall lack of a strong positive influence of ACT scores on college readiness is somewhat surprising.
In regards to dual enrollment, we report three main findings. First, students who participated in dual enrollment are more likely to be college ready on three of Conley’s (2012) four dimensions than those who did not earn college credit in high school. Controlling for other factors, dual

Education Policy Analysis Archives Vol. 23 No. 58 16
enrollees are 0.07–0.08 standard deviations higher in their college readiness than non-accelerators. The exception is in the relationship between dual enrollment, and key transition knowledge and skills dimension where dual enrollees have similar levels of key transition knowledge and skills as non-accelerators.
Second, the influence of accelerated programs on college readiness does not differ statistically between dual enrollees and exam-based accelerators. For example, even though dual enrollees display higher levels of key cognitive strategies than exam-based accelerators (0.08 and 0.04, respectively) the difference is not statistically significant. The possible exception is in key content knowledge where the difference in estimated coefficients between exam-based accelerators and dual enrollees is marginally significant (p < 0.10).
Third, the effect sizes of accelerated programs on college readiness are modest in size. The largest effect of dual enrollment is a 0.08 standard deviation increase on both key cognitive strategies and key content knowledge. These effect sizes are smaller than previous studies that considered the relationship between dual enrollment and academic performance (An, 2013b). We suspect two reasons for these smaller effect sizes. First, the distribution of institutions in the WNSLAE sample is more selective than the distribution of institutions in the United States. In 2008, the average ACT composite score for the nation was 21.1 (ACT, 2012b). The average ACT composite score in the WNSLAE sample is 20% higher at 25.3. Therefore, a sample with more diverse institutions would likely yield larger effects. Second, recall that our comparison group comprises of students who participated in a traditional—that is, non-accelerated—curriculum in high school, but it also comprises of students who participated in an accelerated program but did not earn college credit. A notable portion of AP students may not receive college credit (Dougherty et al., 2006); however, AP students tend to have characteristics about them that are favorable for college success (An, 2009). Prior research shows that the relationship between dual enrollment participation and college success is lower when researchers include AP students in the comparison group than not (An, 2013a).
We find students who participated in dual enrollment are more likely to display characteristics associated with college readiness on three of Conley’s (2012) four college readiness dimensions at the end of their first year of college relative to students who did earn college credit prior to college entry. Although the effect is modest, they are statistically significant; we suspect part of the modest effect is explained by the inclusion of AP students in the comparison group.
Discussion and Implications
This study sheds light on whether dual enrollment is related to college readiness, particularly noncognitive measures that include skills students need to succeed once they matriculate to college. We used the WNSLAE data to examine whether dual enrollees display higher levels of college readiness than non-accelerators. This study provides three primary contributions to the literature. First, prior research on the relationship between dual enrollment and college readiness typically conceptualized college readiness, or the lack thereof, as participation or placement in remedial courses (An, 2013b; Kim & Bragg, 2008). Studies that considered noncognitive dimensions of college readiness typically focused on the immediate gains in readiness for students while still in high school (Burns & Lewis, 2000; Huntley & Schuh, 2002–2003; Karp, 2012; Medvide & Blustein, 2010). Although important, these studies assume students would continue to show signs of college readiness as they navigate through college. Instead, we modeled whether dual-enrolled students express their college readiness at the end of their first year of college. Second, prior research has predominantly examined the cognitive dimensions of college readiness, but our study extended this work to examine both cognitive and noncognitive dimensions of college readiness using Conley’s
Are Dual Enrollment Students College Ready? 17
(2007, 2012) model. Finally, this study contributes to the literature considering different types of accelerators, including dual enrollees and exam-based accelerators.
Dual Enrollment and College Readiness
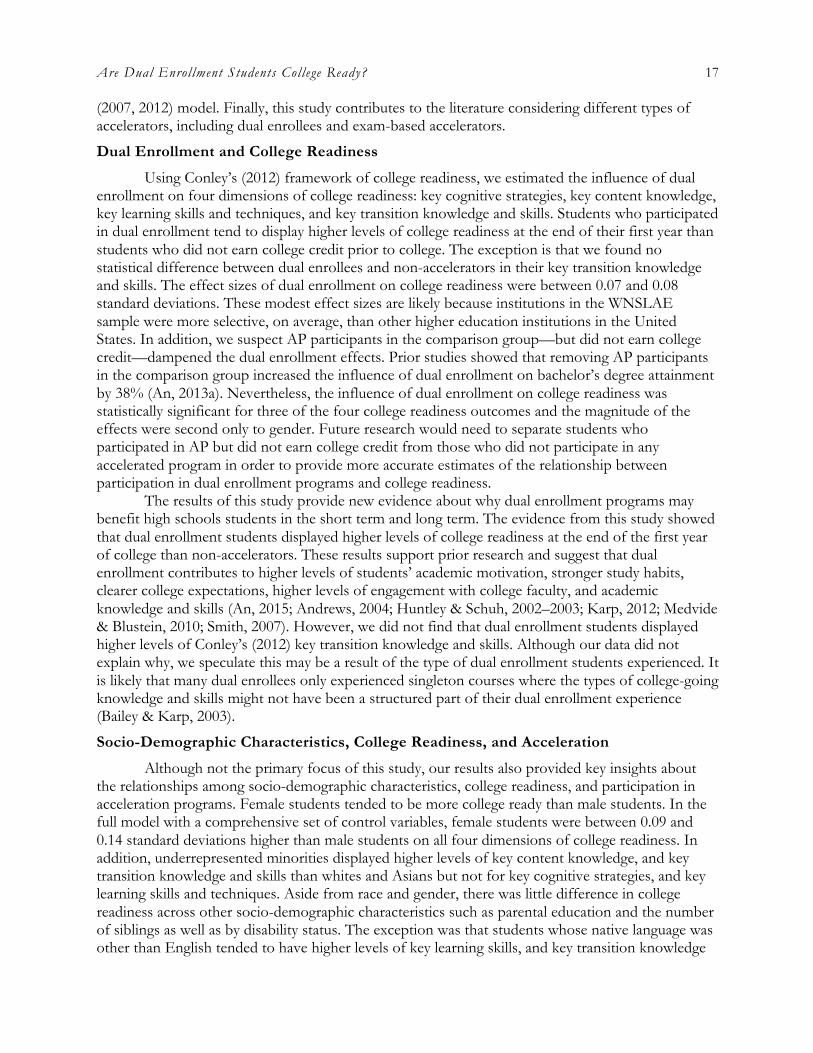
Using Conley’s (2012) framework of college readiness, we estimated the influence of dual enrollment on four dimensions of college readiness: key cognitive strategies, key content knowledge, key learning skills and techniques, and key transition knowledge and skills. Students who participated in dual enrollment tend to display higher levels of college readiness at the end of their first year than students who did not earn college credit prior to college. The exception is that we found no statistical difference between dual enrollees and non-accelerators in their key transition knowledge and skills. The effect sizes of dual enrollment on college readiness were between 0.07 and 0.08 standard deviations. These modest effect sizes are likely because institutions in the WNSLAE sample were more selective, on average, than other higher education institutions in the United States. In addition, we suspect AP participants in the comparison group—but did not earn college credit—dampened the dual enrollment effects. Prior studies showed that removing AP participants in the comparison group increased the influence of dual enrollment on bachelor’s degree attainment by 38% (An, 2013a). Nevertheless, the influence of dual enrollment on college readiness was statistically significant for three of the four college readiness outcomes and the magnitude of the effects were second only to gender. Future research would need to separate students who participated in AP but did not earn college credit from those who did not participate in any accelerated program in order to provide more accurate estimates of the relationship between participation in dual enrollment programs and college readiness.
The results of this study provide new evidence about why dual enrollment programs may benefit high schools students in the short term and long term. The evidence from this study showed that dual enrollment students displayed higher levels of college readiness at the end of the first year of college than non-accelerators. These results support prior research and suggest that dual enrollment contributes to higher levels of students’ academic motivation, stronger study habits, clearer college expectations, higher levels of engagement with college faculty, and academic knowledge and skills (An, 2015; Andrews, 2004; Huntley & Schuh, 2002–2003; Karp, 2012; Medvide & Blustein, 2010; Smith, 2007). However, we did not find that dual enrollment students displayed higher levels of Conley’s (2012) key transition knowledge and skills. Although our data did not explain why, we speculate this may be a result of the type of dual enrollment students experienced. It is likely that many dual enrollees only experienced singleton courses where the types of college-going knowledge and skills might not have been a structured part of their dual enrollment experience (Bailey & Karp, 2003).
Socio-Demographic Characteristics, College Readiness, and Acceleration
Although not the primary focus of this study, our results also provided key insights about the relationships among socio-demographic characteristics, college readiness, and participation in acceleration programs. Female students tended to be more college ready than male students. In the full model with a comprehensive set of control variables, female students were between 0.09 and 0.14 standard deviations higher than male students on all four dimensions of college readiness. In addition, underrepresented minorities displayed higher levels of key content knowledge, and key transition knowledge and skills than whites and Asians but not for key cognitive strategies, and key learning skills and techniques. Aside from race and gender, there was little difference in college readiness across other socio-demographic characteristics such as parental education and the number of siblings as well as by disability status. The exception was that students whose native language was other than English tended to have higher levels of key learning skills, and key transition knowledge
Education Policy Analysis Archives Vol. 23 No. 58 18
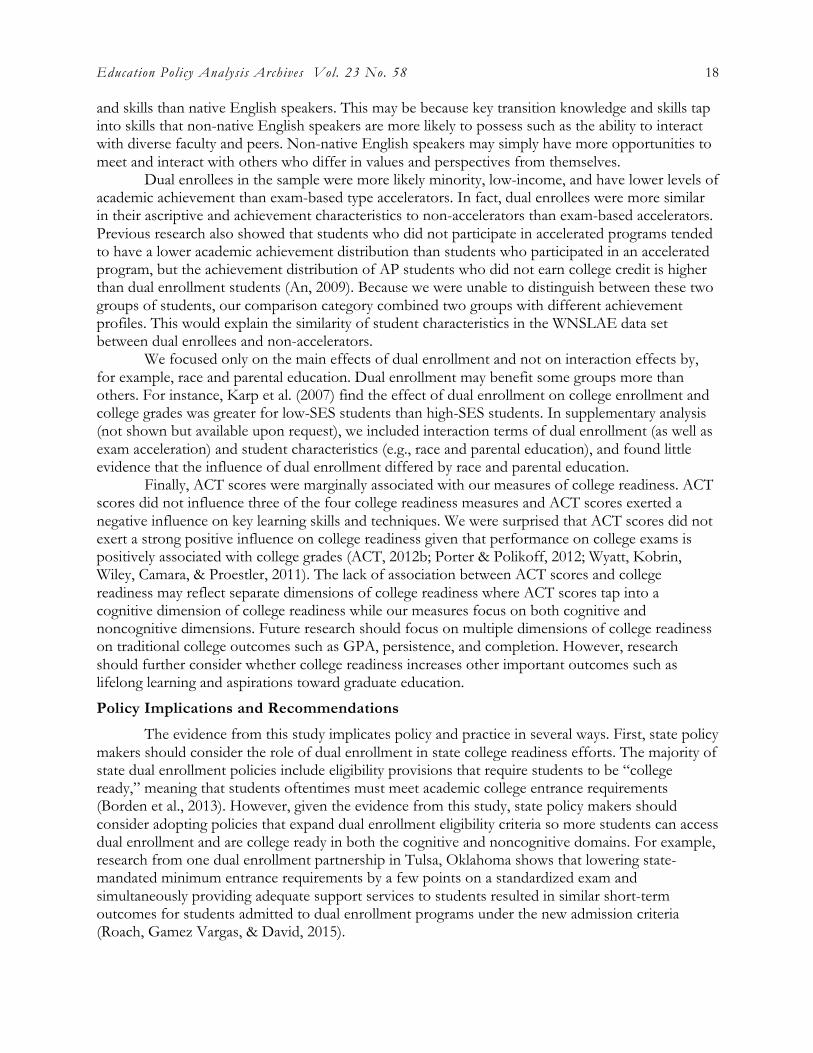
and skills than native English speakers. This may be because key transition knowledge and skills tap into skills that non-native English speakers are more likely to possess such as the ability to interact with diverse faculty and peers. Non-native English speakers may simply have more opportunities to meet and interact with others who differ in values and perspectives from themselves.
Dual enrollees in the sample were more likely minority, low-income, and have lower levels of academic achievement than exam-based type accelerators. In fact, dual enrollees were more similar in their ascriptive and achievement characteristics to non-accelerators than exam-based accelerators. Previous research also showed that students who did not participate in accelerated programs tended to have a lower academic achievement distribution than students who participated in an accelerated program, but the achievement distribution of AP students who did not earn college credit is higher than dual enrollment students (An, 2009). Because we were unable to distinguish between these two groups of students, our comparison category combined two groups with different achievement profiles. This would explain the similarity of student characteristics in the WNSLAE data set between dual enrollees and non-accelerators.
We focused only on the main effects of dual enrollment and not on interaction effects by, for example, race and parental education. Dual enrollment may benefit some groups more than others. For instance, Karp et al. (2007) find the effect of dual enrollment on college enrollment and college grades was greater for low-SES students than high-SES students. In supplementary analysis (not shown but available upon request), we included interaction terms of dual enrollment (as well as exam acceleration) and student characteristics (e.g., race and parental education), and found little evidence that the influence of dual enrollment differed by race and parental education.
Finally, ACT scores were marginally associated with our measures of college readiness. ACT scores did not influence three of the four college readiness measures and ACT scores exerted a negative influence on key learning skills and techniques. We were surprised that ACT scores did not exert a strong positive influence on college readiness given that performance on college exams is positively associated with college grades (ACT, 2012b; Porter & Polikoff, 2012; Wyatt, Kobrin, Wiley, Camara, & Proestler, 2011). The lack of association between ACT scores and college readiness may reflect separate dimensions of college readiness where ACT scores tap into a cognitive dimension of college readiness while our measures focus on both cognitive and noncognitive dimensions. Future research should focus on multiple dimensions of college readiness on traditional college outcomes such as GPA, persistence, and completion. However, research should further consider whether college readiness increases other important outcomes such as lifelong learning and aspirations toward graduate education.
Policy Implications and Recommendations
The evidence from this study implicates policy and practice in several ways. First, state policy makers should consider the role of dual enrollment in state college readiness efforts. The majority of state dual enrollment policies include eligibility provisions that require students to be “college ready,” meaning that students oftentimes must meet academic college entrance requirements (Borden et al., 2013). However, given the evidence from this study, state policy makers should consider adopting policies that expand dual enrollment eligibility criteria so more students can access dual enrollment and are college ready in both the cognitive and noncognitive domains. For example, research from one dual enrollment partnership in Tulsa, Oklahoma shows that lowering state-mandated minimum entrance requirements by a few points on a standardized exam and simultaneously providing adequate support services to students resulted in similar short-term outcomes for students admitted to dual enrollment programs under the new admission criteria (Roach, Gamez Vargas, & David, 2015).

Are Dual Enrollment Students College Ready? 19
Second, this study shows that dual enrollment influences college readiness at the end of the first year of college. Dual enrollment is arguably in the best interest of both high schools and colleges, because it is likely to improve high schools’ post-graduation outcomes and colleges’ retention and graduation outcomes. High school districts with goals in college readiness and colleges with goals in retention should consider investing in the development and adoption of strong dual enrollment partnerships that benefit both educational sectors.
A third implication relates to the lack of significance between dual enrollment and Conley’s (2012) dimension of key transition knowledge and skills. Research on dual enrollment policies and programs suggest the design of dual enrollment programs and courses vary across states andinstitutions (Bailey & Karp, 2003; Taylor & Pretlow, 2015), and policy makers should carefully consider how different designs might result in differential influences on the college readiness of dual enrollees. Most state dual enrollment policies do not require support services and structures that might improve students’ key transition knowledge and skills (Borden et al., 2013). Therefore, policy makers and educators should consider designing dual enrollment programs that integrate topics related to transition knowledge and skills.
References
ACT. (2012a). The condition of college & career readiness 2012. Retrieved from http://www.act.org/research-policy/college-career-readiness-report-2012/
ACT. (2012b). National score trends. Retrieved from http://www.act.org/newsroom/data/2012/trends.html
Adelman, C. (1999). Answers in the tool box: Academic intensity, attendance patterns, and bachelor’s degree attainment. Washington, DC: U.S. Department of Education.
Adelman, C. (2006). The toolbox revisited: Paths to degree completion from high school through college. Washington, DC: U.S. Department of Education.
Allen, D. (2010). A comprehensive literature review & bibliography. New York: CUNY Collaborative Programs.
Allen, D., & Dadgar, M. (2012). Does dual enrollment increase students’ success in college? Evidence from a quasi-experimental analysis of dual enrollment in New York City. New Directions for Higher Education, 2012, 11–19. http://dx.doi.org/10.1002/he.20010
Allison, P. D. (2009). Fixed effects regression models. Thousand Oaks, CA: Sage Publications.An, B. P. (2009). The impact of dual enrollment on college performance and attainment. Doctor of Philosophy,
University of Wisconsin, Madison. An, B. P. (2013a). The impact of dual enrollment on college degree attainment: Do low-SES
students benefit? Educational Evaluation and Policy Analysis, 35, 57–75. http://dx.doi.org/10.3102/0162373712461933
An, B. P. (2013b). The influence of dual enrollment on academic performance and college readiness: Differences by socioeconomic status. Research in Higher Education, 54, 407–432. http://dx.doi.org/10.1007/s11162-012-9278-z
An, B. P. (2015). The role of academic motivation and engagement on the relationship between dual enrollment and academic performance. Journal of Higher Education, 86, 98–126. http://dx.doi.org/10.1353/jhe.2015.0005
Andrews, H. A. (2004). Dual credit research outcomes for students. Community College Journal of Research and Practice, 28, 415–422. http://dx.doi.org/10.1080/1066892049044445

Education Policy Analysis Archives Vol. 23 No. 58 20
Bailey, T. R., Hughes, K. L., & Karp, M. M. (2002). What role can dual enrollment programs play in easing the transition between high school and postsecondary education? Journal for Vocational Special Needs Education, 24, 18–29.
Bailey, T. R., & Karp, M. M. (2003). Promoting college access and success: A review of credit-based transition programs. Washington, DC: Office of Vocational and Adult Education.
Blackboard Institute. (2010). Dual enrollment: A strategy for educational advancement of all students. Washington, DC: Author.
Borden, V. M. H., Taylor, J. L., Park, E., & Seiler, D. J. (2013). Dual credit in U.S. higher education: A study of state policy and quality assurance practices. Retrieved from Higher Learning Commission Website: https://content.springcm.com/content/DownloadDocuments.ashx?aid=5968&Selection=Document%2Ce3823bc3-3c88-e211-ad6c-0025b3af184e%3B
Boswell, K. (2001). State policy and postsecondary enrollment options: Creating seamless systems. New Directions for Community Colleges, 113, 7–14. http://dx.doi.org/10.1002/cc.3
Burns, H., & Lewis, B. (2000). Dual-enrolled students’ perceptions of the effect of classroom environment on educational experience. Qualitative Report, 4.
Center of Inquiry at Wabash College. (2011). Wabash National Study 2006–2009. Retrieved from http://www.liberalarts.wabash.edu/
Clinedinst, M. E., & Hawkins, D. A. (2010). 2010 State of college admission. Retrieved from National Association for College Admission Counseling Website: http://www.nacacnet.org/research/PublicationsResources/Marketplace/Documents/SoCA2010.pdf
College Board. (2014). The 10th annual report to the nation. Retrieved from http://apreport.collegeboard.org/
Complete College America. (2012). Remediation: Higher education’s bridge to nowhere. Retrieved from http://www.completecollege.org/docs/CCA-Remediation-final.pdf
Conklin, K. D., & Sanford, S. (2007). A college-ready nation: An idea whose time has come. In N. Hoffman, J. Vargas, A. Venezia & M. S. Miller (Eds.), Minding the gap: Why integrating high school with college makes sense and how to do it (pp. 65–72). Cambridge, MA: Harvard Education Press.
Conley, D. T. (2007). Toward a more comprehensive conception of college readiness. Eugene, OR: Educational Policy Improvement Center.
Conley, D. T. (2010). College and career ready: Helping all students succeed beyond high school. San Francisco: Jossey-Bass. http://dx.doi.org/10.1002/9781118269411
Conley, D. T. (2012). A complete definition of college and career readiness. Eugene, OR: Educational Policy Improvement Center.
Dougherty, C., Mellor, L., & Jian, S. (2006). The relationship between advanced placement and college graduation. University of Texas at Austin.
Education Commission of the States. (2001). Postsecondary options: Dual/concurrent enrollment. Retrieved from http://www.ecs.org/clearinghouse/28/11/2811.pdf
Hoffman, N., Vargas, J., & Santos, J. (2008). On ramp to college: A state policymaker’s guide to dual enrollment. Retrieved from Jobs for the Future Website: http://www.jff.org/sites/default/files/OnRamp.pdf
Huntley, H. J., & Schuh, J. H. (2002–2003). Post-secondary enrollment: A new frontier in recruitment and retention. Journal of College Student Retention, 4, 83–94. http://dx.doi.org/10.2190/4XQF-P3CB-LQM8-BQQL
Are Dual Enrollment Students College Ready? 21
Karp, M. M. (2012). “I don’t know, I’ve never been to college!” Dual enrollment as a college readiness strategy. New Directions for Higher Education, 2012, 21–28. http://dx.doi.org/10.1002/he.20011
Karp, M. M., Bailey, T. R., Hughes, K. L., & Fermin, B. J. (2005). Update to state dual enrollment policies: Addressing access and quality report. Washington, DC: Office of Vocational and Adult Education.
Karp, M. M., Calcagno, J. C., Hughes, K. L., Jeong, D. W., & Bailey, T. R. (2007). The postsecondary achievement of participants in dual enrollment: An analysis of student outcomes in two states. St. Paul: University of Minnesota.
Kim, J., & Bragg, D. D. (2008). The impact of dual and articulated credit on college readiness and retention in four community colleges. Career and Technical Education Research, 33, 133–158. http://dx.doi.org/10.5328/CTER33.2.133
Klopfenstein, K. (2010). Does the Advanced Placement program save taxpayers money? The effect of AP participation on time to college graduation. In P. M. Sadler, G. Sonnert, R. H. Tai & K. Klopfenstein (Eds.), AP: A critical examination of the Advanced Placement program (pp. 189–218). Cambridge, MA: Harvard Education Press.
Lombardi, A. R., Conley, D. T., Seburn, M. A., & Downs, A. M. (2013). College and career readiness assessment: Validation of the key cognitive strategies framework. Assessment for Effective Intervention, 38, 163–171. http://dx.doi.org/10.1177/1534508412448668
Lombardi, A. R., Seburn, M. A., & Conley, D. T. (2011). Development and initial validation of a measure of academic behaviors associated with college and career readiness. Journal of Career Assessment, 19, 375–391. http://dx.doi.org/10.1177/1069072711409345
Maruyama, G. (2012). Assessing college readiness: Should we be satisfied with ACT or other threshold scores? Educational Researcher, 41, 252–261. http://dx.doi.org/10.3102/0013189X12455095
Medvide, M. B., & Blustein, D. L. (2010). Exploring the educational and career plans of urban minority students in a dual enrollment program. Journal of Career Development, 37, 541–558. http://dx.doi.org/10.1177/0894845309350920
Parsad, B., & Lewis, L. (2003). Remedial education at degree-granting postsecondary institutions in fall 2000. Washington, DC: National Center for Education Statistics.
Porter, A. C., & Polikoff, M. S. (2012). Measuring academic readiness for college. Educational Policy, 26, 394–417. http://dx.doi.org/10.1177/0895904811400410
Roach, R., Gamez Vargas, J., & David, K. M. (2015). Eliminating barriers to dual enrollment in Oklahoma. New Directions for Community Colleges, 2015, 31–38. http://dx.doi.org/10.1002/cc.20130
Sedlacek, W. E. (2004). Beyond the big test: Noncognitive assessment in higher education. San Francisco: Jossey-Bass.
Smith, D. (2007). Why expand dual-credit programs? Community College Journal of Research and Practice, 31, 371–387. http://dx.doi.org/10.1080/10668920600932884
Taylor, J. L. (In press). The equitable effects of community college dual credit: Evidence from Illinois. Community College Review.
Taylor, J. L., & Pretlow, J. (2015). Editors’ notes. New Directions for Community Colleges, 2015, 1–7. http://dx.doi.org/10.1002/cc.20127
Texas P-16 Council. (2007). Study on dual credit programs in Texas: A report to the 80th Legislature from the Texas P-16 Council.
Thomas, N., Marken, S., Gray, L., & Lewis, L. (2013). Dual credit and exam-based courses in U.S. public high schools: 2010–11. Washington, DC: National Center for Education Statistics.
Education Policy Analysis Archives Vol. 23 No. 58 22
U.S. Department of Education. (2010). A blueprint for reform: The reauthorization of the Elementary and Secondary Education Act. Retrieved from http://www2.ed.gov/policy/elsec/leg/blueprint/blueprint.pdf
Venezia, A., & Voloch, D. (2012). Using college placement exams as early signals of college readiness: An examination of California’s Early Assessment Program and New York’s At Home in College program. New Directions for Higher Education, 2012, 71–79. http://dx.doi.org/10.1002/he.20016
von Hippel, P. T. (2007). Regression with missing Ys: An improved strategy for analyzing multiply imputed data. Sociological Methodology, 37, 83–117. http://dx.doi.org/10.1111/j.1467-9531.2007.00180.x
Waits, T., Setzer, J. C., & Lewis, L. (2005). Dual credit and exam-based courses in U.S. public high schools: 2002–03. Washington, DC: National Center for Education Statistics.
Wyatt, J. N., Kobrin, J. L., Wiley, A., Camara, W. J., & Proestler, N. (2011). SAT benchmarks: Development of a college readiness benchmark and its relationship to secondary and postsecondary school performance. Retrieved from College Board Website: http://research.collegeboard.org/publications/content/2012/05/sat-benchmarks-development-college-readiness-benchmark-and-its
Are Dual Enrollment Students College Ready? 23
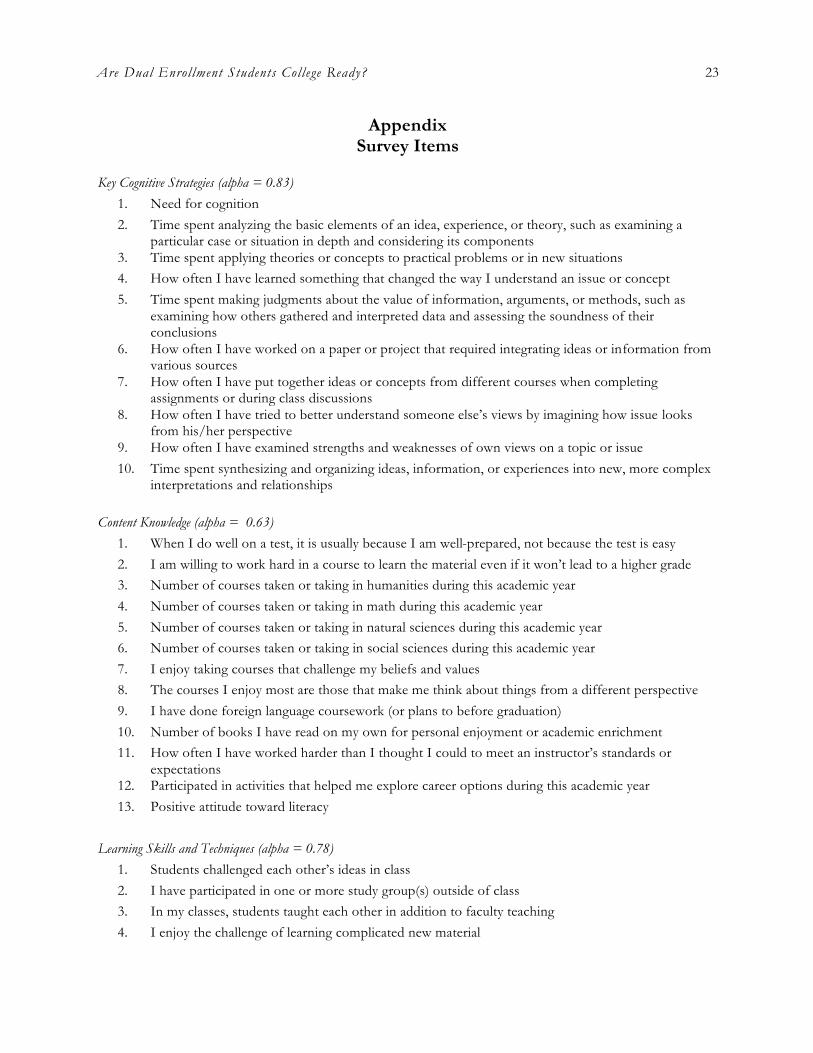
AppendixSurvey Items
Key Cognitive Strategies (alpha = 0.83)
1. Need for cognition2. Time spent analyzing the basic elements of an idea, experience, or theory, such as examining a
particular case or situation in depth and considering its components3. Time spent applying theories or concepts to practical problems or in new situations4. How often I have learned something that changed the way I understand an issue or concept5. Time spent making judgments about the value of information, arguments, or methods, such as
examining how others gathered and interpreted data and assessing the soundness of their conclusions
6. How often I have worked on a paper or project that required integrating ideas or information from various sources
7. How often I have put together ideas or concepts from different courses when completing assignments or during class discussions
8. How often I have tried to better understand someone else’s views by imagining how issue looks from his/her perspective
9. How often I have examined strengths and weaknesses of own views on a topic or issue10. Time spent synthesizing and organizing ideas, information, or experiences into new, more complex
interpretations and relationships
Content Knowledge (alpha = 0.63)
1. When I do well on a test, it is usually because I am well-prepared, not because the test is easy2. I am willing to work hard in a course to learn the material even if it won’t lead to a higher grade3. Number of courses taken or taking in humanities during this academic year4. Number of courses taken or taking in math during this academic year5. Number of courses taken or taking in natural sciences during this academic year6. Number of courses taken or taking in social sciences during this academic year7. I enjoy taking courses that challenge my beliefs and values8. The courses I enjoy most are those that make me think about things from a different perspective9. I have done foreign language coursework (or plans to before graduation)10. Number of books I have read on my own for personal enjoyment or academic enrichment11. How often I have worked harder than I thought I could to meet an instructor’s standards or
expectations12. Participated in activities that helped me explore career options during this academic year13. Positive attitude toward literacy
Learning Skills and Techniques (alpha = 0.78)
1. Students challenged each other’s ideas in class2. I have participated in one or more study group(s) outside of class3. In my classes, students taught each other in addition to faculty teaching4. I enjoy the challenge of learning complicated new material
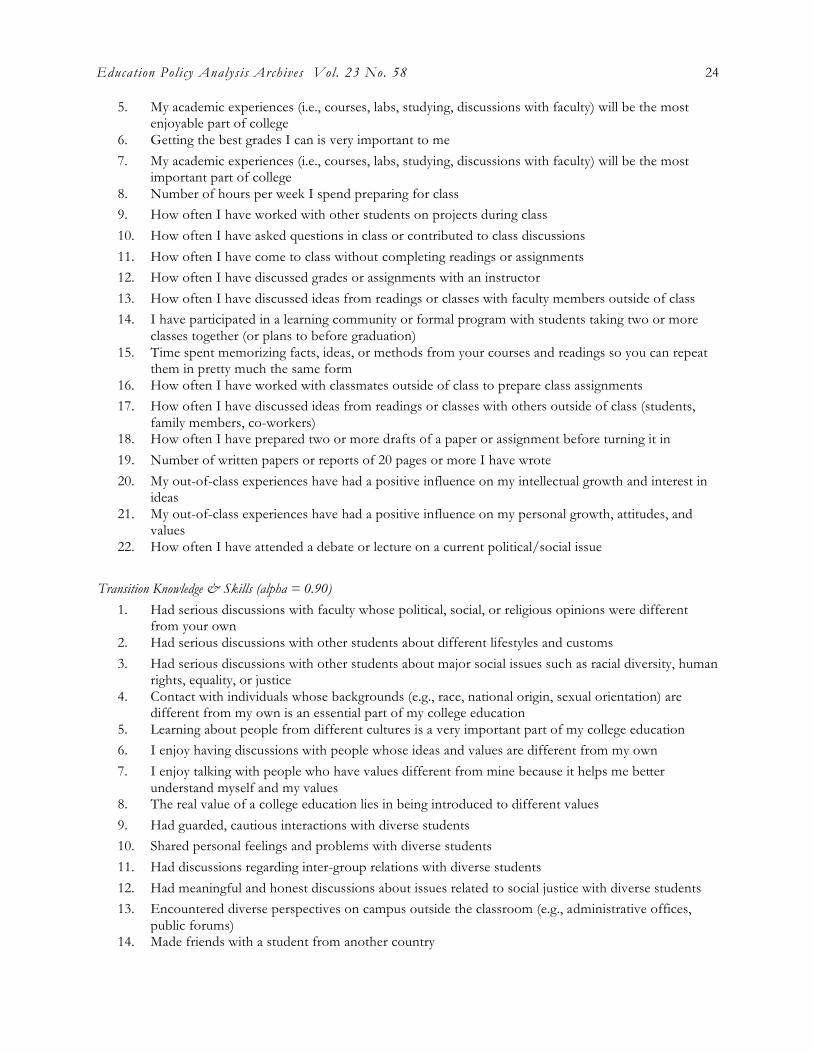
Education Policy Analysis Archives Vol. 23 No. 58 24
5. My academic experiences (i.e., courses, labs, studying, discussions with faculty) will be the most enjoyable part of college
6. Getting the best grades I can is very important to me7. My academic experiences (i.e., courses, labs, studying, discussions with faculty) will be the most
important part of college 8. Number of hours per week I spend preparing for class9. How often I have worked with other students on projects during class10. How often I have asked questions in class or contributed to class discussions11. How often I have come to class without completing readings or assignments12. How often I have discussed grades or assignments with an instructor13. How often I have discussed ideas from readings or classes with faculty members outside of class14. I have participated in a learning community or formal program with students taking two or more
classes together (or plans to before graduation)15. Time spent memorizing facts, ideas, or methods from your courses and readings so you can repeat
them in pretty much the same form16. How often I have worked with classmates outside of class to prepare class assignments17. How often I have discussed ideas from readings or classes with others outside of class (students,
family members, co-workers)18. How often I have prepared two or more drafts of a paper or assignment before turning it in19. Number of written papers or reports of 20 pages or more I have wrote20. My out-of-class experiences have had a positive influence on my intellectual growth and interest in
ideas21. My out-of-class experiences have had a positive influence on my personal growth, attitudes, and
values22. How often I have attended a debate or lecture on a current political/social issue
Transition Knowledge & Skills (alpha = 0.90)
1. Had serious discussions with faculty whose political, social, or religious opinions were different from your own
2. Had serious discussions with other students about different lifestyles and customs3. Had serious discussions with other students about major social issues such as racial diversity, human
rights, equality, or justice4. Contact with individuals whose backgrounds (e.g., race, national origin, sexual orientation) are
different from my own is an essential part of my college education5. Learning about people from different cultures is a very important part of my college education6. I enjoy having discussions with people whose ideas and values are different from my own7. I enjoy talking with people who have values different from mine because it helps me better
understand myself and my values8. The real value of a college education lies in being introduced to different values9. Had guarded, cautious interactions with diverse students10. Shared personal feelings and problems with diverse students11. Had discussions regarding inter-group relations with diverse students12. Had meaningful and honest discussions about issues related to social justice with diverse students13. Encountered diverse perspectives on campus outside the classroom (e.g., administrative offices,
public forums)14. Made friends with a student from another country
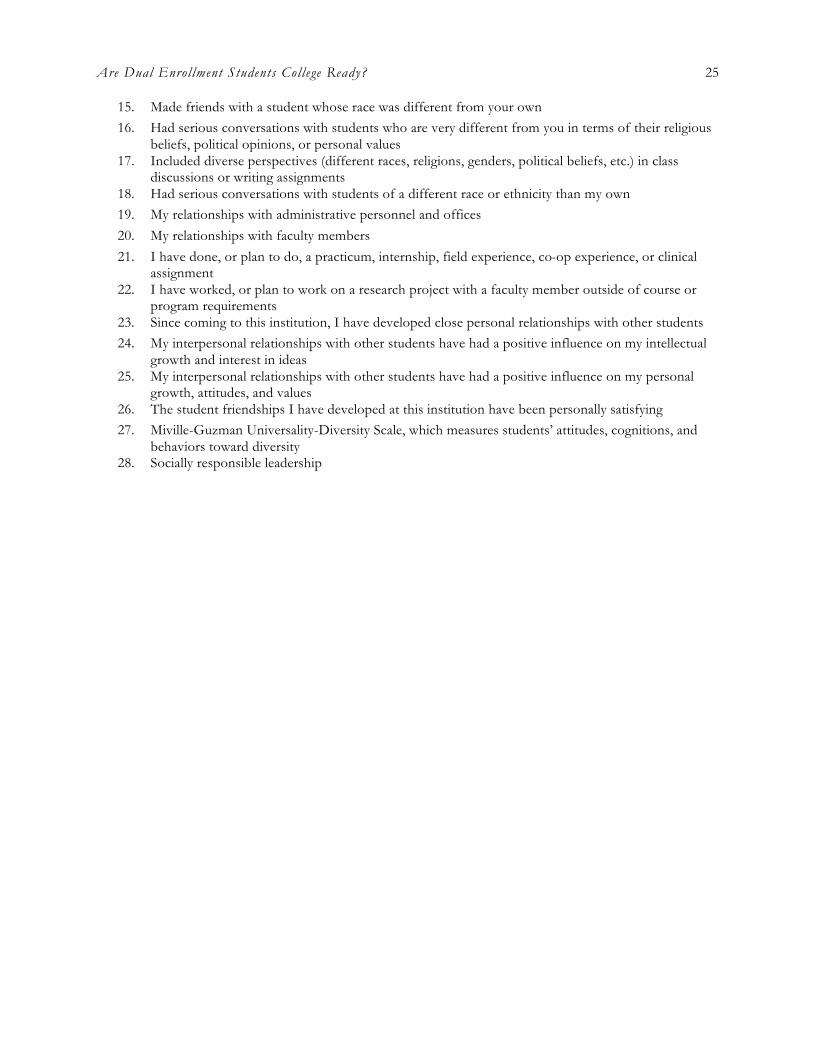
Are Dual Enrollment Students College Ready? 25
15. Made friends with a student whose race was different from your own16. Had serious conversations with students who are very different from you in terms of their religious
beliefs, political opinions, or personal values17. Included diverse perspectives (different races, religions, genders, political beliefs, etc.) in class
discussions or writing assignments18. Had serious conversations with students of a different race or ethnicity than my own19. My relationships with administrative personnel and offices20. My relationships with faculty members21. I have done, or plan to do, a practicum, internship, field experience, co-op experience, or clinical
assignment22. I have worked, or plan to work on a research project with a faculty member outside of course or
program requirements23. Since coming to this institution, I have developed close personal relationships with other students24. My interpersonal relationships with other students have had a positive influence on my intellectual
growth and interest in ideas25. My interpersonal relationships with other students have had a positive influence on my personal
growth, attitudes, and values26. The student friendships I have developed at this institution have been personally satisfying27. Miville-Guzman Universality-Diversity Scale, which measures students’ attitudes, cognitions, and
behaviors toward diversity28. Socially responsible leadership

Education Policy Analysis Archives Vol. 23 No. 58 26
About the Authors
Brian P. AnUniversity of [email protected] P. An is Assistant Professor of Educational Policy and Leadership Studies at the University of Iowa. His research focuses on the transition from high school to college and college persistence.
Jason L. TaylorUniversity of [email protected] L. Taylor is Assistant Professor of Higher Education in the Department of Educational Leadership and Policy at the University of Utah. Broadly speaking, his research examines the intersection between higher education policies and educational and social inequities.
Acknowledgements
An earlier version of this paper was presented at the 2013 Annual Meeting of the American Educational Research Association. The research reported here was supported by a grant from the Center of Inquiry in the Liberal Arts at Wabash College to the Center for Research on Undergraduate Education at the University of Iowa. The opinions expressed are those of the authors and do not represent views of the Center of Inquiry in the Liberal Arts or the Center for Research on Undergraduate Education. We are grateful to Victor Borden, the editor, and anonymous reviewers for helpful comments on earlier drafts.
education policy analysis archivesVolume 23 Number 58 June 22nd, 2015 ISSN 1068-2341
Readers are free to copy, display, and distribute this article, as long as the work is attributed to the author(s) and Education Policy Analysis Archives, it is distributed for non-commercial purposes only, and no alteration or transformation is made in the work. More details of this Creative Commons license are available at http://creativecommons.org/licenses/by-nc-sa/3.0/. All other uses must be approved by the author(s) or EPAA. EPAA is published by the Mary Lou Fulton Institute and Graduate School of Education at Arizona State University Articles are indexed in CIRC (Clasificación Integrada de Revistas Científicas, Spain), DIALNET (Spain), Directory of Open Access Journals, EBSCO Education Research Complete, ERIC, Education Full Text (H.W. Wilson), QUALIS A2 (Brazil), SCImago Journal Rank; SCOPUS, SOCOLAR (China).

Are Dual Enrollment Students College Ready? 27
Please contribute commentaries at http://epaa.info/wordpress/ and send errata notes to Gustavo E. Fischman [email protected]
Join EPAA’s Facebook community at https://www.facebook.com/EPAAAAPE and Twitter feed @epaa_aape.