education policy analysis archives - files.eric.ed.gov · education policy analysis archives A...
45
Journal website: http://epaa.asu.edu/ojs/ Manuscript received: 7/1/2016 Facebook: /EPAAA Revisions received: 11/12/2017 Twitter: @epaa_aape Accepted: 1/3/2018 SPECIAL ISSUE Navigating the Contested Terrain of Teacher Education Policy and Practice education policy analysis archives A peer-reviewed, independent, open access, multilingual journal Arizona State University Volume 26 Number 33 March 12, 2017 ISSN 1068-2341 Evaluating the Tennessee Higher Education Commission's Report Card on the Value-Added Estimates of Teacher Preparation Programs Charisse Gulosino University of Memphis United States Citation: Gulosino, C. (2018). Evaluating the Tennessee Higher Education Commission's Report Card on the value-added estimates of teacher preparation programs. Education Policy Analysis Archives, 26(33). http://dx.doi.org/10.14507/epaa.26.2604 This article is part of the Special Issue, Navigating the Contested Terrain of Teacher Education Policy and Practice, guest edited by Elena Aydarova and David Berliner. Abstract: Evaluations of teacher preparation programs (TPPs) based in part on the performance of program completers have emerged as an education reform strategy in several states and have become central features of the Race to the Top (RTTT) grant competition. The objective of this policy review is to examine how the state of Tennessee measured and reported the extent to which teacher preparation programs (TPPs) explain the variation of the test score gains for public school students taught by program graduates. This review breaks down the findings by institution and certification pathway, comparing statistically significant outcomes at the state level produced by teachers from each TPP. An analysis of Tennessee's report card reveals considerable variation in the value-added estimates of beginning teachers, depending on the institution where they were
Transcript of education policy analysis archives - files.eric.ed.gov · education policy analysis archives A...

Journal website: http://epaa.asu.edu/ojs/ Manuscript received: 7/1/2016 Facebook: /EPAAA Revisions received: 11/12/2017 Twitter: @epaa_aape Accepted: 1/3/2018
SPECIAL ISSUE
Navigating the Contested Terrain of Teacher Education Policy and Practice
education policy analysis archives A peer-reviewed, independent, open access, multilingual journal
Arizona State University
Volume 26 Number 33 March 12, 2017 ISSN 1068-2341
Evaluating the Tennessee Higher Education Commission's Report Card on the Value-Added Estimates of Teacher
Preparation Programs
Charisse Gulosino
University of Memphis United States
Citation: Gulosino, C. (2018). Evaluating the Tennessee Higher Education Commission's Report Card on the value-added estimates of teacher preparation programs. Education Policy Analysis Archives, 26(33). http://dx.doi.org/10.14507/epaa.26.2604 This article is part of the Special Issue, Navigating the Contested Terrain of Teacher Education Policy and Practice, guest edited by Elena Aydarova and David Berliner. Abstract: Evaluations of teacher preparation programs (TPPs) based in part on the performance of program completers have emerged as an education reform strategy in several states and have become central features of the Race to the Top (RTTT) grant competition. The objective of this policy review is to examine how the state of Tennessee measured and reported the extent to which teacher preparation programs (TPPs) explain the variation of the test score gains for public school students taught by program graduates. This review breaks down the findings by institution and certification pathway, comparing statistically significant outcomes at the state level produced by teachers from each TPP. An analysis of Tennessee's report card reveals considerable variation in the value-added estimates of beginning teachers, depending on the institution where they were

Education Policy Analysis Archives Vol. 26 No. 33 SPECIAL ISSUE 2
trained. These results, however, should be interpreted with caution. This review offers several technical considerations associated with the interpretation of Tennessee's report card on the effectiveness of TPPs and explains how these considerations may affect the interpretation of the findings. Keywords: Teacher Preparation Program; Teacher Effectiveness; Value-Added Models La evaluación del “Report Card” de la Comisión de Educación Superior de Tennessee sobre las estimaciones de valor agregado de los programas de preparación de profesores Resumen: Las evaluaciones de los programas de preparación de profesores basadas en parte en el desempeño de finales de programas surgieron como una estrategia de reforma educativa en varios estados y se convirtieron en características centrales de la competencia de concesión Race to the Top (RTTT). El objetivo de esta revisión de política es examinar cómo el estado de Tennessee midió y reportó hasta qué punto los programas de preparación de profesores explican la variación de las ganancias de puntuación de prueba para estudiantes de escuelas públicas impartidas por los graduados del programa. Esta revisión rompe los descubrimientos por institución y camino de certificación, comparando resultados estadísticamente significativos a nivel estatal producidos por profesores de cada TPP. Un análisis del informe de Tennessee revela una variación considerable en las estimaciones de valor agregado de los profesores principiantes, dependiendo de la institución donde fueron entrenados. Estos resultados, sin embargo, deben interpretarse con cautela. Esta revisión ofrece varias consideraciones técnicas asociadas a la interpretación del “Report Card” de Tennessee sobre la eficacia de las TPPs y explica cómo estas consideraciones pueden afectar la interpretación de los hallazgos. Palabras clave: Programa de preparación de profesores; Eficacia de los profesores; Modelos de valor agregado A avaliação do “Report Card” da Comissão de Educação Superior do Tennessee sobre as estimativas de valor agregado dos programas de preparação de professores Resumo: As avaliações dos programas de preparação de professores baseadas em parte no desempenho de finais de programas surgiram como uma estratégia de reforma educacional em vários estados e se tornaram características centrais da competição de concessão Race to the Top (RTTT). O objetivo desta revisão de política é examinar como o estado do Tennessee mediu e relatou até que ponto os programas de preparação de professores explicam a variação dos ganhos de pontuação de teste para estudantes de escolas públicas ministradas pelos graduados do programa. Esta revisão quebra as descobertas por instituição e caminho de certificação, comparando resultados estatisticamente significativos ao nível estadual produzidos por professores de cada TPP. Uma análise do relatório do Tennessee revela uma variação considerável nas estimativas de valor agregado dos professores principiantes, dependendo da instituição onde foram treinados. Estes resultados, no entanto, devem ser interpretados com cautela. Esta revisão oferece várias considerações técnicas associadas à interpretação do “Report Card” do Tennessee sobre a eficácia das TPPs e explica como essas considerações podem afetar a interpretação dos achados. Palavras-chave: Programa de preparação de professores; Eficácia dos professores; Modelos de valor agregado

Evaluating the TN Higher Education Commission's Report Card 3
Introduction
For more than two decades, states have moved from practices that prescribe educational inputs to new practices driven by Race to the Top funding that hold schools and districts, teachers and principals accountable for growth in student achievement (Cohen, 2012). A new era of accountability has been ushered in by the Race to the Top (RTTT) grant competition, which requires that these programs be held accountable for producing effective teachers (USDOE, 2011). As a result, increased pressure has been placed on states to invest in longitudinal data systems that are able to link practicing teachers to their preparation programs as well as to the test score gains of the students they teach. Making these linkages is a necessary step to assess how well students of graduates from different teacher preparation programs (TPPs) and other credential pathways are performing in terms of raising student test scores. In states like Tennessee, strong accountability for TPPs has been shared with the public at large in the form of report cards that publish value-added estimates for their TPPs (USDOE, 2014).
In this policy review, I scrutinize how the state of Tennessee measured and reported the extent to which TPPs explain the variation of the test score gains for public school students taught by their program graduates. This review offers several technical considerations associated with the interpretation of Tennessee's report card on TPPs’ value-added estimates and explains how these considerations may affect the interpretation of the findings. An analysis of the report card reveals considerable variation in the value-added estimates of beginning teachers, depending on the institution where they were trained. These results, however, should be interpreted with extreme caution. The crux of this analysis relies on several limitations on the use of value-added models (VAMs) to evaluate teachers and TPPs, an inexact and imperfect social science that is highly error-prone (Amrein-Beardsley, Lawton, & Ronan, 2017).
Race to the Top (RTTT) and Every Student Succeeds Act (ESSA)
The reauthorization of ESEA under President Obama called Every Student Succeeds Act (ESSA) eases off teacher accountability but retains school and TPP accountability. The evaluation of all TPPs (traditional and alternative routes) under ESSA contains mandates that require the states to produce annual report cards rating the quality of TPPs based on the following multiple measures1: “1) placement and retention rates of graduates in their first three years of teaching; 2) feedback from graduates and their employers on the effectiveness of program preparation; 3) student learning outcomes measured by novice teachers' student growth, teacher evaluation results, and/or another state-determined measure that is relevant to students' outcomes; and 4) and other program characteristics” (USDOE, 2016). Consistent with the focus on providing greater discretion and flexibility to states under ESSA, the states are granted flexibility in choice or use of performance measures to determine whether TPPs are effective, at risk, or low-performing (Kumashiro, 2015). The new TPP rating system is set for full implementation for the 2018-19 academic year.2 A key part of the accountability measure is the potential loss of federal TEACH grants (a program designed to prepare teachers to teach a
1 While the continuation of annual standardized testing is written into ESSA, the use of value-added models (VAMs) is not, and their use for teacher evaluations and TPPs is now left to all states to decide. For more details, see Every Student Succeeds Act. (Public Law No: 114-95). (2015). Washington, D.C.: United States Congress. Retrieved from https://www.congress.gov/bill/114th-congress/senate-bill/1177/text 2 In February 2017, the lower chamber of the United States Congress voted to remove all regulations under the ESSA accountability, including teacher prep rules. A similar resolution from the upper chamber is also expected in the near future.

Education Policy Analysis Archives Vol. 26 No. 33 SPECIAL ISSUE 4
high-need field in a low-income area) if TPPs are not deemed effective in at least two of the previous three years. Tennessee is seen as one of the early adopters of this new federal mandate, after the launch of the redesigned 2016 report card for each credentialing program in the state (TSBE, 2016).
The speed and ease of Tennessee's handling of the Race to the Top's application assurances and the accountability regulations on TPPs under ESSA should be attributed to its prior investments in value-added assessment and data reporting systems that are rarely accomplished or matched in other states. Tennessee is the state most strongly identified with value-added assessment, also known as the Tennessee Value Added Assessment System, or “TVAAS” —a system that dates back to 1992 (TCA 49-1-606). TVAAS is now known as the SAS Education Value-Added Assessment System (EVAAS) (Sanders & Wright, 2008; SAS, 2007, 2012). According to Tennessee Code Annotated (TCA) 49-1-606, "data from the Tennessee comprehensive assessment program (TCAP) tests, or their future replacements, will be used to provide an estimate of the statistical distribution of teacher effects on the educational progress of students within school districts for grades three through eight." In 2007, the Legislature enacted a law mandating that the State Board of Education produce an annual assessment on the effectiveness of teacher training programs (TCA 49-5-108). The state law requires that the annual report includes data on the performance of each program’s graduates in the following areas: placement and retention rates, Praxis II results, and teacher effect data based on the Tennessee Value-Added Assessment System (TVAAS) scores (TCA 49-5-108).
In keeping with the annual statutory reporting requirements on TPPs, the Tennessee Higher Education Commission (THEC) authored the Report Card on the Effectiveness of Teacher Preparation Programs (hereinafter the report card) between 2008 and 2010 that associated TPPs with student-achievement. The report cards were descriptive in nature and provided a low stakes appraisal of TPPs. The analysis compared the relative contribution of TPP graduates on value-added measures. In 2010, the Legislature directed THEC to redesign and improve the report card from a descriptive analysis to a high-stakes evaluation of beginning teachers and program accountability of TPPs. THEC was charged the authority and responsibility to compile and publish the 2011 report card to better integrate data from the preparation programs. The report included an analysis of aggregated TVAAS data to determine both teacher effectiveness and overall preparation program effectiveness. Because of such changes to the report card, what used to be a descriptive appraisal has now become an exercise in research and treated as a research report. Although the original intent of the report card is greater accountability for publicly-funded TPPs (see for example, Tennessee’s RTTT application), the state’s report card has so far only been used to allow key stakeholders, including the public, to review and compare the performance of TPPs. The state has not yet incorporated the report card into a formal program-approval system.
In 2016, the State Board of Education unveiled a newly designed report card aimed at providing a user friendly and interactive exploration of the performance results of individual TPPs and the value-added estimates of their graduates, as well encouraging a multi-stakeholder dialogue (i.e., local school districts; college/university and other TPP providers; and aspiring teachers) about continuous program improvement and accountability (TSBOE, 2016b, 2016c). The report's color-coded rating system highlights a TPP’s progress across several domains such as: candidate profile, employment and provider impact (TSBOE, 2016a). The candidate profile domain evaluates a TPP’s ability to recruit a strong, diverse cohort of candidates and prepare them to teach in high-need subject areas. The employment domain evaluates a TPP’s performance in preparing educators to begin and remain teaching in Tennessee public schools.

Evaluating the TN Higher Education Commission's Report Card 5
The provider impact domain reports on the effects of TPP completers in public school classrooms. The newly revised report card removes dense facts such as mean T-values3 based on TVAAS scores and comparisons of teacher effects between beginning teachers from TPPs and more experienced teachers. Despite the inclusion of multiple domains, the underlying premise remains the same: that is, that value-added and achievement data of TPP graduates are central components of TPP accountability.
Although the policy review under study is limited to a critique of the report card released in the 2011-12 academic year, this period reflects the emerging empirically grounded work to link program graduates to their TPPs as well as to the value-added data of the students they teach, as mandated by federal and state policies. It should be noted that THEC produced the report card funded through the state’s share of the Race to the Top award. Many of the same underlying VAM-related issues that are contained in the 2012 report card are still applicable today.
The policy review proceeds in two steps. First, my review highlights concerns about accuracy, consistency/measurement validity and usability issues. Extending this line of analysis, I highlight prior studies that point out serious flaws in relating TPP quality to teacher’s “valued-added”, a reflection of the problematic nature of assumptions guiding value-added measures (VAMs) and their use, particularly in gathering student growth scores and tying them to specific teachers and, in turn, tracing them back to individual TPPs. Additionally, I point out several sources of selection bias that are often not addressed in VAMs that estimate teacher impacts on student achievement and the quality of TPPs. The second step points to some of the considerations that deserve closer attention when evaluating the accuracy, consistency/validity and usability of Tennessee's report card on TPPs. I identify several technical considerations associated with the interpretation of the report card and explain how these considerations may affect the interpretation/translation of study results. In describing the relevant findings in the report card, I present results at a level of detail intended to balance content and readability. The scope of my review focuses on compelling findings; I consider each aspect of the report's unique strengths and weaknesses; and I reconcile findings and join them together through deliberate reasoning.
Use of VAMs in Policy Context
Tennessee is of interest because it is one of two states to receive the first RTTT funds and has led other states in attempting to align state-level teacher effectiveness policies including TPPs. While a total of 12 states have won the federal Race to the Top (RTTT) competition and have committed to using value-added (student achievement growth as measured by standardized test scores) for TPP evaluations, an analysis of a state's evaluation design and instruments of TPP accountability system is less understood (Crowe, 2010). Five years after the original draft of the Race to the Top's Request for Proposal (RFP), there remains a paucity of information of how well every state’s TPP accountability system is analyzed and communicated to the public through TPP annual report cards. Given the prominence of the TPP accountability system, the time may be propitious for subjecting it to major review. This policy review is undertaken to fill this knowledge gap.
By and large, the discussion suggested in this policy review will be useful to state representatives, researchers, policymakers and any stakeholders (i.e., district officials, principals and teachers) who are interested in policy discussions concerning the use of value-added models
3 In the 2012 report card, THEC uses the terms "mean T-value of teacher effect," "T-value of teacher effects," and "teacher T-value effects" interchangeably. For consistency, this study uses the term "mean T-values" to refer to the value-added estimates of graduates from different programs within a single TPP.

Education Policy Analysis Archives Vol. 26 No. 33 SPECIAL ISSUE 6
(VAMs) for high-stakes accountability and as a tool for school improvement. Encouraged and financially incentivized by federal programs, states are becoming even more reliant on statistical models as a key component of their state-based teacher evaluation and teacher preparation programs (TPPs). As policies increasingly hold teachers accountable for their performance, calls for holding the TPPs that prepare them accountable for their performance have also increased. Although our discussion is state-specific, value-added methods are now encouraged nationally and are required for states to be competitive for federal funding (Collins & Amrein-Beardsley, 2014).
The Tennessee Value Added Assessment Models (TVAAS), a layered mixed effects model, pioneered by University of Tennessee’s Professor William Sanders4, has been in use since 1991 when the Education Improvement Act was adopted (Sanders & Horn, 1994, 1998; Sanders, Saxton & Horn, 1997). Since the implementation of TVAAS a large variety of value added statistical models (i.e., the Value–Added Research Center (VARC) model, the RAND Corporation model, the American Institute for Research (AIR) model, and the Student Growth Percentiles (SGP) model) have been developed and applied (Amrein-Beardsley & Collins, 2012). In addition to the development and widespread adoption of these growth models there has been a surge in the research base providing analysis of the benefits, drawbacks, costs, and implications of these new methods (Darling-Hammond et al., 2012; Hewitt, 2015; Pullin, 2013; Sparks, 2011). In general these growth models are very complex and highly technical , and there are concerns that policymakers, administrators, teachers and other stakeholders will struggle to understand the pros and cons of so many different and complex approaches. Even when applying the same techniques to the same data sets, different researchers can sometimes generate different results (Amrein-Beardsley, 2008; Rothstein, 2007; Sanders & Wright, 2008; Schochet & Chiang, 2010). There is less agreement that TVAAS or other growth models can be used to accurately distinguish the effects of a single teacher as well as rank the effectiveness of each TPP in the state (Baker at al., 2010; Corcoran, 2010; Otterman, 2010). While proponents of TVAAS view state policies that call for holding TPPs accountable for their performance as opportunities for new levels of accountability and support, there is little consensus on the issue (Lockwood et al., 2007; McCaffrey et al., 2003).
Although a variety of VAM methods could be used to determine value-added estimates of TPPs, states have so far only used the TVAAS methodology for evaluating the impact of TPPs on student achievement. Louisiana is the only other state with a longstanding tradition of embracing the full TVASS model to evaluate TPPs (Gansle et al., 2010, 2012; Noell et al., 2008, 2009). Now on its seventh year of publication, the state of Tennessee’s release of this report card in November each year has a wide appeal for the governor and state policymakers who have advanced national and state value-added initiatives for several decades as the mantle of education reform. The public consumption of the report card through social media blogs, think tank publications, and news sources (i.e., Chalkbeat, The Commercial Appeal, Nashville Public Radio) also fuels the policy divide between supporters and detractors of value-added models in the state (Miller, 2016a, 2016b; Tatter, 2016a; Zelinski, 2012). Leading ‘deregulation’ advocates (loosely coupled networks of philanthropists, think tanks, and advocacy groups) led by The State Collaborative on Reforming Education or “SCORE” (founded in 2009 by former U.S. Senator Bill Frist) have engaged decision makers and K-12 administrators, not only to rally their support behind the TVAAS teacher effects
4 Dr. William Sanders passed away on March 16, 2017, at the age of 74. Prior to his death, he received the 2015 James Bryant Conant Award, given annually by the Education Commission of the States (ECS) to recipients who have made outstanding contributions to education in the United States.

Evaluating the TN Higher Education Commission's Report Card 7
data but also to communicate and publicize the differences in VAM estimates among TPPs (SCORE, 2016a, 2016b). Further, SCORE’s close collaboration with Tennessee Department of Education and State Board of Education legitimates the value-added approach for accountability in the state. These entities, together with alternative training programs that have poured into the state (i.e., Memphis Teacher Residency, Nashville Teacher Residency, Relay Graduate School of Education), provide the nucleus of a solid constituency that have called for strengthening the education labor market through competition or accountability scores/ratings (MTR, 2014; Tatter, 2016b; Zeichner & Pena-Sandoval, 2015).
I identify the detractors of the report card as being comprised of stakeholders (i.e., Tennessee Education Association or TEA, Tennesseans Reclaiming Educational Excellence) that have raised questions about reliability, validity, fairness and transparency of the results (TEA, 2015). The battle has escalated recently with TEA’s failed lawsuit that challenged the constitutionality of the state's use of TVAAS in teacher evaluations, and public debate on merits and demerits of the report card has grown more heated and politicized. Such fractures in the state’s ongoing discourse on applying VAMs to TPPs are a microcosm of the deep policy divide that looms large both in public and academic circles (Lincove et al., 2014).
It should be noted that the algorithms underlying the evaluation of the effectiveness of TPPs using TVAAS data are proprietary and placed in the hands of an out-of-state firm (SAS Institute in North Carolina) that has no governmental standing in Tennessee. This makes it difficult (impossible) to critique both the model and the analysis and repeat any of the complex statistical procedures that are not transparent and accessible to researchers (OREA, 2013). Such lack of access to student raw data has prevented researchers from examining the quality of the underlying student growth scores, as well as to utilize VAM scores through statistical modeling (Ronfeldt & Campbell, 2016). The absence of transparency over TVAAS’ closely guarded equations has led critics to raise questions about fairness (Commercial Appeal, 2016).5Under the current Tennessee law, TVAAS is operated by a privately held analytics software multinational company (SAS Institute, Inc.), which provides results back to the Tennessee Department of Education every school year. TVAAS results are then used by the Tennessee Higher Education Commission (THEC) to design and publish an annual report card comparing the value-added estimates of recent licensure recipients from various TPPs to the value-added scores of other teachers in the state.
The technical review of THEC's report card has limitations that should be noted. Although my review is focused on the varied technical details from the report card, I do not have access to TVAAS teacher effects raw data that would allow us to replicate the reported study findings (TCA-1-606b). As a result, the policy review is limited to an analysis and discussion of summary tables in the report card, augmented in some cases with additional contextual data, in a productive manner.
The organization of the rest of the study is as follows: section two begins with an examination of evaluation design and research elements that have formed the basis of much of the work in this field, and then describes the range of studies from recent efforts to measure the impact of TPPs. Section three describes the data and the report card's method of analysis. I then introduce the main analytic framework in section four. Section five presents the results, while the final sections contain the discussion and concluding remarks. In the next section, I summarize the findings that
5 Seven Houston teachers and the Houston Federation of Teachers have questioned the proprietary nature of TVAAS/EVAAS in an unprecedented lawsuit filed in 2014 with the U.S. District Court for the Southern District of Texas. The case opposed the district’s use of EVAAS in teacher evaluations. The federal judge ruled in favor of the teacher plaintiffs, claiming that measuring teacher performance based on a proprietary computer model violated constitutional due-process rights (see the case. Houston Federation of Teachers et al. v. Houston ISD).

Education Policy Analysis Archives Vol. 26 No. 33 SPECIAL ISSUE 8
have emerged from prior research efforts on teachers and TPPs and indicate some of their limitations. I also raise more policy questions left inadequately answered.
Literature Review
An Aggregation Approach to VAM for Estimating Teacher and TPP Effects
TVAAS methodology follows the progress of individual students over time by comparing a student’s predicted growth to their actual growth over the course of the school year. What makes TVAAS different from other VAMs is that there are three or more years of longitudinal student data available for analysis (Ballou, Sanders, & Wright, 2004). Each student is compared to his/her own past performance. By using individual student longitudinal data, each student serves as his or her own ‘control’ thereby eliminating the confounding impact of demographic variables, such as poverty and race/ethnicity. This means that unlike other VAMs, a student’s background characteristics (i.e., race, SES status) are not explicitly entered into the TVAAS equations as covariates. If a student actual growth score is greater than his or her predicted growth score, the difference is positively attributed to their teacher (i.e., the teacher is given a positive value-added score). Conversely, if a student actual growth score is less than his or her predicted growth score, the difference is negatively attributed to the teacher (Wright et al., 1997). Therefore, a ‘teacher effect’ is defined as the average test-score gain for his or her students, adjusted for differences across classrooms in student characteristics such as prior scores. Tennessee also derives an aggregate measure of a teacher’s value-added by measuring an individual teacher effect relative to the district gain. Notable scholars claim that such an aggregation approach to value-added modeling is important for policy purposes: over time a district can monitor changes to their teachers’ VAM scores based on the extent to which their students consistently exceed or fall below the district average gains for their grade and subject (Kane & Staiger, 2008; McCaffrey et al., 2009).
At the aggregate level, the teacher effects are averaged for all the teachers from a TPP and the averages are used to compare the performance of TPPs. In particular, Tennessee’s report card produces estimates of mean T-values under the assumption that any TPP that produces program graduates (beginning teachers) with sufficient data for evaluation within any given subject/grade would not have any unfair advantage over any other subject/grade group. The underlying TVAAS estimates of TPPs’ valued-added scores (henceforth, mean T-values) are based on the extent to which their program graduates consistently exceed or fall below the district average gains for their grade and subject.
Research on the Uses of VAMs to Evaluate Teachers
Using value-added models (VAMs) for individual teacher evaluation is gaining increasing acceptance among policymakers as a powerful departure over conventional indicators, such as classroom observations or measures of educational attainment or experience. In several states, up to half of a teacher’s evaluation depends on estimates from a VAM (Lohr, 2015). What William Sanders called “value-added” parallels that used in his other field of research on agricultural production/efficiency (Sanders, 2000).
To understand the use of VAMs to evaluate teachers, I begin with the vast and ongoing debate from different accomplished scholars about the technical adequacy and optimal application of such measures. In general, this debate is split into two camps. One group claims that VAM’s instability can be appropriately adjusted in econometric models to obtain consistent estimates of a teacher’s effectiveness. The other regards VAMs as so fundamentally flawed as to be rendered

Evaluating the TN Higher Education Commission's Report Card 9
unusable for making consequential decisions about teachers, except for use as part of quality improvement effort but not for accountability.
Researchers belonging to the first camp have compared estimates derived from different statistical methods and other technical issues involving model specification, choice of sample and outcome, and measurement error in the estimation of “teacher effects” (Chetty, Friedman, & Rockoff, 2014). Prior studies find considerable differences between the most and least effective teachers based on value-added results (Rivkin, Hanushek, & Kain, 2005; Sanders & Horn, 1998). Simulated student achievement datasets that mimic plausible types of student grouping and teacher assignment scenarios have indicated that some value-added estimators perform better than others (Guarino, Reckase, & Wooldridge, 2015; Guarino et al., 2015). Simulation studies have also shown that the potential for misclassifying teachers as high- or low-performing could be substantial, particularly for teachers who teach low-performing students. More recent experimental and quasi-experimental approaches have obtained informative estimates of teacher-value added, but with some noise (Chetty et al., 2014; Kane & Staiger, 2008; Staiger & Rockoff, 2010). Kane and Staiger (2008) compare experimental VAM estimates for a subset of California teachers with earlier non-experimental estimates for the same teachers and find that they are similar, suggesting that VAMs are better than other measures of teacher quality or subjective ratings. Chetty et al. (2014) find that estimated teacher effects on short-run achievement are large, and these estimates are correlated with long-run outcomes, including earnings. Other studies suggest that teachers improve in effectiveness in terms of value-added to student achievement up through at least their first four years with a leveling off after five years (Clotfelter, Ladd, & Vigdor, 2006; Rivkin, Hanushek, & Kain, 2005; Rockoff, 2004). Still other research suggests that overall teacher effects on math and reading achievement may tend to fade out relatively quickly, by up to 50 percent per year (Kane & Staiger, 2008; Rothstein, 2010). The crux of the VAM framework relies on a selection-on-observables assumption: teachers are assumed to be as good as randomly assigned conditional on previous test scores and other observed characteristics.
Researchers belonging to the other camp have documented the problems of measurement error and other sources of year-to-year variability in gain score data that are unstable across units (students), outcomes (subjects and tests) and settings (classrooms, supports, mobility, and other contextual factors) (Aaronson, Barrow, & Sander, 2007; Ballou, 2005; Koedel & Betts, 2007; Mihaly et al., 2010). For example, Koedel and Betts (2007) find that quintile groupings of estimated math teacher effects for the same teachers across different years can be unstable. Corcoran and Goldhaber (2013) note that the fewer the years of students’ prior achievement and the smaller the sample (the number of students’ test scores), the more imprecise the value-added estimates. With respect to the issue of validity, Papay (2011) finds that the different yet similar tests do not provide consistent teacher rankings on value added measures. All things considered, the low reliability/validity and stability of VAMs thus reinforces the need to proceed with great caution in using value added for high-stakes decisions about teachers.
Research on the Uses of VAMs to Evaluate TPPs
By extension, proponents of VAMs claim that the effectiveness of program graduates as measured by test score gains of the students they teach can be used to evaluate TPPs. However, researchers face many of the same econometric challenges that arise when VAMs are used to evaluate TPPs. Henry et al. (2012) review the approaches taken in several states’ RTTT proposals that have already estimated TPP effects with regard to the assessment of TPPs. Their analysis draws attention to the challenges these states face in establishing a “true effect” of a TPP on student test scores. A number of studies also confirm the challenges of estimating the TPP effects in subjects

Education Policy Analysis Archives Vol. 26 No. 33 SPECIAL ISSUE 10
where a large number of students have multiple teachers (Hock & Isenberg, 2012; Noell et al., 2008, 2009).
In a study comparing TPPs in Missouri, Koedel et al. (2012, 2015a, 2015b) have found more variation within programs than between them. The differences across programs explain only 1% to 3.2% of the total variation in teacher effects, while the estimated differences between the top and bottom programs (about 0.12 points) are primarily due to estimation-error variance rather than real differences in preparation. According to Mihaly et al. (2012), how VAMs are specified can also affect the value-added based TPP estimates from one program to another, with at least one TPP moving from the bottom quartile to the top quartile after the change in model specification is implemented. Indeed, a growing body of studies based on the VAMs of program graduates have confirmed little to no differences between TPPs, indicating that the variation in teacher effects is not explained by differences in preparation (Goldhaber, Liddle, & Theobald, 2013; Koedel et al., 2015; Mihaly et al., 2005; Osborne et al., 2012). Using a large and diverse dataset from Texas, Hippel et al. (2016) find that the true teacher quality differences between TPPs—the so-called ‘policy signal’—to be quite small and noisy. In particular, a one standard deviation increase in TPP quality predicts just a .02 and .03 standard deviation increase in student scores. Compounded by the problem of multiple comparisons (fewer large TPPs), the authors raise doubts if TPP differences could be estimated reliably.
Selection Bias Problem
There is a major selection problem in the use of VAMs to gauge teacher effects and the effectiveness of teacher preparation program graduates. In the case of teacher effects, Rothstein (2007, 2009, 2010) provides evidence that students who are assigned to classrooms in non-random ways can create biased, teacher-level value-added scores. Such nonrandom sorting of teachers to students across schools, as well as the nonrandom sorting of students to teachers within schools, introduces systematic errors or potential biases into estimates of teacher effects caused by un-observables. Well known to researchers as the “Rothstein falsification test”, Rothstein states that his test can be used as evidence that the various factors affecting student-teacher sorting are not fully included as controls in VAMs, implying a correlation between time-varying omitted variables affecting achievement gains and teacher placement into classrooms (Koedel & Betts, 2011).
In terms of estimating the value-added scores of TPPs, two sources (multiple) of selection bias are eminent: a bias that comes when TPPs select candidates and later at entry to full-time teaching. In the absence of an experiment, economists rely on a variety of statistical control strategies and/or natural experiments to reduce omitted variables bias that are most likely to occur at multiple stages—at entry to teacher education, during teacher education and at entry to full-time teaching. However, prominent researchers have claimed that the assumptions surrounding VAMs are overly simplistic given the non-randomness of the teacher candidate population and the teacher selection that occurs at these multiple stages (Collins, 2014). Such a concern is worth emphasizing because policy discussions often treat the impact of TPP attributes on specific teacher and student outcomes as a reflection of training alone. The more TPPs within a state differ in their policies, selectivity, mission and approval process for candidate selection and training, the more likely we see biased estimates in the effectiveness of their graduates. For example, if teacher candidate pools who enroll in a traditional TPP are systematically different from teacher candidates who enroll in an alternative program (i.e., TFA), and both teacher candidate pools with different characteristics are compared once they become teachers, one group might have a distinct and unfair advantage over the other (Boyd et al., 2006, 2009; Harris & Sass, 2011; Wenglinsky, 2002). More recent research on

Evaluating the TN Higher Education Commission's Report Card 11
the effects of selection at entry to TPPs comes from Teach for America (TFA), which focuses on identifying candidates who will become strong teacher-leaders.
The policy direction and value of TPPs are hotly contested research areas. Like every state, Tennessee has relied on alternative routes to certification (TCA 49-5-5603) such as Teach for America (TFA) as a significant source of new teachers. It has been generally assumed that graduates from more selective TPPs such as TFA are superior teachers. Early studies provided some support for these claims, as a number found positive correlations between quality of university attended and teacher effectiveness (Ehrenberg & Brewer, 1994; Summers &Wolfe, 1977). However, Kane, Rockoff and Staiger's (2008) study of New York teachers found little difference between teachers recruited from highly selective colleges by TFA and other teachers. Clotfelter and his colleagues’ research using North Carolina administrative data found no relationship between college selectivity and teacher effectiveness in elementary and middle schools (2006, 2007a). By contrast, Clotfelter, Ladd, and Vigdor (2006) found a significantly positive relationship between college selectivity and the effectiveness of high school teachers. Mixed findings like these are not surprising given that there are likely significant differences in the effectiveness among teachers who received training in either traditional or alternative programs from highly rated institutions (Humphrey, Wechsler, & Hough, 2008).
Another major source of selection bias is in disentangling the impact of TPPs on graduate performance from influences at entry to full-time teaching (i.e., characteristics of the schools and districts they teach) (Harris & Sass, 2011). The major challenge is how to mitigate bias from nonrandom assignment of TPP graduates to schools, as well as account for unmeasured school conditions that can impact job placements and estimates of the productivity of TPP graduates. Features like professional development, induction programs, mentoring, curriculum/pedagogy, collegial culture, and attributes and types of students all influence VAM measures of TPP graduates. If teacher effect estimates are sufficiently biased, they may lead to errors in the recruitment or dismissal of new teachers and misallocate priorities of TPPs. Such problems could undermine confidence in data collection systems and the use of VAM-based data for TPPs. Clearly, addressing selection bias is a concern when using VAMs to assess TPPs.
A Framework for Analysis
The public demand for effective teachers and high-quality TPPs makes it crucial to scrutinize how well states like Tennessee accurately assess the value-added contribution of teachers trained at in-state TPPs. I consider three central issues in reviewing the evaluation findings that link TPPs to teaching effectiveness based on teacher value-added measures. The issues are: 1) accuracy, and 2) consistency and validity, and 3) usability.
Accuracy
The issue of accuracy is intended to increase the dependability and truthfulness of the findings, especially those that link the differences in teacher value-added estimates to systematic differences in TPPs (Plecki, Elfers, & Nakamura, 2012). I examine the extent to which the report card provides accurate public information when implementing VAMs to assess the program impact of TPPs based upon the achievement gains of students taught by beginning teachers. As pointed out in this policy review, the calculated effect estimates (in this case, the mean T-values of the teacher effect) do not capture all relevant aspects to accurately estimate the TPP graduates’ value-added, even when focused solely on the subject areas of the Tennessee Comprehensive Assessment Program (TCAP) tests. The VAM estimates produced in the report card are either unstable or inaccurate, and therefore very far from perfect for policy or practical purposes. Although it is beyond the scope of

Education Policy Analysis Archives Vol. 26 No. 33 SPECIAL ISSUE 12
this study to test and use proxies for unobserved teacher and TPP attributes, the additional data collection provide contextual details to the report card. I seek to use this information to examine the full range of statistical problems that arise in producing the value-added scores of TPPs.
Consistency and Measurement Validity
The issues of consistency and validity are made up of two components: (i) the focus on consistency and clarity of the definitions and analytic procedures; and (ii) systematic errors in measurement. For example, using a measure based on the teacher effect is a valid measure of TPP evaluations if it accurately measures the teacher effects it is intended to measure (Kupermintz, 2003). If this measure contains little error, it is valid. On the other hand, consistency in this context relates to the treatment of the information on TPPs and teacher effects. I also identify systematic errors in measurement (Ballou, 2005). The attention to consistency and measurement validity of teacher effects adds to the emerging body of research about the measurement error in estimates of teacher effects and unaccounted for variability within and across TPPs (Aaronson et al., 2007; Goldhaber & Hansen, 2010; Kane & Staiger, 2008; Koedel & Betts, 2007).
Usability
Usability is a quality attribute that assesses how easy and useful it is for the different types of stakeholders to define and interpret research evidence and evaluation. Because a quantitative evaluation of TPPs does not speak for itself, policymakers, practitioners and the general public must always interpret its meaning, consequences, and implications for their particular needs and circumstances. The information gathered through accountability systems such as TPP evaluations using a value-added system has created unprecedented stakes around stakeholders' use of evidence as applied to their local circumstances and implementation concerns. Several usability issues are identified in this policy review. This review calls for caution against embracing formal, outcome-based evaluations of TPPs without caveats that limit their applicability (Fuller, 2014; Floden, 2012). This policy review suggests that given the inherent difficulty of disentangling the impact of teachers and TPPs on value-added scores, policy-makers, educators and the general public should be cautious about inferring too much about the effectiveness of TPPs based on VAM itself.
Methods & Data
The primary unit of analysis in the report card is the teacher preparation program (TPP). The TPP data include all of the common demographic variables of licensure recipients as well as placement and retention rates, Praxis II results, and teacher effect data based on TVAAS scores. The report card includes additional indicators intended to measure the quality of beginning teachers for each TPP that have been used in previous studies, such as licensure status, endorsement areas, and prior academic performance. Table 1 identifies the full set of variables used in the report card.6 In addition, I itemize additional indicators reported to Tennessee Higher Education Commission (THEC) by the TPPs but are not published or used in the report card.
6 Personal information such as zip code and date of birth tied to the program completers are not reported so that privacy issues are not compromised. Under the state's statute (TCA 49-1-606), individual teacher effects are considered private, and hence restricted for access, use, and analysis by the general public.

Evaluating the TN Higher Education Commission's Report Card 13
Table1 Description of the variables (with variable names) collected from the report card
A. Teacher Preparation Program* Description
Institution Type Alternative Provider, TICUA, TBR
Accreditation SACS, NCATE
Approved Teacher Education Programs total number of approved teacher education programs
Top Endorsement Areas Tennessee areas of endorsement that program completers completed at the time of graduation
Placement and Retention Data the number of years since the program completers per TTP have graduated and been eligible to teach
Teacher T-Value Effects teacher effect divided by its standard error in all subjects
Counties/Districts where Program Completers Taught in 2011-12
county/district name, number of teachers
Duration of Teacher Preparation Program 4- or 5-year program
Type of Initial Teacher License total in-state and out-of-state program completers per TTP
Licensure Type of Program Completers total number of program completers with traditional and alternative licenses
B. Teachers* Description
Race a completer's race: Asian/Pacific, Alaskan Native, Black, Hispanic, White, Unclassified, American Indian, Multiracial
Gender a completer's gender: Male, Female, Unknown
Licensure Status licensure status: Apprentice, Transitional, Beginning Level Administrator, Interim Type B, JROTC, Occupational Education, Out-of-State, Professional Teacher, Apprentice Special Group/Professional School Service Personnel, Beginning Instructional Leadership
Academic Information final GPA, major GPA, high school GPA, ACT Composite, ACT Reading/Science/English/Math, SAT Cumulative, SAT Math/Verbal
C. Data collected but not published** Description
Program completer's personal information name, date of birth, permanent residence, state, zip code
TVAAS Teacher Value Added (also known as Teacher Effects Data)
estimates of specific teacher impact on the progress of the students
Program completion status program completer's status: degree recipient or non-degree recipient
Award Term/Year program completer's award term and year: fall/spring/summer
Degree Awarded specific degree awarded
Primary Major/Secondary Major first and second major areas in which the degree was awarded
Note: *Information contained in the actual Report Card. **Collected but not contained in the report card. Source: Tennessee Higher Education Commission (THEC; 2012c).

Education Policy Analysis Archives Vol. 26 No. 33 SPECIAL ISSUE 14
Several other databases that contain a range of information about the TPPs, as well as
the environments (i.e., school district) in which these TPPs are located, substantially enrich the report card. I use the School District Demographics System (SDDS) and the American Community Survey's 2006-2010 dataset to access information about demographics and social characteristics of school districts in Tennessee. I also use the Tennessee Department of Education website to examine the state's 2012 academic report card, which provides district-by-district designations under the new accountability system, such as Exemplary District and Reward School Status. The data used in the report card come from the Tennessee Value-Added Assessment System (TVAAS). The value-added data from TVAAS are linked to all beginning teachers who received their licensure in 2011-12 from one of 41 Tennessee TPPs in the state. All teachers who have been teaching for one to three years are included in the report card. The content of the report card proceeds in two parts. The first set of analyses provides a statistical comparison between each TPP and the state distribution with respect to the percentage of licensure recipients (beginning teachers) being produced that are highly effective or very ineffective. It utilizes the binomial distribution to assess statistical significance, with a null hypothesis that each TPP distribution is the same as the state distribution. More specificall y, each TPP has a certain percentage of teachers who fell into the upper and lower quintiles. A level of 0.10 is used to determine significance (THEC, 2012b). The second set of analyses calculates the mean T-values of the teacher effects using a one-way analysis of variance (ANOVA) with TPP as the fixed effect (THEC, 2012b). Such analysis is used to determine whether the comparison of the average T-value of teacher effect among beginning teachers in each TPP is statistically different from the other two reference populations, namely the average effectiveness of all veteran teachers (teaching more than three years) as well the mean of means for all TPPs in the state. The difference of the estimated mean teacher T-value of effects for each comparison group is tested for significance. More importantly, each TPP regardless of the number of teachers in a comparison group is weighted the same. The intuition behind the unweighting is simple: a comparison of each TPP mean to mean of all of the TPP means will cause a small number of TPPs to be assigned higher weights, and thus to dominate the mean. Further, the report claims that this method of unweighting ensures a more fair comparison among TPPs (THEC, 2012b).
This policy review begins with constructing a data table of attributes and variable names used in the report card, along with additional data collected from federal and state sources (i.e., census data and achievement) to provide contextual details to the teacher training programs in the state. Next, I examined several potential sources of discrepancy between the reported mean effectiveness of beginning teachers that are grouped by subject and type of licensure and the mean teacher effects calculated (both weighted and unweighted) from institutional profile summary reports. I used Excel spreadsheets to arrange the analysis of the estimated differences in the average effectiveness of beginning teacher in a given subject/grade and licensure type from each TPP. As earlier noted, the THEC report card on the effectiveness of TPPs is generated from confidential and proprietary data sources and statistical models (commonly known as "black box" methodologies), making it impossible to replicate the results.

Evaluating the TN Higher Education Commission's Report Card 15
Results
Accuracy
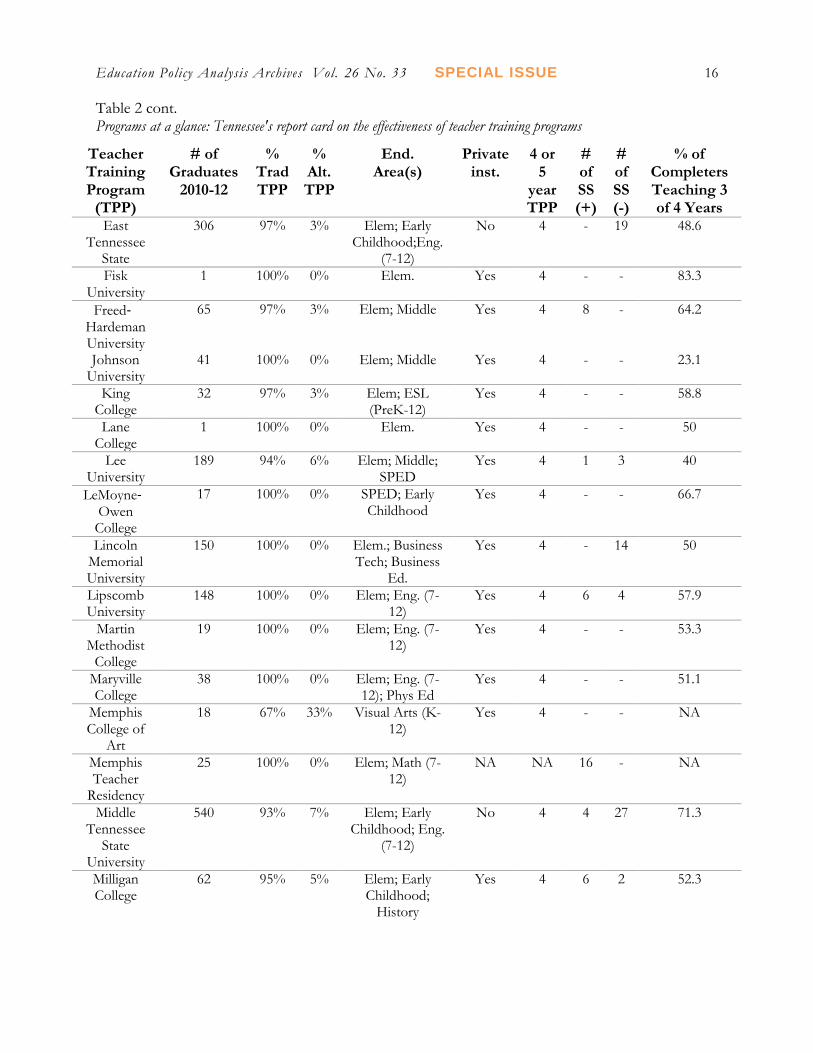
The analysis begins with a breakdown of statistically significant findings by TPPs and certification pathways, comparing student outcomes produced by teachers from each of the TPPs at the state level. As shown in Table 2, Teach For America (TFA) programs in Memphis and Nashville stand out as outperforming every other teacher preparation program in the state, producing between 17 and 24 statistically significant teacher effects in the most effective 20% of teachers for TPPs in every subject area. Two additional programs – the Memphis Teacher Residency and the University of Tennessee in Knoxville (UT Knoxville) –produce 16 and 11 statistically significant positive teacher effects, respectively. By contrast, 27 of 44 TPPs (61%) have generated teachers in the lowest quintile of effectiveness, as measured by the T-value of their teacher effects. The results are based on the analysis of the number of graduates in the most effective 20% and least effective 20% of all teachers.
Table 2 Programs at a glance: Tennessee's report card on the effectiveness of teacher training programs
Teacher Training Program
(TPP)
# of Graduates
2010-12
% Trad TPP
% Alt. TPP
End. Area(s)
Private inst.
4- or 5-
year TPP
# of SS (+)
# of SS (-)
% of Completers Teaching 3 of 4 Years
Aquinas College 10 100% 0% Elem (K-6)
Yes 4 - - 0
Austin Peay State University
150 81% 19% Elem Eng., His
(7-12)
No 4 - 12 61.1
Belmont University 172 96% 4% SPED; Elem,
Math (7-12)
Yes 4 6 2 50.9
Bethel University 41 78% 22% Elem; Phys Ed
Yes 4 - 4 80
Bryan College 19 100% 0% Elem; Eng. (7-12); Gen.
Music
No 4 - - 20
Carson-Newman College
137 74% 26% Elem; Middle; Phys Ed
Yes 4 - - 58.7
Christian Brothers University
56 71% 29% Elem; Middle; Early
Childhood
Yes 4 - 2 50
Cumberland University 103 57% 43% Elem; SPED;
Business Ed.
Yes 4 2 2 74
Education Policy Analysis Archives Vol. 26 No. 33 SPECIAL ISSUE 16
Table 2 cont. Programs at a glance: Tennessee's report card on the effectiveness of teacher training programs
Teacher Training Program
(TPP)
# of Graduates
2010-12
% Trad TPP
% Alt. TPP
End. Area(s)
Private inst.
4 or 5
year TPP
# of SS (+)
# of SS (-)
% of Completers Teaching 3 of 4 Years
East Tennessee
State
306 97% 3% Elem; Early Childhood;Eng.
(7-12)
No 4 - 19 48.6
Fisk University
1 100% 0% Elem. Yes 4 - - 83.3
Freed‐Hardeman University
65 97% 3% Elem; Middle Yes 4 8 - 64.2
Johnson University
41 100% 0% Elem; Middle Yes 4 - - 23.1
King College
32 97% 3% Elem; ESL (PreK-12)
Yes 4 - - 58.8
Lane College
1 100% 0% Elem. Yes 4 - - 50
Lee University
189 94% 6% Elem; Middle; SPED
Yes 4 1 3 40
LeMoyne‐Owen
College
17 100% 0% SPED; Early Childhood
Yes 4 - - 66.7
Lincoln Memorial University
150 100% 0% Elem.; Business Tech; Business
Ed.
Yes 4 - 14 50
Lipscomb University
148 100% 0% Elem; Eng. (7-12)
Yes 4 6 4 57.9
Martin Methodist
College
19 100% 0% Elem; Eng. (7-12)
Yes 4 - - 53.3
Maryville College
38 100% 0% Elem; Eng. (7-12); Phys Ed
Yes 4 - - 51.1
Memphis College of
Art
18 67% 33% Visual Arts (K-12)
Yes 4 - - NA
Memphis Teacher
Residency
25 100% 0% Elem; Math (7-12)
NA NA 16 - NA
Middle Tennessee
State University
540 93% 7% Elem; Early Childhood; Eng.
(7-12)
No 4 4 27 71.3
Milligan College
62 95% 5% Elem; Early Childhood;
History
Yes 4 6 2 52.3

Evaluating the TN Higher Education Commission's Report Card 17
Table 2 Programs at a glance: Tennessee's report card on the effectiveness of teacher training programs
Teacher Training Program
(TPP)
# of Graduates
2010-12
% Trad TPP
% Alt. TPP
End. Area(s)
Private inst.
4 or 5 year TPP
# of SS (+)
# of SS (-)
% of Completers
Teaching 3 of 4 Years
South College
42 100% 0% Elem Yes 4 - 14 39
Southern Adventist University
40 100% 0% Elem; History
Yes 4 - - 0
Teach for
America‐ Memphis
147 0% 100% Elem; Middle; Eng.
(7-12)
NA NA 17 2 NA
Teach for
America‐ Nashville
97 8% 92% Elem; Middle
NA NA 24 2 NA
Teach Tennessee
54 0% 100% Math; Biology
No NA - 2 NA
Tennessee State
University
93 100% 0% Elem; Early Childhood
No 4 - 14 68.1
Tennessee Tech.
University
434 95% 5% Elem; Early Childhood;
Phys Ed
No 4 - 13 62
Tennessee Wesleyan College
42 100% 0% Elem; Phys Ed
Yes 4 - 10 74.3
TNTP: Memphis Teaching Fellows
63 0% 100% Middle; SPED
NA NA - 13 NA
TNTP: Nashville Teaching Fellows
64 0% 100% Elem; Middle
NA NA - - NA
Trevecca Nazarene University
109 100% 0% Elem; Phys Ed
Yes 4 2 7 56.9
Tusculum College
120 98% 2% Elem; Phys Ed
Yes 4 - 11 63.9
Union University
116 47% 53% Elem; Middle; Eng.
(7-12)
Yes 4 6 4 46.5
University of Memphis
466 81% 19% Elem; SPED;
Middle (4-8)
No 4 7 22 64.8

Education Policy Analysis Archives Vol. 26 No. 33 SPECIAL ISSUE 18
Table 2 cont. Programs at a glance: Tennessee's report card on the effectiveness of teacher training programs
Source: Tennessee Higher Education Commission (THEC; 2012a).
When the effectiveness of TPPs is revealed by comparisons across TPPs for which value-added results are statistically significant, such comparisons are not truly apples-to-apples. In particular, comparing these 'apples' (TFA programs and the Memphis Teacher Residency) to the remaining 'apples' (all other TPPs in the state) masks important differences in resource inputs to preparing and supporting prospective teachers. For example, TFA recruits undergo five weeks of training during the summer and complete intensive training in classrooms as student teachers or team teachers more than a typical new teacher (Darling-Hammond et al., 2005; Xu et al., 2011). When a TFA teacher gets certified, they already have two years of teaching experience. In short, they prepare to teach at the same time as they are teaching and they do so over a two-year period of time. In that sense, a first-year TFA teacher is really in their third year of teaching, while a teacher from a regular TPP in their first year is really in their first year of teaching. Most TPPs do not require practicum experience until the junior or senior year of college.
If this is right, one would expect the more experienced TFA teachers to have large value-added to student achievement in the early years of post-certification. The same reasoning goes through for selective programs such as the Memphis Teacher Residency and the University of Tennessee in Knoxville. In particular, the Memphis Teacher Residency requires twelve-month training in their classrooms and intensive training-related activities during this period that is not typical of traditional TPPs. Clearly, the various approaches (resource inputs) to teacher training are important and may affect the extent to which we can accurately assess the effectiveness of each program's graduates based solely on teacher value-added data reports.
Table 3 describes the characteristics of licensure recipients from the three highest rated effective teacher-training program institutions and the three least effective program institutions. Differences are evident across teacher training institutions, with teachers entering through Teach for
Teacher Training Program
(TPP)
# of Graduates
2010-12
% Trad TPP
% Alt. TPP
End. Area(s)
Private inst.
4 or 5
year TPP
# of SS (+)
# of SS (-)
% of Completers Teaching 3 of 4 Years
University of Tennessee-
Chattanooga
199 85% 15% SPED; Early Childhood; Middle (4-8)
No 4 - 8 53.5
University of Tennessee- Knoxville
256 85% 15% Elem; SPED; Early
Childhood
No 4 11 6 61.6
University of Tennessee-
Martin
259 81% 19% Elem; Phys Ed; Early
Childhood
No 4 1 29 61.7
Vanderbilt University
117 100% 0% Elem; SPED; Eng. (7-12)
Yes 4 - - 18
Victory University
45 60% 40% Elem., Middle Yes 4 - 14 82.6
Welch College
6 100% 0% Elem. Yes 4 - - 20

Evaluating the TN Higher Education Commission's Report Card 19
Table 3 Top three and bottom three teacher training programs in Tennessee
Information TFA-Memphis
TFA-Nashville
UT Knoxville
University of
Memphis (UM)
University of
Tennessee- Martin (UT)
Middle Tennessee
State University
(MT)
In-State 10% 13% 96% 90% 98% 97%
Out-of-State 90% 87% 4% 10% 2% 3%
Traditional License 0 8 218 379 209 504
Alternative License 147 89 38 87 50 36
Avg. Final GPA 3.56 3.66 3.81 3.48 3.37 3.4
Avg. Major GPA 3.61 - - 3.55 - -
Avg. High School GPA 3.69 - - 3.12 3.31 -
Avg. ACT Composite 26.9 28.1 - 21.8 22.2 -
Avg. ACT Reading 30.5 - - 23.2 23.1 -
Avg. ACT Science 24.8 - - 21.4 21.6 -
Avg. ACT English 29.5 - - 23.3 23 -
Avg. ACT Math 27.7 - - 20.2 20.8 -
Avg. SAT Cumulative 1330 - - 1038 - -
Avg. SAT Math 655 - - 496 - -
Avg. SAT Verbal 671 - - 541 - -
No. of Completers 147 97 256 466 259 540
No. of Statistically significant (SS) (+) results
17 24 11 7 1 4
No. of Statistically significant (SS) (-) results
2 2 6 22 29 27
Praxis II Pass Rates N/A N/A 97% 98% 90% 94% % of Teachers Teaching in Year 1 (2007-08 cohort)
100% n/a 70.1% 66.9% 64.1% 67.2%
% of Teachers Teaching in Year 2
100% n/a 70.6% 69% 71.3% 71.6%
% of Teachers Teaching 3 Consecutive Years
31.1% - 58.8% 58.8% 57.5% 58.3%
% of Teachers Teaching 3 out of 4 years
- - 61.6% 64.8% 67.7% 71.3%
Source: Tennessee Higher Education Commission (THEC; 2012a).
America (TFA) and the Memphis Teacher Residency demonstrating better performance on measures of academic preparation and/or general ability than those teachers from other institutions. TFA-Memphis and TFA-Nashville teachers appear to have the highest GPA and aptitude scores (SAT and/or ACT) of any sizable group entering the teaching profession. The average SAT scores of TFA teachers exceeded those of traditionally trained teachers by 159 points in math and 130 points in verbal. TFA teachers exceeded their traditionally trained counterparts in all four subject areas of ACT: English, reading, math and science. TFA teachers also produced significant positive effects over teachers who did not participate in TFA. By contrast, traditionally trained teachers generated
Education Policy Analysis Archives Vol. 26 No. 33 SPECIAL ISSUE 20
significant more negative effects than their TFA counterparts. Based on the information available, it is unclear whether these effects are due entirely to more rigorous selection or the unique training that teachers from TFA and other selective programs (i.e., the Memphis Teacher Residency) undergo after being selected.
Because the report card contains only particular measures of the state's evaluation of TPPs, one-way ANOVA models with the institution as the fixed effect indicate that TFA and other highly-rated programs such as the Memphis Teacher Residency stand out as outperforming every other teacher preparation program in the state, although another plausible explanation for that finding may exist. Because beginning teachers may be correlated to the TPPs from which they graduated, what appear attributable to selective TPPs may instead be attributable to omitted teacher characteristics. As shown in Table 3, alternative route programs like TFA typically recruit teacher candidates with better academic qualifications. The effects of TFA and the Memphis Teacher Residency could very well be attributed to its recruitment and selection process. In other words, because the characteristics of teacher candidates in the top tier and bottom tier TPPs in the state are not equivalent or balanced at baseline, differences in teacher effects cannot accurately be attributed to the effects of the TPPs.
The report card reveals that 48% of program completers are still teaching in the public school system three years after initial employment. The calculated overall mean retention of teachers from specific programs who taught three out of four years is as follows: (M=52.55, SD=20.73, CI=45.63915, 59.46355). The associated skewness and kurtosis (measures of the shape of the data) are 3.53 and -.977, respectively, implying heavier tails than a normal distribution and, thus, high variance. These retention patterns must be interpreted with caution given the variability of attrition patterns among program completers, and thereby resulting in imprecision in the contributions to student achievement of individual TPPs. Recent research has dramatically increased our understanding of the implications of teacher retention for value-added estimates (Boyd et al., 2009). Attributes of program completers and the students (including the school context) they teach appear to interact in important ways. A crucial policy issue that is not answered in the report card is whether those program completers who leave their job less than three years after teaching in a public school are more or less effective than their counterparts who remain.
A noteworthy takeaway in the report card is that while TFA and the Memphis Teacher Residency have produced new teachers with a high value-added impact in the short-term, graduates of these programs leave their initial placements or the teaching profession at higher rates than their counterparts in other programs. As noted in Table 3, TFA teachers have lower first year attrition because they often are required to meet the program requirement to stay in teaching for at least two years (Glazerman et al., 2006). However, the majority of teachers at TFA exited the school system after their second or third year, while about 40% of the Memphis Teacher Residency and University of Tennessee-Knoxville's program completers left their teaching positions after the third year. This finding supports prior studies showing more able teachers with higher opportunity costs such as TFA are more likely to exit the profession (Ingersoll et al., 2014; Rockoff, 2004). By contrast, the placement and retention of program completers from regular TPPs remained fairly stable over three years. The majority of their program completers who went to work in year one was still teaching after four years. Consequently, it is impossible to know whether the statistically positive differences in T-value effects for TFA teachers, as well as the very small number of statistically significant negative T-values from less effective programs, can be attributed to the TPPs. In addition, the long-term influence of TPPs that produce teachers with a high value-added impact is unclear, considering that their program completers are more likely than others to exit the system at the outset of their careers.
Further, more than half of TPPs in the state send a majority of new graduates to only a few districts that are either nearby or have geographic characteristics emphasized by the TPPs, such as

Evaluating the TN Higher Education Commission's Report Card 21
rural or inner-city locations. Specifically, 24 out of 42 TPPs (62%) have placed their graduates in primarily contiguous school districts, indicating the geographic scope of teacher labor market. Disentangling the effects of TPPs from the mixing of TPP graduates within a school district is problematic. This policy review would not, for instance, want to misattribute the independent effects of the local nature of the teacher labor market and the heterogeneity of TPP graduates’ assignment preferences. Recent studies have shown that TPP graduates often work in school systems close to where they completed their training program (Mihaly et al., 2013), so that these schools are mostly staffed by nearby TPPs, rather than by the range of TPPs within a state.
Although I am unable to determine the proportion of new teachers7 that have come from TPPs, I summarize the ‘contextual’ attributes of school districts that are the primary sources (destinations) of newly hired teachers (see Table 4). Davidson (Nashville) and Memphis, two of the largest school districts in the state, have a greater percentage of new teachers, 10% and 9% respectively. Both districts serve a high minority, high poverty student population, and Memphis is a district “in need of improvement.” Large suburbs and rural communities rank next in concentration of new teachers but do not serve children in low-income families (per capita incomes are above the state average). This is consistent with previous findings that show that among all the locales, large cities have the highest rates of new teachers, are the largest school districts, and serve predominantly racially and economically diverse student bodies. A related policy issue that is not accounted for in the report card is the data for program graduates teaching in high-need schools or in schools with predominantly minority population (i.e., African-American and Hispanic students). For example, TPPs across the state could be rank-ordered by the percentage of program completers working in schools with the poorest students. The collection of such contextual data is critical, since the TVAAS methodology provides no explicit controls for any factors that might influence estimates of value-added for TPPs and their program completers, such as socioeconomic status or school resources. Bias is introduced into the TVAAS due to the impossibility of TPP graduates having an equal chance of being placed in a school serving a particular student population year after year.
7 For example, new teachers every year may come from a variety of sources — graduates of TPPs, retired school personnel re-entering the teaching profession, intra-district transfers, teachers who left the profession and then returned, teachers who left Tennessee to teach in another state and then returned and teachers who move to Tennessee.

Education Policy Analysis Archives Vol. 26 No. 33 SPECIAL ISSUE 22
Table 4 Characteristics of Tennessee school districts with the largest concentration of beginning teachers
School District
# of New
Teachers
% of New
Teachers
Total Students
Total Teachers
Total School
District Proficiency Level (2011-
12)
Locale Per Capita Income
Davidson (Nashville)
313 10% 78,782 5,526 140 Intermediate City: Large
$33,350
Memphis City 297 9% 111,834 7,235 217 In Need of Subgroup
Improvement
City: Large
$26,914
Knox County
184 6% 57,977 3,879 87 Intermediate Suburb: Large
$45,312
Shelby County
117 4% 47,706 3,040 51 Intermediate Suburb: Large
$52,771
Hamilton (Chattanooga)
132 4% 42,589 2,969 77 Intermediate Suburb: Large
$37,441
Rutherford County
121 4% 38,846 2,564 47 Exemplary Rural: Fringe
$39,326
Montgomery County
88 3% 29,780 1,989 36 Intermediate Rural: Fringe
$35,495
Sumner County
76 2% 27,907 1,914 46 Intermediate Suburb: Large
$41,137
Williamson County
84 3% 31,616 1,962 40 Intermediate Rural: Fringe
$69,549
Wilson County
58 2% 15,705 997 20 In Need of Subgroup
Improvement
Suburb: Large
$44,548
Note: The above table was constructed by the authors to provide contextual details to the report card. **Based on per capital income in the past 12 months of parents with children enrolled in public schools (in 2010 inflation-adjusted dollars) from American Community Survey 2006-10 Dataset. ***The average per capita statewide was $34,921 in 2010. (Source: TN Advisory Commission on Intergovernmental Relations, 2013).
Consistency and Measurement Validity
Possible bias against large programs. The Table Program at a Glance of the report (see Table 2) shows the number of positive and negative statistically significant results. In the report card, the analytical procedures used appear to be biased against large programs. The correlation of the total number of statistically significant results for each program with the number of program completers is 0.66 and with the number of programs with data is .58 (and this is after omitting the small programs with too few teachers to provide data). Because little attention is given to statistical power (the probability that a VAM will detect a difference) among the various TPPs, this creates a tendency to be biased against large programs. Statistically significant is one thing; large and important effects may be another. The uncertainty in the estimates of the mean T-values will overlap between large and small TPPs, making the significant results indistinguishable from each other. A

Evaluating the TN Higher Education Commission's Report Card 23
power analysis can be helpful to practitioners and policymakers in assessing the relevance of statistically significant results, especially when large TPPs are involved because even small effects are likely to become significant, although these effects may be trivial.
Incomplete Explanations. The smaller comparison groups for graduates in TPPs provide justification to look more closely at the study sample. This is because the smaller the sample size of TPP graduates, the less information we have and so our uncertainty about the estimates of their mean T-values is less precise. For example, it is important to discern whether the mean T-values of graduates from alternative and traditional program differs appreciably from veteran and beginning teachers. In the report card, the estimated mean T-values for each program is color coded to reflect “statistically significant” results. Apparently, the number of teachers in a program is a factor since in some cases a number with greater absolute value is not color coded while a smaller one is. For example, in the veteran teacher comparison to traditional teachers of Grades 4-8 TCAP Math, the Austin Peay State University value of 1.1001 (N=8) is not statistically significant while the -0.4314 (N=90) for University of Memphis is statistically significant. The juxtaposition of TCAP Science results from two TPPs indicate that the non-significant mean T-value for Austin Peay State University is 1.0342 (N=9) while for Middle Tennessee State University the mean of -0.6976 (N=105) is statistically significant.
No information on variability in mean T-values and other important omissions. The report card provides no indication of the degree of variability of the mean T-values within and across programs. It is reasonable to assume that, like schools and districts, some TPPs may have a higher concentration of effective teachers in certain subject areas and grade levels, while others have a higher concentration of ineffective ones. For example, a TPP rated as having statistically significant mean T-values may have a high variability in teacher effects among its program graduates, with some graduates generating low to no effects on student achievement and some graduates producing extremely high teacher effects. Determining the effectiveness of TPP graduates based on the mean T-values within programs may mask this variability.
In addition, simple comparisons of the mean T-values between a reference group population within a TPP (i.e., graduates from traditional and alternative programs) and veteran teachers as well as beginning teachers from all TPPs in the state makes it difficult to detect extraneous variability. Very different comparison of means for two groups can occur by chance (random variation) and systematically (variability not due to chance alone, or bias). The heterogeneity in the TPP (having widely dissimilar elements such as orientation and philosophy) leads to relatively large random variation in the mean T-values. Such heterogeneity contributes to random error and makes it more difficult to detect variability due to TPPs alone. On the other hand, systematic error or bias has a net direction and magnitude so that computing the average effectiveness of graduates within a TPP and comparing it to the average effectiveness of graduates from all TPPs in the state does not eliminate its effect. In fact, bias can be large enough to invalidate any conclusions.
Considering other possible statistics is a way to recognize that care should be taken in interpreting results based on the mean T-values. For example, the degree of uncertainty in mean T-values could be reported in ways that would make the magnitude of the standard errors evident by graphical displays that show their confidence intervals. In addition, there is no way to evaluate the degree of variability between programs relative to within programs. Tables 5, 6, and 7 show how this information could be included in the report card using the standard deviation (SD). The tables indicate that the SD is important because, regardless of the institution (TPP) mean T-values, it makes a great deal of difference whether the distribution of the average effectiveness is either above or below the mean. The logical implication, however, is that the estimation of mean T-values is a

Education Policy Analysis Archives Vol. 26 No. 33 SPECIAL ISSUE 24
‘zero-sum game.’ That is, the estimation of mean T-values within a program depends on the performance of all other program graduates in a TPP. Table 5 Sample tables with additional column to include standard deviation of T values
Veteran Teacher Comparison to Traditionally Licensed New Teachers
Subject Mean of T Values
Standard Deviation of
T values (Missing in the report)
Teachers in Program
Total Program Statewide
TCAP Composite (grades 4-8) -0.7599
1772 32
- Math -0.1591
959 29
- Reading/Language -0.1454
1067 31
- Science -0.0781
839 25
- Social Studies -0.1979
835 29
EOC Composite (High School) -0.5863
528 28
- Algebra 1 -0.8495
76 9
- Algebra 2 -2.1250
56 9
- Biology 0.7144
36 5
- English 1 -0.2219
84 8
- English 2 -0.6576
59 7
- English 3 0.2535
41 5
- US History 0.1830
23 3 Source: Tennessee Higher Education Commission (THEC; 2012a).
Table 6 Sample tables with additional column to include standard deviation of T values
Veteran Teacher Comparison to Alternatively Licensed New Teachers
Subject Mean of T Values
Standard Deviation of
T values (Missing in the report)
Teachers in Program
Total Number of Programs Statewide
TCAP Composite (grades 4-8) 0.1155
293 14
- Math 1.2506
101 6
- Reading/Language -0.1200
96 6
- Science 0.5745
101 7
- Social Studies 0.8663
67 3
End of Course Composite (High School)
-0.8432
203 13
- Algebra 1 -0.3614
49 5
- Algebra 2 -3.3731
44 4

Evaluating the TN Higher Education Commission's Report Card 25
Table 6 cont. Sample tables with additional column to include standard deviation of T values - Biology -0.7450
15 5
- English 1 1.3512
16 2
- English 2 0.7309
2 1
- English 3
0 0
- US History
0 0 Source: Tennessee Higher Education Commission (THEC; 2012a).
Table 7 Sample tables with additional column to include standard deviation of T values
Veteran Teachers Comparison to Traditionally and Alternatively Licensed New Teachers
Subject Mean of T Values
Standard Deviation of
T values (Missing in the report)
Teachers in Program
Total Program Statewide
TCAP Composite (grades 4-8) -0.5697
2091 37
- Math 0.0065
1086 33
- Reading/Language -0.1244
1195 35
- Science 0.0458
972 31
- Social Studies -0.0741
924 32
EOC Composite (High School) -0.6050
764 33
- Algebra 1 -0.6675
154 14
- Algebra 2 -2.3249
92 12
- Biology 0.7216
80 11
- English 1 -0.0488
115 12
- English 2 -0.4230
69 8
- English 3 -0.5692
56 7
- US History 0.2143
34 4 Source: Tennessee Higher Education Commission (THEC; 2012a).
Tables 8 to 10 demonstrate other relevant discrepancies involving mean T-values, as shown below.
Discrepancies in mean T-values when averaged across programs. For each test
the mean T-value of teacher effect for TPPs in Tennessee should match the means of the corresponding program mean T-values when averaged across programs for the corresponding tests. Tables 8-10 identify the discrepancies found in the report (mean T-values and unweighted columns). Within rounding error this is true for the veteran teacher comparison to traditionally and alternatively licensed new teachers (Table 10). However, for the veteran teacher comparison to traditionally licensed new teacher it is not true for the subject specific TCAP tests (Table 8).

Education Policy Analysis Archives Vol. 26 No. 33 SPECIAL ISSUE 26
Weighted versus unweighted mean T-values. These tables (Tables 8-10) also
show the mean of all program mean T-values when weighted by the number of new teachers in their respective program. Some weighted means are essentially the same as the mean T-value of teacher effect for TPPs in the report card, while others differ by a sufficiently large amount that classifications of “statistically significant negative difference” or “statistically significant positive difference” are likely to have changed. Three of the differences exceed 0.40. If weighted means had been used, it is likely to change some mean T-values presently coded “statistically significant negative difference” or “statistically significant positive difference” to “not statistically significant.”
Variation in program mean T-values from one test to another. The between program unweighted standard deviations vary considerably from one tested subject area to another. For example, in the comparison of Veteran Teachers to Alternatively Licensed Teachers on grade 4-8 Math the standard deviation of means is 1.251 while for grades 4-8 Reading/Language the standard deviation of means is -0.12 (Table 9). Some guidance should be given to assist in interpretation of the varying degree of variability in program means from one test to another. If these standard deviations are used to decide which program mean T-values should be statistically significant positive difference, statistically significant negative difference or no statistically significant difference, then the standard deviations should be reported, not left for a reader to calculate. Table 8 Comparison of Mean T-Values in tables on pages 10-11 with the means calculated from the report card
Veteran Teacher Comparison to Traditionally Licensed New Teachers
Subject Mean of T Values
Unweighted* Weighted*
TCAP Composite (grades 4-8) -0.7599 -0.747 -0.920
- Math -0.1591 -0.123 -0.402
- Reading/Language -0.1454 -0.092 -0.154
- Science -0.0781 -0.090 -0.277
- Social Studies -0.1979 -0.202 -0.331
EOC Composite (High School) -0.5863 -0.586 -0.496
- Algebra 1 -0.8495 -0.856 -0.788
- Algebra 2 -2.1250 -2.125 -1.881
- Biology 0.7144 0.714 0.802
- English 1 -0.2219 -0.222 -0.170
- English 2 -0.6576 -0.658 -0.506
- English 3 0.2535 0.254 0.206
- US History 0.1830 0.183 0.420
Source: Tennessee Higher Education Commission (THEC; 2012a).

Evaluating the TN Higher Education Commission's Report Card 27
Table 9 Comparison of Mean T-Values in tables on pages 10-11 with the means calculated from the report card
Veteran Teacher Comparison to Alternatively Licensed New Teachers
Subject Mean of T Values
Unweighted* Weighted*
TCAP Composite (grades 4-8) 0.1155 -0.075 0.632
- Math 1.2506 0.835 0.812
- Reading/Language -0.1200 -0.358 -0.177
- Science 0.5745 0.488 0.874
- Social Studies 0.8663 0.573 1.337
EOC Composite (High School) -0.8432 -0.940 -1.003
- Algebra 1 -0.3614 -0.361 -0.555
- Algebra 2 -3.3731 -3.486 -3.523
- Biology -0.7045 -0.519 -0.385
- English 1 1.3512 1.351 1.351
- English 2 0.7309 0.731 0.731
- English 3
- US History
Source: Tennessee Higher Education Commission (THEC; 2012a).
Table 10 Comparison of Mean T-Values in tables on pages 10-11 with the means calculated from the report card
Veteran Teacher Comparison to Traditionally and Alternatively Licensed New Teachers
Subject Mean of T Values
Unweighted* Weighted*
TCAP Composite (grades 4-8) -0.5697 -0.570 -0.662
- Math 0.0065 0.006 -0.245
- Reading/Language -0.1244 -0.124 -0.153
- Science 0.0458 0.026 -0.075
- Social Studies -0.0741 -0.074 -0.179
EOC Composite (High School) -0.6050 -0.605 -0.667
- Algebra 1 -0.6675 -0.668 -0.700
- Algebra 2 -2.3249 -2.325 -0.213
- Biology 0.4216 0.422 0.518
- English 1 -0.0488 -0.049 -0.007
- English 2 -0.4230 -0.423 -0.393
- English 3 -0.5692 -0.242 -0.217
- US History 0.2143 0.214 0.255
Source: Tennessee Higher Education Commission (THEC; 2012a).

Education Policy Analysis Archives Vol. 26 No. 33 SPECIAL ISSUE 28
Usability
One major limitation of the report card is that it includes only those program completers who are teaching in the state's public schools; program completers who work in private schools or in out-of-state schools are currently excluded from the analyses (THEC, 2012a). It is currently impossible to know whether TPPs that produce beginning teachers in private schools or in out-of-state schools are statistically indistinguishable in terms of teacher effectiveness from their counterparts in the state's public schools.
While the report card treats each TPP as a single institution, the reality is much more complex. All TPPs in the state are included, whether they are public or private, degree-based or certification-only programs, and traditional undergraduate or alternate certification programs. TPPs vary in size from a few program graduates (N=1) to hundreds (N=466). Their guiding philosophies (i.e. religious) and types of districts/schools where graduates are placed all vary as well. Presently, Tennessee recognizes 41 colleges and universities with TPPs in the state, but only 13 are publicly-funded institutions with substantial numbers of program completers annually. There are 16 religious-affiliated TTPs out of 28 private TTPs in the state. Determining the “value-added” of TPPs is a challenge given the great amount of variation among them. It is reasonable to assume that, like affiliated religious K-12 schools that have a specific religious orientation or purpose, some small, religiously-oriented TPPs may have goals that reinforce their mission which do not emphasize teachers' contributions to student standardized test scores. Graduates of such TPPs might work completely in private religious schools.
The other related concern involves the problem of understanding the “black box” that can link the various program elements of TPPs to the value-added estimates of graduates who actually become teachers. We know even less about what goes on inside individual TPPs (the black box), the criteria for recruitment and selection of candidates, and the features of training itself. The report card provides no guidance on which features/characteristics of TPPs are most important in influencing value-added estimates. Ignoring this unacknowledged caveat in the report card is significant, given the argument that unprecedented improvements in the teacher workforce are likely to be achieved only through a better understanding of the impacts of the different features of teacher training.
In addition, TPPs allow for specialization in a large array of endorsement areas (i.e., early childhood education, physical education), at multiple grade levels, and in different tested and non-tested subject areas (i.e. special education, visual arts, music). Consequently, we do not know how much of the mean T-value estimates from programs within a TPP correspond with one another. Although not reflected in the report card, field experiences and student teaching are also similarly diverse between traditional and alternative TPPs. While this diversity of TPPs is important to a robust system of teacher training, it also makes an ‘apples-to-apples comparison’ difficult, if not impossible.
The estimates of mean T-values from various TPPs have turned out to be indicators of relative performance by separating the most effective and least effective program graduates from all other teachers in the state (i.e., veteran teachers). However, such an analysis would only apply to the most extreme cases, and would provide little feedback to the bulk of TPP graduates. That is, the mean T-values only compare the average effectiveness of recent licensure recipients from various TPPs at opposite ends of teacher effectiveness (Koedel & Betts, 2007, 2011), not direct information for teachers who are in the middle distribution of teacher effectiveness across TPPs. This begs the question of what teacher effect data would contribute over and above the subjective evaluation of principals who presumably tend to be good at gauging the very worst and best performing teachers (Harris & Sass, 2009; Jacob & Lefgren, 2008; Rockoff & Speroni, 2010).
Evaluating the TN Higher Education Commission's Report Card 29
Several other limitations may affect the report card and inform interpretation of the results.
The data used in the effectiveness study are available only for those program graduates with TCAP subject tests in grades three to eight, which represents only 35% of the 2009-10 graduates from TPPs statewide. There are missing value-added scores (teacher effect data) for the majority of charter schools in the state. As a result, many TPP graduates are omitted from the analysis because they teach untested subjects or grades or have left the regular public school system entirely. In other words, TPP graduates in some subjects are broadly excluded as well as grade levels outside the scope of tested coverage (i.e., kindergarten to second grade teachers). A related concern is that the report card also does not provide program specific data because the grouping of mean T-values does not allow separation by grade level of licensure (i.e. elementary grades K-6, middle grades 4-8, and secondary grades 7-12). In other words, a program’s mean T-values may manifest themselves in some contexts (i.e., elementary grades) but may not matter at all in other contexts (i.e., high schools). Tennessee has made important strides in developing richer measures of achievement but these are not yet at the stage where they could be accurately used for systematic analysis of teacher and TPP value-added estimates in non-tested grades and subjects.
Another unacknowledged caveat in the report card is that the raw data for value-added analyses are sensitive to the test, that is, mean T-values can change depending on what test is used. Hence, missing in the report card is the alignment of test to TPPs’ specific goals, orientations, and mission/philosophy (Evans & Lee, 2016).
The above usability concerns are related to the fear that value-added accountability will contribute to further narrowing of school curriculum to only what is tested (Baker et al., 2010; Boe, 2007). This is a complex issue of value judgment that is not easily resolved. Interestingly, the narrowing issue plays out somewhat uniquely for the evaluation of TPPs. How we define the outcomes of TPPs –including determining the value-added estimates of TPPs in training graduates in tested grades and subjects versus excluding TPPs’ contribution in non-tested grades and subjects – both legitimizes and undermines certain perspectives about the purposes of education in a democratic society, the nature of teaching and learning, and the role of TPPs in education reform (Paufler & Amrein-Beardsley, 2016).
Discussion and Conclusion
While Tennessee leads the nation in research and evaluation of TPPs, a number of important caveats to the TPP findings should be considered before concluding some TPPs are more effective than others in raising student achievement. Because of the proprietary nature of TVAAS data and estimation procedures, we can only speculate on why the empirical patterns we find occur, but understanding the methodological challenges and shortfalls of output evidence –value-added models– is critical for policymakers seeking to decide about expanding the sources of evidence used to develop inferences about TPP quality. Until the technical and practical concerns about value-added estimates are resolved by continuing research and the push for transparency in the TVAAS data is addressed, the production of the value-added reports for beginning teachers and TPPs in the state should be treated as correlational in nature, not causal.
This study explores the accuracy, consistency and validity, and usability issues in evaluating the findings that link TPPs to beginning teacher effectiveness based on teacher value-added measures. While the mean T-values of teacher effects have attractive statistical properties for the users of value-added modeling, the report card fails to consider the interpretation of these effects, along with the limits to the information that can be extracted from the report card —namely, potential impact of contextual factors and selection bias and threats to validity/reliability of value-

Education Policy Analysis Archives Vol. 26 No. 33 SPECIAL ISSUE 30
added estimates. This review is broadly consistent with other research that considers the sources of instability and inherent imprecision in the estimated teacher and TPP effects from standard value-added models (Ballou, 2005; Collins & Amrein-Beardsley, 2014; Goldhaber & Hansen, 2010; Schochet & Chang, 2010; Staiger & Rockoff, 2010). More important comparisons of estimated teacher effects across TPPs are also likely to be distorted by the presence of omitted factors that differ systematically across TPPs. In the absence of a randomized experimental design, it is econometrically challenging to disentangle the effects of program selection from training effects and other multiple sources of potential bias.
For example, beginning teachers participate in different types of induction, mentoring, and professional growth activities that may dilute and obscure real differences in the teaching effectiveness of licensure recipients from various TTPs (Ingersoll & Kralik, 2004). In addition, our review of the report card shows that the number of independent private TTPs exceed the number of public-run TTPs in the state and are more likely to employ selectivity in admissions and attract a different pool of applicants than their public sector counterparts. The existing literature on the types of TPPs from which teachers graduate, indicates that generally, teachers in private independent institutions come from more selective TPPs. Moreover, private TTPs in the state are predominantly religion-based7, and in any case are part of substantively different institutional systems. Because graduates are far less likely to enter public school teaching after obtaining their teaching license, there is scant information available about what impact their programs may have on their graduates' subsequent value-added estimates. The presence of such heterogeneity is a form of omitted variable bias that will therefore go unmeasured.
In the presence of such unobserved factors, advanced econometric methods such as TVAAS can result in false or misleading conclusions about effects of TPP attributes. The pressure placed on new teachers could dissuade potential teachers from the profession rather than attract them (Rothstein, 2009). In addition, TPPs may discourage efforts into the influence of harder-to-capture measures of student learning, such as the role of teachers in enhancing non-cognitive skills in the classroom (Hill, Kapitula, & Umland, 2011; Kane & Staiger, 2012; Lincove et al., 2013; Mihaly et al., 2013; Newton, Darling-Hammond, Haertel, & Thomas, 2010; Rothstein, 2009). A growing body of research indicates that state and district-wide assessments are impervious to the cultivation of ambitious instruction in classrooms, and consequently impede any teaching and learning that may actually exist (Grossman, Cohen, Ronfeldt, & Brown, 2014). If value-added estimates are based on a set of test scores that reflect a narrower set of educational goals than most TPPs have for their program graduates, and if the test does not cover the most important educational goals from TPPs in sufficient breadth or depth (i.e., aesthetic learning, civic development, creativity), then the value-added results will offer limited or even misleading information about the effectiveness of TPPs and their program graduates.
Comparing the teacher effectiveness of recent licensure recipients from various teacher TPPs to the effectiveness of other teachers in the state is replete with caveats and cautions. Moreover, it is certainly the case that some of the policy questions that merit investigation still remain unanswered. Development of additional data and analysis is needed to respond to the many unanswered questions and remove persisting doubts. Asking questions such as “How do we differentiate TPPs effect on achievement from other influences? What analytic/statistical procedures appear to be biased? What is the magnitude of the bias? How much of the difference between TPPs is driven by selection (who applies and gets accepted to TPPs) versus actual TPP effects (how well prospective teachers are trained in the program)? What is there about the selection and preparation of effective TPPs that makes them successful? or How can we replicate those conditions for the

Evaluating the TN Higher Education Commission's Report Card 31
least effective TPPs to drive program changes and improvement?” would require more empirical research.
The most notable finding in the report card is that it shows two cohorts of Teach for America (TFA) and two additional programs – the Memphis Teacher Residency and the University of Tennessee in Knoxville – produce better than average value-added estimates among TPP graduates. These programs combine an intensive, yearlong apprenticeship for teachers with slimmed-down coursework requirements. The implication of such a finding deserves further inquiry and research and points in the direction of lengthening the student-teaching experience and integrating school organizational features and practices into programs for aspiring teachers before they are licensed to teach. It is possible that the publication of value-added estimates for various TTPs may prompt traditional training programs to improve the way their prospective teachers are prepared for professional practice. While the issue about what kind of professional practice is most powerful remains unresolved, emerging evidence suggests that having aspiring teachers do clinical training/residency for longer periods and in more settings, similar to those in alternative programs, raises beginning teachers' effectiveness (Ronfeldt, Schwartz, & Jacob, 2014).
However, as previously indicated, various forms of selection bias outside of the control of TPPs can seriously hamper reliable estimates of the influence of different types of teacher education and training on teacher productivity in the classroom. The practicality and usability of VAMs for determining program effects also carries potential unintended consequences, as traditional TPPs may unmistakably move away from programmatic improvements in non-tested grades and subjects, and in favor of tested grades and subjects, under the extremely shaky assumption that the value added estimates are deemed valid for that purpose. Both traditional and alternative TPPs should be very cautious in basing judgments related to programmatic improvement in terms of value-added scores of their program graduates without fully considering the impact of such error-prone measures. If estimated TPP differences are unstable and error prone, then a TPP obtaining statistically significant positive results in value-added estimates may have more to do with estimation error than with average effectiveness, and attempts at programmatic improvement based on TPPs’ statistically significant positive results will be arbitrary and ineffective. It is certainly worth pursuing whether TPPs truly differ in their effects and yet remain uncertain about which individual TPPs are performing better or worse (Von Hippel et al., 2016). While the technical considerations for the use of VAMs to evaluate teachers and TPPs are far from settled, there is now an emerging consensus among measurement experts and scholars that cautions against interpreting the effectiveness of TPPs based on the aggregation of program graduates’ productivity as beginning teachers (AERA Council, 2015).
The advent of the Every Student Succeeds Act (ESSA) provides an opportunity to allow every part of the education system to move beyond test-based accountability, in favor of “multiple measures” or multimetric accountability (Ronfeldt & Campbell, 2016). This reduces the risk of becoming too focused on VAM estimates, at the expense of the broader picture of productivity performance to evaluate teachers’ and TPPs’ contribution to student learning outcomes. Most measurement scholars seem to concur, albeit through different arguments. In an extensive review of VAM for teacher evaluation, Rowan and Raudenbush (2016) conclude that, “…the down-weighting of objective performance measures under conditions of distortion and risk in performance evaluation has been seen by both organization theorists and agency theorists as a rational response to fuzzy performance measurement” (p. 1206). Such a statement echoes the prevailing sentiment permeating the research community in that VAMs should be used in conjunction with other appropriate indicators and not regarded as an all-sufficient evidence, which certainly it has not yet proved to be (AERA Council, 2015).

Education Policy Analysis Archives Vol. 26 No. 33 SPECIAL ISSUE 32
A more recent empirical study by Ronfeldt and Campbell (2016) also sheds some light on
the use of multiple measures to estimate TPP quality, claiming the potential generative system of “checks and balance” that may result in combining program graduates’ observational ratings and their value-added scores to make reliable estimates of TPP effectiveness. Results from the initial teacher matching experiment (a randomized control trial, also in Tennessee) conducted by Papay, Taylor, Tyler, and Laski (2016) suggests that formative feedback related to dimensions of classroom observation rubrics can have substantial impact on teacher effectiveness. A promising implication of this RCT-based study is the potential to evaluate TPPs based on their program completers’ performance data from classroom observations for formative, program improvement purposes.
Adopting and maintaining different forms of judgment-based, narrative feedback (i.e., classroom observation and student ratings), in conjunction with the VAM results, is a big step in the right direction, particularly as a basis for improving performance. On the other hand, more research is needed on the relationships between VAM scores and alternative evaluation metrics. The challenge is in the choice and number of metrics to include, and in the resulting difficulties of analyzing a broad range of indicators—a challenge that will need time and experimentation to move forward successfully.
References
Aaronson, D., Barrow, L., & Sander, W. (2007). Teachers and student achievement in the Chicago Public High Schools. Journal of Labor Economics, 25, 95-135. https://doi.org/10.1086/508733
American Educational Research Association Council, (2015, November). AERA statement on use of value-added models (VAM) for the evaluation of educators and educator preparation programs. Educational Researcher, 44(8), 448-452. https://doi.org/10.3102/0013189X15618385
Amrein-Beardsley, A. (2008). Methodological concerns about the education value-added assessment system. Educational Researcher, 37, 65-75. http://dx.doi.org/10.3102/0013189X08316420
Amrein-Beardsley, A., & Collins, C. (2012). The SAS Education Value-Added Assessment System (SAS® EVAAS®) in the Houston Independent School District (HISD): Intended and unintended consequences. Education Policy Analysis Archives, 20 (12). https://doi.org/10.14507/epaa.v20n12.2012
Amrein-Beardsley, A., Lawton, K., & Ronan, K. (2017). An elusive policy imperative: data and methodological challenges when using growth in student achievement to evaluate teacher education programs’ ‘Value-Added’. Teaching Education, 1-21. https://doi.org/10.1080/10476210.2017.1296828
Baker, E. L., Barton, P. E., Darling-Hammond, L., Haertel, E., Ladd, H. F., Linn, R. L., … Shepard, L. A. (2010). Problems with the use of student test scores to evaluate teachers. Washington, DC: Economic Policy Institute. Retrieved from http://www.epi.org/publications/entry/bp278
Ballou, D. (2005). Value-added assessment: Lessons from Tennessee. In R. Lissitz (Ed.), Value-added models. Education: Theory and application. (pp. 272-303). Maple Grove, MN: JAM Press.
Ballou, D., Sanders, W., & Wright, P. (2004). Controlling for student background in value-added assessment of teachers. Journal of Educational and Behavioral Statistics, 29(1), 37–65. https://doi.org/10.3102/10769986029001037
Boe, E. E., Shin, S., & Cook, L. H. (2007). Does teacher preparation matter for beginning teachers in either special or general education? Journal of Special Education, 41, 148-170. https://doi.org/10.1177/00224669070410030201

Evaluating the TN Higher Education Commission's Report Card 33
Boyd, D., Grossman, P., Lankford, H., Loeb, S., & Wyckoff, J. (2006). How changes in entry
requirements alter the teacher workforce and affect student achievement. Education Finance and Policy, 1(2), 176-216. https://doi.org/10.1162/edfp.2006.1.2.176 https://doi.org/10.1162/edfp.2006.1.2.176
Boyd, D., Grossman, P., Lankford, H., Loeb, S., & Wyckoff, J. (2009). Teacher preparation and student achievement. Educational Evaluation and Policy Analysis, 31(4), 416-440. https://doi.org/10.3102/0162373709353129
Chetty, R., Friedman, J. N., & Rockoff, J. E. (2014). Measuring the impacts of teachers I: Evaluating bias in teacher value-added estimates. The American Economic Review, 104(9), 2593-2632. https://doi.org/10.1257/aer.104.9.2593
Clotfelter, C. T., Ladd, H. F., & Vigdor, J. L. (2006). Teacher-student matching and the assessment of teacher effectiveness. Journal of Human Resources, 4, 778-820. https://doi.org/10.3368/jhr.XLI.4.778
Clotfelter, C. T., Ladd, H. F., & Vigdor, J. L. (2007a). How and why do teacher credentials matter for student achievement? Working Paper No. 2. Washington, DC: CALDER.
Cohen, M. (2012). Getting accountability and implementation right. Getting to 2104 (and beyond): The choices and challenges ahead. Washington, DC: Education Sector.
Collins, C. (2014). Houston, we have a problem: Teachers find no value in the SAS education value-added assessment system (EVAAS®). Education Policy Analysis Archives, 22(98). https://doi.org/10.14507/epaa.v22.1594
Collins, C., & Amrein-Beardsley, A. (2014). Putting growth and value-added models on the map: A national overview. Teachers College Record, 16(1).
Commercial Appeal. (2016, December). Evaluating teachers requires fairness. Retrieved from http://www.commercialappeal.com/story/opinion/editorials/2016/12/17/evaluating-teachers-requires-fairness/95526188/
Corcoran, S. P. (2010). Can teachers be evaluated by their students' test scores? Should they be? The use of value-added measures of teacher effectiveness in policy and practice. Providence, RI: Annenberg Institute for School Reform. Retrieved from http://www.annenberginstitute.org/products/Corcoran.php
Corcoran, S., & Goldhaber, D. (2013). Value added and its uses: Where you stand depends on where you sit. Education Finance and Policy, 8(3), 418-434. https://doi.org/10.1162/EDFP_a_00104
Crowe, E. (2010). Measuring what matters: A stronger model for teacher education accountability. Washington, DC: Center for American Progress. Retrieved from http://www.americanprogress.org/issues/2010/07/pdf/teacher_accountability.pdf Darling-Hammond, L., Amrein-Beardsley, A., Haertel, E., & Rothstein, J. (2012). Evaluating teacher
evaluation. The Phi Delta Kappan, 93(6), 8-15. https://doi.org/10.1177/003172171209300603
Darling-Hammond, L., Holtzman, D. J., Gatlin, S. J., & Heilig, J. V. (2005). Does teacher preparation matter? Evidence about teacher certification, Teach For America, and teacher effectiveness. Education Policy Analysis Archives, 13(42). https://doi.org/10.14507/epaa.v13n42.2005
Ehrenberg, R., & Brewer, D. J. (1994). Do school and teacher characteristics matter? Evidence from high school and beyond. Economics of Education Review, 13(1), 1–17. https://doi.org/10.1016/0272-7757(94)90019-1
Evans, C. M., & Lee, J. C. (2016). Value-added assessment of teacher preparation programs in the United States: A critical evaluation. Assessment in Education: Principles, Policy & Practice, 1-21. https://doi.org/10.1080/0969594X.2016.1255180

Education Policy Analysis Archives Vol. 26 No. 33 SPECIAL ISSUE 34
Every Student Succeeds Act. (Public Law No: 114-95). (2015). Retrieved from
https://www.congress.gov/bill/114th-congress/senate-bill/1177/text Floden, R. E. (2012). Teacher value added as a measure of program quality interpret with caution.
Journal of Teacher Education, 63(5), 356-360. https://doi.org/10.1177/0022487112454175
Fuller, E. J. (2014). Shaky methods, shaky motives: A critique of the National Council of Teacher Quality's review of teacher preparation programs. Journal of Teacher Education, 65(1), 63-77. https://doi.org/10.1177/0022487113503872
Gansle, K. A., Noell, G. H., & Burns, J. M. (2012). Do student achievement outcomes differ across teacher preparation programs? An analysis of teacher education in Louisiana. Journal of Teacher Education, 63(5), 304-317. https://doi.org/10.1177/0022487112439894
Gansle, K. A., Noell, G. H., Knox, R. M., & Schafer, M. J. (2010). Value added assessment of teacher preparation in Louisiana: 2005-2006 to 2008-2009. Baton Rouge, LA Louisiana State University. Retrieved from http://www.regents.la.gov/assets/docs/2013/09/2010VATechnical082610-Yr7.pdf
Goldhaber, D., & Hansen, M. (2010). Is it just a bad class? Assessing the stability of measured teacher performance. (Working Paper 2010-3). Seattle, WA: Center for Education Data and Research.
Grossman, P., Cohen, J., Ronfeldt, M., & Brown, L. (2014). The test matters. The relationship between classroom observation scores and teacher value added on multiple types of assessment. Educational Researcher. https://doi.org/10.3102/0013189X14544542
Guarino, C. M., Maxfield, M., Reckase, M. D., Thompson, P. N., & Wooldridge, J. M. (2015). An evaluation of empirical Baye's estimation of value-added teacher performance measures. Journal of Educational and Behavioral Statistics, 40, 190–222. https://doi.org/10.3102/1076998615574771
Guarino, C. M., Reckase, M. D., & Wooldridge, J. M. (2015). Can value-added measures of teacher performance be trusted? Education Finance and Policy, 10, 117–156. https://doi.org/10.1162/EDFP_a_00153
Harris, D. N., & Sass, T. R. (2009). What makes for a good teacher and who can tell? Working Paper 30. National Center for Analysis of Longitudinal Data in Education Research. Washington, DC: American Institutes for Research.
Harris, D., & Sass, T. R. (2011). Teacher training, teacher quality, and student achievement. Journal of Public Economics, 95, 798-812. https://doi.org/10.1016/j.jpubeco.2010.11.009
Henry, G. T., Kershaw, D. C., Zulli, R. A., & Smith, A. A. (2012). Incorporating teacher effectiveness into teacher preparation program evaluation. Journal of Teacher Education, 63(5), 335-355. https://doi.org/10.1177/0022487112454437
Hewitt, K. K. (2015). Educator evaluation policy that incorporates EVAAS value-added measures: Undermined intentions and exacerbated inequities. Education Policy Analysis Archives, 23(76). https://doi.org/10.14507/epaa.v23.1968
Hill, H. C., Kapitula, L., & Umland, K. (2011). A validity argument approach to evaluating teacher value-added scores. American Educational Research Journal, 48(3), 794-831. https://doi.org/10.3102/0002831210387916
Humphrey, D. C., Wechsler, M. E., & Hough, H. J. (2008). Characteristics of effective alternative teacher certification programs. Teachers College Record, 110(4). Teachers College, Columbia University.
Ingersoll, R., & Kralik, J. (2004). The impact of mentoring on teacher retention: What the research says. Denver, CO: Education Commission of the States.

Evaluating the TN Higher Education Commission's Report Card 35
Ingersoll, R., Merrill, L., & May, H. (2014). What are the effects of teacher education and preparation on
beginning teacher attrition? Research Report (#RR-82). Philadelphia: Consortium for Policy Research in Education, University of Pennsylvania.
Jacob, B. A., & Lefgren, L. (2008). Can principals identify effective teachers? Evidence on subjective performance evaluation in education. Journal of Labor Economics, 26, 101-136. https://doi.org/10.1086/522974
Kane, T. J., Rockoff, J. E., & Staiger, D. O. (2008). What does certification tell us about teacher effectiveness? Evidence from New York City. Economics of Education review, 27(6), 615-631. https://doi.org/10.1016/j.econedurev.2007.05.005
Kane, T. J., & Staiger, D. O. (2008). Estimating teacher impacts on student achievement: An experimental evaluation. Cambridge, MA: National Bureau of Economic Research (NBER).
Koedel, C., & Betts, J. R. (2007). Re-examining the role of teacher quality in the educational production function. Columbia, MO: Department of Economics, University of Missouri.
Koedel, C., Mihaly, K., & Rockoff, J. E. (2015a). Value-added modeling: A review. Economics of Education Review, 47, 180-195. https://doi.org/10.1016/j.econedurev.2015.01.006
Koedel, C., Parsons, E., Podgursky, M., & Ehlert, M. (2015b). Teacher preparation programs and teacher quality: Are there real differences across programs? Education Finance and Policy, 10(4), 508-534. https://doi.org/10.1162/EDFP_a_00172
Koedel, C., & Betts, J. R. (2011). Does student sorting invalidate value-added models of teacher effectiveness? An extended analysis of the Rothstein critique. Education Finance and Policy, 6(1), 18-42. https://doi.org/10.1162/EDFP_a_00027
Koedel, C., Ehlert, M. & Podgursky, M., & Parsons, E. (2012). Teacher preparation programs and teacher quality: Are there real differences across programs? (Working Paper 1204). Columbia, MO: Department of Economics, University of Missouri.
Kumashiro, K. (2015). Review of proposed 2015 federal teacher preparation regulations. Retrieved from http://nepc.colorado.edu/thinktank/review-proposed-teacherpreparation
Kupermintz, H. (2003). Teacher effects and teacher effectiveness: A validity investigation of the Tennessee Value Added Assessment System (TVAAS). Educational Evaluation and Policy Analysis, 23, 287-298. https://doi.org/10.3102/01623737025003287
Lincove, J. A., Osborne, C., Dillon, A., & Mills, N. (2014). The politics and statistics of value-added modeling for accountability of teacher preparation programs. Journal of Teacher Education, 65(1), 24-38. https://doi.org/10.1177/0022487113504108
Lohr, S. (2015). Red beads and profound knowledge: Deming and quality of education. Education Policy Analysis Archives, 23(80). https://doi.org/10.14507/epaa.v23.1972
Lockwood, J. R., McCaffrey, D. F., Hamilton, L. S., Stetcher, B., Le, V-N., & Martinez, J. F. (2007). The sensitivity of value-added teacher effect estimates to different mathematics achievement measures. Journal of Educational Measurement, 44(1), 47–67. https://doi.org/10.1111/j.1745-3984.2007.00026.x
McCaffrey, D. F., Lockwood, J. R., Koretz, D. M., & Hamilton, L. S. (2003). Evaluating value-added models for teacher accountability. Santa Monica, CA: RAND Corporation.
McCaffrey, D. F., Sass, T. R., Lockwood, J. R., & Mihaly, K. (2009). The intertemporal variability of teacher effect estimates. Education Finance and Policy, 4(4), 572-606. https://doi.org/10.1162/edfp.2009.4.4.572
Memphis Teacher Residency (MTR). (2014). Program impact summary. Retrieved from https://memphistr.org/wp-content/uploads/2014/07/NCTR-summary-of-MTR-2014-15-evaluations.pdf

Education Policy Analysis Archives Vol. 26 No. 33 SPECIAL ISSUE 36
Mihaly, K., McCaffrey, D. F., Lockwood, J. R., & Sass, T. R. (2010). Centering and reference groups
for estimates of fixed effects: Modifications to felsdvreg. The Stata Journal, 3(1), 82–103. Mihaly, K., McCaffrey, D., Sass, T. R., & Lockwood, J. R. (2013). Where you come from or where
you go? Distinguishing between school quality and the effectiveness of teacher preparation program graduates. Education, 8(4), 459-493. https://doi.org/10.1162/EDFP_a_00110
Miller, K. (2016a). What makes educator preparation effective? SAS Blogs. Retrieved from http://blogs.sas.com/content/statelocalgov/2016/12/20/what-makes-educator-prep-effective/
Miller, K. (2016b). Accountability and teacher preparation: How states have led the way SAS Blogs. Retrieved from http://blogs.sas.com/content/statelocalgov/2016/11/22/accountability-teacher-preparation/
Newton, X. A., Darling-Hammond, L., Haertel, E., & Thomas, E. (2010). Value-added modeling of teacher effectiveness: An exploration of stability across models and contexts. Education Policy Analysis Archives, 18(23). https://doi.org/10.14507/epaa.v18n23.2010
Noell, G. H., Gansle, K. A., Patt, R. M., & Schafer, M. J. (2009). Value-added assessment of teacher preparation in Louisiana: 2005-2006 to 2007-2008. Baton Rouge, LA: Louisiana State University, Department of Psychology.
Noell, G. H., Porter, B. A., Patt, R. M., & Dahir, A. (2008). Value added assessment of teacher preparation in Louisiana: 2004-2005 to 2006-2007. Baton Rouge, LA: Louisiana State University, Department of Psychology. Retrieved from http://www.regents.state.la.us/Academic/TE/2008/Final%20ValueAdded%20Report%20(12.02.08).pdf
Pullin, D. (2013). Legal issues in the use of student test scores and value-added models (VAM) to determine educational quality. Education Policy Analysis Archives, 21(6). https://doi.org/10.14507/epaa.v21n6.2013
Offices of Research and Education Accountability (OREA). (2013). Tennessee Value-Added assessment system: A brief overview. Nashville, TN: Author. Retrieved from http://www.comptroller.tn.gov/Repository/RE/Tennessee%20VAAS%202013.pdf
Otterman, S. (2010). Hurdles emerge in rising effort to rate teachers. New York Times. Retrieved from http://www.nytimes.com/2010/12/27/nyregion/27teachers.html
Papay, J. P. (2011). Different tests, different answers: The stability of teacher value-added estimates across outcome measures. American Educational Research Journal, 48(1), 163-193. https://doi.org/10.3102/0002831210362589
Papay, J. P., Taylor, E. S., Tyler, J. H., & Laski, M. (2016). Learning job skills from colleagues at work: Evidence from a field experiment using teacher performance data. (No. w21986). National Bureau of Economic Research. Retrieved from http://www.nber.org/papers/w21986
Paufler, N. A., & Amrein-Beardsley, A. (2016). Preparing teachers for educational renewal within current contexts of accountability reflecting upon John Goodlad's twenty postulates. Journal of Teacher Education, 67(4), 251-262. https://doi.org/10.1177/0022487116660154
Plecki, M. L., Elfers, A. M., & Nakamura, Y. (2012). Using evidence for teacher education program improvement and accountability: An illustrative case of the role of value-added measures. Journal of Teacher Education, 63(5), 318-334. https://doi.org/10.1177/0022487112447110
Rivkin, S. G., Hanushek, E. A., & Kain, J. F. (2005). Teachers, schools, and academic achievement. Econometrica, 73(2), 417-458. https://doi.org/10.1111/j.1468-0262.2005.00584.x
Rockoff, J. E. (2004). The impact of individual teachers on student achievement: Evidence from panel data. The American Economic Review, 94(2), 247-252. https://doi.org/10.1257/0002828041302244

Evaluating the TN Higher Education Commission's Report Card 37
Rockoff, J. E., & Speroni, C. (2010). Subjective and objective evaluations of teacher effectiveness.
The American Economic Review, 100(2), 261-266. https://doi.org/10.1257/aer.100.2.261 Ronfeldt, M., & Campbell, S. L. (2016). Evaluating teacher preparation using graduates'
observational ratings. Educational Evaluation and Policy Analysis, 38(4), 603-625. https://doi.org/10.3102/0162373716649690
Rothstein, J. (2007). Do value-added models add value? Tracking, fixed effects, and causal Inference. (CEPS Working Paper No. 159). Princeton, NJ: Princeton University and National Bureau for Economic Research (NBER). Retrieved from http://www.princeton.edu/ceps/workingpapers/159rothstein.pdf
Rothstein, J. (2009). Student sorting and bias in value-added estimation: Selection on observables and unobservables. Education Finance and Policy, 4(3), 537–571. https://doi.org/10.1162/edfp.2009.4.4.537
Rothstein, J. (2010). Teacher quality in educational production: Tracking, decay, and student achievement. Quarterly Journal of Economics, 125(1), 175–214. https://doi.org/10.1162/qjec.2010.125.1.175
Rowan, B., & Raudenbush, S.W. (2016) Teacher evaluation in American schools. In D.H. Gitomer & C.A. Bell (Eds.), Handbook of research on teaching (5th ed., pp. 1159-1216). Washington, DC: American Education Research Association. https://doi.org/10.3102/978-0-935302-48-6_19
Sanders, W. L. (2000). Value-added assessment from student achievement data: Opportunities and hurdles. Journal of Personnel Evaluation in Education, 14(4), 329-339. https://doi.org/10.1023/A:1013008006096
Sanders, W. L., & Horn, S. P. (1994). The Tennessee value-added assessment system (TVAAS): Mixed-model methodology in educational assessment. Journal of Personnel Evaluation in Education, 8(3), 299–311. https://doi.org/10.1007/BF00973726
Sanders, W. L., & Horn, S. P. (1998). Research findings from the Tennessee value-added assessment system (TVAAS) database: Implications for educational evaluation and research. Journal of Personnel Evaluation in Education, 12(3), 247-256. https://doi.org/10.1023/A:1008067210518
Sanders, W. L., Saxton, A. M., & Horn, S.P. (1997). The Tennessee value-added assessment system: A quantitative, outcomes-based approach to educational assessment. In J. Millman (Ed.), Grading teachers, grading schools: Is student achievement a valid evaluation measure? (pp. 137-162). Thousand Oaks, CA: Corwin.
Sanders, W. L., & Wright, S. P. (2008). A response to Amrein-Beardsley (2008): Methodological concerns about the Education Value-Added Assessment System. Retrieved from www.sas.com/govedu/edu/services/Sanders_Wright_response_to_Amrein- Beardsley_4_14_2008.pdf
Schochet, P. Z., & Chiang, H. S. (2010). Error rates in measuring teacher and school performance based on student test score gains. (NCEE 2010-4004). Washington, DC: National Center for Education Evaluation and Regional Assistance, Institute of Education Sciences, U.S. Department of Education.
Sparks, S. D. (2011). Value-added formulas strain collaboration. Bethesda, MD: Education Week. Retrieved from http://edweek.org/ew/articles/2011/11/16/12collabchanges.h21.html?tkn=OVMFb8PQXxQi4wN6vpelNIr7+NhOFCbi71mI&intc=es
Staiger, D., & Rockoff, J. (2010). Searching for effective teachers with imperfect information. Journal of Economic Perspectives, 24(3), 97-118. https://doi.org/10.1257/jep.24.3.97

Education Policy Analysis Archives Vol. 26 No. 33 SPECIAL ISSUE 38
State Collaborative on Reforming Education (SCORE). (2016a). SCORE Releases
Recommendations for Teacher Preparation Improvement. Retrieved from http://tnscore.org/score-releases-recommendations-for-teacher-preparation-improvement/
State Collaborative on Reforming Education (SCORE). (2016b). SCORE Releases Recommendations for Teacher Preparation Improvement. Retrieved from http://tnscore.org/federal-educator-preparation-regulations-and-recommendations-for-tennessee/
Summers, A. A., & Wolfe, B. L. (1977). Do schools make a difference? The American Economic Review, 67(4), 639-652.
Tatter, G. (2016a). Here’s where Tennessee’s best teachers are trained, according to new state report card. Retrieved from http://www.chalkbeat.org/posts/tn/2016/12/15/heres-where-tennessees-best-teachers-are-trained-according-to-new-state-report-card/
Tatter, G. (2016b). Relay Graduate School launches alternative teacher training programs in Nashville. Retrieved from http://www.chalkbeat.org/posts/tn/2016/04/27/relay-graduate-school-launches-alternative-teacher-training-programs-in-nashville/
Tennessee Education Association (TEA). (2015). TEA challenges constitutionality of TVAAS in evaluations. Nashville, TN: Author. Retrieved from http://www.teateachers.org/news/tea-challenges-constitutionality-tvaas-evaluations
Tennessee Higher Education Commission (THEC). (2012a). 2012 Tennessee report card on the effectiveness of teacher training programs. Nashville, TN: Author. Retrieved from http://www.state.tn.us/thec/Divisions/fttt/12report_card/PDF%202012%20Reports/202 %20Report%20Card%20on%20the%20Effectiveness%20of%20Teacher%20Training%2 0Programs.pdf Tennessee Higher Education Commission (THEC). (2012b). Technical report for the effectiveness
study, 2011 - 2012. Commissioned for the Tennessee teacher quality reforms. Nashville, TN: Author. Retrieved from http://www.tn.gov/thec/Divisions/fttt/12report_card/Technical%20Report%202012.pdf
Tennessee Higher Education Commission (THEC). (2012c). Report card on the effectiveness of teacher training programs: Guidelines and data dictionary 2013. Nashville, TN: Author.
Tennessee State Board of Education (TSBE). (2016a). 2016 teacher preparation report card. Technical report. Nashville, TN: Author. Retrieved from https://www.tn.gov/assets/entities/sbe/attachments/2016_Teacher_Prep_Report_Card_Technical_Report.pdf
Tennessee State Board of Education (TSBE). (2016b). State Board launches newly designed teacher preparation report card. Nashville, TN: Author. Retrieved from https://www.tn.gov/sbe/news/47739
Tennessee State Board of Education (TSBE). (2016c). 2016 redesign. Nashville, TN: Author. Retrieved from https://www.tn.gov/sbe/article/2016-Redesign
U.S. Department of Education (USDOE). (2010a). Race to the Top Fund: States’ applications, scores and comments for Phase 1. Washington, DC: Author. Retrieved from http://www2.ed.gov/programs/racetothetop/phase1-applications/index.html
U.S. Department of Education (USDOE). (2010b). Race to the Top Fund: Tennessee application for Phase 1. Washington, DC: Author. Retrieved from http://www2.ed.gov/programs/racetothetop/phase1-applications/tennessee.pdf
U.S. Department of Education. (USDOE). (2011). Our future, our teachers: The Obama administration’s plan for teacher education reform and improvement. Washington, DC: Author. Retrieved from http://www.ed.gov/sites/default/files/our-future-our-teachers.pdf

Evaluating the TN Higher Education Commission's Report Card 39
U.S. Department of Education. (USDOE). (2011). Our future, our teachers: The Obama
administration’s plan for teacher education reform and improvement. Washington, DC: Author. Retrieved from http://www.ed.gov/sites/default/files/our-future-our-teachers.pdf
U.S. Department of Education. (USDOE). (2014). Tennessee improves teacher preparation programs through report cards. Washington, DC: Author. Retrieved from https://sites.ed.gov/progress/2014/03/tennessee-improves-teacher-preparation-programs-through-report-cards/
U.S. Department of Education. (USDOE). (2016). Teacher preparation program reporting system. Washington, DC: Author. Retrieved from https://www2.ed.gov/documents/teacherprep/teacher-prep-reporting-guidance.pdf
Von Hippel, P. T., Bellows, L., Osborne, C., Lincove, J. A., & Mills, N. (2016). Teacher quality differences between teacher preparation programs: How big? How reliable? Which programs are different?. Economics of Education Review, 53, 31-45. https://doi.org/10.1016/j.econedurev.2016.05.002
Wenglinsky, H. (2002). The link between teacher classroom practices and student academic performance. Education Policy Analysis Archives, 10(12). https://doi.org/10.14507/epaa.v10n12.2002
Wright, S. P., Horn, S. P., & Sanders, W. L. (1997). Teacher and classroom context effects on student achievement: Implications for teacher evaluation. Journal of Personal Evaluation in Education, 11, 57-67. https://doi.org/10.1023/A:1007999204543
Xu, Z., Hannaway, J., & Taylor, C. (2011). Making a difference: The effects of Teach for America in high school. Journal of Policy Analysis and Management, 30(3), 447-469. https://doi.org/10.1002/pam.20585
Zeichner, K., & Pena-Sandoval, C. (2015). Venture philanthropy and teacher education policy in the US: The role of the New Schools Venture Fund. Teachers College Record, 117(6), 1-44.
Zelinski, A. (2016). Study: Alternative teacher training programs more successful than traditional ones. The City Paper. Retrieved from http://nashvillecitypaper.com/content/city-news/study-alternative-teacher-training-programs-more-successful-traditional-ones

Education Policy Analysis Archives Vol. 26 No. 33 SPECIAL ISSUE 40
Acknowledgement
Special thanks to Elena Aydarova, David Berliner and the EPAA blind reviewers for their detailed feedback and helpful comments on previous versions of this manuscript. The author would like to thank Dr. Ernie Rakow for his assistance in the analysis of the report card and the preparation of tables for publication. I also thank the late Dr. Ted Meyers who gave the article careful scrutiny and provided useful feedback prior to publication. I benefited from their contribution and take responsibility for any shortcomings that remain.
About the Author
Charisse Gulosino University of Memphis [email protected] Charisse Gulosino received her doctorate in education from Columbia University and is currently an Assistant Professor in the Leadership and Policy Studies Program at the University of Memphis. Prior to her current position, Charisse was a Postdoctoral Research Associate and a faculty member of the Alfred Taubman Center for Public Policy and American Institutions at Brown University. She also previously served as a Visiting Scholar in the Department of Education Policy and Social Analysis (EPSA) at Teachers College, Columbia University. Her area of interest is in policies affecting students, their families, teachers, and communities in urban K-12 settings.
About the Guest Editors Elena Aydarova Auburn University [email protected] Website: https://elenaaydarova.com Elena Aydarova is Assistant Professor of Social Foundations at the Department of Educational Foundations, Leadership, and Technology at Auburn University. Her interdisciplinary research examines the interactions between global social change and the work of teachers, teaching, and teacher education through the lens of equity and social justice. Her projects have explored teacher education reforms in Russia and the US, internationalization of education, teacher retention, as well as privatization of teacher preparation. She has recently completed a book manuscript “Teacher Education Reforms as Political Theater: Policy Dramas in Neoliberal Contexts.” Throughout her career, Dr. Aydarova has taught in the United States, Ukraine, China, and the United Arab Emirates. David C. Berliner Arizona State University [email protected] David C. Berliner is Regents’ Professor Emeritus of Education at Arizona State University. Dr. Berliner is a member of the National Academy of Education (NEA), the International

Evaluating the TN Higher Education Commission's Report Card 41
Education Academy (IEA), a Fellow of the Center for Advanced Study in the Behavioral Sciences, and a past president of both the American Educational Research Association (AERA) and the Division of Educational Psychology of the American Psychological Association (APA). He is the recipient of awards for distinguished contributions from APA, AERA, and the National Education Association (NEA). Dr. Berliner is co-author (with B. J. Biddle) of the best seller The Manufactured Crisis, co-author (with Ursula Casanova) of Putting Research to Work, co-author (with Gene Glass) of 50 Myths and Lies that Threaten America's Public Schools, and co-author (with N. L. Gage) of six editions of the textbook Educational Psychology. He is co-editor of the first Handbook of Educational Psychology and the books Talks to Teachers, and Perspectives on Instructional Time. Professor Berliner has also authored more than 200 published articles, technical reports, and book chapters. He has taught at the University of Arizona, University of Massachusetts, Teachers College and Stanford University, as well as univers ities in Australia, Canada, The Netherlands, Spain, and Switzerland.
Education Policy Analysis Archives Vol. 26 No. 33 SPECIAL ISSUE 42
SPECIAL ISSUE
Navigating the Contested Terrain of Teacher Education Policy and Practice
education policy analysis archives Volume 26 Number 33 March 12, 2018 ISSN 1068-2341
Readers are free to copy, display, and distribute this article, as long as the work is attributed to the author(s) and Education Policy Analysis Archives, it is distributed for non-commercial purposes only, and no alteration or transformation is made in the work. More details of this Creative Commons license are available at http://creativecommons.org/licenses/by-nc-sa/3.0/. All other uses must be approved by the author(s) or EPAA. EPAA is published by the Mary Lou Fulton Institute and Graduate School of Education at Arizona State University Articles are indexed in CIRC (Clasificación Integrada de Revistas Científicas, Spain), DIALNET (Spain), Directory of Open Access Journals, EBSCO Education Research Complete, ERIC, Education Full Text (H.W. Wilson), QUALIS A1 (Brazil), SCImago Journal Rank; SCOPUS, SOCOLAR (China).
Please send errata notes to Audrey Amrein-Beardsley at [email protected]
Join EPAA’s Facebook community at https://www.facebook.com/EPAAAAPE and Twitter feed @epaa_aape.

Evaluating the TN Higher Education Commission's Report Card 43
education policy analysis archives
editorial board
Lead Editor: Audrey Amrein-Beardsley (Arizona State University) Editor Consultor: Gustavo E. Fischman (Arizona State University)
Associate Editors: David Carlson, Lauren Harris, Eugene Judson, Mirka Koro-Ljungberg, Scott Marley, Iveta Silova, Maria Teresa Tatto (Arizona State University)
Cristina Alfaro San Diego State University
Gene V Glass Arizona State University
Susan L. Robertson Bristol University, UK
Gary Anderson New York University
Ronald Glass University of California, Santa Cruz
Gloria M. Rodriguez University of California, Davis
Michael W. Apple University of Wisconsin, Madison
Jacob P. K. Gross University of Louisville
R. Anthony Rolle University of Houston
Jeff Bale OISE, University of Toronto, Canada
Eric M. Haas WestEd A. G. Rud Washington State University
Aaron Bevanot SUNY Albany Julian Vasquez Heilig California State University, Sacramento
Patricia Sánchez University of University of Texas, San Antonio
David C. Berliner Arizona State University
Kimberly Kappler Hewitt University of North Carolina Greensboro
Janelle Scott University of California, Berkeley
Henry Braun Boston College Aimee Howley Ohio University Jack Schneider College of the Holy Cross
Casey Cobb University of Connecticut
Steve Klees University of Maryland Noah Sobe Loyola University
Arnold Danzig San Jose State University
Jaekyung Lee SUNY Buffalo
Nelly P. Stromquist University of Maryland
Linda Darling-Hammond Stanford University
Jessica Nina Lester Indiana University
Benjamin Superfine University of Illinois, Chicago
Elizabeth H. DeBray University of Georgia
Amanda E. Lewis University of Illinois, Chicago
Adai Tefera Virginia Commonwealth University
Chad d'Entremont Rennie Center for Education Research & Policy
Chad R. Lochmiller Indiana University
Tina Trujillo University of California, Berkeley
John Diamond University of Wisconsin, Madison
Christopher Lubienski Indiana University
Federico R. Waitoller University of Illinois, Chicago
Matthew Di Carlo Albert Shanker Institute
Sarah Lubienski Indiana University
Larisa Warhol University of Connecticut
Sherman Dorn Arizona State University
William J. Mathis University of Colorado, Boulder
John Weathers University of Colorado, Colorado Springs
Michael J. Dumas University of California, Berkeley
Michele S. Moses University of Colorado, Boulder
Kevin Welner University of Colorado, Boulder
Kathy Escamilla University of Colorado, Boulder
Julianne Moss Deakin University, Australia
Terrence G. Wiley Center for Applied Linguistics
Melissa Lynn Freeman Adams State College
Sharon Nichols University of Texas, San Antonio
John Willinsky Stanford University
Rachael Gabriel University of Connecticut
Eric Parsons University of Missouri-Columbia
Jennifer R. Wolgemuth University of South Florida
Amy Garrett Dikkers University of North Carolina, Wilmington
Amanda U. Potterton University of Kentucky
Kyo Yamashiro Claremont Graduate
University

Education Policy Analysis Archives Vol. 26 No. 33 SPECIAL ISSUE 44
archivos analíticos de políticas educativas consejo editorial
Editor Consultor: Gustavo E. Fischman (Arizona State University) Editores Asociados: Armando Alcántara Santuario (Universidad Nacional Autónoma de México), Jason Beech
(Universidad de San Andrés), Ezequiel Gomez Caride (Pontificia Universidad Católica Argentina), Antonio Luzon (Universidad de Granada), Angelica Buendia (Metropolitan Autonomous University), José Luis Ramírez
(Universidad de Sonora)
Claudio Almonacid Universidad Metropolitana de Ciencias de la Educación, Chile
Inés Dussel, DIE-CINVESTAV, México
Miriam Rodríguez Vargas Universidad Autónoma de Tamaulipas, México
Miguel Ángel Arias Ortega Universidad Autónoma de la Ciudad de México
Juan Carlos González Faraco Universidad de Huelva, España
José Gregorio Rodríguez Universidad Nacional de Colombia, Colombia
Xavier Besalú Costa Universitat de Girona, España
María Clemente Linuesa Universidad de Salamanca, España
Mario Rueda Beltrán Instituto de Investigaciones sobre la Universidad y la Educación, UNAM, México
Xavier Bonal Sarro Universidad Autónoma de Barcelona, España
Jaume Martínez Bonafé Universitat de València, España
José Luis San Fabián Maroto Universidad de Oviedo, España
Antonio Bolívar Boitia Universidad de Granada, España
Alejandro Márquez Jiménez Instituto de Investigaciones sobre la Universidad y la Educación, UNAM, México
Jurjo Torres Santomé, Universidad de la Coruña, España
José Joaquín Brunner Universidad Diego Portales, Chile
María Guadalupe Olivier Tellez, Universidad Pedagógica Nacional, México
Yengny Marisol Silva Laya Universidad Iberoamericana, México
Damián Canales Sánchez Instituto Nacional para la Evaluación de la Educación, México
Miguel Pereyra Universidad de Granada, España
Ernesto Treviño Ronzón Universidad Veracruzana, México
Gabriela de la Cruz Flores Universidad Nacional Autónoma de México
Mónica Pini Universidad Nacional de San Martín, Argentina
Ernesto Treviño Villarreal Universidad Diego Portales Santiago, Chile
Marco Antonio Delgado Fuentes Universidad Iberoamericana, México
Omar Orlando Pulido Chaves Instituto para la Investigación Educativa y el Desarrollo Pedagógico (IDEP)
Antoni Verger Planells Universidad Autónoma de Barcelona, España
Paula Razquin Universidad de San Andrés, Argentina

Evaluating the TN Higher Education Commission's Report Card 45
arquivos analíticos de políticas educativas conselho editorial
Editor Consultor: Gustavo E. Fischman (Arizona State University) Editoras Associadas: Kaizo Iwakami Beltrao, (Brazilian School of Public and Private Management - EBAPE/FGV,
Brazil), Geovana Mendonça Lunardi Mendes (Universidade do Estado de Santa Catarina), Gilberto José Miranda, (Universidade Federal de Uberlândia, Brazil), Marcia Pletsch, Sandra Regina Sales (Universidade Federal Rural do
Rio de Janeiro)
Almerindo Afonso
Universidade do Minho
Portugal
Alexandre Fernandez Vaz
Universidade Federal de Santa
Catarina, Brasil
José Augusto Pacheco
Universidade do Minho, Portugal
Rosanna Maria Barros Sá
Universidade do Algarve
Portugal
Regina Célia Linhares Hostins
Universidade do Vale do Itajaí,
Brasil
Jane Paiva
Universidade do Estado do Rio de
Janeiro, Brasil
Maria Helena Bonilla
Universidade Federal da Bahia
Brasil
Alfredo Macedo Gomes
Universidade Federal de Pernambuco
Brasil
Paulo Alberto Santos Vieira
Universidade do Estado de Mato
Grosso, Brasil
Rosa Maria Bueno Fischer
Universidade Federal do Rio Grande
do Sul, Brasil
Jefferson Mainardes
Universidade Estadual de Ponta
Grossa, Brasil
Fabiany de Cássia Tavares Silva
Universidade Federal do Mato
Grosso do Sul, Brasil
Alice Casimiro Lopes
Universidade do Estado do Rio de
Janeiro, Brasil
Jader Janer Moreira Lopes
Universidade Federal Fluminense e
Universidade Federal de Juiz de Fora,
Brasil
António Teodoro
Universidade Lusófona
Portugal
Suzana Feldens Schwertner
Centro Universitário Univates
Brasil
Debora Nunes
Universidade Federal do Rio Grande
do Norte, Brasil
Lílian do Valle
Universidade do Estado do Rio de
Janeiro, Brasil
Flávia Miller Naethe Motta
Universidade Federal Rural do Rio de
Janeiro, Brasil
Alda Junqueira Marin
Pontifícia Universidade Católica de
São Paulo, Brasil
Alfredo Veiga-Neto
Universidade Federal do Rio Grande
do Sul, Brasil
Dalila Andrade Oliveira
Universidade Federal de Minas
Gerais, Brasil