EDUCATION INDICATORS INFOCUS - OECD.org · Early childhood education and care (ECEC)encompasses all...
4
education data education evidence education policy education analysis education statistics 11 IN 2013/02 (February) 1 Education Indicators in Focus – 2013/02 (February) © OECD 2013 EDUCATION INDICATORS FOCUS How do early childhood education and care (ECEC) policies, systems and quality vary across OECD countries? ECEC services have been expanding as part of labour market policies. However, ECEC policy is increasingly designed as education policy. In a majority of OECD countries, ECEC policy has paralleled the evolution of female labour force participation. More and more women have entered salaried employment since the 1970s, reinforced by the rise of service- and knowledge-based economies. Because economic prosperity depends on maintaining a high employment/population ratio, bringing more women into the labour market has been a key driver of governments’ interest in expanding ECEC services. In the 1970s and 1980s, European governments, in particular, put family and child care policies into place to help couples to have children and to ensure that it is feasible for women to combine work and family responsibilities (OECD, 2011; 2006). It is only recently that the goals of ECEC policy have been geared more towards enhancing child development and outcomes than to serving parental needs. Consequently, ECEC policy is often embedded into anti-poverty or educational equity measures, as inequalities in child outcomes are already present when children enter formal schooling, and are likely to grow over time. Today, many OECD governments see ECEC as a public investment and integrate ECEC services to ensure holistic and continuous child development. Coherent, high-quality ECEC services are used as an effective tool to help children build a strong foundation for life skills and, therefore, better life chances, especially for children from disadvantaged or immigrant backgrounds. In many OECD countries, ECEC services have increased in response to a growing demand for better learning outcomes as well as growing female labour force participation. In recent years, however, the goals of ECEC policy have become more child-centred. Fifteen-year-old students who attended early childhood education (ECE) tend to perform better on PISA than those who did not, even after accounting for their socio-economic backgrounds. Improving access without giving due attention to the quality of ECEC services is not sufficient to secure good individual and social outcomes. Early childhood education (ECE) covers all forms of organised and sustained centre-based activities – such as pre-schools, kindergartens and day-care centres – designed to foster learning and emotional and social development in children. These programmes are generally offered to children from the age of three. Early childhood care (ECC) covers all centre-based day care that is provided outside the home in licensed centres. These services are most commonly referred to as nurseries, day-care centres, crèches, playschools and parent-run groups. Some countries also include family day care as part of ECC. It can be provided in a home setting, at the childminder’s home or at the child’s own home where a qualified or registered childminder looks after the child. ECC can be provided to children as early as from birth. Early childhood education and care (ECEC) encompasses all forms of ECE and ECC services under an integrated system, which provides integrated pedagogical settings covering age zero or one to compulsory schooling age.
Transcript of EDUCATION INDICATORS INFOCUS - OECD.org · Early childhood education and care (ECEC)encompasses all...

education data education evidence education policy education analysis education statistics
11 IN2013/02 (February)
1Education Indicators in Focus – 2013/02 (February) © OECD 2013
EDUCATION INDICATORS FOCUS
How do early childhood education and care (ECEC) policies, systems and quality vary across OECD countries?
ECEC services have been expanding as part of labour market policies.
However, ECEC policy is increasingly designed as education policy.
In a majority of OECD countries, ECEC policy has paralleled the evolution of female labour force participation. More and more women have entered salaried employment since the 1970s, reinforced by the rise of service- and knowledge-based economies. Because economic prosperity depends on maintaining a high employment/population ratio, bringing more women into the labour market has been a key driver of governments’ interest in expanding ECEC services. In the 1970s and 1980s, European governments, in particular, put family and child care policies into place to help couples to have children and to ensure that it is feasible for women to combine work and family responsibilities (OECD, 2011; 2006).
It is only recently that the goals of ECEC policy have been geared more towards enhancing child development and outcomes than to serving parental needs. Consequently, ECEC policy is often embedded into anti-poverty or educational equity measures, as inequalities in child outcomes are already present when children enter formal schooling, and are likely to grow over time. Today, many OECD governments see ECEC as a public investment and integrate ECEC services to ensure holistic and continuous child development. Coherent, high-quality ECEC services are used as an effective tool to help children build a strong foundation for life skills and, therefore, better life chances, especially for children from disadvantaged or immigrant backgrounds.
In many OECD countries, ECEC services have increased in response to a growing demand for better learning outcomes as well as growing female labour force participation. In recent years, however, the goals of ECEC policy have become more child-centred.
Fifteen-year-old students who attended early childhood education (ECE) tend to perform better on PISA than those who did not, even after accounting for their socio-economic backgrounds.
Improving access without giving due attention to the quality of ECEC services is not sufficient to secure good individual and social outcomes.
Early childhood education (ECE) covers all forms of organised and sustained centre-based activities – such as pre-schools, kindergartens and day-care centres – designed to foster learning and emotional and social development in children. These programmes are generally offered to children from the age of three.
Early childhood care (ECC) covers all centre-based day care that is provided outside the home in licensed centres. These services are most commonly referred to as nurseries, day-care centres, crèches, playschools and parent-run groups. Some countries also include family day care as part of ECC. It can be provided in a home setting, at the childminder’s home or at the child’s own home where a qualified or registered childminder looks after the child. ECC can be provided to children as early as from birth.
Early childhood education and care (ECEC) encompasses all forms of ECE and ECC services under an integrated system, which provides integrated pedagogical settings covering age zero or one to compulsory schooling age.

education data education evidence education policy education analysis education statistics
© OECD 2013 Education Indicators in Focus – 2013/02 (February) 2
EDuCatiOn inDiCatOrs IN FOCus
PISA results have shown that high-quality ECE can result in better outcomes in the later stages of life. But the extent of its benefits heavily depends on the quality of the ECEC services.
Many OECD countries have significantly increased the proportion of children enrolled in ECE programmes in recent decades.
In recent decades, many countries have significantly increased the proportion of children enrolled in ECE programmes. In the majority of OECD countries, most children enter education well before the age of 5, and more than three-quarters of 4-year-olds (79%) are enrolled in ECE or ECEC programmes across OECD countries as a whole. However, enrolment rates vary from over 95% in Belgium, France, Germany, Iceland, Italy, Japan, Luxembourg, Mexico, the Netherlands, New Zealand, Norway, Spain and the United Kingdom, at
one end of the spectrum, to less than 60% (but more than 30%) in Australia, Canada, Finland, Greece, Poland and Switzerland, and to less than 30% in Turkey at the other end of the spectrum among OECD countries.
In Mexico and Poland, enrolment rates increased by more than 20 percentage points between 2005 and 2010 (see chart below).
A growing body of research recognises that ECEC can improve children’s cognitive abilities and socio-emotional development, help create a foundation for lifelong learning, make children’s learning outcomes more equitable, reduce poverty and improve social mobility from generation to generation (OECD, 2012a; 2012b). However, the degree to which ECEC can produce these benefits depends on the quality of the ECEC services. Increasing access to services without giving due attention to quality will not result in good child outcomes or long-term productivity benefits for society.
PISA results show that participation in ECE is strongly associated with reading performance at age 15, even after accounting for students’ socio-economic backgrounds. PISA results also suggest that the relationship between ECE participation and later learning outcomes is the strongest in countries with certain “quality” features. The indicative quality indicators include child-staff ratio, the duration of programmes and public spending per child (OECD, 2010).
100908070605040302010
0
% 2010 2005
Fran
ceN
ethe
rlan
dsSp
ain
Mex
ico
Belg
ium
Uni
ted
Kin
gdom
Den
mar
kJa
pan
Nor
way
Ital
yLu
xem
bour
gIc
elan
dG
erm
any
New
Zea
land
Swed
enH
unga
ryEs
toni
aA
ustr
iaSl
oven
iaIs
rael
Port
ugal
Czec
h R
epub
licK
orea
OEC
D a
vera
geC
hile
Arg
enti
na1
Rus
sian
Fed
erat
ion
Slov
ak R
epub
licU
nite
d St
ates
Irel
and
Pola
ndFi
nlan
dBr
azil
Gre
ece
Aus
tral
iaCa
nada
1
Swit
zerl
and
Indo
nesi
aTu
rkey
1. Year of reference 2009.Countries are ranked in descending order of the enrolment rates of 4-year-olds in 2010.Source: OECD. Argentina and Indonesia: UNESCO Institute for Statistics (World Education Indicators programme). Education at a Glance 2012: OECD Indicators, Indicator C2 (www.oecd.org/edu/eag2012).
Enrolment rates in early childhood and primary education at age 4 (2005 and 2010)Full-time and part-time pupils in public and private institutions
education data education evidence education policy education analysis education statistics
3
EDuCatiOn inDiCatOrs IN FOCus
Education Indicators in Focus – 2013/02 (February) © OECD 2013
The duration of participation in ECE matters too. In a majority of OECD countries, at least one year of ECE is offered for free.
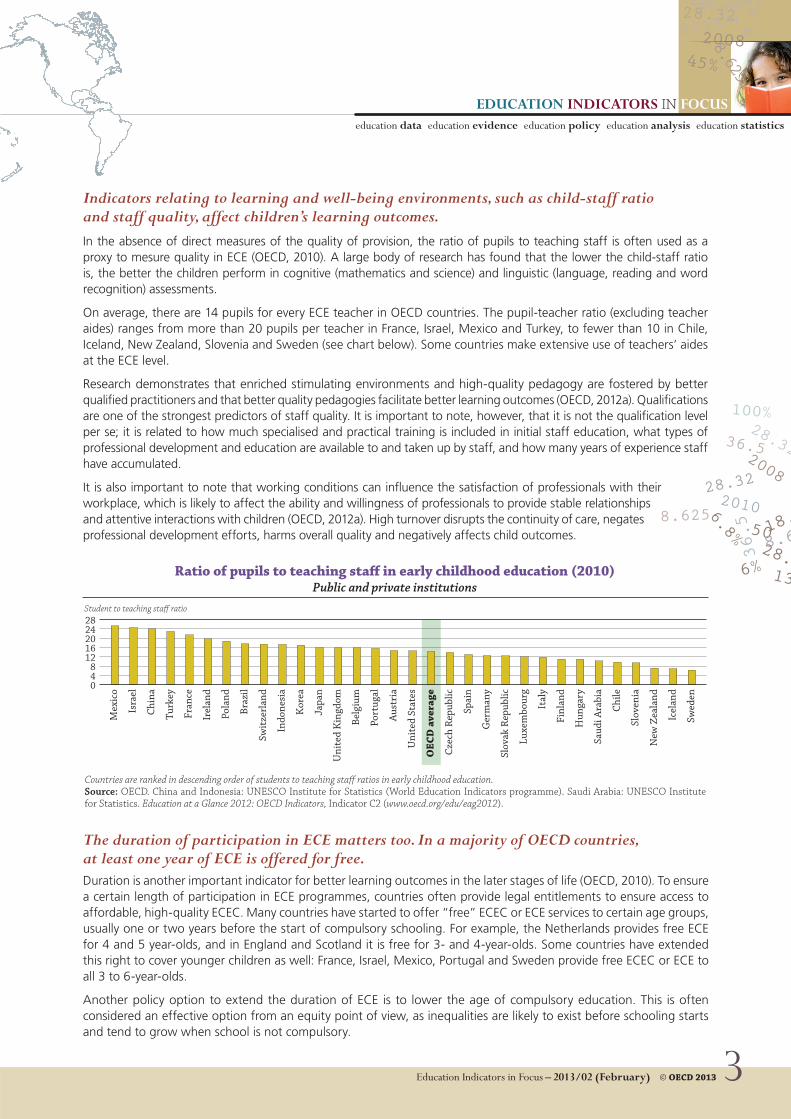
Indicators relating to learning and well-being environments, such as child-staff ratio and staff quality, affect children’s learning outcomes.
Duration is another important indicator for better learning outcomes in the later stages of life (OECD, 2010). To ensure a certain length of participation in ECE programmes, countries often provide legal entitlements to ensure access to affordable, high-quality ECEC. Many countries have started to offer “free” ECEC or ECE services to certain age groups, usually one or two years before the start of compulsory schooling. For example, the Netherlands provides free ECE for 4 and 5 year-olds, and in England and Scotland it is free for 3- and 4-year-olds. Some countries have extended this right to cover younger children as well: France, Israel, Mexico, Portugal and Sweden provide free ECEC or ECE to all 3 to 6-year-olds.
Another policy option to extend the duration of ECE is to lower the age of compulsory education. This is often considered an effective option from an equity point of view, as inequalities are likely to exist before schooling starts and tend to grow when school is not compulsory.
In the absence of direct measures of the quality of provision, the ratio of pupils to teaching staff is often used as a proxy to mesure quality in ECE (OECD, 2010). A large body of research has found that the lower the child-staff ratio is, the better the children perform in cognitive (mathematics and science) and linguistic (language, reading and word recognition) assessments.
On average, there are 14 pupils for every ECE teacher in OECD countries. The pupil-teacher ratio (excluding teacher aides) ranges from more than 20 pupils per teacher in France, Israel, Mexico and Turkey, to fewer than 10 in Chile, Iceland, New Zealand, Slovenia and Sweden (see chart below). Some countries make extensive use of teachers’ aides at the ECE level.
Research demonstrates that enriched stimulating environments and high-quality pedagogy are fostered by better qualified practitioners and that better quality pedagogies facilitate better learning outcomes (OECD, 2012a). Qualifications are one of the strongest predictors of staff quality. It is important to note, however, that it is not the qualification level per se; it is related to how much specialised and practical training is included in initial staff education, what types of professional development and education are available to and taken up by staff, and how many years of experience staff have accumulated.
It is also important to note that working conditions can influence the satisfaction of professionals with their workplace, which is likely to affect the ability and willingness of professionals to provide stable relationships and attentive interactions with children (OECD, 2012a). High turnover disrupts the continuity of care, negates professional development efforts, harms overall quality and negatively affects child outcomes.
Ratio of pupils to teaching sta� in early childhood education (2010)Public and private institutions
2824201612
840
Student to teaching sta� ratio
Mex
ico
Isra
el
Chi
na
Turk
ey
Fran
ce
Irel
and
Pola
nd
Braz
il
Swit
zerl
and
Indo
nesi
a
Kor
ea
Japa
n
Uni
ted
Kin
gdom
Belg
ium
Port
ugal
Aus
tria
Uni
ted
Stat
es
OEC
D a
vera
ge
Czec
h R
epub
lic
Spai
n
Ger
man
y
Slov
ak R
epub
lic
Luxe
mbo
urg
Ital
y
Finl
and
Hun
gary
Saud
i Ara
bia
Chi
le
Slov
enia
New
Zea
land
Icel
and
Swed
en
Countries are ranked in descending order of students to teaching sta� ratios in early childhood education.Source: OECD. China and Indonesia: UNESCO Institute for Statistics (World Education Indicators programme). Saudi Arabia: UNESCO Institute for Statistics. Education at a Glance 2012: OECD Indicators, Indicator C2 (www.oecd.org/edu/eag2012).

ReferencesOECD (2006), Starting Strong II: Early Childhood Education and Care, OECD Publishing, Paris.OECD (2010), PISA 2009 Results: Equity in Learning Opportunities and Outcomes (Volume II), PISA, OECD Publishing, Paris.OECD (2011), Doing Better for Families, OECD Publishing, Paris.OECD (2012a), Starting Strong III – A Quality Toolbox for ECE and Care, OECD Publishing, Paris.OECD (2012b), Education at a Glance 2012: OECD Indicators, OECD Publishing, Paris.
© OECD 2013 Education Indicators in Focus – 2013/02 (February) 4
EDuCatiOn inDiCatOrs IN FOCuseducation data education evidence education policy education analysis education statistics
the bottom line
Coming next month:Which factors influence the level of expenditure on teaching staff?
For more information, contact:Miho Taguma ([email protected])
See:OECD (2012a), Starting Strong III – A Quality Toolbox for ECE and Care, OECD Publishing, Paris.
OECD (2012b), Education at a Glance 2012: OECD Indicators, OECD Publishing, Paris.
Visit:www.oecd.org/edu/earlychildhood/toolboxwww.oecd.org/edu/earlychildhoodwww.oecd.org/els/family/database
Public spending in ECEC also matters. Without sufficient public spending, there is a greater risk that access to ECEC programmes will be restricted to affluent families
and that the quality of the programmes will vary.
Expenditure on ECE accounts for 9% of GDP of OECD expenditure on educational institutions or, on average, 0.5% of overall GDP. Differences between countries are significant. For example, while 0.1% or less of GDP is spent on ECE in Australia and Ireland, 0.8% or more is spent in Denmark, Iceland, Israel and Spain among OECD countries (see chart below).
Publicly-funded ECE tends to be more prevalent in the European OECD countries than in the non-European ones. Private funding varies widely between countries, ranging from 5% or less in Belgium, Estonia,
Luxembourg, the Netherlands and Sweden; to 25% or more in Austria and Germany; and to over 48% in Australia, Japan and Korea among OECD countries. In countries that do not channel sufficient public funding
to cover both quantity and quality, it is likely that some parents may be more inclined to send their children to private ECEC services, which can represent heavy financial burdens (OECD, 2012b), and others may prefer to stay
home, which can hinder increasing female labour force participation (OECD, 2011).
1.21.00.80.60.40.2
0
% of GDP
Den
mar
k
Icel
and
Spai
n
Russ
ian
Fed.
Isra
el1
Chi
le
Swed
en
Fran
ce
Slov
enia
1
Arg
enti
na
Mex
ico
Pola
nd
Ger
man
y
Belg
ium
Luxe
mbo
urg
Aus
tria
1
New
Zea
land
1
OEC
D a
vera
geCz
ech
Rep
ublic
Ital
y
Slov
ak R
epub
lic
Esto
nia
Finl
and
Uni
ted
Stat
es1
Net
herl
ands
Nor
way
Kor
ea
Uni
ted
Kin
gdom
Japa
n
Aus
tral
ia
Hun
gary
1
Port
ugal
Braz
il1
Swit
zerl
and
Irel
and
1. Includes some expenditure on child care.Countries are ranked in descending order of public and private expenditure on educational institutions.Source: OECD. Argentina: UNESCO Institute for Statistics (World Education Indicators programme). Education at a Glance 2012: OECD Indicators, Indicator C2 (www.oecd.org/edu/eag2012).
Public expenditure on educational institutions as a percentage of GDP
Private expenditure on educational institutions as a percentage of GDP
Total
Expenditure on early childhood educational institutions as a percentage of GDP (2009) By funding source
in an era of fiscal consolidation, ensuring access to high-quality ECEC should remain a priority for improving children’s outcomes and long-term efficiency gains for society at large, and the most vulnerable should be protected.
Photo credit: © Ghislain & Marie David de Lossy/Cultura /Getty Images