
Education Finance - World Banksiteresources.worldbank.org/EDUCATION/Resources/278200... · 3 I....
48
i SABER ‐ Finance Objectives and Conceptual Approach March 31, 2011 1 1 This note was prepared by Emiliana Vegas (Sr. Education Economist, HDNED), Alexandra Alderman (Consultant, HDNED), and Chelsea Coffin (Consultant, HDNED), based on discussions with the extended team that includes: Helen Ladd (Consultant, Edgar T. Thompson Professor of Public Policy and Economics, Sanford School of Public Policy, Duke University), David Plank (Consultant, Economist, Policy Analysis for California Education (PACE)) and Andrew Reschovsky (Consultant, Professor of Public Affairs and Applied Economics, LaFollette School of Public Affairs, University of Wisconsin), and Halsey Rogers (Lead Economist, HDNED). The team is grateful to the following individuals, whose comments throughout this initiative have been very helpful: Robin Horn (Sector Manager, HDNED); Luis Crouch (Vice‐President, Research Triangle Institute), Sachiko Kataoka (Education Economist, ECSHD); Richard Arden (UK AID); and Christine Wallace (UK AID). Education Finance Ensuring Adequacy Promoting Equity Performing Efficiently
Transcript of Education Finance - World Banksiteresources.worldbank.org/EDUCATION/Resources/278200... · 3 I....

i
SABER ‐ Finance
Objectives and Conceptual Approach
March 31, 20111
1 This note was prepared by Emiliana Vegas (Sr. Education Economist, HDNED), Alexandra Alderman (Consultant,
HDNED), and Chelsea Coffin (Consultant, HDNED), based on discussions with the extended team that includes:
Helen Ladd (Consultant, Edgar T. Thompson Professor of Public Policy and Economics, Sanford School of Public
Policy, Duke University), David Plank (Consultant, Economist, Policy Analysis for California Education (PACE)) and
Andrew Reschovsky (Consultant, Professor of Public Affairs and Applied Economics, LaFollette School of Public
Affairs, University of Wisconsin), and Halsey Rogers (Lead Economist, HDNED). The team is grateful to the following
individuals, whose comments throughout this initiative have been very helpful: Robin Horn (Sector Manager,
HDNED); Luis Crouch (Vice‐President, Research Triangle Institute), Sachiko Kataoka (Education Economist, ECSHD);
Richard Arden (UK AID); and Christine Wallace (UK AID).
Education Finance
Ensuring Adequacy
Promoting Equity
Performing Efficiently
ii
Table of Contents
I. Introduction and objectives....................................................................................................................................... 3
II. Conceptual Approach ................................................................................................................................................... 4
III. Education Finance Policy Goals ........................................................................................................................... 7
a) Ensuring Adequacy ....................................................................................................................................................... 7
b) Promoting Equity ........................................................................................................................................................... 8
c) Performing Efficiently ................................................................................................................................................ 10
IV. Five core areas of education finance policy ................................................................................................. 11
a) School conditions & resources ............................................................................................................................... 13
b) Education Spending .................................................................................................................................................... 14
c) Revenue Sources .......................................................................................................................................................... 17
d) Allocation Mechanisms .............................................................................................................................................. 19
e) Fiscal Control and Capacity ..................................................................................................................................... 21
Annex 1: Summary of previous related initiatives ................................................................................................. 28
Annex 2: Outline of Conceptual Questions for Policy Goals and Areas .......................................................... 31
Annex 3: Potential indicators and sources for Policy Goals ................................................................................. 33
Annex 4: Potential indicators and sources for Core areas .................................................................................... 36

3
I. Introduction and objectives
Education finance has long been a topic of debate. With education consuming a large share of public expenditures in many countries, the public is increasingly interested in how education resources are used. In addition, the economic downturn is prompting many more questions as governments reconsider spending priorities in the context of tightening budgets. The goal of expanding educational opportunity for all students is inextricably linked to questions of education finance: How much do countries invest in education? How do governments support schools? What is the role of the private sector, including households, in education? What are the appropriate financing arrangements for an effective allocation of public funds? How should resources be spent in schools to maximize student learning? Efforts to answer these questions have been an important part of the World Bank’s operations and analytical services work in low and middle income countries. Important efforts include regional analyses to document the relationship between per student financing and learning outcomes; operational support for financing arrangements that provide those closer to the point of service delivery with greater control over educational resources; and the development of tools to empower education stakeholders to monitor school budgets and their implementation. While this work has contributed to understanding better education finance policies and practices, much more research is needed to document the policies that are most effective for ensuring equitable, efficient and adequate education spending across and within countries.
The Human Development Department of the World Bank has launched an initiative called SABER – Finance to gain a deeper understanding of the financing and governance arrangements that are used to create and sustain the conditions necessary for student learning in basic education. The initiative—part of a larger effort called System Assessment and Benchmarking for Education Results (SABER)—seeks to document and evaluate the characteristics of school finance systems, policies and programs across education systems around the world, and to make this information and analysis widely available to World Bank staff, policy makers and researchers.
Countries commit very different levels of resources to education, even after accounting for differences in their income or wealth as typically measured by Gross Domestic Product (GDP). For example, in the Dominican Republic, public spending on education as a share of GDP, a measure of a country’s expenditure effort, is just over 2 percent while that of Botswana is over 8 percent (UNESCO 2010). At the same time, even countries that commit relatively similar shares of GDP to education can have very different results. Uruguay, which devotes about 3 percent of its public resources to education relative to GDP, outperforms neighboring countries on the Program for International Student Assessment (PISA) while Argentina, spending 4.6 percent, is the lowest performer among Latin American countries participating in the test. While there is variation in student learning outcomes—including access to schooling, completion of primary or secondary education, how much students learn—among countries that invest relatively large shares of GDP in education, all countries with low performance also invest relatively small shares of their GDP in education (OECD 2003).

4
While the level of financial resources is important for ensuring that students have access to a minimum standard of resources and materials, studies drawn on cross‐country data from international assessments show a weak, if any, relation between overall educational spending and student learning, even when controlling for family and school factors (Hanushek and Kimko 2000; Hanushek and Luque 2003; Woessmann 2000; Fuchs and Woessman 2004). Research has shown that how resources are invested in education, both in terms of what is purchased as well as the incentives imbedded in financing arrangements, is more important than the absolute amount of resources invested (Hanushek 1996; Burtless 1996). Therefore, deepening our understanding of how countries generate resources for education and allocate them for learning based on their social, economic and political contexts is crucial for improving the effectiveness of resources invested in education across the world.
II. Conceptual Approach
As a launching point to develop the underlying conceptual framework for this initiative, the World Bank team reviewed other benchmarking exercises previously carried out by the Bank and other development organizations. The most relevant is that of the Organization for Economic Co‐operation and Development (OECD) which in 2002 produced Financing Education—Investments and Returns to document the role of human capital and, by implication, education in fostering economic well‐being as well as the financing tools to increase education and ensure a more equitable distribution of education costs and benefits across stakeholders. This work, while providing a useful framework for SABER – Finance, is limited to the OECD and 19 additional participating countries—none of which were low income countries at the time of publishing.2 In the United States, Education Week’s annual Quality Counts reports scores and ranks states according to educational policy and performance in six areas, including education finance. The education finance component of the report provides a comprehensive picture of the state of equity and spending levels for education finance across U.S. states using a selection of indicators identified in education finance literature. At The World Bank, the Human Development Department of the Europe and Central Asia (ECA) region recently produced a report that reviews the experience with per student financing of basic education in six countries in the ECA region in an effort to learn which outcomes were achieved and how, and to inform future implementation of per student financing in the region.
The UNESCO Institute for Statistics (UIS) is the primary international agency responsible for collecting and disseminating information on education finance across developing countries. It has regularly collected data on education expenditures; however, given the heterogeneity in how countries account for and report such information, UIS has faced challenges in maintaining its core indicators populated with updated information for a large number of countries. Fortunately, in 2010 UIS partnered with The World Bank to use alternative sources of information, namely, the Country Status Reports that the World Bank has regularly conducted for a large number of Sub‐Saharan African countries, to fill in some of the more salient information gaps. This partnership is
2 Of the 19 additional participating countries, only Zimbabwe is classified as low income today.

5
beneficial in providing some data related to the UIS core education finance indicators in several countries. Nevertheless, important lacunae in education finance data remain, especially in the areas of allocation mechanisms and distribution of expenditures.
All of the aforementioned efforts offer comparative information on educational finance systems. In addition to these comparisons, efforts to understand the relationship between funding and education outcomes within a country by tracking funding and resources and relating them at different levels of the delivery system to outcomes in different institutional and organization contexts are also ongoing within the World Bank. These tools include Quality Service Delivery Surveys, Public Expenditure Reviews (PERs), Public Expenditure Tracking Surveys (PETs), and National Education Accounts. However, these tools have been implemented in only a select number of the Bank’s member countries. In some cases, the tools are not applied on a regular basis, and existing information is outdated. Further, instruments differ in their objective and scope and even the same tool, when applied to different countries, may focus on different components of an education finance system.
In addition to reviewing similar initiatives that have been launched in the sub‐sector of education finance, the team also reviewed the empirical evidence on the effectiveness of education finance systems in developed and developing countries. Finally, the team consulted with World Bank and external experts with deep knowledge of education systems. Through these activities, the team identified three policy goals that, arguably, all education finance systems should strive to achieve. To assess progress toward these policy goals, the team will collect information in five core areas of education finance in primary and secondary education. These policy goals and core areas are presented in Table 1. We detail potential indicators and sources for each policy goal in Annex 3, and for each core area in Annex 4. All indicators that inform policy goals will be included in a core area, which will take into account additional information. This contextual information will be used to provide important background information on education finance systems.

6
Figure 1: Policy Goals and Core Areas of Education Finance
Information on the general characteristics of a country’s basic education system also is necessary to inform, contextualize and facilitate analysis and benchmarking of education finance systems across countries. SABER ‐ Finance will build on general information about the structure of an education system being collected by other Policy Domains of the SABER exercise, including the number of phases of education and their duration; the types of schools that exist; the numbers of schools, teachers and students; the geographic distribution of schools; and the length of the school year and day. As well, SABER ‐ Finance will document countries’ demographic sectors and trends as they may affect education costs and efficiency.
Systematic and comparable data along the five core areas described above and the general characteristics of a country’s education system will inform the extent to which a basici education system meets core education finance goals of (i) ensuring adequacy; (ii) promoting equity; and (iii) performing efficiently.
7
Adequacy
Basic educational inputs
Adequate current spending levels
Responsive long term spending levels
Equity
Progressive variation in spending per
student
Manageable household
payments for schooling
Efficiency
Accountability in funding use
Public sector capacity for
education finance policy‐making
III. Education Finance Policy Goals
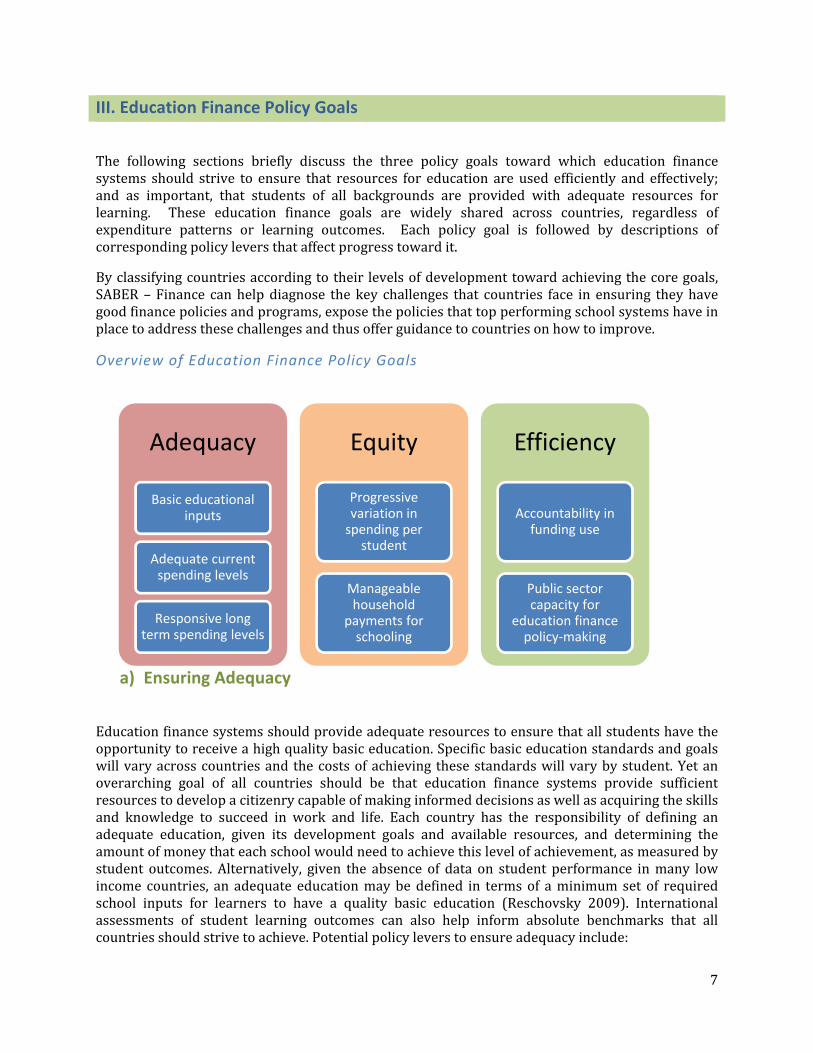
The following sections briefly discuss the three policy goals toward which education finance systems should strive to ensure that resources for education are used efficiently and effectively; and as important, that students of all backgrounds are provided with adequate resources for learning. These education finance goals are widely shared across countries, regardless of expenditure patterns or learning outcomes. Each policy goal is followed by descriptions of corresponding policy levers that affect progress toward it.
By classifying countries according to their levels of development toward achieving the core goals, SABER – Finance can help diagnose the key challenges that countries face in ensuring they have good finance policies and programs, expose the policies that top performing school systems have in place to address these challenges and thus offer guidance to countries on how to improve.
Overview of Education Finance Policy Goals
a) Ensuring Adequacy
Education finance systems should provide adequate resources to ensure that all students have the opportunity to receive a high quality basic education. Specific basic education standards and goals will vary across countries and the costs of achieving these standards will vary by student. Yet an overarching goal of all countries should be that education finance systems provide sufficient resources to develop a citizenry capable of making informed decisions as well as acquiring the skills and knowledge to succeed in work and life. Each country has the responsibility of defining an adequate education, given its development goals and available resources, and determining the amount of money that each school would need to achieve this level of achievement, as measured by student outcomes. Alternatively, given the absence of data on student performance in many low income countries, an adequate education may be defined in terms of a minimum set of required school inputs for learners to have a quality basic education (Reschovsky 2009). International assessments of student learning outcomes can also help inform absolute benchmarks that all countries should strive to achieve. Potential policy levers to ensure adequacy include:

8
1. Are basic educational inputs provided to all students?
The precise relationship between education spending and outcomes is complicated to estimate. Desired outputs are not clear, critical inputs are hard to identify, and it is difficult to account for quality teachers and student characteristics (Rice and Schwartz 2008). Although debate continues over the influence of better qualified teachers, smaller class size, a focus on academic fundamentals, or use of technology, there is agreement that beyond a certain threshold, how education funds are spent is more important than how much is spent. Below this threshold, however, the lack of critical inputs may do severe damage. An adequate system is one in which key inputs are provided on a sufficient scale nationally, on average, and, ideally on a sufficient scale between student groups as well.
2. Are current spending levels and patterns adequate to achieve basic levels of student outcomes for all (on average, by group)?
Adequacy‐based budgeting allocates funding in relation to the estimated costs of achieving predetermined outcomes established on a country basis by the constitution, legislature, courts, or an executive order. Spending per pupil should reflect the resources necessary to produce required outcomes, both overall and by groups with different learning needs. Long‐run adequacy will also be assessed in terms of the responsiveness of capital spending to basic infrastructure needs over time.
3. Is public education spending predictable, stable, and responsive to changes in student population?
Achieving adequate educational outcomes requires incremental and cumulative investments in individuals, which demands a reliable and adjustable supply of resources. Unexpected fluctuations in per pupil funding will hamper the ability of schools to provide a constant educational experience for all students each year. Strategies to manage variation include combining revenue sources, dedicating revenue sources to education, creating a stabilization fund, and not relying excessively on international funding. Purposeful variation in education spending is especially imperative in developing countries with youth bulges in which mortality has declined but fertility remains high.
b) Promoting Equity
A key goal of education finance systems is to promote equity in educational opportunity. Access to quality education should not depend on a person’s socio‐economic background, gender, race, or ethnicity. Reducing income and social inequality by improving education outcomes for students from low‐income households, reducing achievement gaps between students from advantaged and disadvantaged backgrounds, minority and majority groups, and girls and boys, is often considered the responsibility of the government (World Bank 2004). A fundamental responsibility of central governments, where the commitment to promote equity across various groups can take precedence over local interests, is ensuring equity in educational opportunity. Education finance policy has the

9
potential to minimize subgroup differences in educational access and achievement through policy levers including:
1. Does the public sector provide more resources to students from disadvantaged backgrounds?
To realize equality in outcomes, students from disadvantaged backgrounds often need additional resources. Thus an equitable pattern is one that provides more per pupil funding for student groups disadvantaged by socio‐economic background, native language, region, gender, or other groups. Geographic resource disparities often exist by region or between urban and rural areas. Certain religious groups or ethnicities may experience discrimination, either in school choice or school experience. Language spoken at home may also affect the facility of learning if it differs from language in the classroom. More generally, socio‐economic status can obstruct educational attainment, especially in developing countries where private contributions are common. In many countries, gender differences also prevail in access and quality of education services. Evidence suggests that countries that invest in girls’ education benefit from positive social and economic externalities (Psacharopoulos and Patrinos 2002). Students with disabilities or special needs present a greater diversity of needs, including physical, cognitive, and behavioral, which require additional spending to address (Harr et al. 2008). To allocate resources in a manner that favors needy students, education systems must first have a mechanism to identify relevant differences among students, and then introduce specific policies or programs designed to address the needs of disadvantaged students. The system’s commitment to achieving equity is reflected in both the share of total education spending that is compensatory and the degree of differentiation among students.
2. Are required household payments for schooling manageable relative to household incomes – particularly among lowincome households?
Private expenditure supplements public funding for education in many developing countries, where governments may be unable to generate sufficient resources to provide quality basic education. However, in some cases, required household payments for schooling represents a substantial portion of earnings in low income households, which often discourages enrollment, particularly for girls. Even though primary school fees have been officially abolished in many settings, additional and sizeable required payments are common in order to maintain quality in the context of limited public resources or rising student populations. Sanctioned school fees are more prominent at the secondary level, and may increase future income inequality if the wealthy are more likely to complete additional schooling and become eligible for higher education or greater earning potential.

10
c) Performing Efficiently
Efficient education systems require that systems invest in those inputs with the largest marginal return, as measured by student outcomes, given a country’s particular stage of development. The need to increase and sustain educational access and quality in light of adverse macroeconomic conditions is a huge challenge for policymakers—in particular in developing countries where education expenses are often the most important item in the budget. Given the growth in enrollments and unprecedented fiscal pressures, today it is perhaps more important than ever before that governments, providers and beneficiaries use educational resources in a manner that is transparent, accountable, and utilizes good governance. Essential policy levers for efficient school finance systems include:
1. Do allocation mechanisms encourage accountability in the use of funding by government levels and schools?
The efficient use of public funds relies on the capacity to budgets and, importantly, accountability systems to ensure that resources reach schools and benefit students. Certain allocation mechanisms promote efficiency by conditioning funding on outcomes, providing funding in a clear and publically available method, tracking reported expenditures against budgets, and internally monitoring compliance. Performance‐based budgeting creates fiscal incentives to improve outcomes at the school or local level. This is particularly important in an environment where school teachers and other personnel are otherwise unlikely to be rewarded through career advancement or additional compensation for improving student outcomes (Hanushek 1996). Just as importantly, the use of a transparent funding formula with explicit criteria allows educational stakeholders to hold the education system accountable as it transfers resources from the national level to the subnational, and from the subnational to schools. In addition, formal requirements for reporting education expenditures allow national and subnational governments to monitor budget compliance. Lastly, internal audit procedures at the national and subnational level will help to identify issues with public funding flows. At a school level, monitoring and enforcing teacher attendance policies is imperative, as teacher absenteeism is a systemic problem in many education systems and administrative records do not always correlate to actual attendance, nor are salaries adjusted accordingly. Education finance systems that promote accountability will be capable of identifying excess expenditure, recognizing leakages, and reducing delays in use of funds.
2. Is there public sector capacity—in terms of human resources and information management—for
Ultimately, efficient use of education funds relies on human capacity and availability of information. In light of the trend towards increased fiscal decentralization, qualifications in monitoring and auditing procedures or professional backgrounds have been highlighted as priorities for both subnational and national education offices. Likewise, training school leaders in budget management is crucial, especially if they have prior

11
education finance policymaking?
experience as educators, not as administrators. Human capacity must be complemented by readily accessible information about education finance. Electronic information systems allow governments to track the flow of resources more transparently and efficiently, at the same time reducing the risk of data manipulation by consolidating all information in a central location. School construction often requires a system to document compliance with construction standards as a condition for construction financing.
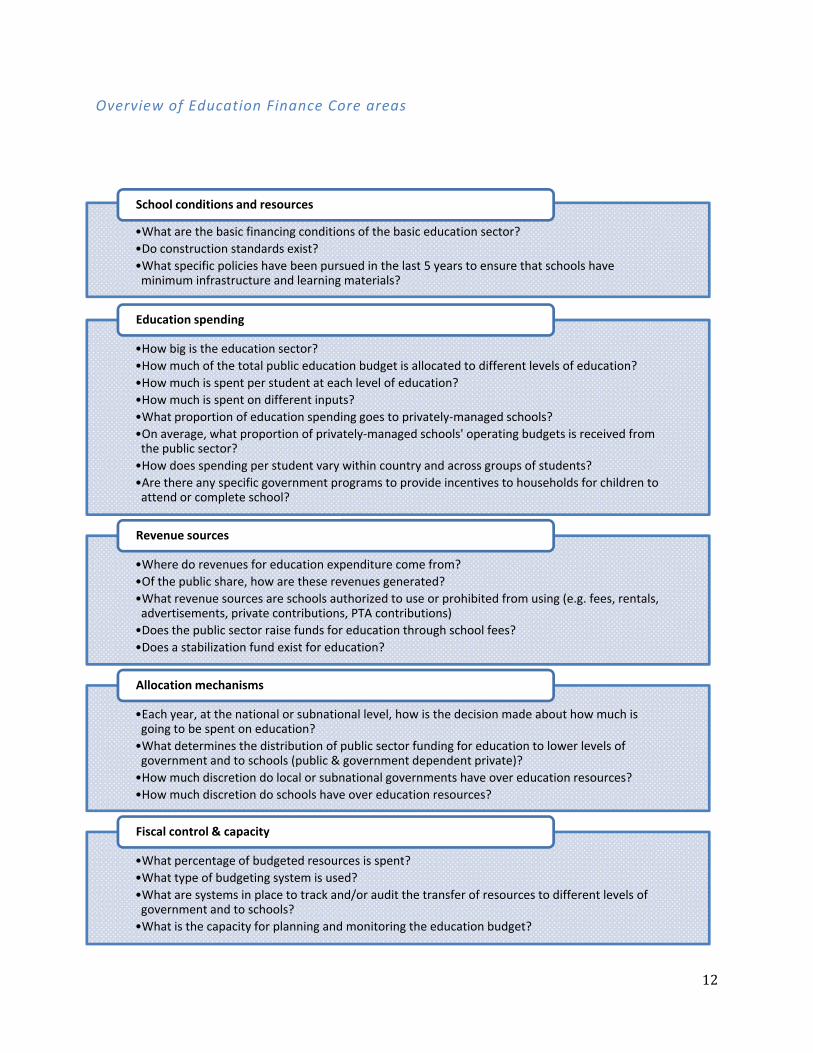
IV. Five Core Areas of Education Finance Policy
SABER – Finance will document in detail the five core areas to inform the analytical work that provides guidance for strengthening education finance systems. To determine the extent to which education finance policies contribute to achieving the core policy goals of promoting equity, performing efficiently, and ensuring adequacy, information on each education system in the following five core areas will be collected and synthesized: (i) school conditions & resources; (ii) education spending; (iii) revenue sources; (iv) allocation mechanisms; and (v) fiscal control & capacity.
12
Overview of Education Finance Core areas
•What are the basic financing conditions of the basic education sector?
•Do construction standards exist?
•What specific policies have been pursued in the last 5 years to ensure that schools have minimum infrastructure and learning materials?
School conditions and resources
•How big is the education sector?
•How much of the total public education budget is allocated to different levels of education?
•How much is spent per student at each level of education?
•How much is spent on different inputs?
•What proportion of education spending goes to privately‐managed schools?
•On average, what proportion of privately‐managed schools' operating budgets is received from the public sector?
•How does spending per student vary within country and across groups of students?
•Are there any specific government programs to provide incentives to households for children to attend or complete school?
Education spending
•Where do revenues for education expenditure come from?
•Of the public share, how are these revenues generated?
•What revenue sources are schools authorized to use or prohibited from using (e.g. fees, rentals, advertisements, private contributions, PTA contributions)
•Does the public sector raise funds for education through school fees?
•Does a stabilization fund exist for education?
Revenue sources
•Each year, at the national or subnational level, how is the decision made about how much is going to be spent on education?
•What determines the distribution of public sector funding for education to lower levels of government and to schools (public & government dependent private)?
•How much discretion do local or subnational governments have over education resources?
•How much discretion do schools have over education resources?
Allocation mechanisms
•What percentage of budgeted resources is spent?
•What type of budgeting system is used?
•What are systems in place to track and/or audit the transfer of resources to different levels of government and to schools?
•What is the capacity for planning and monitoring the education budget?
Fiscal control & capacity

13
a) School conditions & resources
Schools should meet minimum quality standards that include essential teaching inputs, instructional conditions and other basic resources not only to attract students and teachers, but also to provide an adequate environment conducive to learning. To understand school conditions & resources, the following questions will be addressed:
1. What are the school conditions & resources of primary and secondary schools?
A consistent relationship has not been established between specific school resources as measured by learning materials, student/teacher ratios, teacher experience and/or education and spending per student. On the one hand, textbooks have consistently been shown to have a positive effect on student learning (Jamison et. al 1981; Heyneman, Jamison and Montenegro 1981). And there is evidence that school infrastructure is important for creating positive learning environments and improving student attainment (Duflo 2001). Related, Chaudhury et al. (2006) find that better school infrastructure is associated with teacher attendance. A holistic understanding of the learning experience includes the safety of the school environment or the provision of meals if appropriate. However, assessments of the influence of student/teacher ratios—a frequently measured school‐level factor in education production functions, on student performance show inconsistent results (Hanushek 1986; Case and Deaton 1995; Woessmann 2001; Krueger 2002). Students per classroom can also be considered as a better indicator of overcrowding. Other personnel—school leaders—may be more influential, as strong leadership is a key attribute shared by schools that successfully improve the achievement of poor and minority children (Davis et al. 2005). Further, despite the general belief that Information and Communication Technologies (ICTs) have the potential to improve learning, rigorous evidence of its impact on student learning is scarce and few conclusive statements about the impact of ICTs on student learning can be drawn (Trucano 2005). In spite of the scarcity of solid evidence of what works in ICT for learning, they(to what does this refer?) are becoming increasingly pervasive in the workplace as communication tools and computer literacy is a requirement for jobs at all levels. Many believe that the 21st century classroom requires ICT access and computer‐assisted learning, which requires ICT qualified teachers and preferably an internet connection. A library or media center is also expected to increase the ability to access information as well as to develop reading and comprehension skills (World Bank Working Paper No. 126). On the most basic level, whether schools operate regularly throughout the duration of the academic year has direct implications for instructional time.
2. What policies are in place to ensure that schools have minimum
To understand a government’s commitment to improving the basic learning environment in schools, it is useful to understand what policies the government has implemented in the last five years to ensure minimum infrastructure and learning materials. Implementation of infrastructure

14
infrastructure and learning materials?
policies can be measured by the application of school construction standards. School infrastructure is an essential factor in learning outcomes, making school construction standards and their enforcement crucial to ensuring the quality of school facilities. This is especially true in weak institutional environments where budget allocation does not necessarily transform into effective school expenditure due to a lack of accountability (Ablo and Reinikka 1998).
b) Education spending
How much countries invest in education provides the basis for achieving their learning goals. In this core area, we explore education spending at various government levels and by the private sector, both in aggregate and per‐student terms. The following questions will be addressed:
1. How big is the education sector, by levels?
The level of spending a country commits to education relative to its national income represents a country’s ability to generate resources for education. Greater national wealth does not always mean that countries spend more, in relative terms, on education. Even among countries with similar levels of GDP per capita, there can be substantial variation in the share of GDP devoted to education. However, among countries that face low levels of national income and invest low proportions of income in education, current spending levels may not be adequate to meet a country’s education goals. It is useful to understand the government’s policy emphasis on education relative to the perceived value of other public investments as well as its commitment to human capital development. Examination of aggregate spending levels on education allows researchers and policymakers to take the pulse of a country’s commitment to the education sector. Allocations of public expenditure to education in many countries are often higher than expenditures in any other categories of government developmental expenditure. This spending must be assessed for the extent to which it reflects a government’s particular objectives, its population’s education status, alternative sources of expenditure and competing demands.
2. How much of the total education budget is allocated to different levels of education?
Policy‐makers face difficult decisions in balancing limited public funds and societal needs. Research has shown that externalities tend to diminish with the level of schooling; externalities are higher for pre‐primary and primary than secondary education, and higher for secondary than post secondary education, especially in developing countries. At the primary level where unit costs are relatively low, expenditures on primary education disproportionately benefit low income households given the proportion of primary age population from poor families. On the other hand, at the tertiary level where unit costs are considerably higher, the composition of students tends to be over represented by students of higher socio‐economic status (Balu, Patrinos and Vegas 2009). As such, the distribution of education spending across levels of education may

15
indicate the extent to which education funding is progressive—with poor students receiving a greater share of public funding relative to their rich counterparts. Nevertheless, high rates of participation at the primary and secondary levels have increased demand for post‐secondary education. Low income countries who have not achieved basic universal completion rates may chose to concentrate public funding at pre‐primary and primary levels, due to the argument that investment in lower levels of education is associated with higher externalities. However, failure to foster higher level learning opportunities and acquisition of skills for a globalized economy may constrain innovation, economic development, and growth.
3. How much is spent per student at each level of education—distinguishing between public and private spending?
There is enormous variation within and across countries in the amount of resources available per student. For international comparison purposes, expenditure data can be converted into Purchasing Power Parities (PPPs expressed in US$), which are international units that equalize the purchasing power of different currencies by reflecting the price of the same basket of goods and services in any country. While per‐pupil spending adjusted for PPP shows how much, on average, a country spends per student and allows for a comparison of spending per pupil across countries, a key challenge for policymakers is understanding the real costs of achieving desired levels of education access, quality, and equity in each individual education system. Private expenditures are a crucial component in education finance, but they can place a disproportionate burden on the poor. Private expenditure per pupil for educational programs outside the mainstream system, such as tutoring, may be significant and create negative social, economic, and educational impacts.
4. How much is spent on different educational inputs?
Expenditure on specific educational inputs helps to characterize education finance systems. For example, how much is devoted to current vs. capital expenditures and within current, salaried vs. non salaried expenditures? Ultimately, education funds should pay for inputs and services that lead to student learning. The amount of resources available for current, non‐teacher salary items, those complementary to the learning process in particular such as textbooks, may have important effects on education quality (Abu‐Ghaida 2010). Yet it is often the case that the pressure of teacher salaries squeezes out other inputs—particularly non‐salaried current expenditures. Allocation of spending among the different inputs to service delivery signals current interest in spending available funds on teachers vs. non salaried current inputs. Capital expenditures should also be documented. In countries experiencing large growth in the school‐age population, capital investments must be sufficient for school construction and long‐term maintenance of school buildings. Lastly, spending on ICTs should be considered, due to their potential role in improving learning outcomes.
5. What proportion of public education spending goes to privately managed
Private providers play an important role in basic education and delivering a sizeable share of education in many countries. Governments are calling on private organizations to manage and operate public schools through charters or concessions, or to provide education to a specific group of

16
schools? students by means of a subsidy, contract, or voucher. These partnerships have the potential to increase access to quality education for all (Angrist et al. 2002; Angrist, Bettinger, and Kremer 2006). Private sector management can serve as a means to broaden the coverage and quality of education, through inducing internal competition within the school systems (Sanstrom and Bergstrom 2004; Vegas and Petrow 2008). However, in some countries private sector provision of education may have led to increased segregation by student background across schools (Ladd 2008; Hsieh and Urquiola 2006).
6. On average, what proportion of privatelymanaged schools’ operating budgets is received from the public sector?
In many countries, the government finances the provision of education by non‐governmental actors (as well as government actors). Some privately‐managed schools receive all their funding from the public sector, while others may receive only a share of their total budgets from public sources, or no public resources at all. Cross‐country variation in the proportion of privately‐managed schools’ budgets that comes from the public sector may help to understand the extent to which access and quality of schooling may increase as the government relies more (or less) on private providers.
7. How does spending per student vary within country and across groups of students?
While aggregate spending figures provide a summary indication of a country’s commitment to education, they may mask wide variation in spending across different groups of students. Access to quality education should not depend on a person’s demographics characteristics such as race/ethnicity, socio economic status and special needs (Oosterbeek and Patrinos 2008). An assessment of per‐pupil spending (both public and household) and enrollment in public or private institutions by student characteristics can shed light on the extent to which resources for education are distributed equally and whether existing disparities are in line with students’ demographic characteristics (including gender), socio economic status and special needs. In many countries, central governments increasingly call on subnational governments to share in the financing of education. However, variation in local resource generation capacity may lead to wide per‐pupil spending gaps (Tsang 1996; Fiske and Ladd 2008). Assessing the progressivity of a country’s education finance system requires examination of how per‐pupil spending varies across local jurisdictions, demographic characteristics, socio economic status and special needs. If appropriate, variation by municipality may be used as a proxy for other group characteristics, particularly if a system to identify students by special needs or demographics does not exist.
8. Are there specific government programs to provide incentives to households for children to attend or
Despite significant increases in basic education enrollment and completion rates, access to and quality of education remains low among disadvantaged populations in most countries. Governments may establish financial incentives to increase families’ utilization of education services and reduce inequality of opportunity. One such program, Conditional Cash Transfers in education (CCTs), target cash payments generally at poor

17
complete school? households that meet certain behavioral requirements. While there is solid evidence of substantial positive effects of CCTs on school enrollments, little is known about the impact on student outcomes, or on the cost effectiveness of such programs (Schultz 2004; Handa and Davis 2006; Fiszbein and Schady 2009). Financial reward schemes can also be an effective way to improve school performance by promoting greater student and teacher motivation (Kremer, Miguel, and Thornton 2005).
c) Revenue sources
Education systems need to raise sufficient revenues to ensure that, if used efficiently, students may reach appropriate learning goals at each education level. In general, countries raise revenues for education through three broad sources: international, public and private. A big challenge for many countries is raising sufficient revenues to expand enrollment while maintaining, or even raising, school quality. While increasing efficiency in the use of resources is necessary, countries are looking also to additional funding sources such as subnational levels of government and the private sector, including households. The sources of funding and the mechanisms through which revenues are raised have implications for adequacy, sustainability, and equity in education finance. To understand how education systems generate revenues for learning, it is useful to address the following questions:
1. Where do revenues for education expenditure come from?
Across countries, governments raise much of the funding for public education through broad based taxes such as those on value added, income or property, or taxes on specific types of transactions or activities.. However, the amount of revenues that governments raise depends on a variety of factors, notably national fiscal capacities. In low‐income countries where tax collection effort is often low and inconsistent, and in crisis or post‐crisis situations where state capacity is limited, the means for domestic education financing is limited and reliance on international aid is crucial (Inter‐Agency Network for Education in Emergencies 2008). Similarly, school fees or direct household payments are prevalent in primary and secondary schools around the world. While school fees may provide a much‐needed source of revenues for the education system, in many low‐income countries they represent a disproportionate burden on the poor (Jimenez and Lockheed 1996; Jimenez and Paqueo 1996; Bentaouet Kattan 2006).
2. How are resources generated for the public share of education revenue?
Increasingly, countries are decentralizing the responsibility for raising and managing education resources to subnational levels of government. However, without central government‐led equalization schemes to compensate for varying fiscal capacity across jurisdictions, fiscal decentralization can lead to wide disparities in resources available for learning. How governments manage the allocation of funds for education is central to several important policy debates, in particular fiscal decentralization. Revenue generation capacity as well as the authority for

18
allocating funding for education across government levels varies substantially across and within countries. Requiring local governments to raise all their own revenue for education is likely to result in an unacceptably high degree of inequality in per‐pupil spending. In general, where local governments finance education from their own‐source revenues, central and state governments have introduced intergovernmental grants to help mitigate spending inequalities between and across levels of government. Additional determining factors in education finance include which types of expenditures (current, capital, salaries) local governments are required to fund, the sources of own‐source revenue for local governments, and the extent to which local governments have revenue‐generating capacity for the education sector. Not only is it useful to understand the extent to which local governments have legal authority to raise funds for education, but also whether they are encouraged and empowered to do so.
3. What revenue sources are schools authorized to use or prohibited from using?
By choice or necessity, schools often complement funding received from higher levels by raising revenue to meet locally informed needs such as extra‐curricular activities or classroom materials. Potential sanctioned revenue sources include registration and annual fees, PTA or community contributions, rentals, or advertisements. Due to concerns about equity, some of these revenue sources may be prohibited, as the ability to contribute outside funds can vary greatly within and across communities.
4. Is there a policy related to school fees? If so, what is it?
Households are a source of domestic funding for education through user fees – which include not only formal tuition fees but also payments for textbooks, materials, uniforms, and other inputs needed for children and youth to attend school. Even where primary school tuition fees have been eliminated, parents often still report paying tuition (Transparency International 2009). Indeed, household education expenses can constitute a large share of total household spending, particularly for the poor. Fees may preclude the poorest and girls in particular from attending school. This exclusion may contribute to the intergenerational transmission of poverty that access to basic education is intended to reduce (Bentaouet Kattan 2006). While eliminating school fees is appealing because of its detrimental impact on poor households and therefore access to education of the most disadvantaged, there may be unintended consequences from the elimination of school fees. One such consequence is that the increases in enrollment as a result of the elimination of school fees, in the absence of alternate sources of funding, can lead to drastic declines in school quality (Fiske and Ladd 2008). School fee abolition may also reduce school accountability to households, which may generate further declines in school quality (World Bank 2004; UNICEF 2009). Increased enrollment at the primary level creates more demand for secondary school and
19
therefore increases the salience of fee policies at the secondary level, especially if secondary school completion has become a more important distinguishing factor in labor markets. The equity impact of fee policies are also influenced by the proportion of total private spending on education that is represented by school fees or which authorities are responsible for establishing or collecting the fees.
5. Does a stabilization fund exist for education?
Stabilization funds allow governments to control revenue instability and maintain social programs during a downturn. These funds are more likely to be used effectively with stringent deposit and withdrawal rules (Gonzalez and Paqueo 2003). For example, some states choose to dedicate a portion of natural resource revenues to stabilization funds.
d) Allocation mechanisms
The state can play a role in mitigating or exacerbating differences in educational opportunity. Intergovernmental transfers are a common tool for balancing regional and local budgets. Intergovernmental transfers are usually designed to address differences in revenue generation capacity between government levels as well as inequities across subnational levels (such as states or districts) (OECD 2002). The rules that govern intergovernmental resource flows, as well as the amount of discretion that governments give schools in managing resources to respond to students’ needs, affect the level of accountability, transparency, and performance in the system (Das et al. 2004; Reinikka and Svensson 2004). To examine how the resource flow affects the function of the education system, the following questions should be investigated:
1. How is the decision made about how much to spend on education?
The process for deciding how much to spend on education at the national and subnational level (constitutional mandate, parliamentary allocation, tax sharing) affects the responsiveness of education expenditure to changing needs of the student population. For example, in many countries the executive arm of government makes annual budget proposals to the legislative arm, which has final decision‐making authority. These proposals and decisions are often based on historical allocations, and change little from year to year. In other cases, the government makes a purposeful decision to allocate resources differently across sectors, implying a change in how much is available for the education system. Good use of information and analysis in these decisions can increase the allocation of government resources to education sector and improve efficiency of spending.
2. What determines the distribution of public sector funding for education to
Once the overall budget allocation decision for the education sector has been made, decisions about the distribution across government levels and to schools must be taken. To determine the level of educational resources to be transferred to each level, funders may negotiate directly with

20
lower levels of government and to schools (public and private)?
recipients or determine the level of funds through formula. For the former, subnational levels of government (or schools) present their case for funding based on known criteria to the funding agency (central government) and receive resources according to how well the funding agency considers the proposals to meet the criteria. Or the funding agency may modify the previous year’s payment up or down a few percentage points, or use its own discretion to determine the level of resources to be allocated to subnational levels of government (or schools) (Ross and Levacic 1999). Alternatively, transfers can be determined by formula, based on particular measures such as number of students or socio economic characteristics of students, communities, or regions. The main distinguishing feature of a funding formula is that explicit criteria are determined to guide the transfer of resources from one government level to another, and directly to schools. If the specific formula is relatively simple and easy to understand, made public, and respected and enforced, it will likely improve efficiency and accountability as it makes transparent to educational stakeholders the factors affecting the funding schools receive. Governments may use different funding mechanisms for different inputs, to understand the allocation of resources to each school, it is important to distinguish between capital and current expenditures and among salaried and non salaried recurrent expenditures. Many policymakers, particularly in developing countries, use a simple “in‐kind” formula that employs student/teacher ratios to guide the allocation of teachers, textbooks, equipment and other materials for schools. Some state that best practices would distribute dollars instead of purchased resources or inputs, enabling schools and communities to make input purchasing decisions directly (Thomas Fordham Institute 2006; Roza, Guin and Davis 2008). However, this assumes an adequate level of capacity among school owners and administrators for managing and allocating school budgets, as well as an efficient market for inputs (teachers in particular) at the subnational level. In addition to teacher allocation, the level of government that determines the teacher salary schedule also influences the distribution of funding.
3. How much discretion do local or subnational governments have over education sources?
In recent decades, several countries have experimented with efforts to devolve authority over budget allocation decisions to subnational levels of government, under the hypothesis that bringing decision‐making closer to those who directly provide services and/or beneficiaries will contribute to a more efficient use of resources. Research evidence suggests a tradeoff between equity and efficiency due to varying local capacity to generate and manage resources (James, King and Suryadi 1996; Galiani, Gertler and Schargrodsky 2008; Barrera‐Osorio et al. 2009; Transparency International 2009). While fiscal decentralization works to align accountability and authority over resources, implementation and outcomes are most successful in more advantaged jurisdictions with already established traditions of participatory governance. Intergovernmental grants may be earmarked for education or for functional costs within the sector (current vs. capital), or grants may be

21
transferred without conditions. While earmarking grant monies helps to ensure that resources are spent as the authority making the grant intended, such stipulation reduces the expenditure autonomy of the subnational government. It is important to understand the degree of spending discretion subnational governments have over government grants as well as those revenues they raise on their own.
4. How much discretion do schools have over education resources?
When schools control a greater proportion of revenues, they can better adjust spending to local needs (McGuire and Papke 2008). Decentralization theory (Oates, 1972) argues that greater budgetary discretion at lower level will better align incentives and more effectively utilize local knowledge. However, local control yields these benefits only if schools receive adequate funding from national and subnational governments and have adequate capacity to execute them. .
e) Fiscal control and capacity
A fifth important core area for understanding school finance systems is the fiscal control mechanisms used to monitor the use of budgeted resources for education service delivery. The education budget is a government’s plan for how it is going to use the public’s resources to achieve educational goals and objectives. If resources are not used for their intended purposes, then it is unlikely that education services will be of adequate quality. Providing the public with comprehensive and timely information on the government's budget and financial activities and opportunities to participate in decision making can strengthen oversight and improve policy choices. To document the policies in place to control fiscal resources for education, including the management capacity of those with oversight, it is important to understand the following:
1. What percent of budgeted resources were spent in each of the last 3 years?
To understand a government’s ability to deliver annual education services as expressed in policy commitments or sector plans, for example, it is important to document the share of annual education budget that is spent. It is useful to understand how this spending deviates from original budgets for each of the major expenditure categories (e.g. teacher salaries), because different administrative levels are responsible for different expenditure categories. It is also important to distinguish between current and capital spending: because capital spending can be “lumpy,” combining it with other spending categories may misrepresent governments’ spending patterns.
2. Are the allocated budgets reaching the schools?
The proportion of allocated budgets spent on a school level is the only way to examine whether resources are reaching the end users. Leakage can be substantial in poor countries where auditing institutions may be weak or corrupt, and information about budgets is not publically available (Reinikka and Svensson 2004).

22
3. What type of budgeting system exists?
A budget translates an education sector’s policy objectives into financial plans. A variety of budgeting models exist, including line‐item budgeting, activity/program budgeting, and outcome‐based budgeting. Each of these models has advantages and disadvantages, and the adoption of a particular model has implications for budget transparency, efficiency and organizational autonomy. For example, simple line‐item budgets allow for the accumulation of expenditure data over time, and at each functional level. However, some argue that line‐item budgeting invites micro‐management by education administrators and governing boards, and offers no flexibility in reallocation between budget items. Program‐based systems that base all expenditures on the primary objectives of a program offer the advantage of relating all costs to program objectives. However, program‐based systems are challenging in their implementation due to the difficulty in predicting long range costs and the evolving nature of programs. Finally, outcome‐ or performance‐based budgeting can make spending more effective, as it requires that goals and objectives be identified and allows for program innovation and flexibility in meeting those goals (Allison, Honegger, and Johnson 2009). But these systems rely on the capacity of providers to conduct realistic budget estimates and to deliver on the agreed results. In addition to overall budget arrangements, inclusion of a formal capital budgeting system facilitates planning for these large investments that require funding over time.

23
4. What are the systems in place to track and/or audit the transfer of resources to different levels of government and to schools?
Differences between budget allocation and actual education service delivery may occur for several reasons. These reasons can include: capacity constraints that prevent the central government from adequately budgeting for expenses or complying with what has been budgeted, or that prevent subnational governments or schools from allocating resources productively; fraud or corruption; and lack of transparency in the budgeting process that weakens the capacity of local communities to scrutinize the resources allocated and used. The extent to which education systems put in place fiscal control mechanisms to ensure that resources budgeted for education are spent in intended ways is a critical factor in school finance systems, especially payment methods for teacher salaries that often comprise a majority of education expenditure. Further, because teacher absenteeism is often widespread and unlikely to result in punitive action (Chaudhury et al. 2006), a system for tracking absence and providing substitute teachers is necessary. School systems also need payroll controls and mechanisms for exposing “ghost teachers” who receive salaries but do not teach (Ablo and Reinikka 1998). Capital expenditures, which represent a substantial share of education expenditures, can be hard to track because capital budget allocations tend to occur at a higher level than their execution. Transparency and accountability in contractor choice and application of construction standards can improve quality of education infrastructure. General fiscal controls in school finance may include: reporting requirements; internal and external audits; public information on school budgets; budget tracking (through PETS, for example); and enforcement mechanisms.
5. What is the capacity for planning and monitoring the education budget?
Adequate capacity for planning, monitoring, and executing education budgets is essential for achieving the sector’s goals. It is therefore important to understand what specific agencies at the national and subnational levels have the authority for planning and monitoring the education budget. Similarly, tracking the qualifications of staff charged with this responsibility may prove useful in strengthening government capacity at the central and local levels. Finally, since research suggests that public accountability improves outcomes, it is also important to document any support systems (including training) for local school staffs and community representatives responsible for planning for and monitoring the use of education resources.

24
References
Ablo, Emmanuel and Ritva Reinikka. 1998. Do Budgets Really Matter?: Evidence from Public Spending on Education and Health in Uganda. Washington DC. The World Bank.
Abu‐Ghaida, Dina. 2010. Per Student Financing of General Education in Europe and Central Asia: Has it Delivered on its Promise. Washington DC. The World Bank.
Allison, Gregory, Stephen Honegger, Frank Johnson. 2009. Financial Accounting for Local and State and School Systems. Handbook published by National Center for Education Statistics. Washington DC.
Angrist, Joshua, Eric Bettinger, Erik Bloom, Elizabeth King, and Michael Kremer. 2002. Vouchers for
Private Schooling in Colombia: Evidence from a Randomized Natural Experiment. American Economic Review, 92(5) pp. 1535‐1558.
Angrist, Joshua, Eric Bettinger and Michael Kremer. 2006. Long‐term Educational Consequences of Secondary School Vouchers: Evidence from Administrative Records. The American Economic Review, 96(3), pp. 847‐862.
Balu, Rehka, Harry Patrinos and Emiliana Vegas. 2009. Global Development Network Issues Paper. Washington DC. The World Bank.
Burtless, Gary. 1996. Does Money Matter: The Effect of School Resources on Student Achievement and Adult Success. Washington DC. The Brookings Institution.
Case, Ann and Angus Deaton. 1999. School Inputs and Educational Outcomes in South Africa. Quarterly Journal of Economics, 114(3), pp. 1047‐1084.
Chaudhury Nazmul, Jeffrey Hammer, Michael Kremer, Karthik Muralidharan, and F.Halsey Rogers. 2006. Missing in Action: Teacher and Health Worker Absence in Developing Countries. Journal of Economic Perspectives, 20(1) pp.91‐116.
Das, Jishu, Stefan Dercon, James Habyarimana, and Pramila Krishnan. 2004. Public and Private Funding of Basic Education in Zambia: Implications of Budgetary Allocations for Service Delivery. Washington DC. The World Bank.
Duflo, Ester. 2001. School and Labor Market Consequences of School Construction in India: Evidence from and Unusual Policy Experiment. American Economic Review 91 (4): 795‐813.
Education Week. Quality Counts.
Fiske, Edward and Helen Ladd. 2008. Education Equity in an International Context. Edited by H. Ladd and E. Fiske, Handbook of Research in Education Finance and Policy, pp. 276‐292.
Fiszbein, Ariel and Norbert Shandy. 2009. Conditional Cash Transfers: Reducing Present and Future Propserity. Washington, DC. The World Bank.
25
Handa, Sudhanshu and Benjamin Davis. 2006. The Experience of Conditional Cash Transfers in Latin America and the Caribbean. Development Policy Review, 24(5), pp. 513‐536.
Hanushek, Eric A. 1986. The Economics of Schooling: Production and Efficiency in Public Schools. Journal of Economic Literature 49(3): 1141‐77.
Hanushek, Eric. 1996. Measuring Investment in Education. Journal of Economic Perpsectives 10(4) pp. 9‐30.
Hanushek, Eric. 1996. School Resources and Student Performance. Ed. G. Burtless, Does Money Matter?, pp. 43‐73.
Hanushek, Eric and Dennis Kimko. 2000. Schooling, Labor‐force Quality and the Growth of Nations. The American Economic Review. 90(5) pp. 1184‐1208.
Hanushek, Eric and Javier Luque. 2002. Efficiency and Equity in Schools around the World. Cambridge, MA. National Bureau of Economic Research.
Harr, Jennifer J., Tom Parrish, and Jay G. Chambers. 2008. Special Education. Edited by H. Ladd and E. Fiske, Handbook of Research in Education Finance and Policy, pp. 573‐590.
Hsieh, Chang Tai and Miguel Urquiola. 2003. When School Compete, How do they Compete? An Assessment of Chile’s Nationwide School Voucher Program. Cambridge, MA. National Bureau of Economic Research.
Hyneman, Stephen, Dean Jamison and Xenia Montenegro. 1984. Textbooks in the Philippines: Evaluation of the Pedagogical Impact of a Nationwide Investment. Educational Evaluation and Policy Analysis 6(2) pp.139‐150.
Inter‐Agency Network for Education in Emergencies. 2008. A Guide to External Education Financing in Low Income and Fragile Countries.
Jamison, Dean, Barbara Searle, Klaus Galda and Stephen Heyneman. 1981. Improving Elementary Mathematics Education in Nicaragua: An Experimental Study of the Impact of Textbooks and Radio on Achievement. Journal of Educational Psychology 73(4) pp. 556‐67.
Kremer, Michael, Edward Miguel and Rebecca Thornton. 2009. Incentives to Learn. The Review of Economics and Statistics, 91(3), pp. 437‐456.
Krueger, Anne O. 2002. Economic Considerations and Class Size. Cambridge, MA. National Bureau of Economic Research.
Ladd, Helen. 2008. Reflection on Equity, Adequacy and Weighted Student Funding. Education Finance and Policy, 3(4), pp. 402‐423.
OECD (Organization for Economic Co‐operation and Development). UNESCO Institute for Statistics and World Education Indicators Programme. 2002. Financing Education—Investments and Returns.

26
OECD (Organization for Economic Co‐operation and Development). 2003. Programme for International Student Assessment (PISA) database. http://www.pisa.oecd.org.
OECD (Organization for Economic Co‐operation and Development). 2010. OECD.Stat Extracts.
Oosterbeek, Hessel and Harry Patrinos. 2004. Financing Lifelong Learning. Washington DC. The World Bank.
Psacharopoulos, George and Harry Patrinos. 2002. Returns to Investment in Education: A Further Update. Washington DC. The World Bank.
Reschovsky, Andrew. 2009. Measuring the Costs of Providing a Basic Education to All Learners: Lessons from the International Literature. A Report Prepared for the Financial and Fiscal Commission. Republic of South Africa.
Reinikka, Ritva and Jakob Svensson. 2004. The Power of Information: Evidence from a Newspaper Campaign to Reduce Capture. Washington DC. The World Bank.
Rice, Jennifer King and Amy Ellen Schwartz. 2008. Toward an Understanding of Productivity in Education. Edited by H. Ladd and E. Fiske, Handbook of Research in Education Finance and Policy, pp. 131‐145.
Rogers, Halsey. 2008. Aid Effectiveness in Education: Setting Priorities in a Time of Crisis. Washington DC. The World Bank
Sandström, Mikael and Bergström, Fredrik. 2005. School Vouchers in Practice: Competition Will Not
Hurt You. Journal of Public Economics, 89 (2‐3), pp. 351‐380.
Schultz, T. Paul. 2004. School Subsidies for the Poor: Evaluating the Mexican Progresa Poverty Program. Journal of Development Economics, 74(1), pp. 199‐250.
Trucano, Michael. 2005. Knowledge Maps: ICT in Education. Washington, DC: infoDev / World Bank.
Tsang, Mun C. 1996. Financial Reform of Basic Education in China. Economics of Education Review, 15(4), pp. 423‐444.
Vegas, Emiliana and Jenny Petrow. 2008. Raising Student Learning in Latin America: The Challenge for the 21st Century. Washington, DC. The World Bank.
Woessman, Ludger. 2000. Schooling Resources, Educational Institutions and Student Performance: the International Evidence. Kiel Working Paper.
Woessman, Ludger. 2001. New Evidence on the Missing Resource‐Performance Link in Education. Kiel Working Paper 1051, Kiel Institute of World Economics, Kiel, Germany.
Woessmann, Ludger and Thomas Fuchs. 2004. What Accounts for International Differences in Student Performance? A Re‐examination using PISA data. Institute for the Study of Labor (IZA), Research Paper Series.

27
World Bank. 2004. World Development Report.
World Bank. 2010. Skills, not Diplomas—The Path for Education Reforms in ECA.

28
Annex 1: Summary of previous related initiatives UNESCO UIS and OECD’s World Education Indicators Program Financing EducationInvestments and Returns Objectives The World Education Indicators (WEI) program in general focuses on
consolidating basic education statistics, in addition to launching special projects to collect additional data on current and emerging education issues in the WEI countries.
Financing EducationInvestments and Returns seeks to provide evidence on the role of human capital and education in fostering economic well‐being
Financing EducationInvestments and Returns to document financing strategies that enable public and private educational stakeholders to increase their participation in education and share costs and benefits more equitably
Issues & topics covered
Investing in human capital and returns rationale for investment in education from a macroeconomic perspective
and at the individual level in terms of labor market outcomes past and future trends in education participation and attainment, and of
current investment in World Economic Indicators program countries impact of demographic constraints and policy goals on education
expenditure and the changes in levels of investment needed to achieve national policy goals
Public and Private roles in education overall levels of public and private resources for education in WEI
countries, including the distribution in spending across levels of education
rationale for public investment in education the roles of different levels of government in funding education state support for private provision of education private sector as a provider of education and source of educational
expenditure Country profiles: statistical snapshots of the education system in each of the 19
WEI country documenting the key indicators for each featured country and comparable data for other WEI and OECD countries
Data Data collected for report based on WEI/UNESCO/OECD/EUROSTAT annual data collection for education indicators. Government officials complete extensive electronic questionnaires based on various sources including: labor market surveys, population censuses, national household surveys, school censuses and financial data (national accounts) from government ministries that specialize in finance.
Sample population
All OECD & WEI countries. WEI countries covered in study include: Argentina, Brazil, Chile, China, Egypt, India, Indonesia, Jamaica, Jordon, Malaysia, Paraguay, Peru, Philippines, Russian Federation, Thailand, Tunisia, Uruguay, and Zimbabwe.
Officials from each country are asked to complete questionnaire based on entire national education system regardless of the ownership or sponsorship of the institution concerned and regardless of education delivery mechanism.
Relevant Link http://www.uis.unesco.org/ev_en.php?ID=5245_201&ID2=DO_TOPIC

29
Quality Counts 2010, Fresh Course, Swift Current (Education Week)Objectives To characterize, track, compare and rank the quality of education provided in the
50 U.S. states, plus the District of Columbia To inform researchers, legislators, policy makers, and practitioners of states’
efforts to improve the quality of education Modules focused on education policy include: the teaching profession; and
standards, assessments and accountability Performance–focused modules include: school finance and the Chance for Success
index (role of education in promoting outcomes at each stage of life—early childhood, formal k‐12 education and adult educational attainment and workforce outcomes)
Issues & topics covered
The “School Finance” module tracks state performance on eight distinct measures of equity and spending, which are among the most commonly employed in the field of education finance. These measures include:
Equity measures: wealth neutrality score; McLoone Index; coefficient of variation; and restricted range ratio
Spending measures: per‐pupil expenditures (PPE) adjusted for regional cost differences; percent of students in districts with PPE at or above U.S. average, spending index and percent of total taxable resources spent on education
Data The Education Projects in Education (EPE) Research Center distributed electronic surveys to all chief state school officers in the 50 states and the District of Columbia in June of 2009.
Respondents were asked to answer the questions and provide appropriate documentation to verify that the reported policies were in place at the time of the survey or for the 2009/10 school year. Such documentation might include state statues, administrative rules, or Web links for information on line.
To check the accuracy of information and that consistent standards were applied uniformly across the states, EPE Research Center evaluated each state’s responses and documentary evidence over a 12‐week period. This process often included discussions with the respondents. In the absence of documentation, the center did not reward credit or assume that the policy was in place.
In the final quarter of 2009, the EPE Research Center sent each chief state school the completed survey indicating the state’s initial responses and the independent determinations by the center based on the available evidence. Officials in the state were asked to review the final answers and supply corrections and/or changes supported by additional documentation.
Sample population
The 50 U.S. states, plus the District of Columbia, with a focus on public education in those states.
Relevant Link http://www.edweek.org/ew/toc/2010/01/14/index.html

30
The World Bank’s Per Student Financing of General Education in Europe and Central Asia. Has it Delivered on its Promise?
Objectives To review the experiences with per student financing of general education in six countries in the Europe and Central Asia region in effort to learn which outcomes were achieved and how they were achieved
Issues & topics covered
Influence of per student financing on: efficiency; transparency; accountability including schools’ management capacity and financial autonomy; equity and education quality
Key design issues of per student financing formulas Data Data for this initiative is collected through case studies. The approach of relying
on case studies entails certain trade‐offs. On the one hand, in‐depth knowledge of the experience of the six countries is available and documented in the individual case studies. On the other, any generalizations across the entire ECA region will require additional nuances based on individual country scenarios and specificities.
Sample population
The six case study countries include: Armenia, Estonia, Georgia, Lithuania, Poland and the Russia Federation. These countries were chosen due to their long experience with implementing per student financing and with the hope that this in turn would increase the likelihood of observing outcomes of per student financing. An attempt was made at geographical variation across the ECA region as well.
Relevant Link http://siteresources.worldbank.org/INTECALEA/Resources/KB_June_09_v6.pdf

31
Annex 2: Outline of Conceptual Questions for Policy Goals and Areas
Education Finance Policy Goals
I. Ensuring Adequacy a. Are basic educational inputs provided to all students? b. Are current spending levels and patterns adequate to achieve basic levels of student
outcomes for all (on average, by group)? c. Is public education spending predictable, stable, and responsive to changes in
student population? II. Promoting Equity
a. Does the public sector provide more resources to students from disadvantaged backgrounds?
b. Are required household payments for schooling high relative to household incomes ‐‐ particularly among low income households?
III. Performing Efficiently a. Do allocation mechanisms encourage accountability in the use of funding by
government levels and schools? b. Is there public sector capacity‐‐in terms of human resources and information
management‐‐for education finance policy‐making?

32
Education Finance Core Areas
I. School conditions and resources a) What are the basic financing conditions of the basic education sector? b) Do construction standards exist? c) What specific policies have been pursued in the last 5 years to ensure that schools have
minimum infrastructure and learning materials? II. Education spending
a) How big is the education sector? b) How much of the total public education budget is allocated to different levels of education? c) How much is spent per student at each level of education? d) How much is spent on different inputs? e) What proportion of education spending goes to privately‐managed schools? f) On average, what proportion of privately‐managed schools' operating budgets is received
from the public sector? g) How does spending per student vary within country and across groups of students? h) Are there any specific government programs to provide incentives to households for
children to attend or complete school? III. Revenue sources
a) Where do revenues for education expenditure come from? b) Of the public share, how are these revenues generated? c) What revenue sources are schools authorized to use or prohibited from using (e.g. fees,
rentals, advertisements, private contributions, PTA contributions) d) Does the public sector raise funds for education through school fees? e) Does a stabilization fund exist for education?
IV. Allocation mechanisms a) Each year, at the national or subnational level, how is the decision made about how much is
going to be spent on education? b) What determines the distribution of public sector funding for education to lower levels of
government and to schools (public & government dependent private)? c) How much discretion do local or subnational governments have over education resources? d) How much discretion do schools have over education resources?
V. Fiscal control & capacity a) What percentage of budgeted resources is spent? b) What type of budgeting system is used? c) What are systems in place to track and/or audit the transfer of resources to different levels
of government and to schools? d) What is the capacity for planning and monitoring the education budget?

33
Annex 3: Potential indicators and sources for Policy Goals Policy Goal Policy Lever Measure Potential Indicator(s)
1. A
dequacy
1. Are basic educational inputs provided to all students?
a)What are those inputs?
Facilities: building, hygienic facilities, electricity
Students per classroom and per teacher
Teacher resources: qualified teachers and school leaders
Teaching materials: ICTs, textbooks, supplies, media center (library)
Safe school environment for students
School feeding programs where needed
b)What is the national coverage, and by student characteristics/regional differences?
Essential characteristics: urban/rural; socio‐economic; regional (possible proxy for language, ethnicity, religion)
Additional characteristics: gender; by education level
2. Are current spending levels and patterns adequate to achieve basic levels of student outcomes for all (on average, by group)?
a) Education spending as a % of GDP in relation to student outcomes overall and by group, controlling for inequality and illiterate adults, compared to predicted trends
Public education spending as a % of GDP
Student outcomes overall and by group
Inequality
Illiterate adults
Outcome trends predicted by GDP
b) What is an adequate outcome? Completion rates
Proficient level in international exam
3. Is public education spending predictable, stable, and responsive to changes in student population?
a) Total stability in spending: spending per pupil over time in constant terms
Spending per pupil over time in constant terms
Variability around a trend line
b) Is the system designed to promote stability compared to high performing countries?
Types of revenue sources
Are there dedicated sources of revenue?
Stabilization funds for education
Reliance on international funding

34
Policy Goal Policy Lever Measure Potential Indicator(s)
2. Equity
1. Does the public sector provide more resources to students from disadvantaged backgrounds?
a) Is there variation in spending per student in dollars and inputs by regions or for different groups of students?
Per pupil spending overall and across groups
b) Is the variation in funding responsive to the greater challenges of educating disadvantaged students?
Per pupil spending overall and across groups
c) Is there a system to identify differences among students, by region? Student socio‐economic background? Learning differences? Gender? Special needs? Native language?
Does a system exist?
d) Are there school financing policies or programs designed to compensate for disadvantaged students?
If public expenditure is allocated by formula, for the formula that accounts for the largest share of spending allocation, what is the formula's goal; describe the formula
e) What % of total education spending is differentiated in a compensatory way?
If public expenditure is allocated by formula, for the formula that accounts for the largest share of spending allocation, what is the formula's goal; describe the formula
Total public expenditure
f) How substantial is the degree of differentiation? Variation in compensatory funding from average per pupil expenditure
g) How are students with disabilities or special needs addressed?
Special schools or differentiated funding
2. Are required household payments for schooling high relative to household incomes ‐‐ particularly among low income households?
a)Primary schooling costs as a % of income for the lowest income quintile
Average household expenditure on education as a % of total household spending by level of education and economic quintile
b)Secondary schooling costs as a % of income for the lowest income quintile
Average household expenditure on education as a % of total household spending by level of education and economic quintile
c) Is there a policy of no primary school fees and what does it include?
Is there a policy related to primary school fees?
d) What is the fee policy for secondary schools and what is included?
What is the fee policy for secondary schools?

35
Policy Goal Policy Lever Measure Potential Indicator(s)
3. Efficiency
1. Do allocation mechanisms encourage accountability in the use of funding by government levels and schools?
a) Are resources reaching the point of service delivery and ultimately students as beneficiaries?
Do schools operate regularly throughout the school year?
Are teachers and school leaders present?
Are substitute teachers provided when teachers are absent?
Are books and other materials in classrooms?
What proportion of national and subnational budgets are allocated to schools?
Are the allocated school budgets reaching the schools?
b) Budget
Is performance‐based budgeting used at the national or subnational level (activity and/or results based)?
If used, for what share of the budget?
c) Transparency (at central to subnational, subnational to schools)
Negotiated or formula?
Complexity of formula
d) Reporting arrangements Are there reporting arrangements? If so, what must be reported?
e) Auditing systems
Is there an internal audit procedure for financing and personnel at a national and subnational level?
Is there an effective system to monitor teacher attendance?
2. Is there public sector capacity‐‐in terms of human resources and information management‐‐for education finance policy‐making?
a) What are the qualifications requirements for personnel in auditing and monitoring positions?
What are the qualifications requirements for personnel in auditing and monitoring positions?
Share of qualified personnel in auditing or monitoring positions
Ratio of professional to total staff in national or subnational office
Are schools leaders trained in budget management?
b) Are there electronic systems to track resources? What specific resources are tracked?
What systems are used for reporting the transfer of public resources? (electronic/paper based)
c) Are there standards for school construction quality? What steps are taken to monitor compliance with these standards?
Do construction standards for schools exist? How are they enforced?
d) How are teachers paid? Are teacher salaries paid electronically, by check, or by cash?
How regularly are teacher salaries paid?
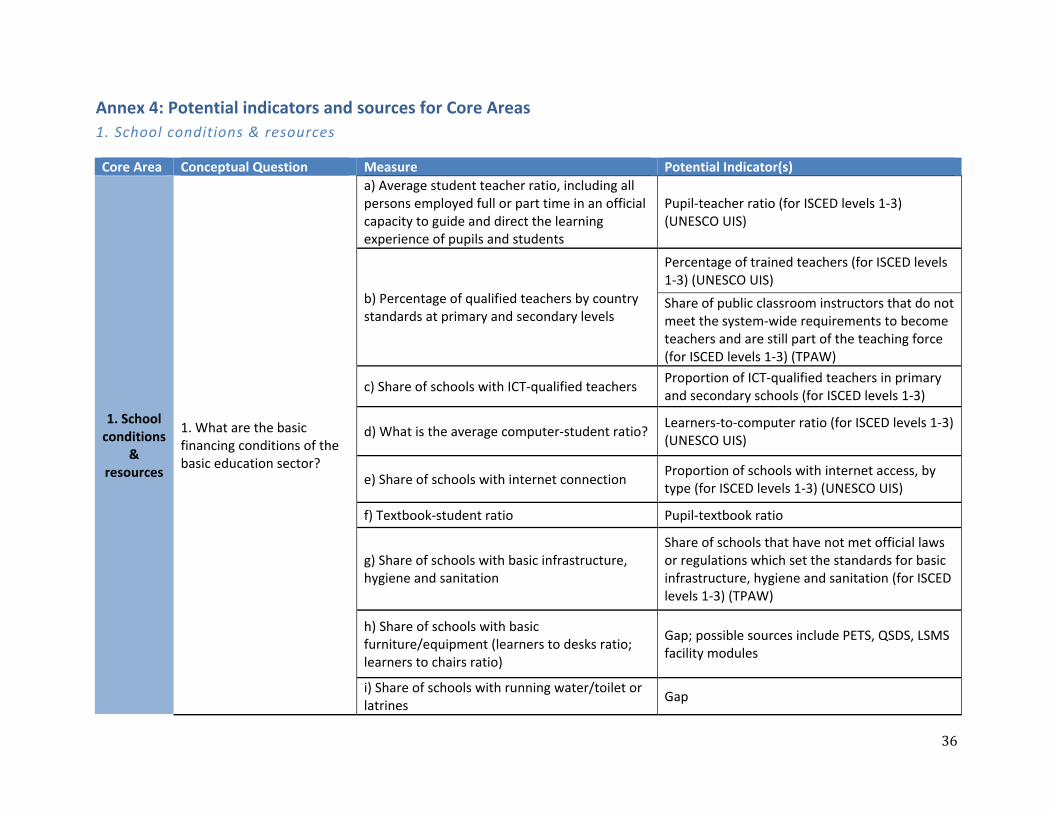
36
Annex 4: Potential indicators and sources for Core Areas
1. School conditions & resources
Core Area Conceptual Question Measure Potential Indicator(s)
1. School conditions
& resources
1. What are the basic financing conditions of the basic education sector?
a) Average student teacher ratio, including all persons employed full or part time in an official capacity to guide and direct the learning experience of pupils and students
Pupil‐teacher ratio (for ISCED levels 1‐3) (UNESCO UIS)
b) Percentage of qualified teachers by country standards at primary and secondary levels
Percentage of trained teachers (for ISCED levels 1‐3) (UNESCO UIS)
Share of public classroom instructors that do not meet the system‐wide requirements to become teachers and are still part of the teaching force (for ISCED levels 1‐3) (TPAW)
c) Share of schools with ICT‐qualified teachers Proportion of ICT‐qualified teachers in primary and secondary schools (for ISCED levels 1‐3)
d) What is the average computer‐student ratio? Learners‐to‐computer ratio (for ISCED levels 1‐3) (UNESCO UIS)
e) Share of schools with internet connection Proportion of schools with internet access, by type (for ISCED levels 1‐3) (UNESCO UIS)
f) Textbook‐student ratio Pupil‐textbook ratio
g) Share of schools with basic infrastructure, hygiene and sanitation
Share of schools that have not met official laws or regulations which set the standards for basic infrastructure, hygiene and sanitation (for ISCED levels 1‐3) (TPAW)
h) Share of schools with basic furniture/equipment (learners to desks ratio; learners to chairs ratio)
Gap; possible sources include PETS, QSDS, LSMS facility modules
i) Share of schools with running water/toilet or latrines
Gap

37
j) Share of schools with library/media center Gap
k) Students per classroom Gap
l) Physical conditions of schools (infrastructure) Gap
m) Safe school environment for students Gap
n) School feeding programs where needed Gap
o) Percentage of qualified school leaders Gap
p) Do schools operate regularly throughout the school year?
Gap
q) Are books and other materials in classrooms? Gap
1. School conditions
& resources
2. Do construction standards exist?
a) What are school construction standards? How are they enforced?
Gap
1. School conditions
& resources
3. What specific policies have been pursued in the last 5 years to ensure that schools have minimum infrastructure and learning materials?
a) Description of specific policies Gap
2. Education spending
Core area Conceptual Question Measure Potential Indicator(s)
2. Education spending
1. How big is the education sector?
a) Total exp on education as a % of GDP
Public exp on education as a % of GDP (UIS)
b) Total public education exp as a % of public spending
Public exp on education as a % of gov't spending (UIS)

38
2. Education spending
2. How much of the total public education budget is allocated to different levels of education?
a) Public exp on pre‐primary education as a % of total public education exp
Public exp on pre‐primary education as a % of total public education exp (UIS)
b) Public exp on primary education as a % of total public education exp
Share of public exp for primary education as a % of total education exp (UIS)
c) Public exp on secondary education as a % of total public education exp
Share of public exp for secondary education as a % of total education exp (UIS)
d) Public exp for tertiary education as a % of total public education exp
Share of public exp for tertiary education as a % of total education exp (UIS)
2. Education spending
3. How much is spent per student at each level of education?
a) Public exp per student as a % of GDP per capita, all levels
Public exp per student as a % of GDP per capita, all levels (UIS)
b) Public exp per student as a % of GDP per capita, primary
Public exp per student as a % of GDP per capita, primary (UIS)
c) Public exp per student as a % of GDP per capita, secondary
Public exp per student as a % of GDP per capita, secondary (UIS)
d) Public exp per student as a % of GDP per capita, tertiary
Public exp per student as a % of GDP per capita, tertiary (UIS)
e) Public exp per student (PPP), total Gap; can be calculated from available data
f) Public exp per student (PPP), primary
Gap; can be calculated from available data
g) Public exp per student (PPP), secondary
Gap; can be calculated from available data
h) Public exp per student (PPP), tertiary
Gap; can be calculated from available data
i) Average household expenditure on education as a % of total household spending by level of education & economic quintile
Average household expenditure on education as a % of total household spending by level of education and economic quintile (LSMS)

39
j) Private exp per pupil for educational programs outside the formal sector, e.g. tutoring, exam prep programs, total
Gap; possible sources include Mark Bray, or prevalence of tutoring in annex of paper (http://wbro.oxfordjournals.org/content/23/2/161.full.pdf+htmlJ)
k) Spending per pupil over time in constant terms
Gap; can be calculated from available data
2. Education spending
4. How much is spent on different inputs?
a) Public education exp on capital as a % of total public education exp
Education exp by nature of spending as a % of total education exp on public institutions (ISCED 1‐4), Capital (UIS)
b) Public education exp on current as a % of total public education exp
Education exp by nature of spending as a % of total education exp on public institutions (ISCED 1‐4), current (UIS)
Public current education exp , % of total education exp (EdStats)
c) Public education exp on other, non personnel as a % of current spending
Education exp by nature of spending as a % of total education exp on public institutions (ISCED 1‐4), other current (UIS)
Current education exp on teaching materials (%), primary (EdStats)
Current education exp on teaching materials (%), secondary (EdStats)
d) Public current expenditure, % of current, at primary, secondary, and tertiary levels
Public current education exp (% current education exp), primary (EdStats)
Public current education exp (% current education exp), secondary (EdStats)
Public current education exp (% current education exp), tertiary (EdStats)

40
e) Public education exp on salaries as a % of total public education exp
Education exp by nature of spending as a % of total education exp on public institutions (ISCED 1‐4), salaries (UIS)
Exp on teachers' compensation in public institutions (% current education exp) (EdStats)
Average annual wage bill per teacher (including benefits) as a percentage of GDP (civil servants, non‐civil service teachers) (FTI Appraisal)
Salary of first year public school teacher with minimum education required according to teacher salary scale (TPAW)
Salary of public school teacher with 15 years experience and minimum education required according to teacher salary scale (TPAW)
Average salary of public school teacher (TPAW)
Average total compensation package of public school teachers including salary and non‐salary benefits (TPAW)
g) Public education exp on salaried, non‐teaching personnel as a % of current spending
Gap
2. Education spending
5. What proportion of education spending goes to privately‐managed schools?
a) Public education exp on private government‐dependent schools as a % of total education (public and privately‐managed schools) exp, by level of education
Gap
Relative proportions of public and private expenditure on educational institutions (private, public, government‐dependent private & independent private), by level of education (OECD)

41
2. Education spending
6. How does spending per student vary within country and across groups of students?
a) Variation in (public and private) exp per student by municipality/district
Total public exp per student by municipality/district (BOOST)
b) Enrollment figures in different types of institutions (private/public) for each level of education, by group (SES, ethnicity, rural/urban, gender)
Enrollment figures in different types of institutions (private/public) for each level of education, by group (SES, ethnicity, rural/urban) (household survey)
c) Household spending on education for different types of institutions (public/private) for each level
Household spending on education for different types of institutions (public/private) for each level of education, by group. (Household Survey)
d) Variation in per pupil spending by groups (previously named) of students
Gap
e) Is there a system to identify differences among students, by region? Student socio‐economic background? Learning differences? Special needs? Native language?
Gap; possible sources include CSR, PER
f) How are students with special needs addressed?
Gap
2. Education spending
7. Are there any specific government programs to provide incentives to households for children to attend or complete school?
a) Specific government programs to provide incentives to households for children to attend or complete school
Gap
b) If a program exists, what is the education requirement?
Gap

42
3. Revenue sources
Policy Area Conceptual Question Measure Potential Indicator(s)
3. Revenue sources
1. Where do revenues for education expenditure come from?
a) Exp share of total public education revenue Total expenditure on educational institutions and administrations as a percentage of GDP, public sources, by level (UIS)
b)Exp share of total private education revenue Total expenditure on educational institutions and administrations as a percentage of GDP, private sources, by level (UIS)
c) Exp share of total (private and public) education revenues—International agencies incl. foreign donors
Total expenditure on educational institutions and administrations as a percentage of GDP, international sources, by level (UIS)
d) Exp share of total private education revenues by source—households, private organizations incl. religious & NGOs
Gap
3. Revenue sources
2. Of the public share, how are these revenues generated?
a) Share by government level for current costs, capital costs, and teacher salaries
Central and local revenues share of total education expenditure (BOOST)
b) At the lowest subnational level that provides education, what percentage comes in the form of transfers from a higher level? What percentage comes from own source revenue?
Gap; possible source UIS
c) Is the lowest subnational level authorized/encouraged/required/prohibited to raise funds for education?
Gap
d) What are the sources of own source revenue (fees, property/land/ income/consumption taxes, others)?
Gap
e) Are there dedicated sources of revenue? Gap

43
3. Revenue sources
3. What revenue sources are schools authorized to use or prohibited from using (e.g. fees, rentals, advertisements, private contributions, PTA contributions?
a) What sources are schools authorized to use? Gap
3. Revenue sources
4. Does the public sector raise funds for education through school fees?
a) If school fees, individuals with authority/right to set school fees, by level of education
Gap
b) Are there mandatory waivers for some students? If so, who finances?
Gap
c) If school fees, individual with authority to collect fees, by level of education
Gap
d) For what can school fees be used? Are they left at the discretion of the collector?
Gap
e) Levels/grades provided free of charge Gap
f) Is there a policy of no primary school fees and what does it include?
Gap
g) What is the fee policy for secondary schools and what is included?
Gap
h) Frequency of illegal charges for publicly provided education services, by level of education
Gap (This will be difficult to capture given who will be responding to the questionnaire.)
3. Revenue sources
5. Does a stabilization fund exist for education?
a) What are the conditions that enable use of the stabilization fund?
Gap
b) What is the source of the stabilization fund? Gap
6. Is international aid integrated effectively into budgets?
a) Do donors use country systems (financial management, procurement, etc.) when they disburse aid?
a) Share of aid that uses country systems (from the Paris Declaration Monitoring Indicators?)
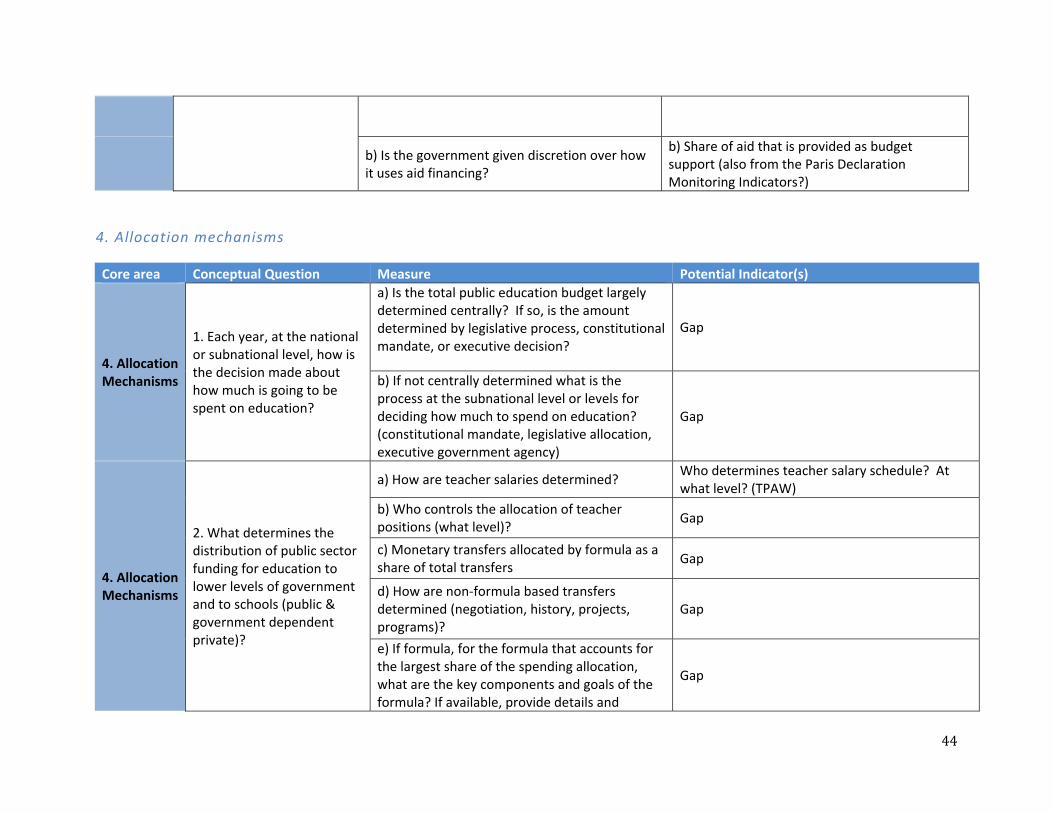
44
b) Is the government given discretion over how it uses aid financing?
b) Share of aid that is provided as budget support (also from the Paris Declaration Monitoring Indicators?)
4. Allocation mechanisms
Core area Conceptual Question Measure Potential Indicator(s)
4. Allocation Mechanisms
1. Each year, at the national or subnational level, how is the decision made about how much is going to be spent on education?
a) Is the total public education budget largely determined centrally? If so, is the amount determined by legislative process, constitutional mandate, or executive decision?
Gap
b) If not centrally determined what is the process at the subnational level or levels for deciding how much to spend on education? (constitutional mandate, legislative allocation, executive government agency)
Gap
4. Allocation Mechanisms
2. What determines the distribution of public sector funding for education to lower levels of government and to schools (public & government dependent private)?
a) How are teacher salaries determined? Who determines teacher salary schedule? At what level? (TPAW)
b) Who controls the allocation of teacher positions (what level)?
Gap
c) Monetary transfers allocated by formula as a share of total transfers
Gap
d) How are non‐formula based transfers determined (negotiation, history, projects, programs)?
Gap
e) If formula, for the formula that accounts for the largest share of the spending allocation, what are the key components and goals of the formula? If available, provide details and
Gap

45
documentation
f) Are there conditions associated with formula funding (matching, categorical, targeted)?
Gap
4. Allocation Mechanisms
3. How much discretion do local or subnational governments have over education resources?
a) If there are monetary transfers from a higher level of government, are transfers earmarked for education?
Gap
b) Are there restrictions on the use of own source revenue?
Gap
4. Allocation Mechanisms
4. How much discretion do schools have over education resources?
a) Of the proportion that schools raise and have exclusive control, for what purposes can these resources be used?
Gap
b) Are there any restrictions over the use of revenues raised by the schools?
Gap
c) On average, over what proportion of total resources (including personnel, supplies, maintenance, utilities) do schools have control?
Gap
d) Who makes allocation decisions for school budgets (local government, principal, board, parents)?
Gap
e) What proportion of national and subnational budgets are allocated to schools?
Gap
5. Fiscal control & capacity
Core area Conceptual Question Measure Potential Indicator(s)
5. Fiscal control & capacity
1. What percentage of budgeted resources are spent?
a) By level of government
Aggregate expenditure outturn compared to original approved budget (PEFA)
Resources spent as a % of budgeted resources, total & by level of government (BOOST)

46
b) By capital/current
Capital resources spent as a % of budgeted resources, by level of government (BOOST)
Current resources spent as a % of budgeted resources, by level of government (BOOST)
c) By major expenditure category
Education resources spent as a % of total budgeted resources for education, by major expenditure category—teacher salaries, non salaried current inputs, maintenance (BOOST)
5. Fiscal control & capacity
2. Are the allocated school budgets reaching the schools?
a) Measure of leakage Gap
5. Fiscal control & capacity
3. What type of budgeting system is used?
a) For each government level that has decision making authority over the composition of education budgets, what type of system do they use to determine budgetary allocation (line item, activity‐based, program‐based, performance‐based) for main categories of expenditure? (possibly PEFA)
Gap
b) If performance‐based, what proportion of the total budget is allocated in this way?
Gap
c) Is there a formal capital budgeting system? Gap
5. Fiscal control & capacity
4. What are systems in place to track and/or audit the transfer of resources to different levels of government and to schools?
a) Do resources reach the point of service delivery?
Availability of information on resources received by service delivery units (PEFA)
b) Payroll characteristics Effectiveness of payroll controls (PEFA)
c) What systems are used for reporting the transfer of public resources? (electronic/paper based)
Gap
d) Are teacher salaries paid electronically, by check, or cash? How regularly?
Gap
e) Are teachers and school leaders present? Gap

47
f) Is there a system to monitor teacher attendance?
Gap
g) Are substitute teachers provided when teachers are absent?
Gap
j) Which actors are required to report on the use of public resources for education?
Gap
k) To whom are the actors required to report on the use of public resources for education?
Gap
l) What are the actors required to report? Gap
m) Frequency with which actors must report on the use of public resources for education
Gap
n) Are internal audits conducted by the school or local government?
Gap
o) Frequency with which internal audits are conducted
Gap
p) Are education audit results made available to the public?
Gap
q) Are the audits required to follow international standards? (International Association of Auditors?)
Gap
r) How is compliance with school construction standards monitored? Are there consequences for not meeting these standards? If so, what are they?*
Gap
5. Fiscal control & capacity
5. What is the capacity for planning and monitoring the education budget?
a) Who is responsible for planning and monitoring the education budget at the national and subnational level?
Gap
b) Are there qualification requirements for personnel in auditing and monitoring positions?
Gap
d) Ratio of professional to total staff in national or subnational office
Gap

48
e) Is there a training system in place for school staff and community representatives responsible for planning and monitoring education budgets for the school?
Gap
f) Are schools leaders trained in budget management?
Gap
g) What are the qualifications requirements for personnel in auditing and monitoring positions?
Gap
i The focus of the initiative is on basic education, which comprises primary and secondary (non‐technical) education.