Education and Training Monitor 2017 - Finland and Training Monitor 2017 Finland 2 LATVIA Education...
15
Education and Training Education and Training Monitor 2017 Finland
Transcript of Education and Training Monitor 2017 - Finland and Training Monitor 2017 Finland 2 LATVIA Education...

Education andTraining
Education and Training Monitor 2017
Finland

Europe Direct is a service to help you find answers to your questions about the European Union.
Freephone number (*):00 800 6 7 8 9 10 11
(*) The information given is free, as are most calls (though some operators, phone boxes or hotels may charge you).
More information on the European Union is available on the internet (http://europa.eu).Cataloguing data can be found at the end of this publication.
Luxembourg: Publications Office of the European Union, 2017
© European Union, 2017Reuse is authorised provided the source is acknowledged. The reuse policy of European Commission documents is regulated by Decision 2011/833/EU (OJ L 330, 14.12.2011, p. 39).For any use or reproduction of photos or other material that is not under the EU copyright, permission must be sought directly from the copyright holders.
PDF ISBN 978-92-79-69996-2 - ISSN 2466-9997 - DOI 10.2766/689673 - NC-AN-17-011-EN-N
Cover image: © Shutterstock.com
EUROPEAN COMMISSION 1
2017 Directorate-General for Education and Culture EN
Education and Training Monitor 2017
Finland

2 LATVIA
Education and Training Monitor 2017 – Country analysis November 2017
Volume 2 of the Education and Training Monitor 2017 includes twenty-eight individual country reports. It builds on the most up-to-date quantitative and qualitative evidence to present and assess the main recent and ongoing policy measures in each EU Member State, with a focus on
developments since mid-2016. It therefore complements other sources of information which offer descriptions of national education and training systems. Section 1 presents a statistical overview of the main education and training indicators. Section 2 briefly identifies the main strengths and challenges of the country’s education and training system. Section 3 focuses on drivers of inequalities in education and measures to promote inclusion, building in particular on evidence from the OECD's 2015 Programme for International Skills
Assessment (PISA), as well as recent developments in early school leaving and early childhood education and care. Section 4 looks at investment in education and training. Section 5 deals with policies to modernise school education, covering, inter alia, the teaching profession, digital and language skills. Section 6 discusses measures to modernise higher education. Finally, section 7 covers vocational education and adult learning.
The manuscript was completed on 15 September 2017. Additional contextual data can be found online (ec.europa.eu/education/monitor)

FINLAND 3
Education and Training Monitor 2017 – Country analysis November 2017
1. Key indicators
Sources: Eurostat (see section 9 for more details); OECD (PISA). Notes: data refer to weighted EU average, covering a different
numbers of Member States depending on the source; b = break in time series, d = definition differs, e = estimated, p =
provisional, u = low reliability, 12 = 2012, 14 = 2014, 15 = 2015. On learning mobility, the EU average is calculated by DG
EAC based on available country data in all years. Further information is found in the respective section of Volume 1 (ec.europa.eu/education/monitor). For ECEC there is a break in the time series between 2012 and 2015. 2012 family day care
not included. 2015 family day care included.”
Figure 1. Position in relation to strongest (outer ring) and weakest performers (centre)
Source: DG Education and Culture calculations, based on data from Eurostat (LFS 2016) and OECD (PISA 2015). Note: all
scores are set between a maximum (the strongest performers visualised by the outer ring) and a minimum (the weakest
performers visualised by the centre of the figure).
2013 2016 2013 2016
9.3% 7.9% 11.9% 10.7%
45.1% 46.1% 37.1% 39.1%
75.1% 12 83.6% 15 93.9% 12 94.8% 15
11.3% 12 11.1% 15 17.8% 12 19.7% 15
12.3% 12 13.6% 15 22.1% 12 22.2% 15
7.7% 12 11.5% 15 16.6% 12 20.6% 15
ISCED 3-8 (total) 79.8% 77.4% 75.4% 78.2%
24.9% 26.4% 10.7% 10.8%
6.4% 6.2% 15 5.0% 4.9% 15
ISCED 1-2 €7 512 €7 675 14 : : 14
ISCED 3-4 €6 502 €6 396 14 : : 14
ISCED 5-8 €13 223 €13 065 14 : : 14
8.9% 7.6% 11.0% 9.8%
17.4% u 15.1% u 21.9% 19.7%
46.4% 47.8% 37.8% 39.9%
32.7% 32.3% 33.4% 35.3%
75.9% 75.5% 69.4% 72.6%
85.7% 80.4% 80.7% 82.8%
5.1% 5.6% 15 5.5% 6.0% 15
8.9% 10.4% 15 13.6% 15.1% 15
Employment rate of recent graduates
by educational attainment
(age 20-34 having left education 1-3
years before reference year)
ISCED 3-4
ISCED 5-8
Learning mobility
Inbound graduates mobility (bachelor)
Inbound graduates mobility (master)
Early leavers from education and
training (age 18-24)
Native-born
Foreign-born
Tertiary educational attainment
(age 30-34)
Native-born
Foreign-born
Employment rate of recent graduates
by educational attainment
(age 20-34 having left education 1-3
years before reference year)
Adult participation in learning
(age 25-64)ISCED 0-8 (total)
Other contextual indicators
Education investment
Public expenditure on education
as a percentage of GDP
Expenditure on public
and private institutions
per student in € PPS
Tertiary educational attainment
(age 30-34)Total
Early childhood education and care (ECEC)
(from age 4 to starting age of compulsory education)
Proportion of 15 year-olds with
underachievement in:
Reading
Maths
Science
Early leavers from education and
training (age 18-24)Total
Finland EU average
ET 2020 benchmarks
4 FINLAND
Education and Training Monitor 2017 – Country analysis November 2017
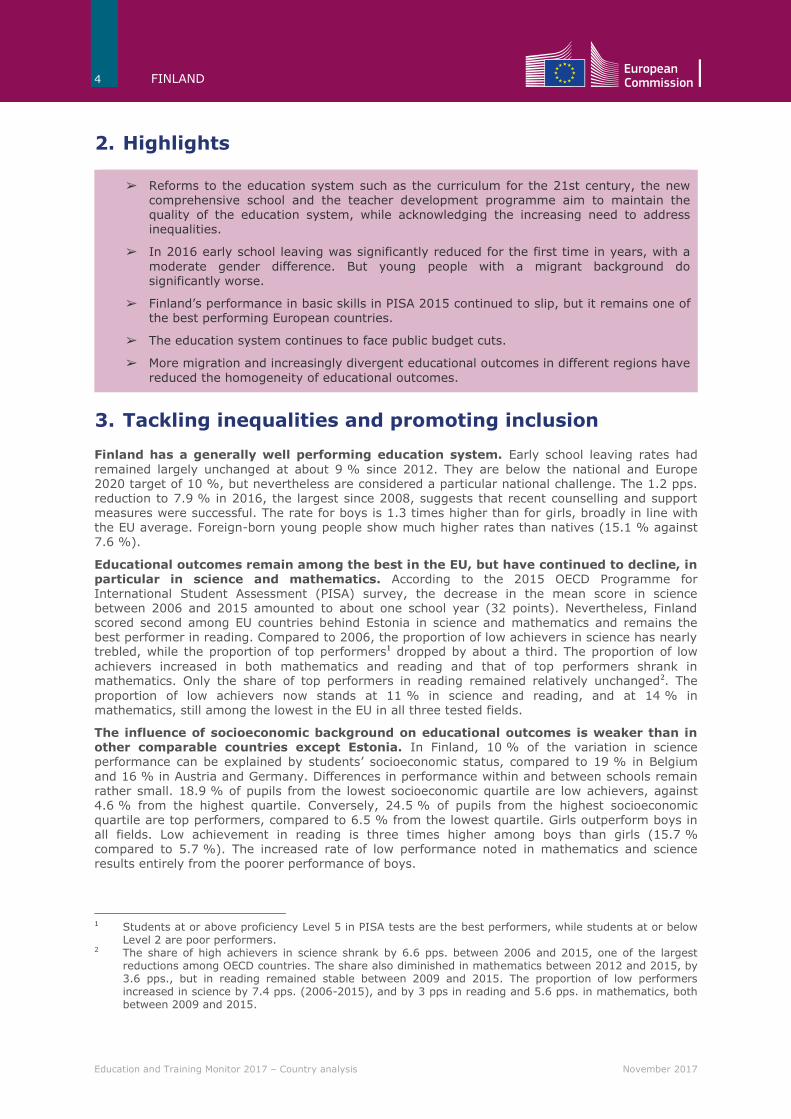
2. Highlights
➢ Reforms to the education system such as the curriculum for the 21st century, the new comprehensive school and the teacher development programme aim to maintain the quality of the education system, while acknowledging the increasing need to address inequalities.
➢ In 2016 early school leaving was significantly reduced for the first time in years, with a
moderate gender difference. But young people with a migrant background do significantly worse.
➢ Finland’s performance in basic skills in PISA 2015 continued to slip, but it remains one of the best performing European countries.
➢ The education system continues to face public budget cuts.
➢ More migration and increasingly divergent educational outcomes in different regions have
reduced the homogeneity of educational outcomes.
3. Tackling inequalities and promoting inclusion
Finland has a generally well performing education system. Early school leaving rates had
remained largely unchanged at about 9 % since 2012. They are below the national and Europe 2020 target of 10 %, but nevertheless are considered a particular national challenge. The 1.2 pps. reduction to 7.9 % in 2016, the largest since 2008, suggests that recent counselling and support measures were successful. The rate for boys is 1.3 times higher than for girls, broadly in line with the EU average. Foreign-born young people show much higher rates than natives (15.1 % against 7.6 %).
Educational outcomes remain among the best in the EU, but have continued to decline, in particular in science and mathematics. According to the 2015 OECD Programme for
International Student Assessment (PISA) survey, the decrease in the mean score in science between 2006 and 2015 amounted to about one school year (32 points). Nevertheless, Finland scored second among EU countries behind Estonia in science and mathematics and remains the best performer in reading. Compared to 2006, the proportion of low achievers in science has nearly trebled, while the proportion of top performers1 dropped by about a third. The proportion of low
achievers increased in both mathematics and reading and that of top performers shrank in mathematics. Only the share of top performers in reading remained relatively unchanged2. The
proportion of low achievers now stands at 11 % in science and reading, and at 14 % in mathematics, still among the lowest in the EU in all three tested fields.
The influence of socioeconomic background on educational outcomes is weaker than in other comparable countries except Estonia. In Finland, 10 % of the variation in science performance can be explained by students’ socioeconomic status, compared to 19 % in Belgium
and 16 % in Austria and Germany. Differences in performance within and between schools remain rather small. 18.9 % of pupils from the lowest socioeconomic quartile are low achievers, against 4.6 % from the highest quartile. Conversely, 24.5 % of pupils from the highest socioeconomic quartile are top performers, compared to 6.5 % from the lowest quartile. Girls outperform boys in
all fields. Low achievement in reading is three times higher among boys than girls (15.7 % compared to 5.7 %). The increased rate of low performance noted in mathematics and science results entirely from the poorer performance of boys.
1 Students at or above proficiency Level 5 in PISA tests are the best performers, while students at or below
Level 2 are poor performers. 2 The share of high achievers in science shrank by 6.6 pps. between 2006 and 2015, one of the largest
reductions among OECD countries. The share also diminished in mathematics between 2012 and 2015, by 3.6 pps., but in reading remained stable between 2009 and 2015. The proportion of low performers increased in science by 7.4 pps. (2006-2015), and by 3 pps in reading and 5.6 pps. in mathematics, both between 2009 and 2015.
FINLAND 5
Education and Training Monitor 2017 – Country analysis November 2017
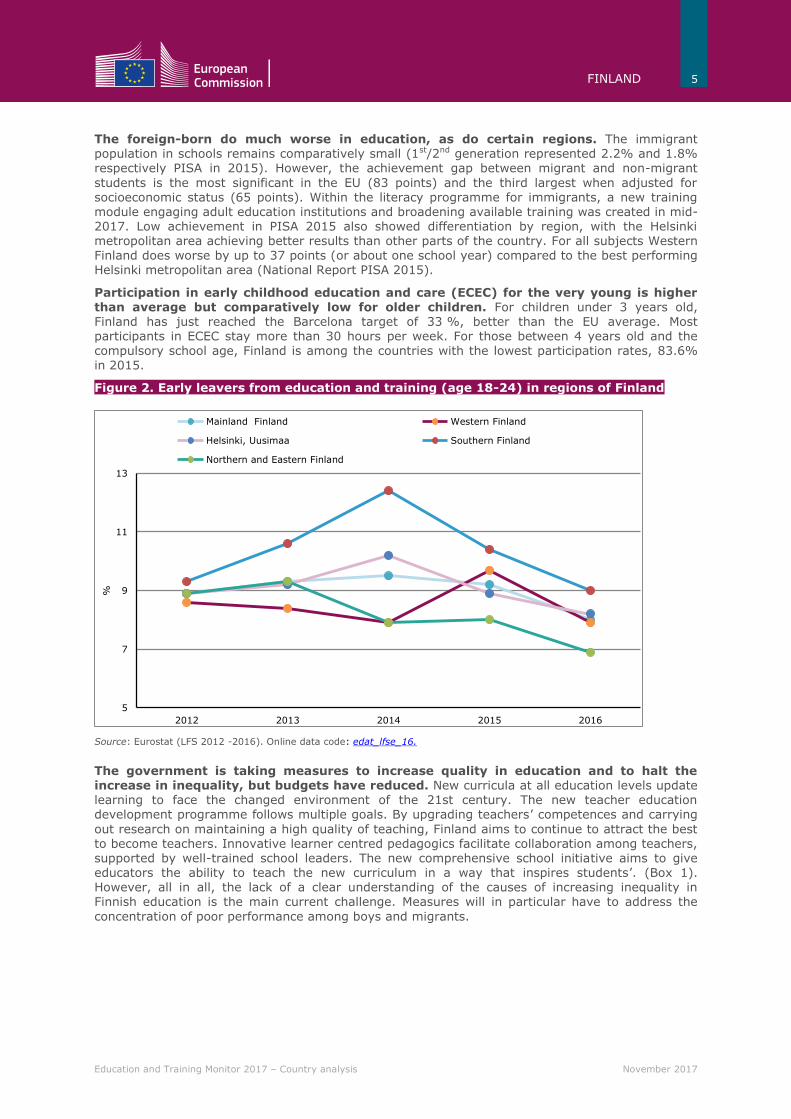
The foreign-born do much worse in education, as do certain regions. The immigrant population in schools remains comparatively small (1st/2nd generation represented 2.2% and 1.8% respectively PISA in 2015). However, the achievement gap between migrant and non-migrant
students is the most significant in the EU (83 points) and the third largest when adjusted for socioeconomic status (65 points). Within the literacy programme for immigrants, a new training module engaging adult education institutions and broadening available training was created in mid-2017. Low achievement in PISA 2015 also showed differentiation by region, with the Helsinki metropolitan area achieving better results than other parts of the country. For all subjects Western Finland does worse by up to 37 points (or about one school year) compared to the best performing Helsinki metropolitan area (National Report PISA 2015).
Participation in early childhood education and care (ECEC) for the very young is higher than average but comparatively low for older children. For children under 3 years old, Finland has just reached the Barcelona target of 33 %, better than the EU average. Most participants in ECEC stay more than 30 hours per week. For those between 4 years old and the
compulsory school age, Finland is among the countries with the lowest participation rates, 83.6% in 2015.
Figure 2. Early leavers from education and training (age 18-24) in regions of Finland
Source: Eurostat (LFS 2012 -2016). Online data code: edat_lfse_16.
The government is taking measures to increase quality in education and to halt the increase in inequality, but budgets have reduced. New curricula at all education levels update learning to face the changed environment of the 21st century. The new teacher education development programme follows multiple goals. By upgrading teachers’ competences and carrying
out research on maintaining a high quality of teaching, Finland aims to continue to attract the best to become teachers. Innovative learner centred pedagogics facilitate collaboration among teachers, supported by well-trained school leaders. The new comprehensive school initiative aims to give educators the ability to teach the new curriculum in a way that inspires students’. (Box 1). However, all in all, the lack of a clear understanding of the causes of increasing inequality in Finnish education is the main current challenge. Measures will in particular have to address the
concentration of poor performance among boys and migrants.
5
7
9
11
13
2012 2013 2014 2015 2016
%
Mainland Finland Western Finland
Helsinki, Uusimaa Southern Finland
Northern and Eastern Finland
6 FINLAND
Education and Training Monitor 2017 – Country analysis November 2017
Box 1: The new comprehensive school programme
The programme, with a budget of EUR 90 million in 2016, aims to make Finland the leading country for modern learning and inspiring education by 2020. The programme has three strands: teacher education, innovative pedagogy and local experimentation.
New comprehensive schools should create networks involving parents and other schools. Engaging the whole school community aims to generate a variety of local practices, allowing the best ones to be shared nationally and internationally. The vision for these new schools has been developed by experts and is to be introduced in 2017.
Based on the findings in a teacher forum, initial teacher education and continuing professional development will be amended in the teacher education development programme. Training will be better adapted to the actual skills and development needs of teachers and school heads. It will be supplemented by digital online content and mechanisms fostering more collaboration among
teachers.
A selection of concrete innovative educational approaches is being tested from the bottom up.
Results will be synthesised by the Finnish National Agency for Education. All comprehensive schools will be given tutor teachers to support their peers in new (digital) learning methods and collaborative teaching. EUR 7.5 million has been earmarked in 2016 to train and support 2 500 tutor teachers.
4. Investing in education and training
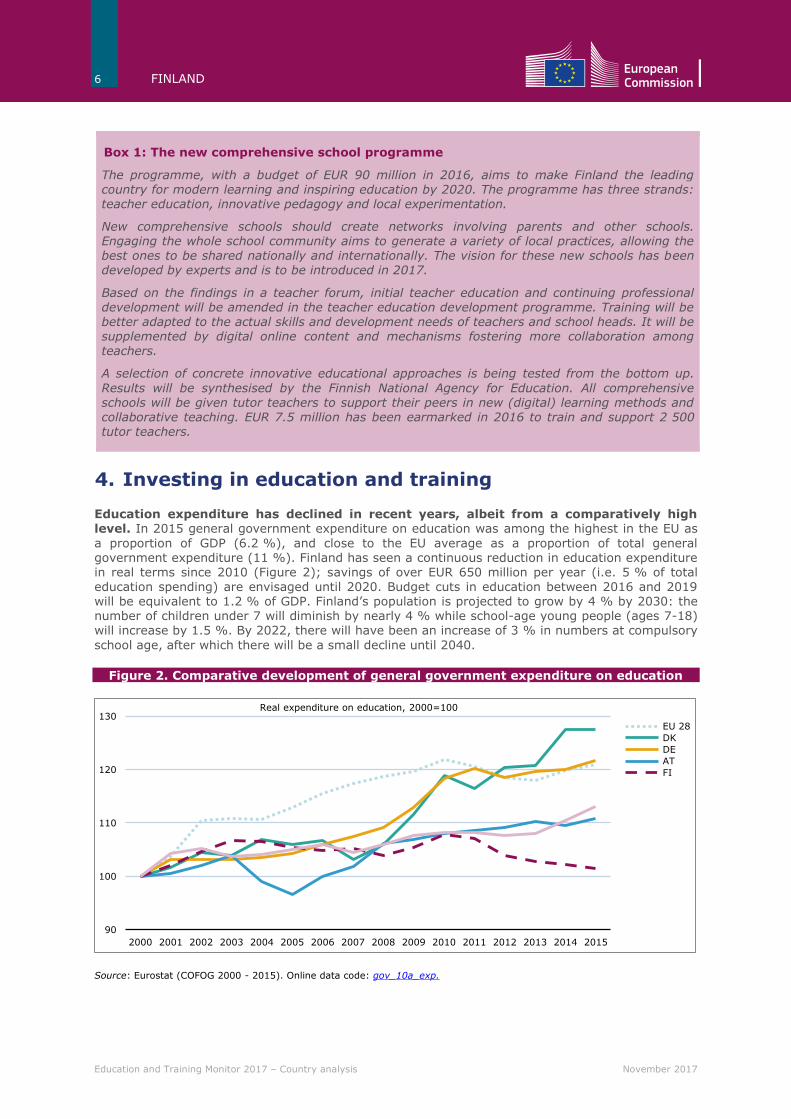
Education expenditure has declined in recent years, albeit from a comparatively high level. In 2015 general government expenditure on education was among the highest in the EU as
a proportion of GDP (6.2 %), and close to the EU average as a proportion of total general government expenditure (11 %). Finland has seen a continuous reduction in education expenditure in real terms since 2010 (Figure 2); savings of over EUR 650 million per year (i.e. 5 % of total
education spending) are envisaged until 2020. Budget cuts in education between 2016 and 2019 will be equivalent to 1.2 % of GDP. Finland’s population is projected to grow by 4 % by 2030: the number of children under 7 will diminish by nearly 4 % while school-age young people (ages 7-18) will increase by 1.5 %. By 2022, there will have been an increase of 3 % in numbers at compulsory
school age, after which there will be a small decline until 2040.
Figure 2. Comparative development of general government expenditure on education
Source: Eurostat (COFOG 2000 - 2015). Online data code: gov_10a_exp.
90
100
110
120
130
2000 2001 2002 2003 2004 2005 2006 2007 2008 2009 2010 2011 2012 2013 2014 2015
Real expenditure on education, 2000=100
EU 28
DK
DE
AT
FI

FINLAND 7
Education and Training Monitor 2017 – Country analysis November 2017
There are ongoing funding cuts in higher education. For the period 2017-2019 transfers to higher education institutions are being cut by EUR 75 million annually. In 2017 a special pharmacy tax compensation going to the Universities of Helsinki and of Eastern Finland was removed,
resulting in their state funding reduced by EUR 30 million. Financial aid to students will be reduced in the same period by EUR 47 million, 96 million and 81 million in successive years. A recent study underlined the important contribution universities make to the economy with up to EUR 14.2 billion gross value added for the Finnish economy3. The recent midterm review of the government programme announced EUR 105 million additional funds for education and research without, however, really reversing the longer term downward funding trend. A continued negative trend in spending in education risks undermining competitiveness (European Commission 2017).
5. Modernising school education
The school system is highly decentralised, giving teachers a high degree of autonomy.
There is strong school leadership and a strong role of local authorities compared to other countries. In curriculum development, Finnish teachers have the highest autonomy among European countries. School leaders and local authorities have the main responsibility for school resources and to approve students’ admission to school. Teachers, under the leadership of principals and with some involvement from both local and national authorities, determine student assessment policies (OECD 2016b).
Finland has comparatively low teaching time. With about 600 hours teaching time annually in
lower secondary education in 2014, a figure more or less unchanged since 2000, Finnish contact hours are comparatively low: within the EU, only Flanders (Belgium), Poland and Greece are lower. Teaching hours per year are also much more evenly distributed across levels of education, without negative effect on educational outcomes (OECD 2016a).
Teachers are well educated and research-minded. Teachers are trained in eight universities by educators most holding PhDs and actively engaged in research. Teaching is a popular profession and only a fraction of initial applicants are admitted to training4. All teacher graduates are qualified
at master’s level. The age of teachers in Finland is evenly spread5. Teachers earn practically the same as other tertiary educated workers (OECD 2016a). Internationally, they earn less after 15 years of service Finnish primary, lower and upper secondary teachers earned less than their Danish, Dutch or German peers.
Municipalities organise induction and professional development of teachers. Teachers and municipalities are supported by the Finnish Network for Teacher Induction. This collaborative
network promotes a peer group mentoring model known as ‘verme, which allows for continuous reflection on what constitutes good teacher performance. Education providers also organise continuing professional development, with different sources of funding. There is a large disparity in days of participation (Lintuvuori et al., 2014)6. TALIS 2013 identified the following weaknesses:
• a lack of pedagogical leadership; • few personal study plans for teachers; • weak collaboration and networking among teachers.
The Finnish Teacher Development Programme is a key element of current reforms. Published in October 2016, it was developed with stakeholder involvement through the Teacher Education
Forum and aims via a range of actions to maintain the excellence of Finnish teachers. Another key element is the ongoing curriculum reform at all educational levels, preparing students to acquire competences needed in the 21st century (Box 1).
3 The country’s 14 universities contrinbute 6 % of economic added value, employing around 136 000
people. Each euro spent generated benefits of EUR 7.76, while each university job indirectly supports more than four others elsewhere. The study calculated that a 10 % reduction in universities’ core funding could result in the Finnish economy losing 16 900 jobs and EUR 1.8 billion (BiGGAR Economics, 2017).
4 The University of Helsinki, for instance, accepted only 8 % of its applicants in 2016. 5 About a third is over 50 years old in primary (30 %) and lower secondary (30 %) schools and a little older
in upper secondary school (45 %). 6 The disparity reaches also across age groups and geographical regions, latest data from 2016.
https://vipunen.fi/en-gb/
8 FINLAND
Education and Training Monitor 2017 – Country analysis November 2017
6. Modernising higher education
Tertiary attainment is high. The rate stands at 46.1 %, above the Europe 2020 target and representing a 0.6 pp. increase on the previous year. Finland has a higher share of graduates in IT (7 %), engineering (17 %) and health (19 %), and considerably fewer in social sciences (25 %) than the EU averages. The employment rate of tertiary graduates continues to decline slowly in
2016 by 0.7 pps. to 80.4%, lower than the EU average of 82.8 %.
Higher education institutions are invited to become more productive and internationally-oriented. The performance of the higher education sector is seen as being constrained by governance shortcomings. The government has outlined policies to reduce the fragmentation of the sector, encouraging higher education institutions to collaborate more. Departmental consolidation
within institutions has led to progress in teaching, but strengthening the quality of research
remains a significant challenge. Although there has been growth in the number of international staff, Finland’s science and education systems still need to become more international and better connected to international networks. A 2016 evaluation found that university reforms had triggered a significant structural and cultural change in the way universities are led (OECD 2017a).
The government is developing a long term vision while modernisation measures continue. A highly participatory process has been launched to define the objectives for Finnish higher education and research until the year 2030. Performance agreements are being used to
drive greater productivity and to shape restructuring: the 2017 funding model allots a weighting of 39 % to education; 33 % to research performance and 28 % to broad areas like strategic orientation. In addition, the reduction in the number of higher education institutions – which have reduced from 48 in 2009 to 37 today continues: three leading institutions in Tampere recently agreed to merge. The drive to change is supported by international observers (European Commission 2017, OECD 2017c).
The Academy of Finland is instrumental in streamlining the strategic orientation of
universities. It has been given funding of EUR 50 million to distribute to higher education institutions. According to a review carried out by internationally renowned rectors, these plans are a basis for the distribution of funds The Ministry of Education and Culture has prepared an international higher education and research policy (OECD 2017a). Continuing to have a very well performing general education and reversing recent developments, notably in science (see Section 2), are seen as preconditions for generating good results in higher education and research (OECD
2016a).
There is still further room for improvement on skills at both under- and post-graduate levels and to match them better to the needs of the labour market. Finland has a well-developed and recently updated system of skills forecasting combining qualitative and quantitative methods7. Nevertheless, businesses express concerns that higher education programmes are too narrowly focused. In addition, skills provided through doctoral education are not sufficiently aligned with labour-market needs: this is reflected in the fact that Finnish industry employs relatively few
PhD holders compared to comparable EU countries. Other significant hurdles relate to difficulties in
moving between study programmes and universities; and the long time it takes students to graduate (OECD 2017a). Curriculum reform in higher education aims to strengthen learning of generic skills. Bachelor-level studies are being made more generic and suitable for several careers. Specialisation should, increasingly, happen at master’s level. The University of Helsinki, with its ‘Big Wheel’ reform, aims to clarify the three-tier educational structure by moulding Bachelor’s degree programmes into broad-based education modules that exceed subject, unit and faculty
boundaries. This reduces at the same time the number of programmes.
7 A new forum organised by the Ministry of Education and Culture and the National Agency for Education
replaces the national education and training committees in anticipating skills demand. Nine groups address different vocational fields, drawing on inputs from employers, employees, other stakeholders and experts.
FINLAND 9
Education and Training Monitor 2017 – Country analysis November 2017
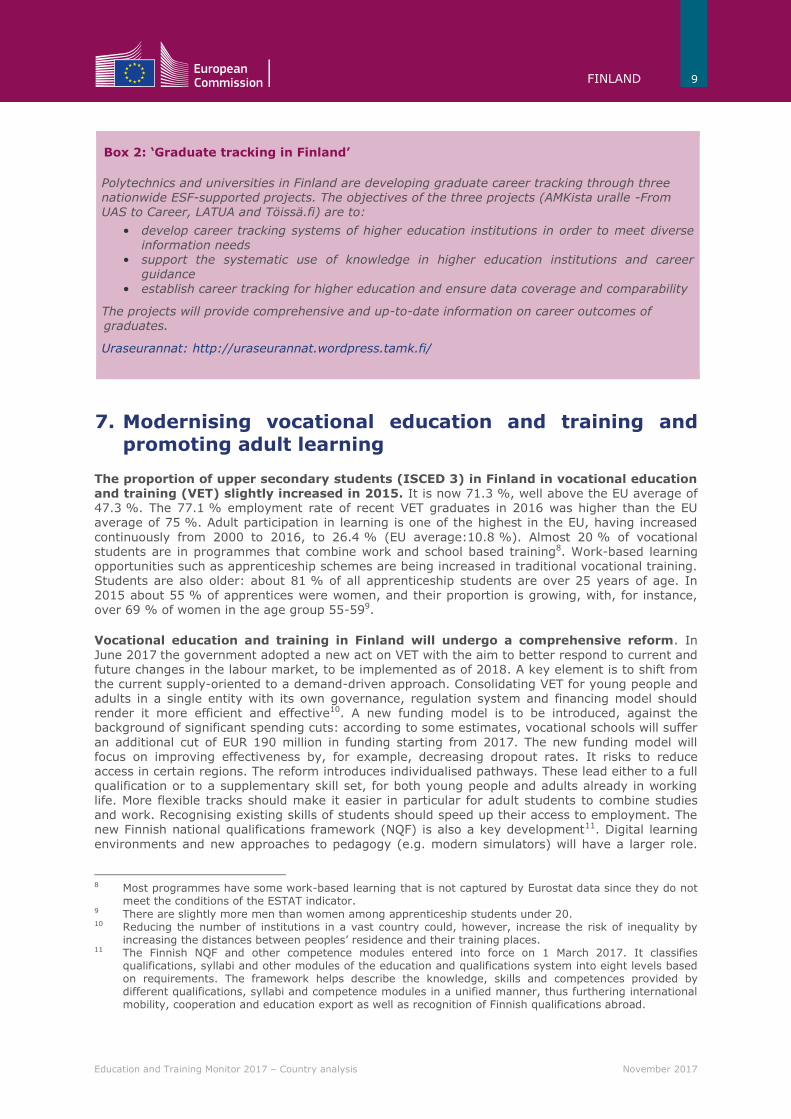
Box 2: ‘Graduate tracking in Finland’
Polytechnics and universities in Finland are developing graduate career tracking through three nationwide ESF-supported projects. The objectives of the three projects (AMKista uralle -From UAS to Career, LATUA and Töissä.fi) are to:
• develop career tracking systems of higher education institutions in order to meet diverse information needs
• support the systematic use of knowledge in higher education institutions and career guidance
• establish career tracking for higher education and ensure data coverage and comparability
The projects will provide comprehensive and up-to-date information on career outcomes of graduates.
Uraseurannat: http://uraseurannat.wordpress.tamk.fi/
7. Modernising vocational education and training and promoting adult learning
The proportion of upper secondary students (ISCED 3) in Finland in vocational education and training (VET) slightly increased in 2015. It is now 71.3 %, well above the EU average of 47.3 %. The 77.1 % employment rate of recent VET graduates in 2016 was higher than the EU average of 75 %. Adult participation in learning is one of the highest in the EU, having increased
continuously from 2000 to 2016, to 26.4 % (EU average:10.8 %). Almost 20 % of vocational students are in programmes that combine work and school based training8. Work-based learning opportunities such as apprenticeship schemes are being increased in traditional vocational training. Students are also older: about 81 % of all apprenticeship students are over 25 years of age. In
2015 about 55 % of apprentices were women, and their proportion is growing, with, for instance, over 69 % of women in the age group 55-599.
Vocational education and training in Finland will undergo a comprehensive reform. In
June 2017 the government adopted a new act on VET with the aim to better respond to current and future changes in the labour market, to be implemented as of 2018. A key element is to shift from the current supply-oriented to a demand-driven approach. Consolidating VET for young people and adults in a single entity with its own governance, regulation system and financing model should render it more efficient and effective10. A new funding model is to be introduced, against the background of significant spending cuts: according to some estimates, vocational schools will suffer
an additional cut of EUR 190 million in funding starting from 2017. The new funding model will focus on improving effectiveness by, for example, decreasing dropout rates. It risks to reduce access in certain regions. The reform introduces individualised pathways. These lead either to a full qualification or to a supplementary skill set, for both young people and adults already in working life. More flexible tracks should make it easier in particular for adult students to combine studies and work. Recognising existing skills of students should speed up their access to employment. The
new Finnish national qualifications framework (NQF) is also a key development11. Digital learning
environments and new approaches to pedagogy (e.g. modern simulators) will have a larger role.
8 Most programmes have some work-based learning that is not captured by Eurostat data since they do not
meet the conditions of the ESTAT indicator. 9 There are slightly more men than women among apprenticeship students under 20. 10 Reducing the number of institutions in a vast country could, however, increase the risk of inequality by
increasing the distances between peoples’ residence and their training places. 11 The Finnish NQF and other competence modules entered into force on 1 March 2017. It classifies
qualifications, syllabi and other modules of the education and qualifications system into eight levels based on requirements. The framework helps describe the knowledge, skills and competences provided by different qualifications, syllabi and competence modules in a unified manner, thus furthering international mobility, cooperation and education export as well as recognition of Finnish qualifications abroad.

10 FINLAND
Education and Training Monitor 2017 – Country analysis November 2017
Current plans include also increasing learning at workplaces and the creation of a new learning agreement model.
VET helps to integrate refugees and migrants. While the number of immigrants and refugees
fell after its sharp increase of 32 500 in 2015, about nine times more than in 201412, larger immigration flows have clear implications for the training sector. The recognition of immigrants’ skills and competence-based qualifications is being accelerated in cooperation with educational institutions13. The Ministry of Education and Culture will provide EUR 20 million to subsidise vocational education and training for immigrants under a targeted programme to facilitate their swift labour-market integration. It combines language studies with vocational studies and could facilitate the recognition of immigrants’ competences.
8. References
BiGGAR Economics (2017) Economic Contribution of the Finnish Universities. http://www.unifi.fi/wp-content/uploads/2017/06/UNIFI_Economic_Impact_Final_Report.pdf CEDEFOP Finland Skills forecasts up to 2025. http://www.cedefop.europa.eu/en/publications-and-resources/country-reports/finland-skills-forecasts-2025
European Commission Europe’s Digital Progress Report 2017. https://ec.europa.eu/digital-single-market/en/news/europes-digital-progress-report-2017 European Commission (2017) Country Report Finland. https://ec.europa.eu/info/files/2017-european-semester-country-report-finland_en Finnish Ministry of Finance (2017) National Reform Programme. https://ec.europa.eu/info/files/finland-national-reform-programme_en Finnish Ministry of Education and Culture, (2017) Finnish Country Note on Transitions in ECEC. http://minedu.fi/en/Publication?pubid=URN:ISBN:978-952-263-481-8 Finnish Ministry of Education and Culture, (2017) National Report PISA 2015. http://julkaisut.valtioneuvosto.fi/bitstream/handle/10024/79052/okm41.pdf?sequence=1 Hatak, Isabella; Reiner, Elisabeth (2011): Entrepreneurship Education in Secondary Schools. Education systems, teaching methods and best practice – a survey of Austria, Finland, France, Germany, Italy, Spain, Sweden. https://www.wu.ac.at/fileadmin/wu/d/ri/ricc/Forschung/Laufende_Projekte/researchreport2011_1.pdf Lintuvuori, Ahtiainen, Hienonen, Vainikainen & Hautamäki (2014) Osaava-ohjelma 2010-2013: Selvityksen loppuraportti. https://tuhat.helsinki.fi/portal/en/persons/meri-lintuvuori%2840a8ced4-9648-4bc9-b7c6-1f229b00a47a%29.html OECD (2016a), Education at a Glance. http://www.oecd.org/edu/education-at-a-glance-19991487.htm OECD (2016b) PISA 2015 Results. http://www.oecd.org/education/pisa-2015-results-volume-i-9789264266490-en.htm
OECD, (2016c) PISA Low-Performing Students. http://www.oecd.org/edu/low-performing-students-9789264250246-en.htm OECD (2017a) Reviews of Innovation Policy: Finland. http://www.oecd.org/finland/oecd-reviews-of-innovation-policy-finland-2017-9789264276369-en.htm
12 Equivalent to 10 % of the total number of immigrants and refugees already in Finland. 13 The Ministry web page: Maahanmuuttajien koulutuspolut ja integrointi – kipupisteet ja toimenpide-
esitykset [Integration of refugees and education paths – challenges and measures] http://www.minedu.fi/OPM/Julkaisut/2016/maahanmuuttajien_koulutuspolut_integrointi.html

FINLAND 11
Education and Training Monitor 2017 – Country analysis November 2017
9. Annex. Key indicator sources
Indicator Eurostat online data code
Early leavers from education and training edat_lfse_02 + edat_lfse_14
Tertiary educational attainment edat_lfse_03 + edat_lfs_9912
Early childhood education and care educ_uoe_enra10 + tps00179
Employment rate of recent graduates edat_lfse_24
Adult participation in learning trng_lfse_03
Public expenditure on education as a percentage of GDP gov_10a_exp
Expenditure on public and private institutions per student educ_uoe_fini04
Learning mobility educ_uoe_mobg03
10. Annex II. Structure of the education system
Age of students Programme duration (years)
Note: Students can join ISCED 4 programmes at different ages.
Source: European Commission/EACEA/Eurydice, 2016. The Structure of the European Education Systems 2016/17: Schematic
Diagrams. Eurydice Facts and Figures. Luxembourg: Publications Office of the European Union.
Comments and questions on this report are welcome and can be sent by email to: Klaus KOERNER [email protected] or [email protected]

HOW TO OBTAIN EU PUBLICATIONS
Free publications:• one copy:
via EU Bookshop (http://bookshop.europa.eu);• more than one copy or posters/maps:
from the European Union’s representations (http://ec.europa.eu/represent_en.htm); from the delegations in non-EU countries (http://eeas.europa.eu/delegations/index_en.htm); by contacting the Europe Direct service (http://europa.eu/europedirect/index_en.htm) or calling 00 800 6 7 8 9 10 11 (freephone number from anywhere in the EU) (*).
(*) The information given is free, as are most calls (though some operators, phone boxes or hotels may charge you).
Priced publications:• via EU Bookshop (http://bookshop.europa.eu).

ISBN 978-92-79-69996-2
NC-AN
-17-011-EN-N