EDS 08-0132 Planning Guidance for Disturbing...
33
Document Number: EDS 08-0132 Version: 3.0 Date: 21/03/2016 ENGINEERING DESIGN STANDARD EDS 08-0132 PLANNING GUIDANCE FOR DISTURBING LOADS Network(s): EPN, LPN, SPN Summary: This standard details the approach that should be taken when assessing a connection request or feasibility study for loads which may cause disturbance to the supply waveform. This may take the form of flicker, unbalance, or harmonic voltage distortion. This standard applies to all voltage levels. Owner: Sotiris Georgiopoulos Date: 21/03/2016 Approved By: Sotiris Georgiopoulos Approved Date: 31/03/2016 This document forms part of the Company’s Integrated Business System and its requirements are mandatory throughout UK Power Networks. Departure from these requirements may only be taken with the written approval of the Director of Asset Management. If you have any queries about this document please contact the author or owner of the current issue. Applicable To UK Power Networks External All UK Power Networks G81 Website Asset Management Contractors Capital Programme ICPs/IDNOs Connections Meter Operators HSS&TT Network Operations UK Power Networks Services Other
Transcript of EDS 08-0132 Planning Guidance for Disturbing...

Document Number: EDS 08-0132
Version: 3.0
Date: 21/03/2016
ENGINEERING DESIGN STANDARD
EDS 08-0132
PLANNING GUIDANCE FOR DISTURBING LOADS
Network(s): EPN, LPN, SPN
Summary: This standard details the approach that should be taken when assessing a connection request or feasibility study for loads which may cause disturbance to the supply waveform. This may take the form of flicker, unbalance, or harmonic voltage distortion. This standard applies to all voltage levels.
Owner: Sotiris Georgiopoulos Date: 21/03/2016
Approved By: Sotiris Georgiopoulos Approved Date: 31/03/2016
This document forms part of the Company’s Integrated Business System and its requirements are mandatory throughout UK Power Networks. Departure from these requirements may only be taken with the written approval of the Director of Asset Management. If you have any queries about this document please contact the author or owner of the current issue.
Applicable To
UK Power Networks External
All UK Power Networks G81 Website
Asset Management Contractors
Capital Programme ICPs/IDNOs
Connections Meter Operators
HSS&TT
Network Operations
UK Power Networks Services
Other
Planning Guidance for Disturbing Loads Document Number: EDS 08-0132
Version: 3.0
Date: 21/03/2016
© UK Power Networks 2016 All rights reserved 2 of 33
Revision Record
Version 3.0 Review Date 31/03/2018
Date 21/03/2016 Author Steve Mould
Why has the document been updated: Periodic review.
What has changed: No changes, pending industry review of ENA ER P28 and ENA ER G5.
Document transferred onto a new template and rules applied. No change to EDS 08-0132a.
Version 2.0 Review Date 14/03/2016
Date 13/03/2013 Author Marco da Fonseca
Document Reviewed. Updated standard format
Version 1.3 Review Date
Date 15/09/2011 Author John Lowe
Document reclassified to EDS
Version 1.2 Review Date
Date 31/03/2011 Author Don Fossett
Document rebranded
Version 1.1 Review Date
Date 08/03/2010 Author John Lowe
Embedded excel spreadsheet is now a stand alone form called EDS 08-0132A Stage 1 Equipment Calculator.
Version 1.0 Review Date
Date 05/02/2009 Author Ron Cordwell
Re-issue and combination of existing network specific standards, revised in line with new standards etc. Additional material added.

Planning Guidance for Disturbing Loads Document Number: EDS 08-0132
Version: 3.0
Date: 21/03/2016
© UK Power Networks 2016 All rights reserved 3 of 33
Contents
1 Introduction ............................................................................................................. 6
2 Scope ....................................................................................................................... 6
3 Abbreviations and Definitions ................................................................................ 6
3.1 Abbreviations ............................................................................................................. 6
3.2 Definitions ................................................................................................................. 7
4 Disturbing Loads Assessment ............................................................................... 8
4.1 Loads Likely to Cause Disturbance ........................................................................... 8
4.2 Responsibilities for Assessing Disturbing Loads ........................................................ 8
4.3 Connection Agreements and Charges for Design Work ........................................... 10
4.4 Harmonic Assessment ............................................................................................. 11
4.4.1 Stage 1 Harmonic Distortion (LV equipment only) ................................................... 11
4.4.2 Stage 2/Stage 3 Harmonic Assessments ................................................................. 14
4.5 Voltage Fluctuation Assessment .............................................................................. 14
4.5.1 Stage 1 Assessment ................................................................................................ 14
4.5.2 Stage 2 Flicker Assessment .................................................................................... 15
4.6 Assessment of New Loads for Voltage Unbalance .................................................. 16
5 Mitigation ............................................................................................................... 17
6 Network Alterations ............................................................................................... 17
7 References ............................................................................................................. 18
7.1 Legislation ............................................................................................................... 18
7.2 Industry Regulation.................................................................................................. 18
7.3 Industry Standards .................................................................................................. 18
Appendix A - Power Quality Background ........................................................................ 19
A.1 Power Quality Defects ............................................................................................. 19
A.2 European Standard - Power Quality ........................................................................ 20
Appendix B - General Overview ....................................................................................... 21
B.1 Voltage Dips and Fluctuations (Flicker) ................................................................... 21
B.2 Unbalance of Three-phase Voltages (Negative Phase Sequence) .......................... 22
B.3 Harmonics – Sources and Overview ........................................................................ 22
B.4 DC Component ........................................................................................................ 26
B.5 Frequency Fluctuations ........................................................................................... 26
B.6 Combination Effects ................................................................................................ 26
APPENDIX C - General Approach - High Frequency Disturbances ............................... 27
C.1 Voltage Spikes ........................................................................................................ 27

Planning Guidance for Disturbing Loads Document Number: EDS 08-0132
Version: 3.0
Date: 21/03/2016
© UK Power Networks 2016 All rights reserved 4 of 33
C.2 Radio Frequency Signals......................................................................................... 27
Appendix D - Resolution of Power Quality Problems ..................................................... 28
D.1 Developments in Power Electronics ........................................................................ 28
D.2 Power factor correction ............................................................................................ 28
D.3 Negative Phase Sequence reduction ....................................................................... 28
D.4 Tap Changers .......................................................................................................... 29
Appendix E - Motor Assessments ................................................................................... 30
Appendix F - Calculation of Voltage Dip caused by an Instantaneous Electric Shower using WinDebut ....................................................................................... 31
Tables
Table 4.1 - Disturbing Loads - Actions and Responsibilities .................................................. 9
Table 4.2 – Maximum Aggregate Value of Three-phase Convertor or AC Regulator Equipment which may be Connected under Stage 1 (source: ENA ER G5/4-1) . 11
Table 4.3 - Stage 1 Current Emission Values for Simplified Connection of Equipment (source: IEC 61000-3-4) .................................................................................... 11
Table 4.4 - Stage 1 Maximum Permissible Loads and Equipment in Ampere RMS for Aggregate Loads and Equipment Rated > 16A per phase (source: ENA ER G5/4-1) .............................................................................................................. 12
Table 4.5 - Connection of Electric Motors without Prior Agreement (Anywhere on the LV system) (source: ENA ER P28) .......................................................................... 15
Table 4.6 - Connection of Electric Motors (Three-phase) without assessment to LV bars of distribution substation where the interval between starts is 10 minutes or longer. ............................................................................................................... 15
Figures
Figure 4.1 - Disturbing Load Assessment Decision Tree ..................................................... 10
Figure 4.2 – Flow Diagram of Stage 1 Harmonic Assessment ............................................. 13
Figure 4.3 – Flow Diagram for Voltage Fluctuation Assessment for Planners and Designers .......................................................................................................... 16
Figure 7.1 - Full wave single-phase bridge rectifier with smoothing capacitor ..................... 23
Figure 7.2 - Line commutated thyristor controller ................................................................ 23
Figure 7.3 - Voltage (blue) and current (red) waveforms across and through single-phase bridge rectifier (t in ms) ...................................................................................... 24
Figure 7.4 - Typical harmonic load-shape for single-phase bridge rectifier showing significant low order odd harmonics ................................................................... 24
Figure 7.5 - Nonlinear current waveform resulting from single thyristor domestic dimmer switch ................................................................................................................ 24
Figure 7.6 - Voltage dip caused by motor starting ............................................................... 30
Figure 7.7 - Consumer demand type path ........................................................................... 31
Planning Guidance for Disturbing Loads Document Number: EDS 08-0132
Version: 3.0
Date: 21/03/2016
© UK Power Networks 2016 All rights reserved 5 of 33
Figure 7.8 - Consumer type specification ............................................................................ 31
Figure 7.9 - Transformer details .......................................................................................... 32
Figure 7.10 - Point load specification .................................................................................. 32
Figure 7.11 - Cable connection ........................................................................................... 33

Planning Guidance for Disturbing Loads Document Number: EDS 08-0132
Version: 3.0
Date: 21/03/2016
© UK Power Networks 2016 All rights reserved 6 of 33
1 Introduction
The shared nature of the network means that disturbance caused by one customer may be seen at another customer’s supply terminals.
UK Power Networks is obliged to ensure that the following areas of power quality are controlled within prescribed limits which typically take two forms:
1) Voltage disturbances, commonly dips, swells, flicker and unbalance, often referred to as ‘negative phase sequence’ voltage component.
2) Harmonic voltage distortion, i.e. deviation of the supply waveform from an ideal or pure 50Hz sine-wave.
These are described in detail in Appendix A.
2 Scope
This standard defines UK Power Network’s approach for assessing new loads likely to cause disturbance and provides information about the range of power quality issues likely to affect all three networks.
3 Abbreviations and Definitions
3.1 Abbreviations
Term Definition
AS Approval Specialist
BS British Standard
DPE Distribution Planning Engineer
DTA Design Technical Adviser
ENA Energy Network Association
ER Engineering Recommendation
ESQC Electricity Safety, Quality and Continuity
IEC International Electrotechnical Commission
IP Infrastructure Planning Engineer
NCD New Connections Designer
NG National Grid
NPS Negative Phase Sequence
PCC Point of Common Coupling
PWM Pulse-width modulated (drive circuits)
THD Total Harmonic Distortion
UIE International Union for Electroheat
UPS Uninterruptable Power Supply
Planning Guidance for Disturbing Loads Document Number: EDS 08-0132
Version: 3.0
Date: 21/03/2016
© UK Power Networks 2016 All rights reserved 7 of 33
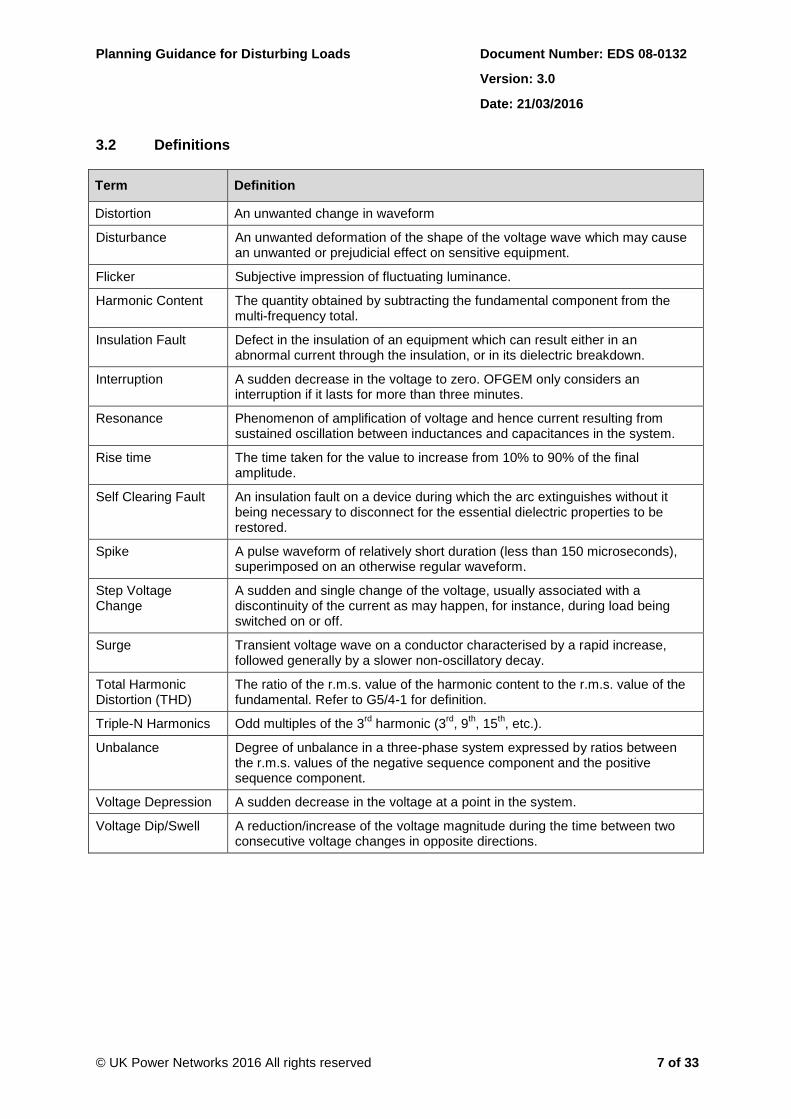
3.2 Definitions
Term Definition
Distortion An unwanted change in waveform
Disturbance An unwanted deformation of the shape of the voltage wave which may cause an unwanted or prejudicial effect on sensitive equipment.
Flicker Subjective impression of fluctuating luminance.
Harmonic Content The quantity obtained by subtracting the fundamental component from the multi-frequency total.
Insulation Fault Defect in the insulation of an equipment which can result either in an abnormal current through the insulation, or in its dielectric breakdown.
Interruption A sudden decrease in the voltage to zero. OFGEM only considers an interruption if it lasts for more than three minutes.
Resonance Phenomenon of amplification of voltage and hence current resulting from sustained oscillation between inductances and capacitances in the system.
Rise time The time taken for the value to increase from 10% to 90% of the final amplitude.
Self Clearing Fault An insulation fault on a device during which the arc extinguishes without it being necessary to disconnect for the essential dielectric properties to be restored.
Spike A pulse waveform of relatively short duration (less than 150 microseconds), superimposed on an otherwise regular waveform.
Step Voltage Change
A sudden and single change of the voltage, usually associated with a discontinuity of the current as may happen, for instance, during load being switched on or off.
Surge Transient voltage wave on a conductor characterised by a rapid increase, followed generally by a slower non-oscillatory decay.
Total Harmonic Distortion (THD)
The ratio of the r.m.s. value of the harmonic content to the r.m.s. value of the fundamental. Refer to G5/4-1 for definition.
Triple-N Harmonics Odd multiples of the 3rd
harmonic (3rd
, 9th, 15
th, etc.).
Unbalance Degree of unbalance in a three-phase system expressed by ratios between the r.m.s. values of the negative sequence component and the positive sequence component.
Voltage Depression A sudden decrease in the voltage at a point in the system.
Voltage Dip/Swell A reduction/increase of the voltage magnitude during the time between two consecutive voltage changes in opposite directions.

Planning Guidance for Disturbing Loads Document Number: EDS 08-0132
Version: 3.0
Date: 21/03/2016
© UK Power Networks 2016 All rights reserved 8 of 33
4 Disturbing Loads Assessment
4.1 Loads Likely to Cause Disturbance
When assessing a new connection enquiry, it is important to determine if the load is likely to cause disturbance to other customers. Loads likely to cause disturbance are as follows:
Industrial / Commercial variable speed drives;
Motors;
Welding Equipment;
IT Equipment;
UPS Systems;
Switched Mode Power Supplies;
Dimmer switches;
Embedded Generation;
Air Conditioning;
Rail Traction.
It should also be noted that network extensions can cause resonance which increases harmonic levels at locations remote from the connection point of the disturbing load.
The impact of existing levels of disturbance or distortion, referred to as “background levels”, is most significant when assessing the suitability of a proposed new load. If a load causes voltage disturbance or harmonic levels to deviate from permissible tolerances, the load cannot be accommodated without specific mitigation to address the issue. When a connection enquiry is received, it is therefore important to establish whether the load will have an effect on power quality and ensure that assessments are carried out when necessary.
4.2 Responsibilities for Assessing Disturbing Loads
ENA ER P28 and ENA ER G5/4 (along with ETR 122) deal with voltage fluctuation and harmonic distortion respectively and both provide a three stage approach. Stage 1 deals with the large number of requests received for connection of small loads to the LV network. Stages 2 and 3 define how larger distorting / flicker causing loads and connections at higher voltages should be assessed. The procedure for dealing with ‘Unbalance’ is defined in ER P29.
Assessments of disturbing load to be connected to the LV network should be carried out by new connections designers and distribution planners. If after initial appraisal the load is found to fall outside the scope of Stage 1 for harmonic distortion or Stage 2 for flicker, the enquiry should be referred to Distribution/Infrastructure Planning who may use an approved specialist. The detailed procedure for Stage 1 harmonic assessment is given in section 4.4. Procedures for Stage 1 and Stage 2 voltage fluctuation assessments are shown in section 4.5.
Assessments of disturbing harmonic and flicker causing load to be connected to networks operating at 6.6kV and above will be referred directly to Distribution/Infrastructure Planning who will also carry out all assessments for equipment likely to cause unbalance with the help of an approved specialist if required.

Planning Guidance for Disturbing Loads Document Number: EDS 08-0132
Version: 3.0
Date: 21/03/2016
© UK Power Networks 2016 All rights reserved 9 of 33
Table 4.1 summarises types of load likely to be encountered, actions required and responsibilities for actions. Figure 4.1 describes the steps required to assess a potentially disturbing load.
Table 4.1 - Disturbing Loads - Actions and Responsibilities
Type of load Action Required (relating to Power Quality)
Action by
Rail Traction > 1MW Flicker, unbalance (AC load) and harmonic (Stage 3) studies
Approved Specialist
Domestic (standard) None
Domestic (air con / heat exchanger/‘hi-tech’ or controlled lighting/motor systems )
Stage 1 or 2 harmonic study (request further details from customer)
Stage 1 check by new connections designer (NCD) / Distribution Planning Engineer (DPE)
Stage 2 check by an approved specialist
Windfarm Stage 3 G5/4-1 assessment Infrastructure Planning Engineer (IPE) or Approved Specialist (AS)
Network Extensions Stage 3 G5/4-1 assessment if >20km cable and connected at 33kV or higher
IPE or AS
Motors & Welding
Equipment
P28 assessment as appropriate to voltage level and size of motor(s) and flicker assessment
Stage1/Stage 2 flicker check by NCD / DPE
Stage 3 flicker check by AS
Industrial / Commercial with variable speed drive motor(s)
G5/4-1 assessment as appropriate to voltage level and size of motor(s) and flicker assessment
Stage 1 harmonic check, Stage 1 / Stage 2 (LV) flicker check by NCD / DPE
Stage 2 / 3 harmonic and Stage 2 (11kV) / Stage 3 flicker checks by AS
Commercial IT Equipment Harmonic study Stage 1 check by NCD / DPE. Stage 2 check by AS
Embedded generation
G5/4-1 harmonic study if inverter connected and >16 amps per phase. (Stage 1 normally sufficient for small generators).
Refer to EDS 08-0106 (New Distributed Generator Connections)
DPE/IPE/AS
Any connection at 33kV or above
Harmonic study IPE or AS

Planning Guidance for Disturbing Loads Document Number: EDS 08-0132
Version: 3.0
Date: 21/03/2016
© UK Power Networks 2016 All rights reserved 10 of 33
Figure 4.1 - Disturbing Load Assessment Decision Tree
4.3 Connection Agreements and Charges for Design Work
All connection agreements relevant shall contain a clause stating that the customer shall not allow his/her load to cause disturbance to other users; specific limits where appropriate to individual customers shall be stated clearly in the agreement together with requirements (if any) for ongoing monitoring of the customer’s emissions.
Where UK Power Networks carries out design work for disturbing loads associated with the provision of a new or altered connection this work will normally be chargeable. Refer to the Connection Charge Policy and Approved Connection Charge Methodology for details of how such charges will be applied.
START
Distorting
load declared
or likely
Fluctuating
load?
Unbalanced
load?
Likely high
harmonic
content
Perform
Flicker Study
to P28
Voltage
Unbalance
Study to P29
G5/4-1 study
Normal load /
voltage based
assessment
Record reason for
failure
No - e.g. normal
domestic load
Y
Y Fail
Y
Y
Accept / Reject
proposal and
document reason
for failure (if any)
Record reason for
failure
Record reason for
failure
Fail
Fail
N
(balanced
across 3
phases)
N
(linear load,
e.g. heating)
Pass
Pass
Pass
N
Planning Guidance for Disturbing Loads Document Number: EDS 08-0132
Version: 3.0
Date: 21/03/2016
© UK Power Networks 2016 All rights reserved 11 of 33
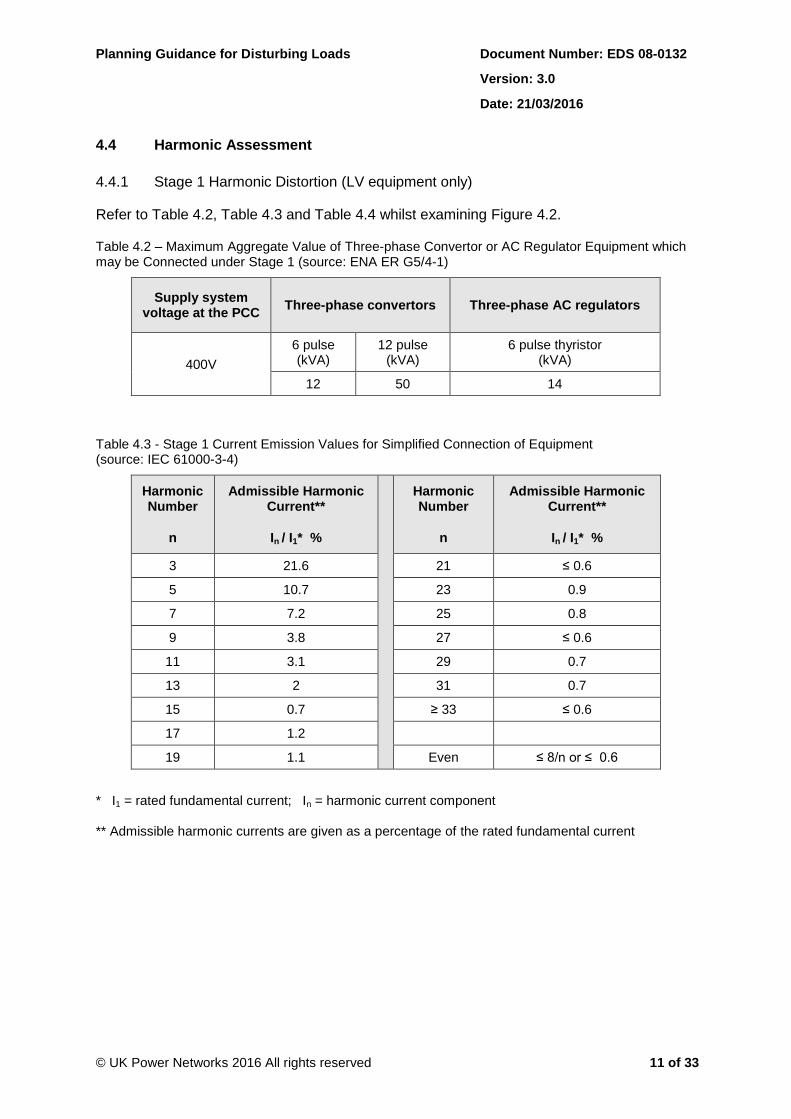
4.4 Harmonic Assessment
4.4.1 Stage 1 Harmonic Distortion (LV equipment only)
Refer to Table 4.2, Table 4.3 and Table 4.4 whilst examining Figure 4.2.
Table 4.2 – Maximum Aggregate Value of Three-phase Convertor or AC Regulator Equipment which may be Connected under Stage 1 (source: ENA ER G5/4-1)
Supply system voltage at the PCC
Three-phase convertors Three-phase AC regulators
400V
6 pulse (kVA)
12 pulse (kVA)
6 pulse thyristor (kVA)
12 50 14
Table 4.3 - Stage 1 Current Emission Values for Simplified Connection of Equipment (source: IEC 61000-3-4)
Harmonic Number
n
Admissible Harmonic Current**
In / I1* %
Harmonic Number
n
Admissible Harmonic Current**
In / I1* %
3 21.6 21 ≤ 0.6
5 10.7 23 0.9
7 7.2 25 0.8
9 3.8 27 ≤ 0.6
11 3.1 29 0.7
13 2 31 0.7
15 0.7 ≥ 33 ≤ 0.6
17 1.2
19 1.1 Even ≤ 8/n or ≤ 0.6
* I1 = rated fundamental current; In = harmonic current component ** Admissible harmonic currents are given as a percentage of the rated fundamental current

Planning Guidance for Disturbing Loads Document Number: EDS 08-0132
Version: 3.0
Date: 21/03/2016
© UK Power Networks 2016 All rights reserved 12 of 33
Table 4.4 - Stage 1 Maximum Permissible Loads and Equipment in Ampere RMS for Aggregate Loads and Equipment Rated > 16A per phase (source: ENA ER G5/4-1)
Harmonic order
h
Emission current, In
(A)
Harmonic order
h
Emission current In
(A)
Harmonic order
h
Emission current, In
(A)
Harmonic order
h
Emission current, In
(A)
2 28.9 15 1.4 28 1.0 41 1.8
3 48.1 16 1.8 29 3.1 42 0.3
4 9.0 17 13.6 30 0.5 43 1.6
5 28.9 18 0.8 31 2.8 44 0.7
6 3.0 19 9.1 32 0.9 45 0.3
7 41.2 20 1.4 33 0.4 46 0.6
8 7.2 21 0.7 34 0.8 47 1.4
9 9.6 22 1.3 35 2.3 48 0.3
10 5.8 23 7.5 36 0.4 49 1.3
11 39.4 24 0.6 37 2.1 50 0.6
12 1.2 25 4.0 38 0.8
13 27.8 26 1.1 39 0.4
14 2.1 27 0.5 40 0.7
Please refer to EDS 08-0132A, which is based on Table 4.4. This calculator enables quick assessment of stage 1 equipment.
Notes:
1. The limits in Table 4.4 are based on a typical fault level of 10MVA; if the fault level at the PCC is higher than 10MVA these can be increased on a ratio basis. If lower the limits will reduce. e.g. if the fault level at the PCC is 15MVA, the 3rd harmonic emission current limit will increase to:
72.1510
1548.1 A
2. With the exception of the 3rd and 5th harmonic orders, any two emission currents up
to and including the 19th can exceed the limit values by 10% or 0.5A whichever is the greatest. For harmonic orders over the 19th, any four emission currents may exceed the given values by 10% or 0.1A whichever is the greatest.

Planning Guidance for Disturbing Loads Document Number: EDS 08-0132
Version: 3.0
Date: 21/03/2016
© UK Power Networks 2016 All rights reserved 13 of 33
Equipment operate
at 230/400V
Aggregate
load including a
group of items ≤
16A/phase
Complies
with BS EN
61000-3-2
Connect
without further
Investigation
Is equipment a single phase
converter or AC regulator for
industrial applications or overnight
battery charging or with rating
≤ 5kVA
Is equipment
a three-phase converter or
AC regulator with rating ≤
values
in table 2
Is rating of the
equipment > 75A/
phase
All of the
harmonic current
emissions < values
shown
in table 3
Is fault level
at the
PCC>10MVA
Harmonic emissions <
adjusted limits of
table 4
Adjust emission limits
given in table 4 to
match fault level at
PCC. Reduce or
increase values
depending on ratio of
actual fault level at PCC
to 10MVA (The higher
the fault level, the
higher the emission
current limit)
Carry Out
Stage 2 /
Stage 3
Assessment carried out by
IPE/DPE/AS/
NCDKnown
harmonic problems
with network to which
equipment will
connect
START
N
Y
Y
Y
N
Y
N
N
N
N
N
N
YY
Y
Y
Y
Y
N
Figure 4.2 – Flow Diagram of Stage 1 Harmonic Assessment

Planning Guidance for Disturbing Loads Document Number: EDS 08-0132
Version: 3.0
Date: 21/03/2016
© UK Power Networks 2016 All rights reserved 14 of 33
4.4.2 Stage 2/Stage 3 Harmonic Assessments
The ENA ER G5/4 and ETR 122 describe the Stage 2 and Stage 3 harmonic assessment processes and these assessments will be carried out by the appropriate Planning department and/or an approved specialist.
Assessments of harmonics under Stage 2 and 3 will be based on 10 minute average values measured over a one week period. For fluctuating loads (e.g. traction supplies), or where the existing background distortion is due to a fluctuating load, the assessments shall be based on one minute average values.
In both assessments, the requirement is that for each phase, 95% of these values shall be less than the planning level.
In order to correctly establish the background levels, longer periods of measurement may be required; in such cases it is recommended that rolling one week 95 percentile values are calculated.
4.5 Voltage Fluctuation Assessment
The assessment process for voltage fluctuation (voltage dip, voltage sag and flicker) is detailed below and summarised in Figure 4.3.
4.5.1 Stage 1 Assessment
This applies to small sizes of LV equipment, which can be connected to the system without individual assessment of flicker effects.
4.5.1.1 Household Equipment
Household and other small equipment with a rated input current less than 16A and designed to BS 5406 (i.e. virtually all small appliances sold in the UK) is acceptable for connection to UK Power Networks without further assessment. This assumes a maximum service phase - neutral impedance of 0.4 + j0.25 ohm, which is significantly higher than the UK Power Networks design limit for new housing estates and is likely to be exceeded only infrequently on existing networks.
Refer to ENA ER P28 Addendum 2 for a detailed description on assessing household cooking appliances.
Electrically Heated Showers
Can be connected without individual consideration providing the rating does not exceed 7.2kW for a shower that is manually switched in one step and the supply is of sufficient capacity. Showers of rating between 7.2kW and 10.8kW are normally switched in stages and the voltage dips caused don’t usually present a problem. Phase neutral loop impedance should however be checked prior to connection and the voltage change calculated to ensure that it does not exceed 3%. Appendix F shows how Win-debut can be used to calculate the phase – neutral loop impedance.

Planning Guidance for Disturbing Loads Document Number: EDS 08-0132
Version: 3.0
Date: 21/03/2016
© UK Power Networks 2016 All rights reserved 15 of 33
Storage Heaters
Up to an aggregate load of 7.2kW can be connected without individual consideration providing the electricity supply to the customer’s property is suitable to accommodate the new load plus all existing load. For greater storage heating loads phase neutral loop impedance should be checked and the voltage change calculated to ensure that it does not exceed 3%.
4.5.1.2 Small Electric Motors
Table 4.5 and Table 4.6 show the largest sizes of motor that can be connected direct-on-line without assessment. For more information refer to ENA P28 Addendum 1.
Table 4.5 - Connection of Electric Motors without Prior Agreement (Anywhere on the LV system) (source: ENA ER P28)
Motor Type
Very Frequent Starting
(intervals < 1min)
Other Duties
(intervals > 1 min)
Motor Output (kW)
Motor Input (kVA)
Motor Output (kW)
Motor Input (kVA)
Single-phase 240V 0.37 1 0.75 1.7
Single-phase 480V 1.5 3 3 4.5
Three-phase 415V 2.25 4 4.5 6
Table 4.6 - Connection of Electric Motors (Three-phase) without assessment to LV bars of distribution substation where the interval between starts is 10 minutes or longer.
Transformer Rating (kVA) Maximum Output Rating (kW)
100 5
200 10
300/315 14
500 21
750/800 27
1000 33
Based on Win-Debut calculations (using an 11kV fault level of 25MVA) to give a motor starting volt drop of less than 3% at LV busbar (it should be noted that these limits are lower values than those specified in P28).
4.5.2 Stage 2 Flicker Assessment
Stage 2 assessments apply to equipment to be connected at LV that causes ramp or step voltage changes or combinations of both. It will normally be carried out by new connections planners or network planners with reference, where necessary to an approved specialist.

Planning Guidance for Disturbing Loads Document Number: EDS 08-0132
Version: 3.0
Date: 21/03/2016
© UK Power Networks 2016 All rights reserved 16 of 33
Assessments for equipment to be connected at higher voltages or where voltage fluctuations exceed Stage 2 should be carried out by the design technical adviser.
The parameters used to measure flicker severity in Stage 2 assessments is the short term severity value (Pst) which combines the degree of voltage change (up to a maximum of 3%) with time between the changes and the long term severity value (Plt), which is an integrated value in any two hours based on the Pst. Stage 2 assessment applies to loads outside the limits of Stage 1, but which are unlikely to cause a flicker severity Pst greater than 0.5.
One of the current approved computer programs should be used to calculate the likely flicker severity of a new motor or welding equipment: Win-Debut includes flicker severity calculations.
For detailed information, including the recommended limits for size of step voltage change, refer to ENA ER P28.
Equipment operate
at 230/400V
START
Equipment
within limits of stage 1
assessment.
Connect without
further Investigation
Equipment
within stage 2 limits:
Pst < 0.5 at PCC
Pass to DP/IP or
AS
Stage 3 Assessment
by DP/IP or AS
N
Y
N N
Y Y
Figure 4.3 – Flow Diagram for Voltage Fluctuation Assessment for Planners and Designers
4.6 Assessment of New Loads for Voltage Unbalance
ENA ER P29 provides limits for voltage unbalance in public distribution networks operating at 132kV and below. ENA documents ETR 116 and ER P24 provide guidance for assessing the impact of traction supplies on voltage unbalance. Any requests for connection of loads likely to cause Voltage Unbalance should be referred to the appropriate Planning department who may use an approved specialist.

Planning Guidance for Disturbing Loads Document Number: EDS 08-0132
Version: 3.0
Date: 21/03/2016
© UK Power Networks 2016 All rights reserved 17 of 33
5 Mitigation
Ensuring compliance with planning limits, harmonic content or other power quality problems on the network may necessitate additional investment. An existing problem must be resolved by UK Power Networks unless it can be proven that a single customer is exceeding his/her contracted emission level.
For new connections which would result in limits being exceeded, the customer shall be required to provide and maintain mitigation equipment at his/her expense. This may take the form of harmonic filters, capacitors, reactors, solid state converters or rotating machines.
High levels of Triple-N harmonics will cause large neutral currents in LV systems†, and any affected network (customer owned or otherwise) will need to be designed accordingly. In extreme circumstances it may be necessary to up-rate neutral conductor sizes. K rated transformers (transformers designed for loads with significant harmonic current demand) may be found on some customer networks. These have lower loss cores which heat less than conventional transformers subject to harmonic loads, as well as stranded windings and increased neutral conductor size as appropriate.
It is anticipated that such measures will be unnecessary if system harmonic voltage distortion is kept within planning limits specified in G5/4; exceptional loads requiring these solutions would be accommodated at the end customer's cost.
6 Network Alterations
When any substantial modification is made to the network, the effect on power quality must be considered at an early stage in the design. Alteration to length of cable connected will alter the shunt susceptance and may lead to resonance conditions at certain harmonic frequencies.
For networks that operate at voltages of 33kV and above, a Stage 3 harmonic assessment should be carried out prior to:
1. Any underground cable extension of more than 20km.
2. Any transfer of more than 20km of underground cable from a network.
3. Any underground cable replacement of more than 20km.
Power quality implications of any major changes in plant associated with networks that operate at voltages of 33kV and above should also be considered and Stage 3 harmonic and/or flicker assessments carried out when required. Out of balance assessments in accordance with ENA ER P29 and ETR 116 should be carried out prior to alterations to networks associated with large, out of balance loads (e.g. Railtrack supplies).
† Neutral sizing - for high Triple-N harmonic levels, the phase current contributions sum rather than cancel, resulting in an overloaded neutral conductor.

Planning Guidance for Disturbing Loads Document Number: EDS 08-0132
Version: 3.0
Date: 21/03/2016
© UK Power Networks 2016 All rights reserved 18 of 33
7 References
7.1 Legislation
This standard takes into account compliance with the statutory regulations set out below:
ESQC Regulations 2002.
7.2 Industry Regulation
This standard is designed to reflect the requirements of the distribution code, which is incorporated as a term in the connection or use of system agreements for all users of the distribution system, other than tariff customers. Such users are legally bound to comply with the limits and levels of distortion laid down in the engineering recommendations embodied in the code and referred to in this standard.
Consideration shall be given to clause DPC4.2.3 - voltage disturbances and harmonic distortion.
7.3 Industry Standards
BS 5406 Disturbances in supply systems caused by household appliances and similar electrical equipment.
BS 800 1988 Limits and methods of measurement of radio interference characteristics of household electrical appliances portable tools and similar electrical apparatus.
BS EN 50160 2007 Voltage Characteristics of electricity supplied by public distribution systems.
EDS 08-0132A Stage 1 Equipment Calculator
ENA ER G22 Mains Signalling Systems operating on the Low Voltage Supply in the Frequency Range 3 – 148.5 kHz.
ENA ER G5/4-1 Planning limits for Harmonic Voltage Distortion and the connection of non-linear Equipment to Transmission systems and distribution networks in the U.K.
ENA ER P24 AC Traction Supplies to British Rail.
ENA ER P28‡ Planning Limits of Voltage Fluctuations caused by Industrial, Commercial and Domestic Equipment in the UK.
ENA ER P29 Planning Limits for Voltage Unbalance in the United Kingdom for 132kV and below.
IEC 61000-2-2 Compatibility Levels for Low Frequency Conducted Disturbances and signalling in public power supply systems.
‡ ENA ER standards are available from Alfresco Asset Management Site and Reference Library.
Planning Guidance for Disturbing Loads Document Number: EDS 08-0132
Version: 3.0
Date: 21/03/2016
© UK Power Networks 2016 All rights reserved 19 of 33
Appendix A - Power Quality Background
A.1 Power Quality Defects
A perfect power supply would be one that is always available, always within voltage and frequency tolerances, and has a pure noise-free sinusoidal wave shape.
There are three main power quality issues:
Voltage Fluctuation - Dips/Flicker
Dips/Flicker are typically associated with fluctuating load such as starting of motors and operation of welding equipment. In addition to affecting lighting, spurious protection operation and equipment mal-operation may be caused.
Voltage Unbalance
Voltage unbalance will be caused by large single-phase or unbalanced loads causing excessive heating in rotating machines. Negative phase sequence voltage is used to define the degree of voltage unbalance.
Harmonic Distortion
Harmonic distortion can cause a number of problems ranging from overheating of equipment, (both UK Power Networks owned and customers) to spurious operation, or noise (hum, whine, hiss) on audio or telephony equipment. Equipment is designed to withstand distortion not greater than certain ‘Immunity’ Limits’ and these limits must not be exceeded. Harmonic distortion is caused by non linear equipment such as UPS systems, dimmer switches, computer switched mode power supplies and variable speed drives.
Unfortunately, due to the nature of shared power systems, conditions can occur when the supply deviates from the ideal. Power quality defects fall into eight main categories:
Blackouts;
Steady state under or over-voltage;
Short interruptions;
Rapid voltage changes (flicker);
Dips (or sags) and surges (temporary power frequency over voltages);
Transient over voltages (Spikes);
Voltage unbalance in three-phase systems (Negative Phase Sequence);
Harmonic distortion (Harmonic Voltages, often termed Total Harmonic Distortion).
This standard considers only those effects which may be directly attributable to a customer’s normal load; interruptions and blackouts are considered abnormal and will not be discussed here (faults and fault tolerance being quality of supply/operational issues rather than power quality issues).

Planning Guidance for Disturbing Loads Document Number: EDS 08-0132
Version: 3.0
Date: 21/03/2016
© UK Power Networks 2016 All rights reserved 20 of 33
A.1.1 Causes/Contributory factors
Each of these problems has a different cause; many are due to the shared nature of the electricity supply infrastructure - for example a fault on a customer's private network can cause a dip that will be seen outside the customer's network. Other problems, such as harmonic content, may not propagate beyond certain system components and are often contained within a relatively small geographical area.
Power quality disturbances may emanate from a number of different sources including customers' own equipment and installations, adjacent customers' equipment and installations, UK Power Networks’ equipment, rail traction loads, and NG's (400kV and 275kV) networks.
Blackouts and short interruptions (complete loss of supply) are an obvious example of how a simple fault can affect a number of network users. Voltage dips, caused by a sudden increase in one customer’s demand, are another.
Many power quality problems can be more subtle. For example a customer may draw ‘harmonic current’, i.e. his/her demand current waveform will contain harmonic components in addition to the fundamental frequency§. By virtue of voltage drops across the network's harmonic impedances, this will cause harmonic voltage distortion which propagates back into the public electricity supply. This distortion will usually (although not always**) have greatest impact at the nearest point of common coupling (PCC), typically at the busbars of the nearest substation where the presence of harmonics is observable as distortion of the voltage waveshape and can cause a number of problems for connected equipment.
A.2 European Standard - Power Quality
The European standard on power quality has now been adopted as a British standard - BS EN 50160. This standard sets out the quality limits within which power systems can be expected to operate.
In general, connections to the network which comply with the Energy Networks Association Engineering Recommendations will not create voltage waveform disturbances outside the limits prescribed by BS EN 50160 in terms of flicker, harmonics or negative phase sequence components (NPS). There is however some concern over the gradual growth in harmonic background levels, both in terms of Total Harmonic Distortion and, in particular, at the 5th harmonic level. There is little knowledge regarding the number and severity of voltage transients (due to faults, switching spikes, operation of capacitive loads etc.) to which networks are subjected, and the effect that these may have on customers’ apparatus. Whilst BS EN 50160 is referred to in the Distribution Code, compliance is not a DNO Licence Condition except in respect of harmonic compatibility limits which have been reproduced in ER G5/4-1.
§ Caused by a non-linear relationship between voltage and current; thus the current waveform will not be the
same ‘shape’ as the driving voltage waveform. ** Resonance conditions on the network can mean that an harmonic disturbance at one point on the network is
'magnified' such that its impact is greater at another point

Planning Guidance for Disturbing Loads Document Number: EDS 08-0132
Version: 3.0
Date: 21/03/2016
© UK Power Networks 2016 All rights reserved 21 of 33
Appendix B - General Overview
B.1 Voltage Dips and Fluctuations (Flicker)
Voltage dips are single reductions in voltage greater than 10% caused by faults or switching on the distribution system or disturbances on the customer's own system. Some disturbances of this type are inevitable in the operation of a large public distribution system and therefore customers who risk inconvenience or cost as a consequence of experiencing such disturbances would be advised to install voltage regulator or an UPS equipment.
The majority of voltage dips last between 100ms and 500ms, depending on the cause. As an approximate guide, across the country as a whole, an individual consumer in a town may experience up to four voltage dips per month from the distribution system, about half of which will have originated at 132kV or above. In rural areas the incidence may be higher. For more information, see ENA ETR 125 which contains the results of a voltage dip survey carried out in the UK from January 2000 to December 2004.
Voltage fluctuations are disturbances involving a series of voltage changes, which may be regular or irregular, caused by connection or disconnection of loads, or variation in running load requirements. Typical examples are electric furnaces and welding processes, although switching of relatively small domestic heating appliances can under certain circumstances cause significant fluctuation. The effect is generally seen as variation in light output from tungsten lamps (flicker), which is particularly evident in the frequency range above 5Hz.
In addition to visual annoyance, flicker can cause spurious protection operation, equipment damage etc. Customers with UPS equipment are often made aware of disturbances by automatic alarms or reporting associated with such equipment.
The recommended limits, for voltage fluctuations are given in ER P28. These limits are based on experience gained over many years, supported by laboratory tests conducted under the auspices of the UIE (International Union for Electroheat); they align with the requirements of IEC Document 77 "Electromagnetic Environment and Compatibility Levels for Low Frequency Conducted Disturbances and Signalling in Public Power Systems".
ER P28 goes beyond the relatively simple connection rules contained in earlier recommendations and bases assessment on the measurement or calculation of statistically derived parameters. The most important of these is the short term severity value, or Pst, which is defined as a measure of the visual severity of flicker derived from the time series output of a flickermeter over a ten minute period. This parameter is considered to provide a reliable measure of the risk of customer complaints. 'For longer period fluctuations Pst is calibrated such that it corresponds with the earlier requirement for a maximum variation of 3% (Pst under 1 in these conditions).
Many smaller disturbing loads may be connected to the system without detailed calculation or assessment of background disturbance levels and P28 provides a three stage approach to enable the degree of assessment to match the anticipated disturbance level. The initial two stages of the P28 three stage process are detailed in section 4.5. P28 should be referred to for detail of Stage 3.

Planning Guidance for Disturbing Loads Document Number: EDS 08-0132
Version: 3.0
Date: 21/03/2016
© UK Power Networks 2016 All rights reserved 22 of 33
B.2 Unbalance of Three-phase Voltages (Negative Phase Sequence)
Voltage unbalance is caused by differing phase loads or differing phase impedances, or a combination of both. It is defined as the ratio of the negative phase sequence component to the positive phase sequence component of the voltage, although in many situations there are simpler methods of calculating a reasonable approximation. Further information is given in ER P29, together with recommended limits under various circumstances.
Unbalanced load conditions typically arise on rural networks, where single-phase 11kV spurs and single-phase distribution transformers are more commonly connected to the two outer conductors of a three-phase line, and on the 132kV system, as a result of single-phase rail supplies connected at 25kV. Unequal phase impedances also arise on overhead lines because of the effect of asymmetrical conductor spacing on the magnetic fields generated by phase currents.
A relatively small degree of supply voltage unbalance can induce a very large current unbalance on connected three-phase rotating machines (typically a factor of 1 to 10), causing overheating or nuisance operation of protection. There have been a number of cases where motor protection equipment has operated due to transient unbalance, particularly where this is of the current balance type. Sometimes it may be possible to overcome this problem by resetting the protection equipment, relating it more closely to the thermal capability of the associated motor, but more commonly it will be necessary to identify the loads causing the problem and re-balance, or connect at a higher voltage. An alternative approach, appropriate in some circumstances, is to limit the load on individual single-phase spurs by converting the main spur to three-phase and connecting the small spurs across different phases to achieve a finer balance along the feeder. In the case of large, remote loads compensation equipment may have to be installed by the user.
Limits for voltage unbalance to be applied in the UK are as shown in ER P29.
B.3 Harmonics – Sources and Overview
Electronic equipment requires DC voltage to operate, with the conversion from AC to DC voltage occurring within the equipment via rectifiers or capacitors. Due to current being drawn in pulses and not at a continuous rate, it distorts the linear 50Hz sine wave. Equipment that causes this distortion is termed non-linear equipment. An extremely distorted waveform may be flat topped, notched, or may even approach a square wave in extreme cases, indicating the presence of significant harmonic components. Fourier series analysis allows a non-sinusoidal wave to be represented as the summation of a number of sine waves at different frequencies and magnitudes. Each sine wave is called an harmonic and are multiples of the fundamental frequency – hence the ‘harmonic components’ referred to in this text.
A voltage waveform which is distorted will contain ‘harmonic components’, i.e. frequencies which are whole multiples of the 50Hz fundamental frequency. E.g. 2nd harmonic is 100Hz, 3rd is 150Hz, etc.
Some equipment will inject frequency components into the supply which are not whole multiples of 50Hz; these are termed ‘inter-harmonics’ and may originate from a number of sources. ‘Power Line Carrier’ communications systems are an example of this.

Planning Guidance for Disturbing Loads Document Number: EDS 08-0132
Version: 3.0
Date: 21/03/2016
© UK Power Networks 2016 All rights reserved 23 of 33
The degree to which new non-linear equipment may affect electricity supply networks is generally proportional to the harmonic emissions from the equipment and the fault level at the Point of Common Coupling (PCC). The degree to which the network is already affected by harmonic distortion is also a key factor and with larger loads and long underground cables, resonance can be a problem with some harmonic frequencies.
Small non-linear or disturbing loads will appear on the network as background levels growth. Typical sources of harmonic voltage distortion include electronic motor controllers (variable speed drives), computers, switch-mode power supplies, rectifiers, thyristor or transistor controlled equipments, and many types of lighting. UK Power Networks has no control of the background demand, although voltage impact can be managed to a small extent by network reconfiguration to lower the impedance (increase the fault level) or to avoid known resonant conditions.
B.3.1 Examples of Harmonic Producing Loads
Almost all domestic and industrial loads consist of a combination of linear (resistive) and non-linear loads. Semiconductor devices used in power supplies exhibit strongly non-linear behaviour, with two examples being the simple full-wave bridge rectifier and thyristor dimmer switches. These are shown schematically in Figure 7.1 and Figure 7.2 below, with corresponding wave shapes in Figure 7.3, Figure 7.4 and Figure 7.5.
Load
(DC)
Source
(AC)
Figure 7.1 - Full wave single-phase bridge rectifier with smoothing capacitor
Figure 7.2 - Line commutated thyristor controller

Planning Guidance for Disturbing Loads Document Number: EDS 08-0132
Version: 3.0
Date: 21/03/2016
© UK Power Networks 2016 All rights reserved 24 of 33
0 20 40 60 80 100 120 140100
50
0
50
100100
100
it
vt
1271 t
Figure 7.3 - Voltage (blue) and current (red) waveforms across and through single-phase bridge rectifier (t in ms)
0 100 200 300 400 500 6000
100
200
300
400Harmonic currents due to non-linear load
359.461
0.08
cj
509.2960 fj
Figure 7.4 - Typical harmonic load-shape for single-phase bridge rectifier showing significant low order odd harmonics
Figure 7.5 - Nonlinear current waveform resulting from single thyristor domestic dimmer switch
-200
-150
-100
-50
0
50
100
150
200
1 15 29 43 57 71 85 99 113 127 141 155 169 183 197 211 225 239 253 267 281 295 309 323 337 351 365 379 393 407 421 435 449
Cu
rren
t (A
mp
s)
Time
Line commutated thyristor current

Planning Guidance for Disturbing Loads Document Number: EDS 08-0132
Version: 3.0
Date: 21/03/2016
© UK Power Networks 2016 All rights reserved 25 of 33
The bridge rectifier will cause a current wave shape with significant harmonic content simply because the diodes transit from the 'off' state to the forward biased ('on') state when the voltage across them exceeds their on-state voltage. For a lightly loaded system where the capacitor retains significant charge, this can be close to the peak of the line voltage waveform. In the thyristor dimmer, the gate voltage drives the device into the conducting state when the line voltage passes a threshold defined by the position of the potentiometer. With both circuits, conduction stops when the line voltage falls below the on-state voltage drop of the device (line commutation). The devices stay in the off state until the voltage rises beyond the required on-state voltage in the next half-cycle.
Modern switched-mode power supplies (as used in computers etc) will switch or chop the current waveform many times in a cycle; higher frequency operation allows the power supplies to be smaller and cheaper, but such devices introduce high frequency harmonics and inter-harmonics onto the network.
Some generators produce electricity via a DC to AC conversion stage in order to allow the use of machines with a wide speed range. These converters can be a substantial source of harmonic distortion if no mitigation techniques are applied. Similar comments apply to DC transmission schemes such as HVDC or HVDC light.
Wind farms are often located in remote areas and hence require long underground cables to connect to existing networks. The increase in shunt susceptance can cause resonance conditions leading to magnification of some harmonic voltages.
UK Power Networks is expected to comply with statutory obligations to maintain the supply voltage (RMS amplitude) within certain limits and to maintain power quality by methods listed in the distribution code.
Harmonic distortion is generally caused by equipment with non-linear voltage/currents characteristics. This may be grouped into three main categories:
Converter equipment, such as UPS systems, light dimmers, self ballasted lamps, switched mode power supplies for computers and thyristor or transistor controlled variable speed drives.
Magnetic devices, such as transformers, reactors and static var systems.
Non resistive loads, such as induction and arc furnaces.
All such loads are referred to as ‘non-linear’, in that the current drawn is not linearly related to the system voltage throughout the 50Hz cycle.
The maximum values of harmonic currents that can be accepted on the distribution system are given in ENA ER G5/4-1. The limits recognise two harmonic effects:
a) Transient (e.g., displacement of zero crossing, which may disturb electronic apparatus).
b) Long term, resulting in heating (e.g. effects on motors, capacitors etc.).
In addition, it should be noted that harmonic currents may be amplified by resonance between inductive and capacitive network elements. Also Triple-N harmonics, since they are zero sequence harmonics (unlike the fundamental which is positive) are additive in the neutral, which can give rise to overloading if care is not exercised.

Planning Guidance for Disturbing Loads Document Number: EDS 08-0132
Version: 3.0
Date: 21/03/2016
© UK Power Networks 2016 All rights reserved 26 of 33
The main area of concern relating to harmonics continues to be emissions from industrial converter equipment and ER G5/4-1 specifies the maximum individual percentage of harmonic voltages appropriate to this application. However, it should also be noted that over the last few years the growth in data processing and similar equipment with switched mode power supplies has created a growing level of background harmonics which cannot be related to individual installations. 5th harmonic pollution in particular has begun to cause difficulties, since this is close to the resonant frequency of many distribution networks. The matter is under review at international level.
The maximum voltage notch on the sine wave caused by thyristor switching must not exceed 20% of peak voltage [Existing cyclo-control equipment is exempt from this requirement].
It is often possible to achieve substantial improvements by suitable choice of equipment. For example, even harmonics may be eliminated from three-phase variable speed motor drives by employing a six-pulse control system - or twelve pulse system for motors above 150kVA rating. Similarly, if more than one variable speed drive is to be installed, it may be possible to reduce some harmonic currents by supplying the drives through phase shifting transformers. This is further discussed in G5/4-1.
B.4 DC Component
DC current may be present in some networks as a result of the use of half wave rectification in various types of electronic equipment. If of sufficient value, this may cause mal-operation of some older types of RCD††, or core saturation in transformers. Core saturation results in generation of harmonic currents and voltages. In view of these effects the industry's position is that half wave rectification and asymmetric phase control should be avoided in all circumstances.
B.5 Frequency Fluctuations
The permitted maximum variation in system frequency is + or - 0.5Hz, although actual variation is generally much less than this. Under exceptional fault conditions it is possible for the rate of change of frequency variation to reach 1Hz/s. No standards or recommendations specifically relate to this effect.
B.6 Combination Effects
Frequency converters or computer control drives can feed back frequencies into the distribution system which are not strictly harmonic but are related to the speed of the device which is being driven (e.g. Pulse-width modulated drive circuits). Such equipment may produce combined voltage fluctuation/harmonic effects. High frequency switching components (1kHz or higher) will tend to be damped by the network and are unlikely to propagate to a point where they may cause disturbance to other users. Large PWM drives (>10kW) may however cause problems.
†† Residual Current Devices, used to provide fast and sensitive earth fault protection within an LV installation.

Planning Guidance for Disturbing Loads Document Number: EDS 08-0132
Version: 3.0
Date: 21/03/2016
© UK Power Networks 2016 All rights reserved 27 of 33
APPENDIX C - General Approach - High Frequency Disturbances
C.1 Voltage Spikes
Occasional voltage spikes on a customer’s installation may be caused by the switching of appliances, opening of contactors, melting of fuses etc. However, such distortions are rapidly attenuated as they pass upwards into the distribution system, and in most cases, therefore, will at worst affect only neighbouring customers supplied by the same transformer. Studies have indicated that at least ten spikes per day greater than 200V may be expected in the case of domestic customers, and a few per day at the terminals of a distribution transformer.
Random spikes produced by normal switching of loads can have amplitudes up to 800V, with rise times down to a few nanoseconds and durations generally less than 10 microseconds. The single operation of a mechanical switch is likely to create a train of spikes, caused by contact bounce, over a period of a few milliseconds. Infrequent random spikes resulting from faults on the power system, or on adjacent electrical equipment, can have greater maximum amplitudes than those produced by normal switching. Values up to at least 2kV, with durations of more than 100 microseconds, but with rise times generally of 1 microsecond or greater, have been reported.
Repetitive spikes (with repetition rates of 50 or more per second) will generally be traced to equipment which uses power semi-conductors, such as thyristors and triacs, variable speed drives, or commutator motors. The maximum amplitude of such spikes is usually less than 300V, with rise times between 0.05 to 1.0 microseconds.
Most problems caused by spikes relate to locally generated disturbances and can usually be solved by adding a filter to the power supply circuit or by introducing appropriate screening and bonding of equipment and connecting leads.
A lightning strike on or adjacent to an exposed overhead power line can result in high voltage and high power spikes. In the case of a direct strike the spike may exceed 100kV, being practically impossible to fully protect equipment connected to such a system. Although spikes will generally be greatly attenuated by the distribution network before they reach the low voltage customer's installation, peaks up to 6kV may still be experienced on occasions. Such effects are, however, very infrequent on buried cable systems.
C.2 Radio Frequency Signals
The radio frequency (RF) content on some LV networks has recently been increasing, mainly as a result of greater use of parts of the 10-150kHz band for mains signalling purposes. This is against a background level of RF caused by devices which produce significant energy in the mains signalling band, such as induction hobs and power electronic equipment using pulse width modulation techniques. Some of this energy is injected back into the supply network. It is also possible for equipment installed near radio and radar transmitters to pick-up significant levels of RF interference by radio transmission.
Currently no compatibility levels for RF signals have been agreed internationally, although emission limits for part of the frequency band are included in the EEC directive on the control of interference from household and other appliances. These are covered in BS800, 1988. Guidance on the limits of frequency and power within which equipment for mains signalling should be designed is contained in ENA ER G22/2. Equipment which is CE marked will be tested for immunity to and emission of normal levels of RF interference, these levels being far beyond those found on the distribution network.

Planning Guidance for Disturbing Loads Document Number: EDS 08-0132
Version: 3.0
Date: 21/03/2016
© UK Power Networks 2016 All rights reserved 28 of 33
Appendix D - Resolution of Power Quality Problems
D.1 Developments in Power Electronics
A particular area of interest is that concerning developments in power-electronics and “power conditioners”. High-power rapid-switching thyristors (GTO‡‡, IGBT§§, etc.) offer new opportunities for correcting power quality problems arising from network or upstream events, i.e. voltage dips and sags, and for correcting problems emanating from customers' installations - such as low/varying power factor, harmonics, voltage unbalances and flicker.
Whilst most end-customers do not require enhanced levels of power quality, there are some processes which are acutely sensitive to some of the effects described above. For many, the solution might be the use of UPSs placed at strategic points on the customers' installation. However, in some cases, the solution may need to be applied to the whole of the customers' installation rather than to specific items of equipment. Typical customers who might have an application for such technology would be those in the semi-conductor, glass, plastics, paper, textile, chemical industries and others with specialised processes.
A practical example of developments in power-electronics, which has application for certain types of industrial customers with voltage wave-form sensitive processes, is the dynamic voltage restorer (DVR). This is one of a number of applications under the general family heading of ‘flexible a.c. transmission systems’ (FACTS). These devices can smooth out a sudden transient voltage dip which might otherwise result in the tripping of sensitive protection devices resulting in loss of production. These devices are now being promoted by a number of specialist companies with ratings suitable for up to and including multi-MW supplies. A DVR based on capacitor energy storage has been successfully applied in the UK to overcome voltage-dip problems being experienced by a major paper mill. Developments in superconducting magnetic energy storage (SMES) and flywheel energy storage (FES) technology are producing near-to-market applications for power quality problems.
D.2 Power factor correction
Installation of Power Factor correction equipment may be an economical alternative to
conventional reinforcement of the network. As well as cos() correction, static var compensators can resolve problems of flicker which would otherwise require network impedance reduction.
D.3 Negative Phase Sequence reduction
Negative Phase Sequence voltage components (NPS) caused by unbalanced network loads can be reduced by network reconfiguration in some cases, although where the level of unbalance is seen to vary with time then dynamic balancers will need to be employed.
‡‡ Gate-turn-off thyristors, enable the current to be interrupted before the natural (line commutated) current
zero. §§
Insulated gate bipolar transistors

Planning Guidance for Disturbing Loads Document Number: EDS 08-0132
Version: 3.0
Date: 21/03/2016
© UK Power Networks 2016 All rights reserved 29 of 33
D.4 Tap Changers
Tap changer performance provides little or no power quality problems to the network in general. However, the response time of a tapping operation can mean that voltage drops caused by loss of a circuit or plant will result in a step-change in voltage which may fall outside statutory limits until the tap changers have corrected for this change. In extreme circumstances the step-change will be sufficient to inhibit tap change operation, thus preventing overvoltage when the faulted circuit is restored. The evolving nature of the network means that this scenario can occur, particularly on solidly interconnected sections, although this is classed as an 'infrequent' event and is an accepted risk. No provision is usually made to address voltage step-change issues resulting from a fault.

Planning Guidance for Disturbing Loads Document Number: EDS 08-0132
Version: 3.0
Date: 21/03/2016
© UK Power Networks 2016 All rights reserved 30 of 33
Appendix E - Motor Assessments
The starting current of a motor is also called "locked rotor current" and is not related to mechanical load. It is a property of the motor design and can be from five to nine times the full load current.
Motor starting current causes a voltage drop on the cable as seen in Figure 7.6. If the voltage drop is too big, the motor could stall or fail to accelerate. Starting current will not significantly heat the cable, but mechanical and thermal effects could lead to cumulative damage if starting current is frequent, and this should be examined.
Voltage dips associated with motor starting will propagate to the distribution network and their magnitude will be inversely proportional to fault level.
VO
LT
AG
E
TIME(Sec)
Vo
lta
ge
Ch
an
ge
(Vd
)
<=30mSec
SH
OR
T T
RA
NS
IEN
T
USUAL FORM OF VOLTAGE CHANGES CAUSED BY MOTOR STARTING(Ref.P28)
Figure 7.6 - Voltage dip caused by motor starting

Planning Guidance for Disturbing Loads Document Number: EDS 08-0132
Version: 3.0
Date: 21/03/2016
© UK Power Networks 2016 All rights reserved 31 of 33
Appendix F - Calculation of Voltage Dip caused by an Instantaneous Electric Shower using WinDebut
1) Create a new customer type for the shower using the consumer demand type - ‘Maximum demand no – q’.
Figure 7.7 - Consumer demand type path
Figure 7.8 - Consumer type specification

Planning Guidance for Disturbing Loads Document Number: EDS 08-0132
Version: 3.0
Date: 21/03/2016
© UK Power Networks 2016 All rights reserved 32 of 33
2) Add transformer of correct size.
Figure 7.9 - Transformer details
3) Add a Point Load using the new consumer type ‘Shower’ and set to the required shower size in kW.
Figure 7.10 - Point load specification

Planning Guidance for Disturbing Loads Document Number: EDS 08-0132
Version: 3.0
Date: 21/03/2016
© UK Power Networks 2016 All rights reserved 33 of 33
4) Connect Network.
Figure 7.11 - Cable connection
5) Run WinDebut and select the point load to see the loop resistance (WinDebut version 3 was used for this calculation).
6) The loop resistance in this example is 30 m ohms.
7) The volt drop caused by the shower should then be calculated from the (loop resistance x shower load current)*** to ensure that it is within the required limit.
***Note: The voltage drop from WinDebut should not be used as this does not take into account the voltage
regulation of the transformer, which for smaller transformers can be significant.