eDrive testing · Optimized testing of electric drives - Durham Instruments Testing... · ·...
12
testing by HBM Measuring and analyzing of electrical machines Optimized testing of electric drives
Transcript of eDrive testing · Optimized testing of electric drives - Durham Instruments Testing... · ·...

testing by HBM
Measuring and analyzing of electrical machines
S369
6-2.
0 en
7
-100
2.36
96
Optimized testing of electric drives

Battery Inverter Electric motor
DAQ systemPower meterDigital multimeter
DC voltage and DC current AC voltage and AC current Torque and rotational speed
Vehicle chassis
2
Improving the efficiency of inverter, motor and the entire drive train is a central task for the manufacturers of electric or hybrid drives. The standard method is not intended for the simultaneous, continuous and dynamic acquisition of mechanical and electrical parameters.
Major drawbacks: Time synchronization between different systems
is difficult
Data storage in three different systems and data formats
No continuous raw data acquisition
Slow calculation cycles of the power meters
Inadequate documentation of the algorithms for power analysis
Many customers report:
"With our existing set-up we sometimes measure efficiencies larger than 1, which is obviously wrong. But we can't investigate any further as there is no raw data."
Have you had similar experiences? Take a closer look at our solution: It meets all your requirements for the testing of electric motors.
Facing challenges: with the standard method?
Weaknesses of the current approach New solution from HBM
Standard approach using three different acquisition systems
T
GEN3i
GEN3i
AC voltage and AC current
DC voltage and DC current
Motor temperatureInverter temperature
Torque and rotational speed
Optical network
PC in control area
Battery Inverter Electric motor Vehicle chassis
3
Advantages of the new system: Continuous storage of all raw data for
verification and analysis
Synchronous acquisition of all data
Storage of all data in a standardized system
Power calculation per half cycle
Live oscilloscope and FFT display
The new all-in-one solution from HBM Test & Measurement helps you to better understand the inverter and the electric motor and thus to make conversion and regenerative braking more efficient. Our integral system offers perfectly matched components from a single source, covering electrical signals up to 1000 V, mechanical signals and temperatures. It uses the best-in-class torque transducer and comes with software specifically developed for this application.
With the new, integral solution!
Weaknesses of the current approach New solution from HBM
New HBM testing concept - one integral system

4
T
GEN3i
GEN3i
AC voltage and AC current
DC voltage and DC current
Motor temperatureInverter temperature
Torque and rotational speed
Optical network
PC in control area
Battery Inverter Electric motor Vehicle chassis
New HBM testing concept - one integral system
Advantages of the new system: Continuous storage of all raw data for
verification and analysis
Synchronous acquisition of all data
Storage of all data in a standardized system
Power calculation per half cycle
Live oscilloscope and FFT display
The time-consuming and error-prone synchronization of different measuring instruments is now a thing of the past. Measurement data acquisition with Genesis HighSpeed products is perfectly matched to our digital torque transducers.
This combination enables you to perform highly dynamic and precise tests on inverters and electric motors. Continuous measurements of up to an hour with a maximum of two million measurements per second per channel are not a problem.
All-in-one solution including GEN3i data recorder and T40B torque transducer
HBM test and measurement equipment in a test bench for hybrid motors at Darmstadt Technical University, Institute for Combustion Engines and Vehicle Drive Systems (Institut für Verbrennungskraftmaschinen und Fahrzeugantriebe (vkm)).
One solution for all your requirements
More information at www.hbm.com/edrivetesting More information at www.hbm.com/edrivetesting

5
2PER CHANNEL
MS/s
The GEN3i data recorder provides maximum sampling rates and continuous direct-to-disk storage at up to 200 MB/s. Based on a modular platform the system can easily be configured to meet your specific needs - whether for 3, 6, 12 or 24 current/voltage channels or, alternatively, with an additional temperature measurement module.
Set-up requires minimal time and is application-oriented. Many gigabytes of measurement data can be displayed quickly thanks to our patented StatStream technology. In addition, the reliability and high precision of our torque transducers ensure excellent measurement results.
Voltage and current measurements
2 MS/s per channel continuous storage
Unlimited recording length
Isolated inputs from ± 20 mV to ±1000 V
Measurement of phase-to-phase voltage or phase voltage
Direct connection of current clamps or current transformers (via shunt)
Scaling of the current sensors through sensor database with calibration values
Torque and rotational speed measurement with recognition of direction
Direct connection of T12 or T40B
Digital measurement eliminating analog errors
Reference accuracy up to 0.03 %
High bandwidth up to 6 kHz
Reference pulse for identification of the rotor position
HBM’s all-in-one system for measurements on electric motors and generators
More information at www.hbm.com/edrivetesting More information at www.hbm.com/edrivetesting

6
Measurement, storage and analysis of:
Dynamic load cycles
Starting currents
Control behavior
Behavior in the event of a fault
Emergency shutdowns
Measurement data analysis at any time thanks to raw data storage
In contrast to power meters, the GEN3i continuously records all raw data. Therefore, calculated results such as RMS values or efficiencies can be verified at any time later. Moreover, the direct acquisition of raw data allows a detailed analysis of inverter and electric motor.
Detailed analysis of the drive train is possible thanks to continuous acquisition of raw data.
Recording of all measurement data allows later playback, verification and further analyses.
Continuous data recording and playback Application-oriented software

7
The GEN3i data recorder with Perception software is intuitive to operate. Award-winning.
A special, application-oriented user interface has been developed for measurements on electric drives or generators. Therefore, no experience with the measuring instrument or the software is required. No familiarization is needed nor are there any problems with wiring or setup; you get your measurement results more quickly and reliably.
The Setup menu simulates your measurement task and is visualized in the function blocks of an electric drive. You select, for example, power supply, type of connection, current sensors used and the sampling rate - done.
There is no faster and easier way to do this.
Award-winning user interface
Continuous data recording and playback Application-oriented software

8
Immediately see the resultValues computed from electrical and mechanical parameters are displayed live already during measurement with the GEN3i data recorder.
LIVE calculation results
RMS values of current, voltage and fundamental frequency
Active, apparent and reactive power
Torque and rotation speed
Mechanical power
Power factor and efficiency
and many other results ...
In addition to these numeric results, live visualization of an oscilloscope, FFT and trend display is also possible, optionally even on a separate screen.
Advanced LIVE results will be available via software update from Q1/2014
Power meter and oscilloscope in a single device Basic analysis options

9
Requirements
Computing the RMS value requires that the individual signal cycles are clearly identified.
This cycle detection needs to work reliably even with difficult signals such as ripple currents.
Further analysis needs to provide all important electrical and mechanical parameters per cycle.
Measurement and analysis options
Phase-phase and phase-star measurements
RMS values of current and voltage per phase
Cumulative RMS values
Active, apparent and reactive power
Mechanical power
Power factor and efficiency
SolutionPerception software detects all zero crossings using special algorithms and can display the result of this cycle detection for verification. The software simultaneously generates a plausibility signal enabling instant feedback to be given. It enables all calculation steps from cycle detection through to the final computation, for example, of the motor's efficiency to be individually kept track of and verified.
Cycle detection and display in the reference current channel
Mechanical power, electrical active and apparent power as well as motor efficiency in the event of dynamic load cycles
RMS value calculation of the three phase currents
Analysis with guaranteed precision
Power meter and oscilloscope in a single device Basic analysis options
10
I1
R1
Uq RFeU
I’2
X’σ R’2s
Iµ Iv
Xh
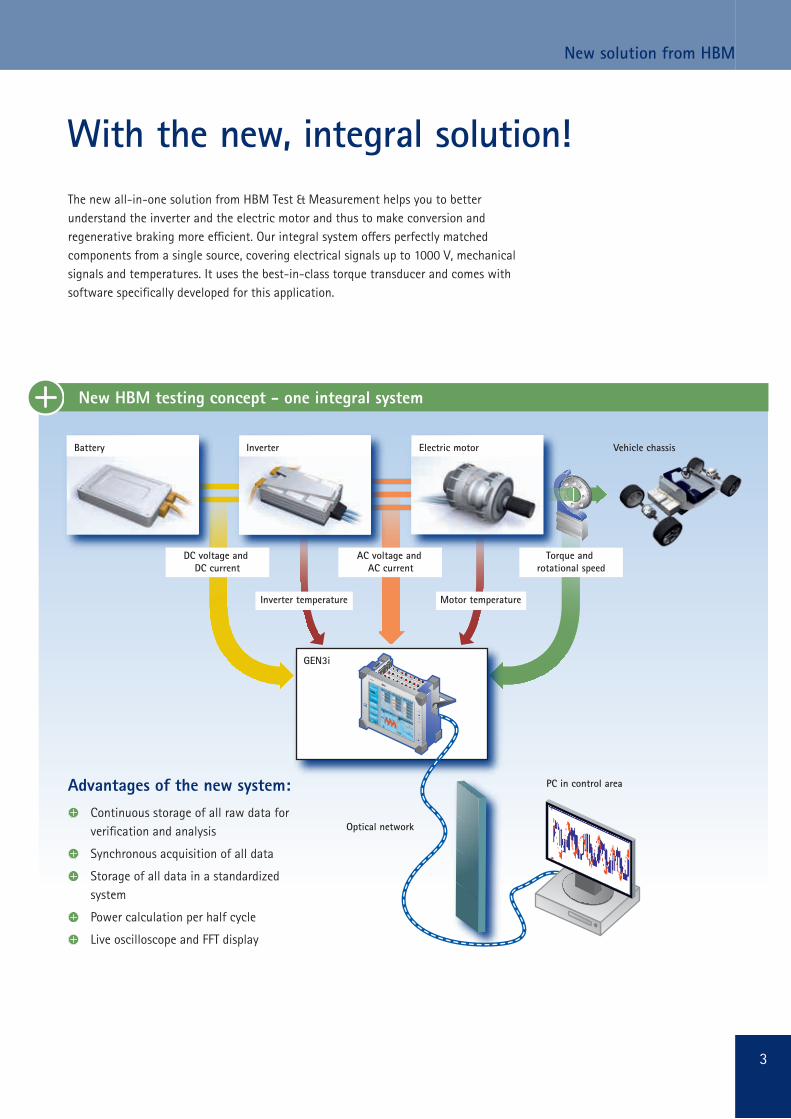
Detailed inverter and motor analysesThe formula editor integrated with Perception software is a powerful toolbox that enables even highly complex calculations to be performed. Over 200 mathematical functions are available that can be combined as required and used even for huge data sets in the gigabyte range.
Current curve and computed fundamental
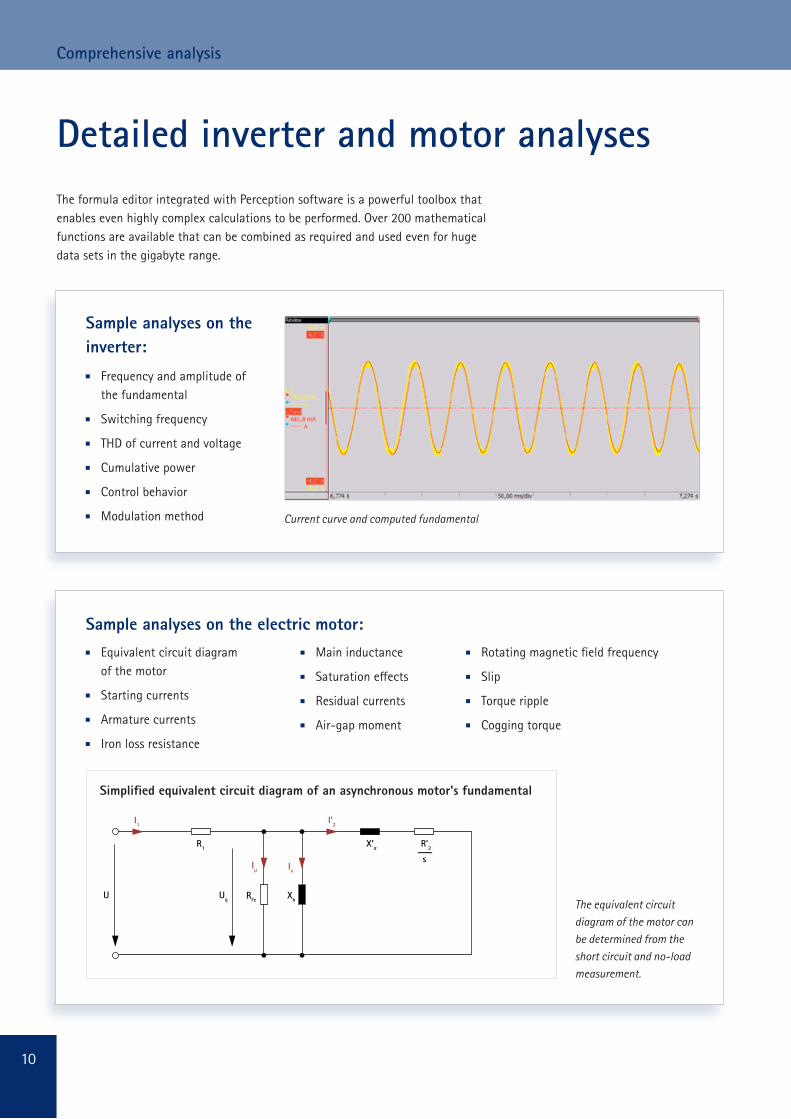
The equivalent circuit diagram of the motor can be determined from the short circuit and no-load measurement.
Sample analyses on the electric motor: Equivalent circuit diagram
of the motor
Starting currents
Armature currents
Iron loss resistance
Main inductance
Saturation effects
Residual currents
Air-gap moment
Rotating magnetic field frequency
Slip
Torque ripple
Cogging torque
Sample analyses on the inverter:
Frequency and amplitude of the fundamental
Switching frequency
THD of current and voltage
Cumulative power
Control behavior
Modulation method
Simplified equivalent circuit diagram of an asynchronous motor's fundamental
Comprehensive analysis Interfaces
T
GEN3i
OpticalEthernet
PNRF reader
Third-party software for further processing
AndroidMAC OSLinuxRPC
Remote control Remote control
COM
Windows PC with third-party software
PNRF database
PC with Perception software
Voltage, current, torque, speed and more
GEN3i
11
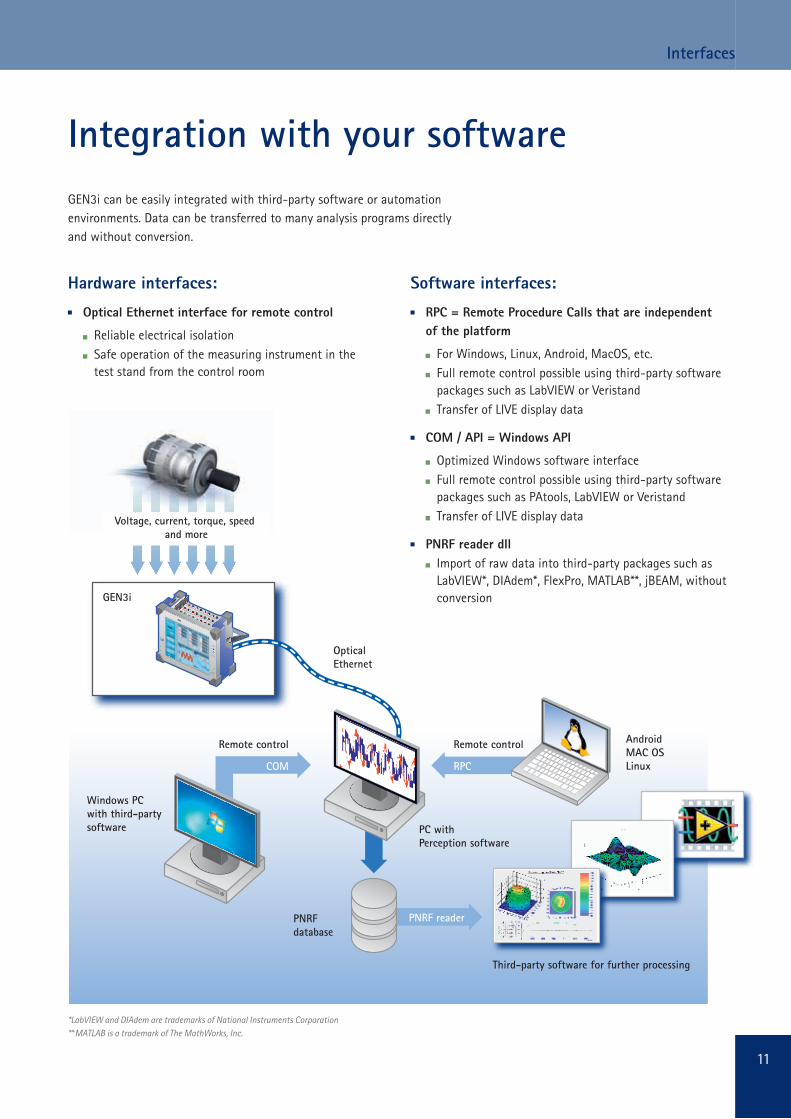
Integration with your softwareGEN3i can be easily integrated with third-party software or automation environments. Data can be transferred to many analysis programs directly and without conversion.
Hardware interfaces:
Optical Ethernet interface for remote control
Reliable electrical isolation Safe operation of the measuring instrument in the
test stand from the control room
Software interfaces:
RPC = Remote Procedure Calls that are independent of the platform
For Windows, Linux, Android, MacOS, etc. Full remote control possible using third-party software
packages such as LabVIEW or Veristand Transfer of LIVE display data
COM / API = Windows API
Optimized Windows software interface Full remote control possible using third-party software
packages such as PAtools, LabVIEW or Veristand Transfer of LIVE display data
PNRF reader dll Import of raw data into third-party packages such as
LabVIEW*, DIAdem*, FlexPro, MATLAB**, jBEAM, without conversion
* LabVIEW and DIAdem are trademarks of National Instruments Corporation** MATLAB is a trademark of The MathWorks, Inc.
Comprehensive analysis Interfaces

HBM Test and Measurement
Tel. +49 6151 803-0Fax +49 6151 [email protected]
S369
6-2.
0 en
7
-100
2.36
96
ww
w.h
bm.c
om