eDreams ODIGEO June 2014 Quarterly Results - 20140829 · 2016-02-08 · Meta partner impact −...
49
First Quarter, Ended June 30, 2014 Results presentation
Transcript of eDreams ODIGEO June 2014 Quarterly Results - 20140829 · 2016-02-08 · Meta partner impact −...

First Quarter, Ended June 30, 2014
Results presentation

� Certain statements included or incorporated by reference within this presentation may constitute “forward-looking statements” in respect of the Group’s operations, performance, prospects and/or financial conditionand the industry in which the Group operates. By their nature, forward-looking statements involve a numberof risks, uncertainties and assumptions and actual results or events may differ materially from thoseexpressed or implied by those statements. Accordingly, no assurance can be given that any particularexpectation will be met and reliance should not be placed on any forward-looking statement. Additionally,forward-looking statements regarding past trends or activities should not be taken as a representation thatsuch trends or activities will continue in the future. Statements in this presentation reflect the knowledge andinformation available at the time of its preparation. The Group does not undertake any responsibility orobligation to update the information in this presentation, including any forward-looking statement resultingfrom new information, future events or otherwise. Nothing in this presentation should be construed as a profitforecast.
� This presentation does not constitute or form part of, and should not be construed as, an offer or invitation tosell, or a solicitation of any offer to purchase or acquire any securities or related financial instruments of thecompany, nor shall it or any part of it or the fact of its distribution form the basis of, or be relied on inconnection with, any contract or commitment or investment decisions relating thereto, nor does it constitute arecommendation regarding the securities of the company. Past performance cannot be relied upon as a guideto future performance and persons needing advice should consult an independent financial adviser.
� This presentation has been sent to you in an electronic form. You are reminded that documents transmittedvia this medium may be altered or changed during the process of transmission and, consequently, neithereDreams ODIGEO nor any of its subsidiaries, including Geo Travel Finance S.C.A. and Geo Debt FinanceS.C.A., nor any director, officer, employer, employee or agent of theirs, or affiliate of any such person, acceptsany liability or responsibility whatsoever in respect of any difference between the presentation distributed toyou in electronic format and the hard copy version available to you on request.
� In the United Kingdom, this presentation is directed only at persons who (i) fall within Article 43(2) of theFinancial Services and Markets Act 2000 (Financial Promotion) Order 2005, as amended (the “Order”), (ii) arepersons having professional experience in matters relating to investments who fall within the definition of“investment professionals” in Article 19(5) of the Order, or (iii) are persons who are high net worth entitiesfalling within Article 49(2)(a) to (d) of the Order, and other persons to whom it may lawfully becommunicated (together “Relevant Persons”). Under no circumstances should persons who are not RelevantPersons rely or act upon the contents of this presentation. Any investment or investment activity to which thispresentation relates in the United Kingdom is available only to, and will be engaged only with, RelevantPersons.
1
Disclaimer
Highlights of Q1 Results - CEO
Drivers of Margin Evolution - CFO
Key Strategic Initiatives- CEO
Outlook - CEO
Appendix

3
Investor presentation – Quarter ended June 30, 2014
Key financial highlights
In light of the current market environment and the increase in
competition, results in the quarter ended June 2014 have been
impacted.
� Revenue margin up +5% YoY
− Core markets (61% o/total) flat due to France and
Italy . Spain has performed well
− Expansion (39% o/total) growing at 13% YoY
driven by markets outside of Europe
� Adjusted EBITDA margins at 21% for Q1 FY 14/15
− Mainly impacted by a number of sudden industry
developments
− Numerous initiatives in place to mitigate this impact
� Stable Debt Coverage level at 3.19x vs last year (3.18x)
despite reduction in EBITDA
� Deleveraging – Repayment of €46 million of debt on the
30th of May, this amortization of debt will imply an annual
reduction in financial expenses of €5 million.
Source: Management accounts, unaudited
Revenue margin growth
Adjusted EBITDA Margin
31%
21%
0%
5%
10%
15%
20%
25%
30%
35%
Adjusted EBITDA
margin
Q1 Jun.13
Adjusted EBITDA
margin
Q1 Jun.14
as
a %
of
reve
nu
e m
arg
in €31.8 m
€22.5 m

4
Investor presentation – Quarter ended June 30, 2014
Revenue Margin Core and Expansion
Revenue Margin - Core
Revenue Margin - Expansion
Source: Management accounts, unaudited
66.1 66.1
-
20
40
60
80
Revenue margin
Q1 Jun.13
Revenue margin
Q1 Jun.14
In €
mil
lio
n
0%
36.9 41.6
-
20
40
60
80
Revenue margin
Q1 Jun.13
Revenue margin
Q1 Jun.14
In €
mil
lio
n
� Core segment flat on revenue margin
� France and Italy more impacted than Spain, which has performed well
� Expansion segment continues to drive revenue margin growth with 13% YoY growth
� New launch of countries like Russia
� Good performance of some recent launch (NL) or existing countries (US)
64% 61%
36% 39%
Core markets: France, Spain & Italy
Expansion markets: Germany, Austria, UK, Nordics and others
xx% % of total revenue margin

5
Investor presentation – Quarter ended June 30, 2014
Non Flight Rev growth of 22% drives total Rev Growth
Revenue Margin - Flight
Source: Management accounts, unaudited
� Flight revenue margin growth 1%
� Non flight revenue margin grew by 22%
− Driven by strong results in non transactional revenue (advertising and meta, growing by €2.5 million, or 1.9x YoY; €0.5 million is organic growth and €2 million coming from Liligo acquisition), hotels and cars (4th quarter impact of platform change) and other projects around payments revenue.
Revenue Margin - Non flightNon Flight Contribution to Revenue margin
17%20%
5%
10%
15%
20%
25%
Q1 Jun.13 Q1 Jun.14
in %
of
reve
nu
e m
arg
in

Highlights of Q1 Results - CEO
Drivers of Margin Evolution - CFO
Key Strategic Initiatives - CEO
Outlook - CEO
Appendix
7
Investor presentation – Quarter ended June 30, 2014
Variable Costs
55.0% 55.9% 55.0%59.1%
55.8%60.5%
55.3%
63.2% 65.2%
0%
10%
20%
30%
40%
50%
60%
70%
Jun-12 Sep-12 Dec-12 Mar-13 Jun-13 Sep-13 Dec-13 Mar-14 Jun-14
as
a %
of
rev
en
ue
ma
rgin
Note: Unaudited
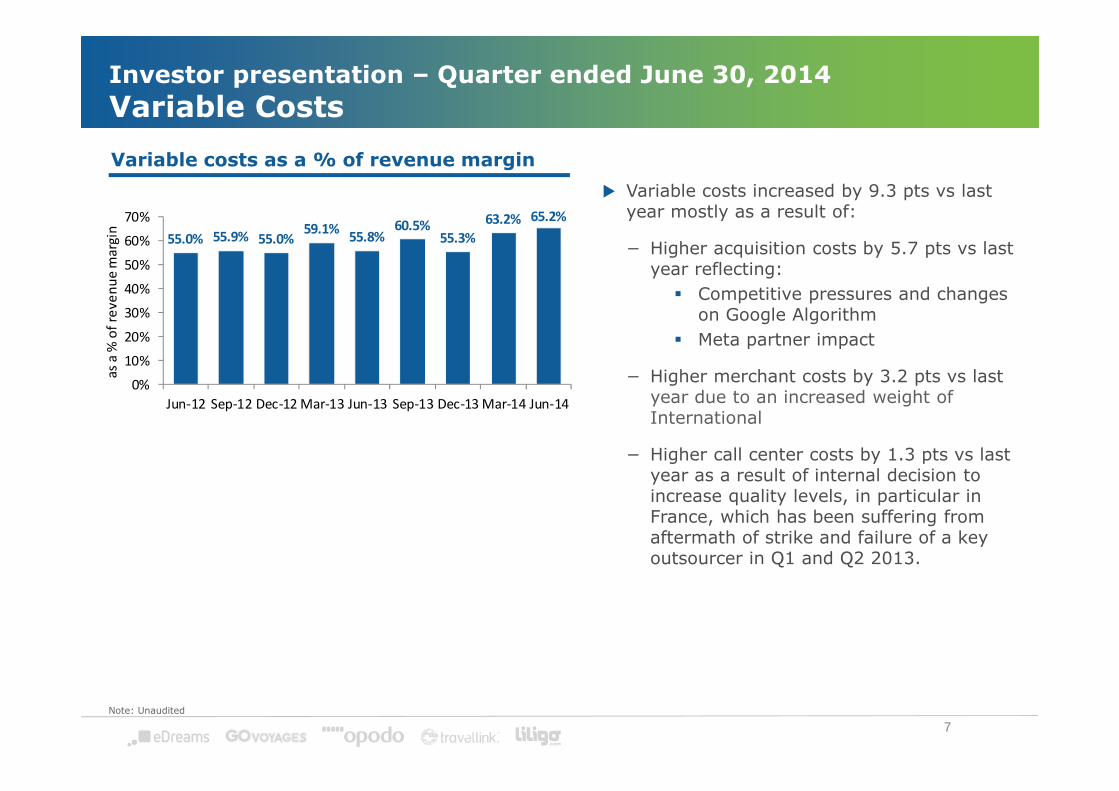
Variable costs as a % of revenue margin
� Variable costs increased by 9.3 pts vs last year mostly as a result of:
− Higher acquisition costs by 5.7 pts vs last year reflecting:
� Competitive pressures and changes on Google Algorithm
� Meta partner impact
− Higher merchant costs by 3.2 pts vs last year due to an increased weight of International
− Higher call center costs by 1.3 pts vs last year as a result of internal decision to increase quality levels, in particular in France, which has been suffering from aftermath of strike and failure of a key outsourcer in Q1 and Q2 2013.

13.6 13.0
17.6
14.0 14.8
-
2
4
6
8
10
12
14
16
18
20
Jun-13 Sep-13 Dec-13 Mar-14 Jun-14
in €
mil
lio
n
8
Investor presentation – Quarter ended June 30, 2014
Fixed Costs
13.2%% of RM 11.8% 17.8% 12.0% 13.7%
Note: Unaudited
Fixed costs – in value and % of RM
� In quarter ended June 2014, fixed costs increased largely driven by an increased focus to invest in engineering capabilities to adapt to the new market situation and deliver on our growth expectations (in internationalization, mobile, meta, white label, ancillaries)

31.8
22.5
(5.0)(1.0) (0.7)
(2.6)
0
5
10
15
20
25
30
35
Adjusted EBITDA
Quarter ended Jun-13
Competitive pressure
& Google algorithm
Meta partner Fixed costs Other Adjusted EBITDA
Quarter ended Jun-14
In €
mil
lio
n
9
Investor presentation – Quarter ended June 30, 2014
Adjusted EBITDA - BridgeAdjusted EBITDA bridge – Quarter ended June 2014 vs quarter ended June 2013
Note: Unaudited. Calculation methodology on page 39
� Quarter Performance strongly impacted by important and sudden changes
− Important change in Google Algorithm making it unprofitable to bid for certain airline-branded keywords
− One of our Metasearch Partners, decided to eliminate certain traffic driving options, which had driven significant
volumes at profitable levels to us
� Increased competitive pressure, the impact of which was magnified by the above changes
� Factors above affect the whole industry, and in this environment we are still holding an advantage in profitability
� Factors above have resulted in both (1) a decrease in Bookings and Revenue Margin, and (2) an increase in cost per
booking
� Increase in Fixed costs, particularly to strengthen our Technology function
(*) Approx. 60% of this amount is driven by the negative effect of the increase in merchant costs and customer service costs, partially offset by positive effect of Liligo and new GDS contract
Increased ease of access to Ryanair inventory for all OTAs in general has affected us negatively in Italy but for the aggregate of eDreams ODIGEO we have a positive effect on EBITDA YoY
(*)

10
Investor presentation – Quarter ended June 30, 2014
Google algorithm change and increased competition
Note: Unaudited
19.6%
(5.3)%
(10)%
(5)%
+0%
+5%
+10%
+15%
+20%
+25%
Quarter ended Mar-14 Quarter ended Jun-14
YoY
va
ria
tio
n i
n p
urc
ha
ses
13.7%
23.1%
+0%
+5%
+10%
+15%
+20%
+25%
Quarter ended Mar-14 Quarter ended Jun-14
YoY
va
ria
tio
n i
n p
urc
ha
ses
Airline branded keywords
Other non branded keywords
� Airline Branded Keywords have been strong traffic and profit drivers historically
− Bookings from this category growing at 20% as of quarter ended March 2014
− Changes in Google changed landscape to -5% YoY , and worse cost per booking
� eDreams ODIGEO reacted to maintain revenue growth by increasing marketing expenditure on non-branded keywords:
− Growth from 14% to 23%
� This had a double impact on profitability
− First, we moved traffic from a cheaper category (for us, given our former quality score) to a more expensive one
− Second, we increased competitive pressure and costs on the expensive category
Quarter-on-quarter orders growth

0%
5%
10%
15%
20%
25%
30%
35%
11
Investor presentation – Quarter ended June 30, 2014
Competition by low margin players in some markets
Google click share index(1) - Italy
Google click share index(1) - Germany
� Number of smaller competitors have increased pressure in short term in what appear to be unsustainable manner
− Competitor X (in Germany and UK) and Competitor Y (in Italy)
− Other small players
Note: Unaudited(1) : Internal analysis based on Google data for certain travel keywords - indexed
eDreams.it
Competitor Y
0%
5%
10%
15%
20%
25%
Competitor X
Opodo.de
Q1 Starts Q1 Finishes

12
Investor presentation – Quarter ended June 30, 2014
Meta partner
Note: Unaudited
(5.1)%
(25.1)%
(30)%
(25)%
(20)%
(15)%
(10)%
(5)%
+0%
Quarter ended Mar-14 Quarter ended Jun-14
YoY
va
ria
tio
n i
n o
rde
rs
� One meta partner eliminated co-search boxes in certain geographies, and changed some display rules which particularly impacted eDreams ODIGEO market share
� Losses mostly concentrated in France and Italy
� Losses were in some of our most profitable routes
� Actions have been taken to address this and the previous issues, and will be explained later in the presentation
Meta partner – YOY orders growth

13
Investor presentation – Quarter ended June 30, 2014
Overview of results
1 EBITDA adjusted for non recurring items and IPO related expenses2 Net income adjusted for non recurring items, IPO related expenses, capitalised fees reversed following refinancing, Impairments and amortizations, cancelation of hedging contracts, LTI deferred tax, deferred tax assets related to tax losses carried forward and interests related to Subordinated convertible shareholder bonds3 IFRS net debt is calculated after deducting the financing fees capitalised
Adjusted net income2
Cash – End of period
Var %Q1
June.14
Q1
June.13
Revenue margin
Adjusted EBITDA1
(In € million)
Bookings
Net Debt
Net debt3 / Adjusted EBITDA
2.479 2.518 2%
102,9 107,6 5%
31,8 22,5 (29)%
9,1 3,1 (66)%
139,5 108,9 (22)%
(358,0) (348,6) (3)%
3,18x 3,19x 0%
Highlights of Q1 Results - CEO
Drivers of Margin Evolution - CFO
Key Strategic Initiatives - CEO
Outlook- CEO
Appendix

15
Investor presentation – Quarter ended June 30, 2014
Action Plan
� Short Term
− Issues coming from increase in variable costs, and in particular in Search
− Focus on Margin stabilization: in the short term trade-off some revenue growth in exchange for
margin stabilization
− Stay away from “bad quality” (low margin) revenue growth
� Focus on Long Term
− Execute on IPO Strategy
− In particular deliver on 10 key initiatives which will allow us to go back to “quality growth” :
growth with sustained margins
− These initiatives require deployment and roll out of new technology which will be completed by
FQ2 of next year, but this will come gradually
− Precedent in deployment of One Platform shows how Capex investment in superior technology
derives strategic advantage and financial results

Accelerate Top Line
Grow weight on cost
effective Acquisition Channels
Others ways to improve
margin
Investor presentation – Quarter ended June 30, 2014
Key issues and Strategic Initiatives
Competitive Pressure
Google Algorithm
Change Meta
Behaviour
Increase Fixed Costs
Merchant Call Centres
Platform UnificationInvestments in Search OptimizationInternational ExpansionNon-FlightsNon Transactional RevenueMobileWhite label + XMLCRMOff-LineCall Centers
� � �� ��� �� �� �� �� �� �� �
16

Bookings evolution on recent launches
17
Note: Netherlands site under eDreams brand launched in end 2013Source: Business intelligence
-
200
400
600
800
1,000
1,200
Sep-13 Oct-13 Nov-13 Dec-13 Jan-14 Feb-14 Mar-14 Apr-14 May-14 Jun-14
Russia Greece Netherlands (eDreams)
� Strong growth of Expansion at +13%
� Good growth in recently launched sites Netherlands (eDreams launch) & Greece with respectively 114% and 134% average month on month growth on bookings.
� New Launch: Russia
� New Launch Meta: USA
Investor presentation – Quarter ended June 30, 2014
Internationalization

Investor presentation – Quarter ended June 30, 2014
Non – Flights: Improvements in Dynamic Packaging
Main Actions implemented in eDreams brand Dynamic Packages
• Single platform and access to superior content
• Flight (Regular, and lowcost, package fares)
• Hotel (Pre and post pay; package rates)
• Aggressive and active pricing focus on revenuemanagement
• Stronger marketing support particularly in SEM
• Better customerexperience throughimproved front end
eDreams** Quarterly DP top line growth(bookings @ booking date YoY%)
16%33%
FQ1 FQ2 (QTD)*
eDreams** Quarterly DP revenue growth(Revenue margin @ booking date YoY%)
21%40%
FQ1 FQ2 (QTD)*
*QTD at August 16th, 2014** eDreams brand has been implementing improvements earlier than the rest of brands*** Group data excludes Travellink
18

19
1
2 3
4
1. User enters origin/ destination and dates
2. Co-Search opens in bottom part of search.
• Comparison of eDreams results with external partners is offered.
• 1 to 3 partners are pre checked, others can be actively selected by user.
3./4. After clicking on “search flights”:
• eDreams results page
• In parallel a popunder window opens with a waiting page (3)
• Then redirect the user to the results page of the external partner (4)
Investor presentation – Quarter ended June 30, 2014
Co-search: How it works

20
Mobile contribution
% of eDreams ODIGEO total flight orders from mobile1
1 Orders include delivered (“bookings”) and non-delivered transactions (e.g. non-processed transactions due to credit card issues, fraud etc); 2 Unaudited
Source: Company data, Phocuswright Goobal online Travel Overview third edition
3,394,564
downloaded apps
+68% compared to last year
Investor presentation – Quarter ended June 30, 2014
Mobile continues its strong growth
Mobile
14%
Desktop
86%
This compares to European online bookings average of 11% in 2013, and 15% expected for 2014
Mobile8%
Q1 2013/14
Q12014/15

21
Last Year Q1 2014 Q2’14 through Q2’15
Flights & Hotels*
iPhone Opodo
Flights & Hotels*
iPhone eDreams
Flights
iPhone Go Voyages
Flights, Hotels* & Cars*
Smartphone Opodo
Flights, Hotels* & Cars*
iPad html 5 Go Voyages
Hotels*iPhone Go Voyages
Flights & Hotels
Android1 Opodo
Flights & Hotels
Android1 eDreams
Flights, Hotels* & Cars*
iPad html 5 eDreams
Flights, Hotels* & Cars*
iPad html 5 Opodo
Flights, Hotels* & Cars*
Smartphone eDreams
Flights, Hotels* & Cars*
Smartphone Go Voyages eDreams, Opodo and Go Voyages
Feature Launch up to Q2’15 (all brands/all devices/flights only)
*: Indicates that the application is either a third party web view or white label1: Indicates that the application is web view (not native)
Investor presentation – Quarter ended June 30, 2014
Mobile roadmap
� Easier Booking
� New Generation Flight Search
� In-travel
� Marketing Improvements
� Payment Improvements
� Ancillaries and Inventory

CRM orders year-on-year evolution � Good performance of our CRM strategy
− Drop-off emails
− Cross selling
− General newsletters
� CRM orders now contributing to 3.8% of total orders (excluding white labels)
22
54,070 50,480
75,566 80,103
-
10,000
20,000
30,000
40,000
50,000
60,000
70,000
80,000
90,000
Quarter ended
March
Quarter ended
June
2013 2014
Investor presentation – Quarter ended June 30, 2014
CRM strong growth in orders

Highlights of Q1 Results - CEO
Drivers of Margin Evolution - CFO
Key Strategic Initiatives - CEO
Outlook- CEO
Appendix

24
Investor presentation – Quarter ended June 30, 2014
Short Term Outlook 1/2
� We are seeing similar levels of competitiveness in FQ2 vs. FQ1 and expect similarlevels to remain during the year
� In the Short Term, we have acted to:
� Keeping our Rev Margin/Gross Booking high as we believe this is the key toultimate success in the industry
� Reducing the weight of some of the most expensive customer acquisitionchannels with the goal to defend margins with some trade-off of lower revenuegrowth
� Stayed away from getting into “low quality” short term revenue growth options

25
Investor presentation – Quarter ended June 30, 2014
Short Term Outlook 2/2
� Revenue margin for FY 14/15 to be flat vs last fiscal year
� Profitability levels for FY 14/15 to remain in line with performance of
the quarter ended June
� We expect some variability around these levels on a quarterly basis,
mostly driven by seasonality
� In particular for the second quarter, we expect revenue margin growth to
be below and profitability to be above the levels mentioned
� We reiterate capex guidance provided in year-end: will invest €5 to 10
million in additional Capex in projects which will improve profitability of
Customer Services Operations, Marketing acquisition and Retention, and
Overhead productivity. Adding €25 million in platform development and
maintenance capex, this would imply a total capex of around €30-35 million.
� We believe our ability to deploy significant Capex in an effective manner to
improve our technology platform is a key advantage that will allow us to have a
positive long term outlook

26
Investor presentation – Quarter ended June 30, 2014
Long Term Fundamentals
� We believe we remain in a very large and attractive market
− Structural Growth expected to come from Travel market Growth post-Recession, plus
increased Online Penetration, and increased share of OTAs vs. Supplier Direct in our core
and expansion markets
− European Online Travel Market expected to grow at 8% in 2015
� eDreams ODIGEO long term competitive advantages remain unchanged
− Scale (Largest OTA worldwide in Flights Revenue, 15 million customers)
− Established Brands
− Technology advantage
� Key set of Technology driven initiatives to fuel growth and margins, which follow
our core strategy as defined at IPO, many of which are already delivering initial
results in tests, with full deployment of technology expected by FQ2 next year

27
Investor presentation – Quarter ended June 30, 2014
Strong Competitive Advantages
… while generating higher margins than competitors
Flight Revenue margin / Gross bookings
1.8x
2.5x
3.4x4.3x
Source: eDreams ODIGEO flight revenue margin /Gross bookings for the quarter ending June 2014, Unaudited. Peer companies’ figures based on a commissioned report to PhoCusWright, taking into account the higher quarterly Flight Revenue margin / Gross bookings over the Oct-12 to Sep-13 period
8.4%8.9%
4.8%3.5%
2.6% 2.1%
Q1 Jun-13 Q1 Jun-14
Continue creating value for customers by driving prices down …
Yields per passenger miles
Gross bookings per
booking Flight
Source: eDreams ODIGEO flight Gross bookings per booking for the quarter ending June 2014 compared to Airline yields per passenger kilometre for the quarter ending June 2014 (Bloomberg & quarterly reports)
(5)% (6)%(4)%
(3)%(0)%
Note: Ctrip and Bravofly Adjusted EBITDA margin relates to last fiscal yearSources: Company data, unaudited. Peer’s company quarterly June 2014 and last annual reports. Bravofly figures based on H1 preliminary figures reported on July 28, 2014. Ctrip figures based on last annual report.
Quarterly Adjusted EBITDA margin
Adjusted EBITDA / Revenue margin – Quarter ended June 2014
21%
26%
17% 18% 17%

28
Investor presentation – Quarter ended June 30, 2014
Long Term Outlook
� We believe the attractiveness of our Market, our strong Market Position and Scale,
our Strategy and ability to deploy Capex, and transform it into Technology
advantage, will allow us to win in this market in the long term
� While we will see some challenges in the short term, we believe once our key
initiatives are fully rolled out, we will be able to go back to revenue growth at or
above market average, and with margins above those of our competitors

Highlights of Q1 Results - CEO
Drivers of Margin Evolution - CFO
Key Strategic Initiatives - CEO
Outlook- CEO
Appendix

30
EBIT
Financial result
Adjusted net income
Net income
Var
Bookings
Q1
Jun.14
Q1
Jun.13
Revenue margin
Variable costs
Fixed costs
Adjusted EBITDA
Non recurring items
EBITDA
Depreciation & amort.
Incl. impairment
(In € million)
Income tax
Note: Unaudited
� Lower non recurring items driven by LTI related expenses recognized last year but not this year
� D&A decreased by €1.2m mainly due to full amortization of the IT technology of Opodo in March 2014, initially recognized for the Purchase Price Allocation (PPA)
� Financial loss increased by €2.1m due to:
− the partial redemption of the 2019 Notes with:
� €2.2m due to the cancellation of capitalized financing fees without cash effect
� €3.6m prepayment premium
− Partly mitigated by the absence (due to consolidation) of the Subordinated Convertible Shareholders’ bonds versus last year amounting to €3.3m
� Lower income tax mainly reflecting to business trends in countries where we operate and pay taxes such as Spain, differences in tax rate between deferred and current taxes related to LTI plan as well as the use of capital allowance and the reduction in the tax rate in UK
Investor presentation – Quarter ended June 30, 2014
Income statement - Highlights
2,479 2,518 2%
102.9 107.6 5%
(57.4) (70.1) 22%
(13.6) (15.0) 10%
31.8 22.5 (29)%
(2.9) (0.6) (79)%
29.0 21.9 (24)%
(6.5) (5.3) (18)%
22.5 16.6 (26)%
(14.9) (17.0) 14%
(3.7) (2.1) (43)%
3.8 (2.6) N.A.
9.1 3.1 (66)%

31
Investor presentation – Quarter ended June 30, 2014
Adjusted Net income
Net income
Non-recurring items1
Cancellation of amortized financing fees3
Interest expense penalty
(In € million)
Impact of Opodo’s PPA software
amortization4
Interests related to Subordinated
Convertible Shareholder Bonds3
Adjusted net income
Q2
Jun-14
Q1
Jun-13Var
1 Theoretical income tax rate of 35%2 Theoretical income tax rate of 28.8%3 Theoretical income tax rate of 34.43%4 Theoretical income tax rate of 23%Note: Unaudited
3.8 (2.6) N.A.
1.9 0.4 (79)%
- 1.7 N.A.
- 3.6 N.A.
1.3 - (100)%
2.2 - N.A.
9.1 3.1 (66)%
� Non-recurring items last year mostly related to LTI (details in Appendix)
� Financing fees relating to the reversal of capitalized financing fees following the partial redemption of 2019 Notes
� Premium paid in connection with the partial redemption of 2019 Notes
� Impact of Opodo’s PPA software amortization last year

32
Goodwill
Other fixed assets
Jun - 13
Total fixed assets
Total working capital
Deferred tax
Provisions
Other long term assets / (liabilities)
Financial debt
Cash and cash equivalent
Net financial debt
Subordinated Convertible Shareholder
Bonds
Net assets
(In € million)Jun - 14
Other short term assets / (liabilities)
Cash and cash equivalent – Net of overdrafts
Note: Unaudited
Versus last year, main changes relate to:
� The IPO effect on equity and the Financial Debt with the elimination in consolidation of Convertible Shareholders Bonds (-€106.5m) and the partial repayment of 2019 notes (-€46m) with the gross proceeds of the newly issued shares
� The acquisition of Liligo increasing the goodwill
Other changes deal with:
� A decrease in Fixed assets following the March impairment on GO Voyages brand partly offset by the new IT software internally developed.
� A decrease in the negative working capital
� A decrease in the provision following the end of the previous LTI plan (-€5.1m) and the decrease in provision in Opodo (-€5.2m) partly mitigated by the Travelport Provision
� A Decrease in the net deferred tax liabilities driven by redemption of Subordinated Convertible Shareholders’ Bonds as well as items related to March 14 impairment on PPA assets
Investor presentation – Quarter ended June 30, 2014
Balance sheet - Highlights
873.1 877.9
318.5 309.8
1,191.5 1,187.6
(288.2) (258.2)
(57.0) (40.8)
(16.7) (13.6)
12.5 6.0
0.1 0.1
(497.5) (457.5)
139.5 108.9
(358.0) (348.6)
(106.5) -
377.7 532.5
139.3 108.9

Quarterly working capital
33
GEO Travel Finance
Note: Unaudited
Investor presentation – Quarter ended June 30, 2014
Working capital - Highlights
Decrease in negative working capital vs June 2013 by €30.0m due to:
� The decrease in negative working capital (excluding non current deferred income) by €25.8m mainly related to:
− Late payment in June 2013 of German and Nordics BSP (-€11.0m)
− Some effects related to business trends and mainly to the change in mix between GDS and direct connect (-€17.9m)
− The impact of Liligo positive working capital (-€1.9m)
− The impact of payables related to committed capex (+€3.1m)
− Other effects (+€1.9m)
� The decrease in non current deferred income due to the recognition of €4.1m of revenue related to the Amadeus signing bonus over the period (no cash impact)
(249.8) (232.8)(192.6)
(250.6)(220.4)
(249.8)(223.9)
(38.4)(37.3)
(36.9)
(35.6)
(34.3)
(38.4)
(34.3)
(288.2)(270.1)
(229.5)
(286.2)
(254.7)
(288.2)
(258.2)
(350)
(300)
(250)
(200)
(150)
(100)
(50)
-
Jun.13 Sep.13 Dec.13 Mar.14 Jun.14 Jun.13 Jun.14
in €
mil
lio
n
Working capital Non current deferred income

Net increase/(decrease) in cash
34
Change in WC (excl. IPO impact)
Income tax paid
Net cash from operating activities
Cash flow from investing activities
Shares issuance
Cash flow from financing
Repayment of 2019 Notes
Premium on repayment
Adjusted EBITDA
Q1
Jun - 13
Non recurring items
(In € million)
Q1
Jun - 14
Non operating / non cash items
Change in WC related to IPO
Note: Unaudited
Financial expenses (net)
Other debt issuance/ (repayment)
� Non operating / non cash items decreased by €1.7m mainly reflecting the absence of LTI expenses in Q1 2014
� Change in working capital excluding IPO impact of €(24.0)m and mainly reflecting the impact of seasonality in BSP payable as March is usually the highest trading month for regular flights (€24.2m)
� Change in WC related to IPO of €15.5m and mainly related to the payment IPO expenses
� Income tax paid increased by €1.5m due to an advance payment towards US Tax authority
� Increase in capex reflecting the push in engineering
� Partial redemption of 2019 Notes by €46.0m plus an early repayment fee of €3.6m with the €50m proceeds of share issuance
� Financial expenses in line with last year and reflecting the payment in April of 2019 Notes interest.
Investor presentation – Quarter ended June 30, 2014
Cash flow statement - Highlights
31.8 22.5
(2.9) (0.6)
1.8 0.1
(32.2) (24.0)
- (15.5)
(2.0) (3.5)
(3.5) (21.0)
(5.2) (6.1)
- 50.0
- (46.0)
- (3.6)
(0.0) (0.2)
(10.2) (9.8)
(10.3) (9.6)
(18.9) (36.7)

35
Net debt excl. capitalization of financing costs
Quarterly ratios of net debt excl. capitalization of financing costs
GEO Travel Finance
Note: Unaudited
Investor presentation – Quarter ended June 30, 2014
Net debt information
� Undrawn revolving credit facilities end of June 2014
� June 2014 net debt excl. capitalization of financing costs lower by €14.2 million vs last year (€375.7 million) mainly due to:
− The repayment of €46 million of 2019 Notes following the IPO
− Which has been partly mitigated by the impact on cash of the acquisition of Liligo in October 2014
(375.9) (386.2)(432.2)
(369.9) (362.1) (369.2) (361.6)
(500)
(400)
(300)
(200)
(100)
-
Jun.13 Sept.13 Dec.13 Mar.14 Jun.14 Mar.14 Jun.14
In €
mil
lio
n
(3.4) (3.4)(3.7)
(3.1) (3.3) (3.1) (3.3)
(1.7) (1.7)(2.0)
(1.5)(2.0)
(1.5)(2.0)
(4)
(3)
(2)
(1)
-
Jun.13 Sept.13 Dec.13 Mar.14 Jun.14 Mar.14 Jun.14
x LT
M R
ecu
rrin
g
EB
ITD
A
Net debt (excl. capitalized financing costs) / LTM Adj. EBITDA
Net senior secured debt (excl. capitalized financing costs) / LTM Adj. EBITDA

36
Total Net Debt(*)
LTM Adjusted EBITDA3.19x
TOTAL DEBT COVER RATIO (TOTAL NET DEBT / LTM Adj. EBITDA)
*IFRS net debt is calculated after deducting the financing fees capitalizedNote : Covenants figures presented above are unaudited and at GEO Travel Finance level
Investor presentation – Quarter ended June 30, 2014
Covenants
3.19x
2.31x
5.50x
-
1
2
3
4
5
6
Jun.14 Headroom Ratio cap
x LT
M A
dj.
EB
ITD
A

37Source: Management accounts, unaudited
GEO Travel Finance
Investor presentation – Quarter ended June 30, 2014
Per booking evolution
Jun-12 Sep-12 Dec-12 Mar-13 2012/13 Jun-13 Sep-13 Dec-13 Mar-14 2013/14 Jun-14 Jun-13 Jun-14 2012/13 2013/14
Number of bookings (in '000)
Total 2,176 2,198 1,926 2,429 8,728 2,479 2,580 2,202 2,536 9,797 2,518 2,479 2,518 8,728 9,797
By product:
Flight 1,967 1,981 1,753 2,249 7,949 2,237 2,278 1,997 2,347 8,859 2,261 2,237 2,261 7,949 8,859
Non Flight 209 217 173 180 779 243 301 205 189 938 257 243 257 779 938
By region:
Core 1,415 1,409 1,201 1,517 5,542 1,526 1,583 1,293 1,475 5,877 1,508 1,526 1,508 5,542 5,877
Expansion 761 789 725 912 3,186 954 997 909 1,061 3,920 1,010 954 1,010 3,186 3,920
P&L per booking
Revenue margin 42.7 42.0 43.0 43.2 42.7 41.5 42.5 45.1 46.0 43.7 42.8 41.5 42.8 42.7 43.7
Flight 38.5 36.2 38.7 40.1 38.4 38.0 38.6 39.2 41.1 39.3 37.9 38.0 37.9 38.4 39.3
Non Flight 82.8 94.9 87.2 82.1 87.0 73.6 71.9 102.8 106.5 86.1 85.2 73.6 85.2 87.0 86.1
Core 43.6 42.9 45.0 45.1 44.2 43.3 42.6 47.2 49.2 45.4 43.8 43.3 43.8 44.2 45.4
Expansion 41.2 40.3 39.7 39.9 40.3 38.6 42.3 42.2 41.6 41.2 41.2 38.6 41.2 40.3 41.2
Variable costs (23.5) (23.5) (23.6) (25.5) (24.1) (23.2) (25.7) (25.0) (29.1) (25.8) (27.9) (23.2) (27.9) (24.1) (25.8)
Fixed costs (6.0) (6.0) (6.9) (6.1) (6.2) (5.5) (5.0) (8.0) (5.5) (5.9) (5.9) (5.5) (6.0) (6.2) (6.0)
Total costs (29.5) (29.5) (30.5) (31.6) (30.3) (28.7) (30.8) (33.0) (34.6) (31.7) (33.7) (28.7) (33.8) (30.3) (31.7)
Adjusted EBITDA 13.3 12.5 12.5 11.6 12.4 12.8 11.8 12.1 11.4 12.0 9.0 12.8 8.9 12.4 12.0
Margin 31% 30% 29% 27% 29% 31% 28% 27% 25% 27% 21% 31% 21% 29% 27%

38
Note: Core relates to Bookings from France, Spain, Italy. Expansion relates to Bookings from UK, Germany, Nordics and Other countriesSource: Management accounts, unaudited
Bookings growth
Bookings breakdown by segment
2,479 2,518
-
500
1,000
1,500
2,000
2,500
3,000
Bookings
Q1 Jun.13
Bookings
Q1 Jun.14
In t
ho
usa
nd
s
1,526 954
1,508 1,010
-
500
1,000
1,500
2,000
Core Expansion
In t
ho
usa
nd
s
Bookings Quarter ended June 2013 Bookings Quarter ended June 2014
(1)%
� eDreams ODIGEO has achieved 2% growth in volumes in the quarter ended June 30, 2014 vs last year.
� On a segment basis:
− Slight decrease on Core market due to competitive environment
− Expansion growing at 6%
Investor presentation – Quarter ended June 30, 2014
Volume growth

39
Investor presentation – Quarter ended June 30, 2014
Adjusted EBITDA - Bridge
Adjusted EBITDA bridge – Quarter ended June 2014 vs quarter ended March 2014
Note: Unaudited
� The comparison between the Q1 of this fiscal year and the previous quarter, Q4 of last fiscal year, presents results broadly in line with the comparison vs the Q1 of last year
� Basis of preparation (Applicable to all adjusted EBITDA bridges included in this presentation):
− “Competitive pressure & Google algorithm” is the aggregation of:1. The variance, from a quarter to the other between (i) in the revenue margin generated through the Google acquisition channel, netted
from acquisition costs associated to this channel and (ii) the revenue margin and costs we would have incurred by applying, from January 2014 to June 2014, the same seasonality in the Google revenue margin and acquisition costs, than the one experienced over the same period in 2013;
2. The variance, from a quarter to the other, in the revenue margin generated through the metasearch acquisition channel, netted from any acquisition costs associated to this channel and excluding the impact shown specifically in the “Meta partner” effect.
Country scope for “Competitive pressure & Google algorithm” includes (i) France, UK, Germany, Spain and Italy for Google excluding airlines branded keywords and metasearch and (ii) all our markets for the Google airline branded keywords
− “Meta partner” calculated as the variance, from a quarter to the other in the revenue margin generated through this specific meta partner, netted from acquisition costs towards this meta partner.
− “Fixed costs” calculated as the variance in fixed costs reported from a quarter to the other.
− “Other” corresponds to the variance in adjusted EBITDA from a quarter to the other not captured in any of the previous effects shown in the bridge (i.e. “Competitive pressure & Google algorithm”, “Meta partner” and “Fixed costs”).
28.7 22.5
(4.0)(0.6) (0.6) (1.0)
0
5
10
15
20
25
30
35
Adjusted EBITDA
Quarter ended Mar-14
Competitive pressure
& Google algorithm
Meta partner Fixed costs Other Adjusted EBITDA
Quarter ended Jun-14
In €
mil
lio
n

40
EBIT
Financial result
Net income
Var
Bookings
Q1
Jun - 14
Q1
Jun - 13
Revenue margin
Variable costs
Fixed costs
Adjusted EBITDA
Non recurring items
EBITDA
Depreciation & amort.
Incl. impairment
(In € million)
Income tax
Goodwill
Other fixed assets
Jun - 13
Total fixed assets
Total working capital
Deferred tax
Provisions
Other long term assets / (liabilities)
Financial debt
Cash and cash equivalent
Net financial debt
Subordinated Convertible Shareholder
Bonds
Net assets
(In € million)Jun- 14
Other short term assets / (liabilities)
Cash and cash equivalent – Net of overdrafts
INCOME STATEMENT BALANCE SHEET
Gross bookings
Note: Unaudited
1,143.4 1,092.8
Investor presentation – Quarter ended June 30, 2014
Geo Travel Finance (1/2)
2,479 2,518 2%
102.9 107.6 5%
(57.4) (70.1) 22%
(13.6) (14.8) 8%
31.8 22.7 (29)%
(2.9) (0.4) (85)%
29.0 22.3 (23)%
(6.5) (5.3) (18)%
22.5 17.0 (24)%
(14.9) (20.6) 38%
(3.7) (2.2) (40)%
3.8 (5.8) N.A.
873.1 877.9
318.4 315.9
1,191.4 1,193.7
(288.2) (254.7)
(57.0) (51.1)
(16.7) (13.6)
12.5 6.0
0.1 0.2
(497.5) (457.5)
139.4 108.4
(358.1) (349.1)
(106.5) (121.0)
377.5 410.4
139.2 108.4

41
Non operating / non cash items
Change in working capital
Income tax paid
Net cash from operating activities
Adjusted EBITDA
Q1
Jun - 13
Non recurring items
(In € million)
Q1
Jun - 14
Total Net Debt(*)
LTM Adjusted EBITDA3.19x
TOTAL DEBT COVER RATIO (TOTAL NET DEBT / LTM Adj. EBITDA)
CASH FLOW STATEMENT COVENANT CALCULATION
Cash flow from investing activities
Cash flow from financing
Note: Unaudited
Investor presentation – Quarter ended June 30, 2014
Geo Travel Finance (2/2)
3.19x
2.31x
5.50x
-
1
2
3
4
5
6
Jun.14 Headroom Ratio cap
x LT
M A
dj.
EB
ITD
A
Shares issuance
Repayment of 2019 Notes
Penalty fee on repayment
Financial expenses (net)
Other debt issuance/ (repayment )
Drawing/(repayment) bw. Group entities
31.8 22.7
(2.9) (0.4)
1.8 0.1
(32.1) (33.6)
(2.0) (3.5)
(3.4) (14.7)
(5.2) (6.1)
- 50.0
- (46.0)
- (3.6)
(0.0) (0.2)
- (6.1)
(10.2) (9.8)
(10.3) (15.7)

42
Investor presentation – Quarter ended June 30, 2014
Consolidated financial statements – Profit & Loss
� The Profit and Loss
accounts presented here
show quarterly
information for the for
the April 1st to June 30th
2013 and 2014
� Financial result is
prepared under IFRS and
includes mainly interest
paid or accrued as well
as the amortization of
the financial expenses.
Difference between Geo
Travel Finance and
eDreams ODIGEO mainly
relate to the interest
expenses on
Subordinated Convertible
Shareholders’ bond
Note: Unaudited
Consolidated Income statementeDreams
ODIGEO
eDreams
ODIGEO
Geo Travel
Finance
Geo Travel
Finance
In € thousand
Q1
June 2014
Q1
June 2013
Q1
June 2014
Q1
June 2013
Revenue 118,269 125,683 118,269 125,683
Supplies (10,625) (22,763) (10,625) (22,763)-
Revenue margin 107,644 102,920 107,644 102,920 -
Personnel expenses (16,387) (15,109) (16,387) (15,109)
Operating expenses other than depreciation and amortization (68,734) (55,977) (68,516) (55,971)-
Operating profit before depreciation and amortization 22,524 31,834 22,742 31,840 -
Depreciation and amortization (5,319) (6,507) (5,321) (6,507)
Impairment (4) - (4) -
Other income & Other expense (non recurring items) (602) (2,865) (422) (2,865)
Gain or loss arising from investments 1 - 1 - -
Operating profit 16,599 22,462 16,996 22,468 -
Financial result (17,034) (14,911) (20,554) (14,912)Income (loss) of associates accounted for using equity method - - - -
Discontinued operations - - - -- -
(Loss) profit before tax (435) 7,551 (3,558) 7,556 -
Income tax benefit (expense) (2,122) (3,716) (2,225) (3,716)0
(Loss) profit after tax (2,557) 3,835 (5,783) 3,840
Non controlling interest - Result - - - - Profit for the year attributable to equity holders of the
parent (2,557) 3,835 (5,783) 3,840 -
EBITDA attributable to equity holders of the parent 21,922 28,969 22,319 28,975
Adjusted EBITDA 22,524 31,834 22,742 31,840
Non recurring items (602) (2,865) (422) (2,865)

43
Investor presentation – Quarter ended June 30, 2014
Consolidated financial statements – Balance Sheet
Note: Unaudited
Consolidated balance sheeteDreams
ODIGEO
eDreams
ODIGEO
Geo Travel
Finance
Geo Travel
Finance
In € thousand
30 June
2014
30 June
2013
30 June
2014
30 June
2013
LIABILITIES & EQUITY
Capital 10,488 234,007 261,638 236,638
Additional paid-in capital 207,413 237,939 260,207 235,207
Retained earnings 317,520 (102,768) (105,306) (102,909)
Net income / (loss) (2,557) 3,835 (5,783) 3,840
Adjustments for changes in value (392) 4,722 (392) 4,722 q
Total equity 532,472 377,735 410,363 377,498
Non-current financial liabilities 441,007 588,797 562,041 588,797
Non current provisions 4,819 15,010 4,819 15,010
Deferred revenue 34,302 38,449 34,302 38,449
Deferred tax liabilities 48,454 66,030 58,743 66,030
Other non-current liabilities - - - 0
Total non-current liabilities 528,582 708,286 659,905 708,286
Trade and other payables 312,087 346,108 312,867 346,071
Current provisions 8,782 1,713 8,782 1,713
Current taxes payables 6,560 11,014 5,573 11,012
Current financial liabilities 16,477 15,177 16,477 15,177
Total current liabilities 343,906 374,012 343,698 373,972
TOTAL LIABILITIES & EQUITY 1,404,960 1,460,033 1,413,967 1,459,756
Consolidated balance sheeteDreams
ODIGEO
eDreams
ODIGEO
Geo Travel
Finance
Geo Travel
Finance
In € thousand
30 June
2014
30 June
201330 June
2014
30 June
2013
ASSETS
Goodwill 877,852 873,062 877,852 873,062
Other intangible assets 301,421 308,665 301,421 308,665
Tangible assets 5,477 4,907 5,477 4,907
Non-current financial assets 5,457 8,830 8,971 4,786
Deferred tax assets 7,633 9,062 7,633 9,062
Other non-current assets 3,436 8,547 6,022 12,491
Total non-current assets 1,201,276 1,213,073 1,207,377 1,212,972
Trade and other receivables 84,728 101,612 88,036 101,570
Current tax assets 9,979 5,748 9,968 5,745
Financial assets 69 72 160 72
Cash and cash equivalent 108,908 139,528 108,427 139,397
Total current assets 203,684 246,960 206,591 246,784
TOTAL ASSETS 1,404,960 1,460,033 1,413,967 1,459,756

44
Investor presentation – Quarter ended June 30, 2014
Consolidated financial statements – Cash Flow
Note: Unaudited
Consolidated statement of cash flowseDreams
ODIGEO
eDreams
ODIGEO
Geo Travel
Finance
Geo Travel
Finance
In € thousand
QTD
June 2014
QTD
June 2013
QTD
June 2014
QTD
June 2013
Net Profit / (Loss) (2,557) 3,835 (5,783) 3,840
Depreciation and amortization 5,319 6,507 5,321 6,507
Impairment 3 - 4 -
Other provisions 98 332 98 332
Income tax 2,122 3,716 2,225 3,716
Gain or loss on disposal of assets - 1 (1) -
Finance (Income) / Loss 17,034 14,911 20,554 14,912
Expenses related to share based payments (4,887) 1,431 (5,475) 1,432
Other non cash items - (1) - -
Change in working capital (34,627) (32,156) (28,140) (32,108)
Income tax paid (3,526) (2,026) (3,526) (2,026)
Net cash from operating activities (21,021) (3,450) (14,724) (3,395)
Acquisitions of intangible and tangible assets (5,996) (5,167) (5,996) (5,167)
Proceeds on Disposal of tangible and intangible assets 1 - 1 -
Acquisitions of financial assets (89) - (89) -
Payments/ Proceeds from disposals of financial assets - 18 - 18
Acquisitions of subsidiaries net of cash acquired - (15) - (15)
Net cash flow from / (used) in investing activities (6,084) (5,164) (6,084) (5,164)-
Proceeds of issues of shares 50,000 - 50,000 -
Borrowings drawdown - - - -
Reimbursement of borrowings (46,164) (37) (46,164) (37)
Drawing/Repayment of loans between eDreams ODIGEO group entities - - (6,100) -
Interests paid and other expenses (9,848) (10,272) (9,848) (10,270)
Interests received 37 48 37 48
Early repayment fees (3,579) - (3,579) -
Dividends paid - - - - 0 - - -
Net cash flow from / (used) in financing activities (9,554) (10,261) (15,654) (10,259)
Net increase / (decrease) in cash and cash equivalent (36,659) (18,875) (36,462) (18,818)
Cash and cash equivalents at beginning of period 145,994 159,156 145,316 158,967
Effect of foreign exchange rate changes (476) (995) (476) (995)
Cash and cash equivalents at end of period 108,859 139,286 108,378 139,154

45
Investor presentation – Quarter ended June 30, 2014
Net debt analysis
2019 Notes
Revolving Credit Facilities
Other debts (finance lease, overdrafts, etc.)
Net debt excluding capitalization of financing costs
Cash and cash equivalents
Accrued interest
Jun-13 Dec-13 Mar-14 Jun-14
2018 Notes
Net debt – as per balance sheet
Financing costs and amortizations
Capitalization of financing costs
Note: Unaudited
(175.0) (175.0) (129.0)
(325.0) (325.0) (325.0)
- - -
(13.2) (11.6) (12.4)
(6.9) (3.7) (4.1)
89.6 146.1 108.9
(430.4) (369.2) (361.6)
16.5 15.9 13.0
3.0 2.9 2.7
(410.9) (350.4) (345.8)
(175.0)
(325.0)
-
(13.2)
(2.1)
139.5
(375.7)
17.8
3.3
(354.7)

46
Investor presentation – Quarter ended June 30, 2014
Non recurring items
Q1
Jun-14
Q1
Jun-13
Other non recurring items
Non recurring items
LTI plan 2.0 -
0.9 0.6
2.9 0.6
Note: Unaudited

47
Investor presentation – Quarter ended June 30, 2014
Attractive Market
� Worldwide Travel Market recovering from recession and expected to accelerate from 3.2% in
2013 to 5.8% in 2015, where it will reach 1,328 USD Billion in size
� Worldwide Online Travel Penetration expected to continue growing from 33,7% in 2013 to
37% in 2015
� Europe, our core market is the largest Travel Market in the world with 330 USD Billion and also
the largest Online Travel market in the world with 141 USD Billion (ahead of US with 129 USD
billion)
� Online Travel Market expected to grow at 8% in Europe in 2015 and 6% in the US, with rest of
markets growing double digit
� Within Online Travel, OTAs expected to grow share from Supplier direct in Europe (from 39%
in 2013 to 41% in 2015)
� eDreams ODIGEO lacks sizeable presence in the worlds number 1 (US), 5 (Japan), 6 (China) and 9
(Russia) online travel markets. Significant opportunity
� Air remains by far the largest Travel Category with 45% of Worldwide Total Travel Bookings
(with hotels being the second category at 36% )
Source: PhocusWright Global Online Travel Overview, Third Edition (July 2014)

48
Investor presentation – Quarter ended June 30, 2014
Leadership in flight
1 eDreams ODIGEO shows revenue margin ( = IFRS Revenue less cost of supplies), for flight product and services, while competitors show net sales related to flight products, excluding any supplier costs; 2 Estimated based on preliminary H1 figures as of June 2014 and assuming flight percentage of revenue is the same than in December 2013 (i.e. 82%); 3 Air/non air split not disclosed. Flight revenue assumed to be 1.7% of total revenue (Source: Forbes article published 10.01.2013), applied to gross profit; Note: Financials represent last fiscal year reported or LTM as of June 2014 for competitors (except Orbitz and Priceline where LTM as of March 2014) when quarterly informationavailable. FX used EUR/USD: 1.3421Source: Company data unaudited, peer companies’ public reports
Leading online retailer of flights worldwide
349
321
306
187
110
94(est.)
Flight revenue (June 2014 LTM), €m1
1.1x
1.9x
3.7x
3
4
2
3.2x
1.1x