Drivers & Dimensions of Market Globalization by Martinson T. Yeboah
Upload
truongkienCategory
view
219download
0
Page 1
Veraison to HarVestStatewide Vineyard Crop Development Update #8
October 19, 2012Edited by Tim Martinson and Chris Gerling
Final Issue...The 2012 SeaSon: a Review
Chris GerlingEnology Extension Associate
The right move here, the politic one, the appropriate action at this point is to skip to the headline (spoiler alert): from a wine standpoint, 2012 looks really, re-ally good.
Red wines, white wines, Long Island wines, Lake Champlain wines - every-one has reason to be optimistic. The numbers and the flavors all seem to be in place, and most wines in the majority
of cellars are already through alcoholic fermentation. See-ing the trouble many of our fruit-growing colleagues have encountered this season, the wine industry has much to be thankful for.
If there is a major problem to report, it is that there may not be enough (that’s not a joke; yields were down). I’m here to write about the experience of the season, however, and I’m trying to represent the feelings of the people who made it happen, and to just leave it at that would be to leave out a lot of the story. If you look behind the smiling winemakers, you may notice what appears to be smoke coming out of the equipment, for example. 2012 was the answer to the ques-tion: what if we just crushed all the grapes in one go?
The fast and occasionally scary pace was set early on. Freak heat in March started the process, and while the April frosts meant the derailment of many of the fruit crops, wine grapes were mostly unscathed. The summer brought heat and more heat and things only accelerated. Once again potential trou-ble loomed as the dry heat threatened to turn into drought but most vineyards eventually saw enough raindrops here and there, and so the torrid pace continued.
By Labor Day, growers were happily reporting that many varieties had already reached maturity levels not seen in November of some years. Then it was time to pick.
“In my 34 harvests in the Finger Lakes, I’ve never seen one that is so far ahead of typical.” These are Steve DiFrances-co’s first thoughts from Glenora Wine Cellars. Maybe you were ready. For Jeff Houck at Lucas Vineyards, 2012 “has been the smoothest harvest ever.”
Thursday, October 18: The Vinification and Brewing Laboratory at Ge-neva was a hub of activity as Luann Preston-Wilsey, Pam Raes, Ethan Miles, and Dianne Schmitt worked on four different winemaking tasks. 306 separate winelots were produced there during this season’s crush.
Photo by Tim Martinson
Viticulture 2013February 6-8, 2013
Rochester Riverside Convention CenterRochester, NY
Please join us for the Viticulture 2013 Conference and Trade Show, featuring three full days of speakers and sessions addressing the most important topics in viticul-ture, enology, marketing, and public policy, and includ-ing the 2nd Northern Grapes Symposium, focused on cold-hardy grapes that have expanded the small winery industry to colder climates in the upper Midwest, North-ern New York, and New England.
Co-organized by the New York Wine and Grape Founda-tion, an industry and grower committee, and Cornell Cooperative Extension.
For more information: www.vit2013.com
Phone: 585-394-3620
Page 2
Jeff Houck chooses a little more Farmer’s Almanac-type reaction: “One thing we know for certain in the Finger Lakes- next year will in some way be different.”
Both of them may be right. All that matters right now is that the grapes are mostly off the vine and the wines are progressing. And with all of this activity happen-ing so far ahead of schedule, we’re sure to be ready next year…
In Geneva, the best way to say it is: we weren’t ready. Tim Martinson’s e-mail to me with summary charts and bullet points (see Fruit Composition Trends in 2012, p. 7-9) had as point #4: “It’s very apparent that we missed most of the early part of the ripening curve. We should have started sampling two weeks earlier.”
In the Vinification & Brewing Lab we got messages from cooperators complaining about “the late open-ing,” and these messages were sent on or about Au-gust 15th. At the ice cream stand (pre-Labor Day, you see) I ran into people from other wineries who knew they should be crushing, but they were still bottling. So maybe we weren’t the only ones.
Last year’s season was compressed for all of the wrong reasons. Picking happened when the rain would let up ever so slightly, so all the grapes came in at once.
This year was compressed for most of the right rea-sons, first and foremost being that the grapes were ready. There was hope the late reds might get to hang (and the cellar crew might catch a break), but As Brad Martz at Whitecliff said, ”the break did not come. More rain and the constant battle with birds and other ani-mals aside, the early season frost last week (we had several nights where the temp dropped to 25 degrees F) had everyone in the Hudson Valley rapidly picking everything that was left on the vine.”
While the rain wasn’t nearly as bad as 2011, it still be-came a much more constant companion in late Septem-ber and early October. Associated botrytis outbreaks curtailed thoughts of extended hang-time for the re-maining grapes.
The numbers, needless to say, are pretty encouraging, and the flavors equally so. Jeff Houck says “we have seen tons of tropical fruit flavors in most of our white wines. Red Varieties are also showing great promise with unusual concentration.”
Rich Olsen-Harbich of Bedell cellars on Long Island has lots of good news to report: “All varieties came in completely ripe – with whites ranging from 21-24 brix and reds very extracted at 23-26 brix. Ripest and most mature (and most exciting) is the Cabernet franc which is the ripest I have ever seen. There’s no question this is a great vintage for us – especially for our reds.”
Brad Martz adds, “After alcoholic fermentation and the first rackings, things are looking, smelling, and tasting very good. We expect 2012 quality to be high.”
One question on a lot of people’s minds is whether this year was a freak occurrence or part of a trend.
Rich Olsen-Harbich sees the third consecutive early harvest on Long Island and thinks the warmth could be “a new normal – this is what other areas in Europe have been seeing as well for the past decade so its nothing new.”
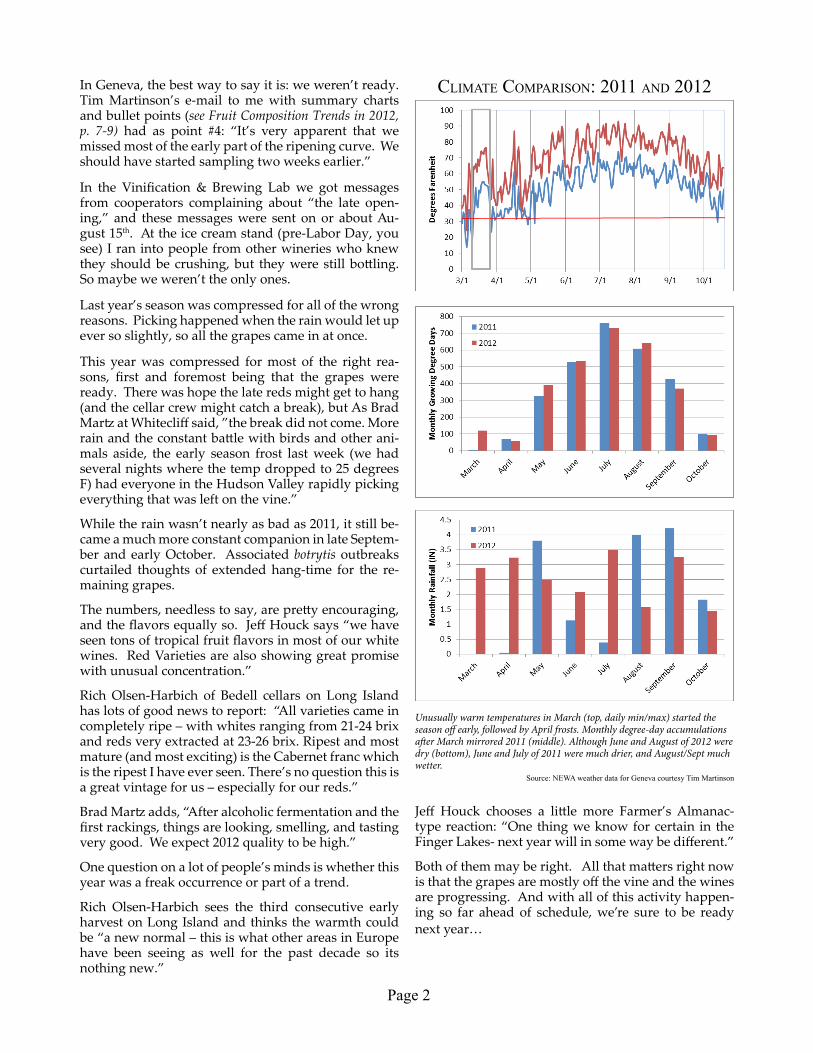
Unusually warm temperatures in March (top, daily min/max) started the season off early, followed by April frosts. Monthly degree-day accumulations after March mirrored 2011 (middle). Although June and August of 2012 were dry (bottom), June and July of 2011 were much drier, and August/Sept much wetter.
Source: NEWA weather data for Geneva courtesy Tim Martinson
ClimaTe CompaRiSon: 2011 and 2012

Page 3
lake eRie ConCoRd UpdaTe/SUmmaRy
Terry BatesDept of HorticultureCornell Lake Erie
Research and Extension Laboratory
Concord yield varied considerably across the Lake Erie Grape Belt in 2012 because of the spring freeze events. Vineyard location from east to west as well as proxim-ity to Lake Erie and elevation on the escarpment all seemed to play a role in the severity of the freeze dam-age. In early July, Tim Weigle organized LERGP and CLEREL staff in estimating crop size at nine research plot sites across the growing region. Actual yield was measured at harvest as part of the nine-site viticulture project. In general, where there was less cold damage and a larger crop, our crop prediction methods over-estimated the actual crop. Possibly there was more damage in those vineyards than our sampling meth-ods could detect. In contrast, where there was severe cold damage, we underestimated the crop – indicating possible yield compensation from fruitful secondary shoots and higher berry weight. Overall, our crop pre-diction across the locations underestimated the crop by 6.5%.
There was little difference in the rate of juice soluble solids accumulation across the belt because of the ear-ly, warm, and sunny post-veraison period. The “east-bench” site with low yield and gravel soil accumulated sugar at the highest rate while the “west-escarpment” site with a high crop had the lowest rate. All other sites fell between those two and could not be separated.
For more information about spring freeze impacts in the Lake Erie region see: Update: Economic Impact of Lake Erie Concord and Niagara Freeze Events
ConCoRd and niagaRa CRop aT naTional gRape CoopeRaTive
Tim MartinsonDept of Horticulture
NYS Agricultural Experiment StationBy almost any measure, 2012 was an exceptionally ear-ly harvest season for Concord and Niagara growers – both because of the spring frosts that reduced the crop and also because of warm weather that advanced crop development and ripening. I spoke with Rich Erdle, Grower Relations Manager at National Grape Coop-erative in Westfield, NY last week, and he provided me with some figures for tonnage delivered in the tri-state area (OH, PA, and NY, including Niagara Co.).
Concord: The Concord harvest started September 4, and growers delivered 61,350 tons, around 58% of the five-year average delivery of 106,000 tons. Concord harvest started September 4, and finished on October 6 – the earliest finish since 1957, and 11 days early ac-cording to Erdle. Average juice soluble solids hovered around 17 and above.
Niagara: Growers delivered around 9,500 tons, com-pared to a five-year average of around 17,000 tons. Similar to the Concord results, this represents 56% of the five-year average tonnage delivered.
Yields were highest, on average, in the Northeast area on the New York and Pennsylvania border, and lower moving eastward through the grape belt. National Grape Coop is only one of several processors that re-ceive Concord and Niagara grapes; however its vol-ume and geographical coverage provide a snapshot of the overall crop in Western New York.
Predicted yield, actual yield, and juice soluble solids of nine Concord sites across the Lake Erie region in 2012.
Figures by Terry Bates

Page 4
Mark Nisbet, graduate student has run over 3000 YAN analyses as part of his Ph D thesis work in Anna Katharine Mansfield’s laboratory.
Photo by Mark Nisbet
Figure 1: Yeast Assimilable Nitrogen (YAN) at harvest over 2010-2012 for vineyard sites we monitored as part of Veraison to Harvest. Cultivars selected are those for which data was collected from at least three vineyard sites.
Figure 1: Average YAN concentrations by grape cultivar, with error bars indicating the 95% confidence limit for the cultivar over three years of testing. Notably Cabernet Franc, Riesling, and Traminette all seem to consistently have lower YAN at harvest than other varieties surveyed.
pRojeCT FoCUS: yeaST aSSimilable niTRogen in new yoRk
FRom veRaiSon To haRveST
Mark Nisbet, Anna Katharine Mansfield, Tim Martinson, and Lailiang Cheng
Dept. Food Science and Dept HorticultureCornell University
This is the third year we have tracked Yeast Assimilable Ni-trogen (YAN) in both our Veraison to Harvest samples and a larger sample of Riesling vineyards in the Finger Lakes, as part of a Cornell Federal Formula Funds ‘Integrated Re-search and Extension Project’ grant. Here is a preliminary snapshot of what our surveys are revealing. - TEM
Significant Varietal Differences. After three years and more than 3000 individual Yeast Assimilable Nitrogen (YAN) analyses for Veraison to Harvest and related re-search, we are seeing significant differences between varieties grown in New York State. Despite some an-nual variation, mean YAN concentrations in Riesling, Cabernet Franc, and Traminette were always less than 100 mg/L, significantly less than concentrations found in Noiret, Vignoles, Chardonnay, and Pinot Noir (Fig-ure 1).
A statistical model was developed to compare the ef-fects of cultivar and harvest year on YAN concentra-tion. This analysis revealed that we do see real dif-ferences between some varieties, but the differences between years are not significant. For example in 2011 the average YAN concentration at harvest for Merlot was higher than in either 2010 or 2012, but it turns out this difference actually falls within the expected range aka confidence interval (Figure 2).
We can use confidence intervals to get an idea of the variation within a cultivar and predict the likely range where samples will fall. Pinot Noir had the largest variance, and the widest confidence interval from this information we could make a statement like “we are 95% confident that YAN levels of Pinot Noir in New York will fall between 150 and 290 mg/L.” Despite sig-nificant variation between cultivars, mean YAN con-centrations showed little change when charted from veraison to harvest over the 2012 season (Figure 3). As in previous years, this suggests that YAN measured several weeks prior to harvest can be used to calculate fairly accurate additions at crush.
Low YAN in Finger Lakes Riesling. 2012 also marks the third year of a sizeable survey of YAN in Riesling

Page 5
Figure 3. Weekly YAN values by cultivar during the 2012 growing season. Boxes represent approximately 50% of the observations; lines called ‘whis-kers’ represent the upper and lower 25% of the distribution. A single horizontal line indicates only one sample on the sample date (other sites had been harvested).
across the Finger Lakes. Data from all three years and over 50 vineyard blocks paints pretty clear picture of inherent YAN deficiency (Figure 4). Only 13% of the sites samples had YAN concentrations above the rec-ommended minimum level of 140 mg/L, suggesting that nutritional supplementation is necessary in most Riesling vineyards in our region.
Table 1 breaks out the percentages by year, 2012 had the lowest percentage of samples above 140 mg/L YAN. Notably, the patterns were consistent over three very different vintages. Our model predicts that 60% of Riesling samples will have a YAN concentration lower than 100 mg N/L. This underscores the impor-tance of a sound strategy for nutrient supplementation in the winery.
It suggests that everyone should have their fruit ana-lyzed for YAN content and plan nutrient additions based on results of analysis. This can safely be done a few weeks before harvest, so that analytical results are back from the lab before grapes are harvested and crushed.
Table 1. Percentage of Riesling YAN results in categories shown in Figure 4 by year.
YAN in PPMYear Below
100100-140
Above 140
No. Sites Sampled
2010 55% 24% 20% 492011 58% 29% 13% 382012 69% 24% 6% 49
Figure 4: Yeast Assimilable Nitrogen (YAN) at harvest for all of the 50 vineyard sites surveyed. we surveyed. Data from 3 years of surveys (2010-2012) is combined in this figure.

Page 6
FRUiT maTURaTion RepoRT - 10/19/2012In this final report, we have four samples, all from vineyards on Long Island. Most show soluble solids continuing to rise, acids and TA fluctuating. Results of previous analyses are archived at the Veraison to Harvest web page: http://grapesandwine.cals.cornell.edu/veraison-to-harvest/index.cfm
Cabernet FrancRegion Harvest Date Description Ber. Wt. g. ° Brix pH TA g/L YAN (ppm)
Finger Lakes HARVESTED Finger Lakes HARVESTED Finger Lakes HARVESTED
Lake Erie HARVESTED Long Island 10/16/2012 North Fork 1.85 20.5 3.46 6.6 90Long Island 10/16/2012 North Fork 1.47 20.9 3.33 6.4 52
Average 10/16/2012 1.66 20.7 3.40 6.5 71Prev Sample 10/8/2012 1.62 21.9 3.31 6.2 81‘11 Average 10/11/2011 1.47 20.2 3.40 6.9 102
Malbec
Region Harvest Date Description Ber. Wt. g. ° Brix pH TA g/L YAN (ppm)
Long Island 10/16/2012 North Fork S 1.95 21.6 3.55 8.5 186Prev Sample 10/8/2012 North Fork S 2.45 20.5 3.72 6.6 189‘11 Sample 10/10/2011 1.84 19.4 3.82 8.2 279
MerlotRegion Harvest Date Description Ber. Wt. g. ° Brix pH TA g/L YAN (ppm)
Long Island 10/16/2012 North Fork (4) 1.99 20.7 3.63 5.7 119Long Island 10/8/2012 (8) HARVESTEDPrev Sample 10/8/2012 2.08 19.8 3.66 4.9 101‘11 Sample 10/10/2011 1.75 18.3 3.77 5.6 206
October 19: Senescing grapevine canopies and fall colors at Sheldrake Point on Cayuga Lake.Photo by Tim Martinson

Page 7
Cabernet Franc Top to Bottom: Berry Wt, Brix, pH, TA
FRUiT ChemiSTRy TRendS: 2008-2011
Timothy E Martinson
Statewide Viticulture Extension
The 2012 growing season produced very ripe and clean fruit, with composition comparable to the warm 2010 season. Our fruit maturity samples from 60 vineyards in four growing regions of New York exhibited very early (record early?) ripening, resulting in harvests advanced by two to four weeks from the long-term av-erage. Brix at harvest ran 2 to 4°higher than last year.
Our sampling season ran from September 5 to October 15 (results for final sampling of a few Long Island vine-yards in this issue), but collected only 4-6 samples this year (compared with 7-9 in previous years). Graphs on the following three pages show trends in berry weight, brix, pH, and TA for five cultivars – Cabernet franc, Merlot, Noiret, Riesling and Traminette - for which we sample many vineyards (3-10). Each graph shows trends for the last four (2008-2012) growing seasons. Trends for 2012 (blue), 2011 (green), 2010 (yellow) 2009 (red) and the four-year average (black) are shown.
Berry weights: These jumped around a lot but tended to be average or above – contrasting with the 2010 ber-ry weights, which were lower than average.
Brix: Across all varieties, brix accumulated rapidly, and almost identically to the 2010 growing season. Notably, by the time we collected the first sample this year, brix were already averaging above 17° for all of these five varieties.
Juice pH: It tended to be above average, but consis-tently lower than the 2010 season.
Titratable acidity: Trendlines mirrored 2010 almost exactly.
Looking at these trends, it’s clear that our samples didn’t capture the early part of the ripening curve, and we could have easily started sampling two weeks ear-lier. In all of the five varieties graphed, soluble solids levels were already around 17-18° brix or higher by the time we took our first sample. We missed it.
Does this early veraison and early ripening, as Chris Gerling put it in his lead article, “The new normal”? At this time, since the cool 2009 season, we have three warm years (2010 and 2012 being ‘hot dry’ seasons, while 2011 was a ‘hot, wet’ season).
Do three years make a trend, even if one (2011) didn’t feel like a warm year? Time will tell.

Page 8
MerlotTop to Bottom: Berry Wt, Brix, pH, TA
NoiretTop to Bottom: Berry Wt, Brix, pH, TA

Page 9
RieslingTop to Bottom: Berry Wt, Brix, pH, TA
Traminette Top to Bottom: Berry Wt, Brix, pH, TA

Page 10
Thanks and AcknowledgementsTim Martinson
Many people contributed to bringing Véraison to Harvest to press each week. Sixty fruit samples from four locations in NY are collected, shipped, and analyzed in Geneva, then data must be entered. Here are those we rely upon to bring you the numbers each week:
Enology Lab at Geneva: Ben Gavitt oversaw sample prep and analysis, graduate students Diane Schmitt analyzed samples and recorded results, and Mark Nisbet was responsible for YAN analysis.
Finger Lakes. Mike Collizi, and Bill Wilsey collected samples in the Finger Lakes.
Lake Erie: Paula Joy and Madonna Martin collected samples.
Hudson Valley: Steve Hoying (l) and Joe Whalon (r) sampled vineyards in the Hudson Valley.
The information, including any advice or recommendations, con-tained herein is based upon the research and experience of Cornell Cooperative Extension person-nel. While this information constitutes the best judgement/opinion of such personnel at the time issued, neither Cornell Cooperative Extension nor any representative thereof makes any representation or warrantee, express or implied, of any particular result or application of such information, or re-garding any product. Users of any product are encouraged to read and follow product-labeling instructions and check with the manu-facturer or supplier for updated information. Nothing contained in this information should be interpreted as an endorsement expressed or implied of any particular product.
This newsletter was made possible with support from the New York Wine and Grape Foundation, the J. M. Kaplan
Fund, and USDA Federal Formula funding through the Cornell and New York State Agricultural Experiment Stations.
Veraison to Harvest is a joint publication of:
Cornell Enology Extension Program
Statewide Viticulture Extension Program
Long Island Grape Program - Suffolk CCE
Finger Lakes Grape Program
Lake Erie Regional Grape Program
Hudson Valley Regional Fruit Program
Copyright 2011 © Cornell University
Long Island: Alice Wise (l) and Libby Tarleton collected samples from Long Island.
Support: This newsletter was funded with support from the New York Wine and Grape Foundation (Thanks to Jim Trezise and Susan Spence), and USDA Federal Formula funding from the Cornell University Agricultural Experiment Station and the New York State Agricultural Experiment Station at Geneva. We appreciate the support from our funding agencies.