
Edited by: Peter Linder Volume 43, Number 11, November · PDF fileISSN 0305-0270 Edited by:...
14
ISSN 0305-0270 Edited by: Peter Linder Volume 43, Number 11, November 2016
Transcript of Edited by: Peter Linder Volume 43, Number 11, November · PDF fileISSN 0305-0270 Edited by:...

ISSN 0305-0270
Edited by: Peter Linder Volume 43, Number 11, November 2016
ORIGINALARTICLE
The rich sides of mountain summits – apan-European view on aspectpreferences of alpine plantsManuela Winkler1, Andrea Lamprecht1, Klaus Steinbauer1, Karl H€ulber2,3,
Jean-Paul Theurillat4,5, Frank Breiner6,7, Philippe Choler8,9, Siegrun Ertl2,
Alba Guti�errez Gir�on10, Graziano Rossi11, Pascal Vittoz12, Maia
Akhalkatsi13, Christian Bay14, Jos�e-Luis Benito Alonso15, Tomas
Bergstr€om16, Maria Laura Carranza17, Emmanuel Corcket18, Jan Dick19,
Brigitta Erschbamer20, Rosa Fern�andez Calzado21, Anna Maria Fosaa22,
Rosario G. Gavil�an10, Dany Ghosn23, Khatuna Gigauri24, Doris Huber25,
Robert Kanka26, George Kazakis23, Martin Klipp27, Jozef Kollar26, Thomas
Kudernatsch28, Per Larsson29, Martin Mallaun20, Ottar Michelsen30, Pavel
Moiseev31, Dmitry Moiseev31, Ulf Molau29, Joaqu�ın Molero Mesa21,
Umberto Morra di Cella32, Laszlo Nagy33, Martina Petey32, Mihai Pușcaș34,Christian Rixen35, Angela Stanisci17, Michael Suen2, Anne O. Syverhuset36,
Marcello Tomaselli37, Peter Unterluggauer20, Tudor Ursu38, Luis Villar15,
Michael Gottfried1 and Harald Pauli1*
1GLORIA Coordination, Institute for
Interdisciplinary Mountain Research, Austrian
Academy of Sciences & Center for Global
Change and Sustainability, University of
Natural Resources and Life Sciences Vienna
(BOKU), 1190 Vienna, Austria, 2Department
of Botany and Biodiversity Research,
University of Vienna, 1030 Vienna, Austria,3Vienna Institute for Nature Conservation &
Analyses, 1090 Vienna, Austria, 4Centre
alpien de Phytog�eographie, Fondation J-M.
Aubert, 1938 Champex-Lac, Switzerland,5Section of Biology, University of Geneva, 1292
Chamb�esy, Switzerland, 6Swiss Federal
Institute for Forest, Snow and Landscape
Research WSL, 8903 Birmensdorf, Switzerland,7Department of Ecology and Evolution,
University of Lausanne, 1015 Lausanne,
Switzerland, 8LECA, Univ. Grenoble Alpes,
38000 Grenoble, France, 9CNRS, LTER “Zone
Atelier Alpes”, 38000 Grenoble, France,10Department of Plant Biology II, Universidad
Complutense de Madrid, 28040 Madrid, Spain,11Department of Earth and Environmental
Sciences, University of Pavia, 27100 Pavia,
Italy, 12Institute of Earth Surface Dynamics,
University of Lausanne, 1015 Lausanne,
Switzerland, 13Institute of Botany, Ilia State
University, 0162 Tbilisi, Georgia, 14Institute for
Bioscience, Aarhus University, 4000 Roskilde,
Denmark, 15Instituto Pirenaico de Ecolog�ıa,
Consejo Superior de Investigaciones
Cient�ıf icas, 22700 Jaca, Spain,
ABSTRACT
Aim In the alpine life zone, plant diversity is strongly determined by local
topography and microclimate. We assessed the extent to which aspect and its
relatedness to temperature affect plant species diversity, and the colonization
and disappearance of species on alpine summits on a pan-European scale.
Location Mountain summits in Europe’s alpine life zone.
Methods Vascular plant species and their percentage cover were recorded in
permanent plots in each cardinal direction on 123 summits in 32 regions
across Europe. For a subset from 17 regions, resurvey data and 6-year soil tem-
perature series were available. Differences in temperature sum and Shannon
index as well as species richness, colonization and disappearance of species
among cardinal directions were analysed using linear mixed-effects and gener-
alised mixed-effects models, respectively.
Results Temperature sums were higher in east- and south-facing aspects than
in the north-facing ones, while the west-facing ones were intermediate; differ-
ences were smallest in northern Europe. The patterns of temperature sums
among aspects were consistent among years. In temperate regions, thermal dif-
ferences were reflected by plant diversity, whereas this relationship was weaker
or absent on Mediterranean and boreal mountains. Colonization of species was
positively related to temperature on Mediterranean and temperate mountains,
whereas disappearance of species was not related to temperature.
Main conclusions Thermal differences caused by solar radiation determine
plant species diversity on temperate mountains. Advantages for plants on east-
ern slopes may result from the combined effects of a longer diurnal period of
radiation due to convection cloud effects in the afternoon and the sheltered
position against the prevailing westerly winds. In northern Europe, long sum-
mer days and low sun angles can even out differences among aspects. On
Mediterranean summits, summer drought may limit species numbers on the
warmer slopes. Warmer aspects support a higher number of colonization
ª 2016 John Wiley & Sons Ltd http://wileyonlinelibrary.com/journal/jbi 2261doi:10.1111/jbi.12835
Journal of Biogeography (J. Biogeogr.) (2016) 43, 2261–2273
16Environmental Monitoring, County
Administrative Board of J€amtlands l€an, 83186€Ostersund, Sweden, 17EnvixLab, Dip.
Bioscienze e Territorio, Universit�a degli studi
del Molise, 86090 Pesche, Italy, 18UMR 1202
BioGeCo, Universit�e de Bordeaux & UMR
1202 BioGeCo, INRA, 33600 Pessac, France
*Correspondence: Harald Pauli, GLORIA
Coordination, Institute for Interdisciplinary
Mountain Research, Austrian Academy of
Sciences & Center for Global Change and
Sustainability, University of Natural Resources
and Life Sciences Vienna (BOKU), Silbergasse
30/3, 1190 Vienna, Austria.
E-mail: [email protected]
events. Hence, aspect can be a principal determinant of the pace of climate-
induced migration processes.
Keywords
alpine life zone, climate change, Europe, GLORIA, long-term monitoring,
slope aspect, soil temperature, species diversity, vascular plants
19Centre for Ecology and Hydrology, Midlothian EH26 0QB, UK, 20Institute of Botany,
University of Innbruck, 6020 Innsbruck, Austria, 21Department of Botany, University of
Granada, 18071 Granada, Spain, 22Department of Botany, Faroese Museum of Natural
History, 100 T�orshavn, Faroe Islands, 23Department of Geo-information in Environmental
Management, Mediterranean Agronomic Institute of Chania, 73100 Chania, Greece,24Institute of Ecology, Ilia State University, 0162 Tbilisi, Georgia, 25Nationalpark
Berchtesgaden, 83471 Berchtesgaden, Germany, 26Institute of Landscape Ecology, Slovak
Academy of Sciences, 81499 Bratislava, Slovakia, 27Referat Naturschutz, Amt der
Steierm€arkischen Landesregierung, 8010 Graz, Austria, 28Abteilung Biodiversit€at,
Naturschutz, Jagd, Bayerische Landesanstalt f€ur Wald und Forstwirtschaft, 85354 Freising,
Germany, 29Department of Biological and Environmental Sciences, University of G€oteborg,
40530 Gothenburg, Sweden, 30NTNU Sustainability, Norwegian University of Science and
Technology, 7491 Trondheim, Norway, 31Institute of Plant and Animal Ecology, Russian
Academy of Sciences, 620144 Ekaterinburg, Russia, 32Agenzia Regionale per la Protezione
dell’Ambiente della Valle d’Aosta ARPA, 11020 Saint-Christophe, Italy, 33Departamento de
Biologia Vegetal, Instituto de Biologia, Universidade Estadual de Campinas, 13083-970
Campinas, Brazil, 34A. Borza Botanical Garden, Babes-Bolyai University, 400015 Cluj-
Napoca, Romania, 35WSL Institute for Snow and Avalanche Research SLF, 7260 Davos,
Switzerland, 36Norwegian Institute for Nature Research NINA, 7485 Trondheim, Norway,37Department of Life Science, University of Parma, 43100 Parma, Italy, 38Institute of
Biological Research, National Institute of Research and Development for Biological Sciences,
400015 Cluj-Napoca, Romania
INTRODUCTION
In the absence of shading effects by trees and shrubs, the
rugged terrain of alpine regions causes pronounced differ-
ences in the incident solar radiation and wind exposure.
Hence, the aspect of mountain slopes is a driving factor con-
tributing to the differentiation of topoclimates at high eleva-
tion, secondarily modulated by slope angle (Larson et al.,
2000; Huggett & Cheesman, 2002; Barry, 2008). The small-
scaled mosaic resulting from contrasting micro-topographic
and micro-climatic conditions creates a great variety of
micro-habitats that differ significantly in species composition
over short spatial distances (Scherrer & K€orner, 2010;
K€orner, 2012), which strongly affects the distribution limits
of species and of plant communities (Grabherr et al., 2001;
Crawford, 2008; Wipf et al., 2013). Despite the obvious
importance of aspect for plant life, however, the patterns of
variation attributed to topography are not well documented,
especially on the micro-scale (Moeslund et al., 2013).
The thermal regimes determining plant growth differ
among aspects (Moser et al., 1977; K€orner et al., 2003). Dif-
ferences in vegetation patterns in relation to slope
orientation have been described in detail in a number of
studies (e.g., Grabherr, 1997, 2003; Theurillat et al., 1998).
Gottfried et al. (1998) and Pauli et al. (1999) have shown
increasing elevation limits of alpine grassland from south-
western to south-eastern slopes on Schrankogel in the central
Eastern Alps. Increasing differences in plant species richness
between northern and southern exposures with increasing
elevation in the European Alps were observed by early bota-
nists (Braun, 1913; Schr€oter, 1926). However, to date the
role of aspect in determining small-scale plant species rich-
ness has only been analysed regionally, using subsets of the
dataset we report here (Coldea & Pop, 2004; Stanisci et al.,
2005; Kazakis et al., 2007; Guti�errez-Gir�on & Gavil�an, 2010;
Vittoz et al., 2010), and there are no known general patterns
from continent-wide comparisons.
Analyses of large-scale patterns are particularly important
because the effect of aspect may vary not only along elevation,
but also along latitudinal gradients. The increase in radiation
and the adiabatic decrease in air temperature with elevation
cause more pronounced differences in topoclimates towards
the summits (Geiger, 1950; Barry, 2008). The greatest differ-
ence in annual potential direct radiation between north- and
Journal of Biogeography 43, 2261–2273ª 2016 John Wiley & Sons Ltd
2262
M. Winkler et al.

south-facing slopes in Europe can be observed in the temper-
ate biome (i.e. from c. 45° N to 60° N; Holst et al., 2005;
Barry, 2008). As a consequence, the low-elevation limits of soil
permafrost differ markedly, by around 600 m between the
warmest (south-eastern) and coldest (north-western) aspects
in the Alps (Haeberli, 1975; Boeckli et al., 2012).
If aspect significantly influences the thermal input and
thus the number of species on a mountain slope, it may also
shape the pathways of upward migrating plants. In recent
periods of amplified climate warming (Mountain Research
Initiative E. D. W. Working Group, 2015), ‘thermophilisa-
tion’ of alpine vegetation (Gottfried et al., 2012) and upward
shifts of species ranges (Pauli et al., 2012) have been
observed. Thermally favourable slopes might preferably sup-
port both colonization, due to ameliorated climatic condi-
tions, and disappearance of populations, e.g., due to
increased competition, increasingly unsuitable temperature
conditions and/or drought stress.
In the current study, we compared vascular plant diversity
and its temporal changes among the four cardinal directions
on mountain summits and related the diversity patterns to
the respective soil temperature regime measured in situ. We
used a unique, pan-European dataset derived from the
GLORIA multi-summit design (Global Observation Research
Initiative in Alpine Environments; www.gloria.ac.at). Habi-
tats near mountain summits are not or only marginally
affected by shading from neighbouring land features and they
include all aspects within a small area and, thus, share the
same local species pool. Consequently, the European set of
GLORIA summits provides the unique opportunity to
answer the following questions on a continent-wide scale: (1)
Are there differences in thermal conditions among aspects
besides the obvious differentiation between northern and
southern slopes? If so, are these patterns consistent across
years? (2) Are thermal differences among aspects reflected in
vascular plant diversity patterns? (3) Are aspect differences in
thermal conditions and plant diversity more pronounced in
the temperate biome compared to the biomes in southern
and northern Europe? (4) Are colonization and disappear-
ance of species more common at warmer aspects?
MATERIALS AND METHODS
Study area and design
The complete dataset analysed in this study comprised 123
summits in 32 mountain regions across Europe covering the
Mediterranean, temperate, boreal and polar biomes, surveyed
between 2001 and 2012 (Fig. 1). At all sites a common pro-
tocol was used for recording species in permanent plots on
four summits within a mountain region, representing an ele-
vation gradient from the treeline ecotone to the highest sum-
mits where vascular plants still occurred (Pauli et al., 2004,
2015). In five regions (1, 20, 21, 26, 30) only three suitable
summits were found, and in two regions (13, 30) some
aspects were not documented due to inaccessible terrain (see
Appendix S1 in Supporting Information). On each summit,
the four corner 1 9 1 m quadrats of a 3 9 3 m grid were
established as permanent plots in each cardinal direction (i.e.
east, south, west, north) 5 m below the highest summit
point. In each of the 1 9 1 m quadrats, we recorded all vas-
cular plant species and the percent cover of each species was
visually estimated following Pauli et al. (2004, 2015). In the
centre of each 3 9 3 m grid a data logger (StowAway Tidbit
v2; Onset Corporation, Bourne, MA, USA or GeoPrecision
Mlog-5W, Ettlingen, Germany) recorded the soil temperature
10 cm below the surface at hourly intervals. Temperature
series were available for 67 summits out of 17 regions which
were established in 2001 and re-recorded in 2008 (see
Appendix S1; Gottfried et al., 2012). Analyses involving tem-
perature indices and changes in species diversity were, there-
fore, restricted to this data subset.
Data analysis
Temperature sums
We computed temperature sums as a surrogate for the ther-
mal input that potentially drives diversity patterns. As the
threshold temperatures of photosynthetic activity and growth
of vascular plants in alpine regions are not commonly agreed
and are likely to differ among species (K€orner, 2012), thresh-
old values from 1–5 °C and two growing season lengths
(June to August and May to September) were used (see
Appendix S2). For each logger, hourly measurement values
exceeding a given threshold during the given growing season
were summed for each year of measurement (i.e., 2002–2007). Resulting temperature sums of each logger were
divided by the highest temperature sum on the respective
summit to rescale values between 0 and 1 (hereafter propor-
tional temperature sum). This allows the comparison of the
effect of aspect across regions. Within temperature series,
gaps occurred in 98% of the loggers (e.g., because of battery
change; see Appendix S3), which were filled based on the
measurements of the remaining loggers in the same region
using the function amelia of the R package ‘Amelia II’ (Hon-
aker et al., 2011) which applies an EM (expectation-maximi-
sation)-algorithm on multiple bootstrapped samples of the
incomplete original dataset. Imputation of missing values
was repeated 30 times. Loggers whose data contained large
gaps, which could not be filled through imputation, were
removed prior to analyses (see Appendix S3).
The effect of cardinal directions on proportional tempera-
ture sums was modelled using linear mixed-effect models
(LMMs) with cardinal direction, year and the interaction
between them as fixed-effect predictors and a random inter-
cept term for summits nested within regions. Parameters
were estimated by restricted maximum likelihood using the
function lmer of the R package ‘lme4’ (Bates et al., 2015). To
compare each pairwise combination of cardinal directions,
we re-fitted the models with different cardinal directions as
baseline level. LMMs were computed for each of the 30
Journal of Biogeography 43, 2261–2273ª 2016 John Wiley & Sons Ltd
2263
Aspect preferences of alpine plants

imputations of the incomplete temperature sums dataset.
Their marginal coefficients (� SE) and t-values were aver-
aged over these repetitions and P-values were derived from
the mean t-value. Differences in proportional temperature
sums among cardinal directions were similar across tempera-
ture sum thresholds and growing season lengths (see
Appendix S2), therefore only the results for the intermediate
temperature sum threshold 3 °C and growing season from
May to September are shown.
Plant diversity
We computed two indices describing plant diversity patterns
(species richness and Shannon index) for the dataset encom-
passing 123 summits. Only the first inventory of each region
was used, as second survey data were available only for a subset
of 17 regions. To account for the uneven species numbers
among summits (ranging from 0 to 102 species; see
Appendix S1) we used proportional species richness, i.e., the
number of species in a 3 9 3 m grid divided by the number of
species at the summit, instead of the absolute number of species.
To analyse the effects of cardinal direction on plant species
richness, we applied binomial generalised linear mixed-effects
models (GLMMs) using the logit-link, where the occurrence
of species in a 3 9 3 m grid was regarded as a binary vari-
able with each species out of a local species pool (i.e., all spe-
cies found on a given summit) either occurring or not in a
given 3 9 3 m grid (see Appendix S4a). Cardinal direction
was the only fixed-effect predictor and hierarchical random
intercept terms were estimated for summits nested within
regions. Parameters were estimated by the Laplace approxi-
mation using the function glmer as implemented in the R
package ‘lme4’ (Bates et al., 2015).
As an additional measure of diversity which does not rely
solely on presence/absence, but takes into account abun-
dances of species, the Shannon index (Hill, 1973) was calcu-
lated for each cardinal direction of each summit as:
H0 ¼ �Xs
i¼1
ðpi ln piÞ;
where pi is the cover of the ith species (averaged over the
four permanent 1 9 1 m quadrats of each 3 9 3 m grid),
using the R package ‘vegan’ (Oksanen et al., 2015).
The effects of cardinal directions on the Shannon index
were modelled using LMMs as described above for tempera-
ture sums, but with cardinal direction as the only fixed-effect
predictor.
Colonization and disappearance of species
Two indices indicating changes in diversity patterns (propor-
tional colonization and proportional disappearance of resi-
dents relative to the local species pool) between 2001 and
Figure 1 Geographic distribution of the 32 mountain regions (details see Appendix S1) representing 123 summits used to test for theeffect of cardinal directions of slopes (east, south, west, north) on vascular plant species diversity sampled between 2001 and 2012. For
regions indicated by bold and underlined numbers, soil temperature and species data for two surveys, conducted in 2001 and 2008 wereavailable. The colours of symbols represent species richness on the regional level. The background map shows June/July/August
precipitation sums (obtained from doi: 10.5676/DWD_GPCC/CLIM_M_V2015_025). Projection: Eckert IV.
Journal of Biogeography 43, 2261–2273ª 2016 John Wiley & Sons Ltd
2264
M. Winkler et al.

2008 for the data subset encompassing 67 summits were
computed.
The effect of cardinal direction on the binary variables colo-
nization and disappearance was modelled using binomial
GLMMs with the same settings as described for plant species
richness above. Similar to species richness, colonization and
disappearance were regarded as binary variables, where each
species out of a local species pool colonizes or disappears from
a 3 9 3 m grid or not. The species pool for disappearance was
defined as all species found in the respective 3 9 3 m grid in
2001 (see Appendix S4c). For colonization the species pool
was defined as all species found on a summit in at least one of
the observation years, minus the species already present in the
respective 3 9 3 m grid in 2001 (see Appendix S4b).
Thermal input and plant diversity
To analyse the effect of thermal input on plant diversity,
GLMMs with binomially coded species richness, and LMMs
with Shannon diversity index as dependent variables, propor-
tional temperature sum (threshold 3 °C, growing season
May–September) as fixed effect and summit nested in region
as random intercepts were applied. GLMMs and LMMs were
computed for each of the 30 imputations of the incomplete
temperature sums dataset. Their marginal coefficients (� SE)
and t-values were averaged over these repetitions and
P-values were derived from the mean t-value.
All GLMMs and LMMs were fitted for each biome sepa-
rately, except for the polar biome, which was represented by
only one region and therefore pooled with the boreal regions.
As the contribution of each data point to the degrees of free-
dom (d.f.) is still under discussion in LMMs, we used a conser-
vative approach and calculated d.f. for t-tests as the number of
observations minus the number of fixed effects, minus the
number of random effects, plus the number of random terms.
Two summits without any vascular plant species in the
sample plots were excluded from analyses involving diversity
indices. All analyses were carried out by using R 3.1.1 (R
Development Core Team, 2015). Graphs were drawn using
SigmaPlot 12.0 (Systat Software Inc., San Jos�e, California,
USA).
RESULTS
Proportional temperature sums averaged across years were
significantly higher in the east and south than in the north,
with west being intermediate, on European summits in all
biomes (Fig. 2, see Appendix S5). Differences among cardi-
nal directions were most pronounced in the temperate
biome, and smaller in the Mediterranean and boreal biomes,
respectively (LMMs; Fig. 2, see Appendix S5). These differ-
ences in temperature sums among cardinal directions were
consistent across years (Table 1).
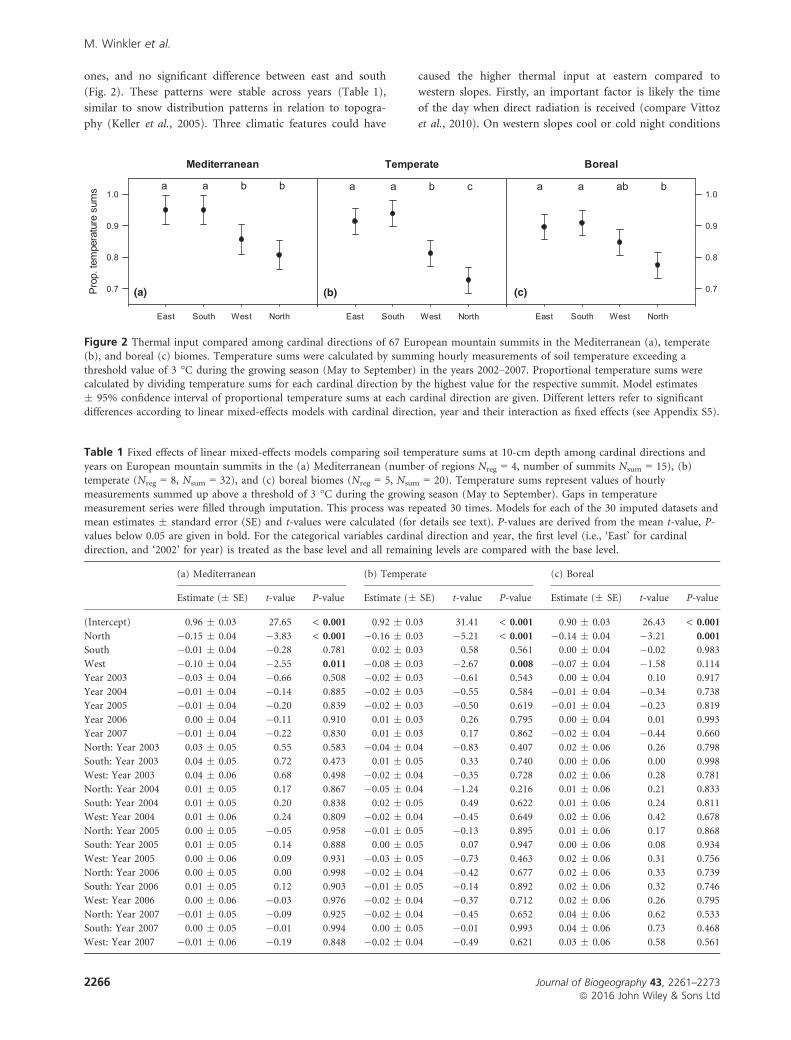
Species richness on Mediterranean summits tended to be
highest on the west-facing and lowest on the east- and north-
facing summit slopes. However, these differences among
cardinal directions were not significant (GLMMs: Fig. 3a, see
Appendix S6a). Species richness on temperate summits was
significantly higher on the east- and south-facing slopes than
in the west- and north-facing ones (GLMMs: Fig. 3b, see
Appendix S6a). On boreal/polar summits, east- and south-
facing slopes both had a higher species richness than north-
facing ones, but west-facing slopes were not significantly dif-
ferent from those facing north and south (GLMMs: Fig. 3c,
see Appendix S6a). Differences among cardinal directions in
the Shannon diversity index showed a similar pattern as spe-
cies richness except for northern slopes: (1) differences among
cardinal directions were not significant on Mediterranean
summits, (2) on temperate summits east and south had signifi-
cantly higher Shannon index values than west and north, (3)
on boreal/polar summits only east and west differed signifi-
cantly (LMMs; Fig. 3d–f, see Appendix S6b).Proportional temperature sum and species richness were
significantly positively correlated in the Mediterranean and
temperate biomes, but not in the boreal biome (GLMMs:
Table 2a). Shannon index and proportional temperature
sums were significantly positively correlated only in the tem-
perate biome (LMMs: Table 2b).
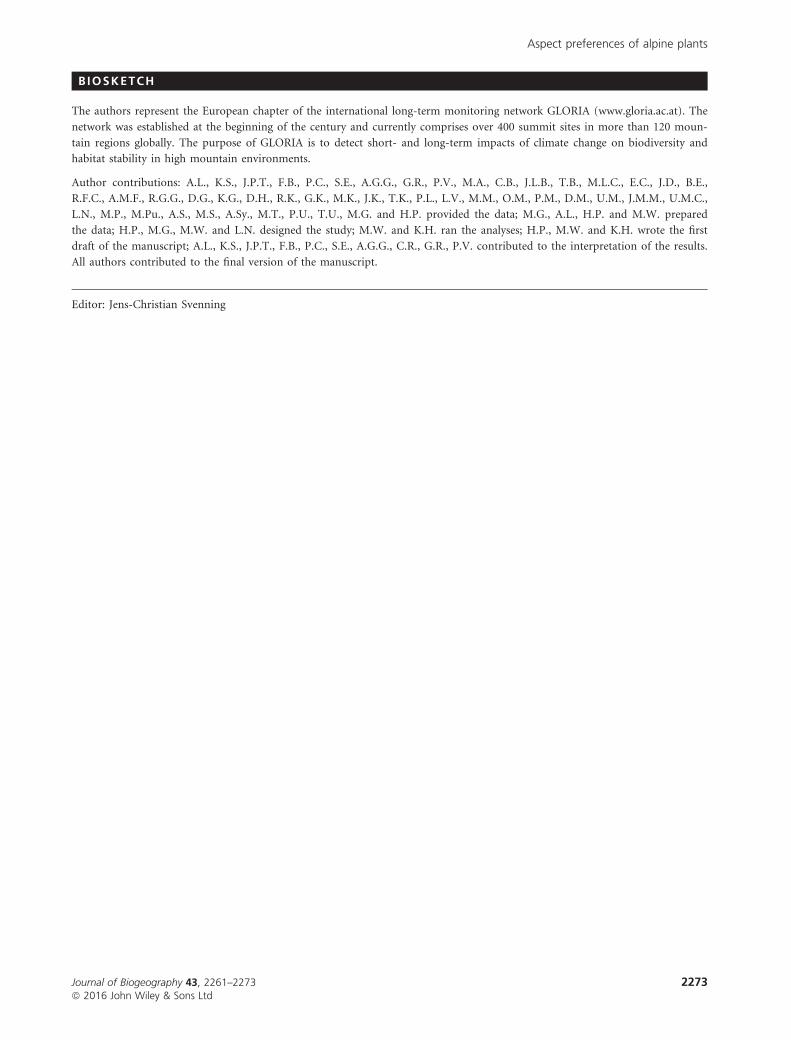
Colonization between 2001 and 2008 was higher in the east
and south than in the west and north on temperate and
Mediterranean summits. These differences among cardinal
directions were statistically significant except for east versus
west on Mediterranean summits (GLMMs: Fig. 4a–b, see
Appendix S7a). In contrast, colonization events were evenly dis-
tributed among cardinal directions on boreal summits
(GLMMs: Fig. 4c, see Appendix S7a). Significant differences
among cardinal directions in disappearance of species were only
observed on temperate summits, with higher species losses on
eastern slopes than on southern and western slopes (GLMMs:
Fig. 4e, see Appendix S7b). On Mediterranean and boreal sum-
mits, disappearance of species was highest in the north and the
south, respectively, however, these differences were not statisti-
cally significant (GLMMs: Fig. 4d,f, see Appendix S7b).
Raw data means and confidence intervals of proportional
temperature sum, proportional species richness, Shannon
index, proportional colonization and proportional disappear-
ance of species in the four cardinal directions (Table 3) were
similar to the GLMM and LMM model estimates illustrated
in Figs 2–4.
DISCUSSION
The warmest aspect on mountain slopes
Temperature sums differed significantly among cardinal
directions on mountain summits from treeline ecotone to
alpine/nival elevations, with east and south exposures show-
ing higher values than west and north. It is common knowl-
edge that, in the Northern Hemisphere, south exposed slopes
provide a warmer microclimate than northern ones at the
same elevation. In addition, we found eastwardly oriented
areas to be thermally more favourable than westerly exposed
Journal of Biogeography 43, 2261–2273ª 2016 John Wiley & Sons Ltd
2265
Aspect preferences of alpine plants
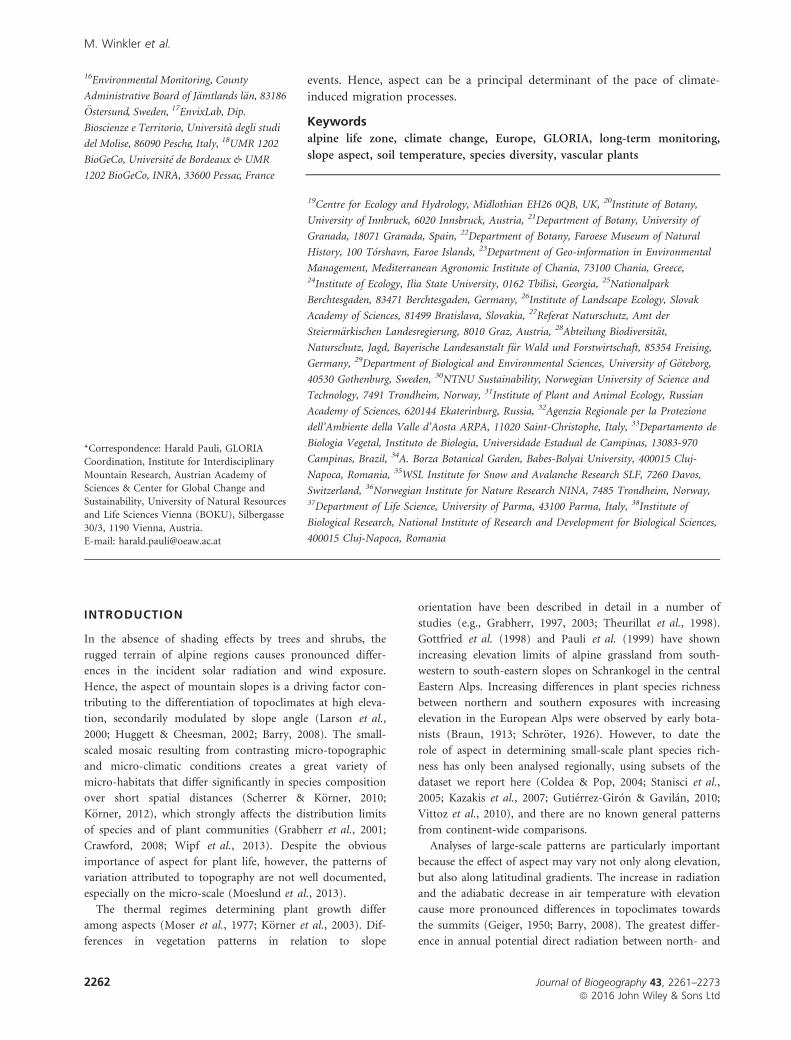
ones, and no significant difference between east and south
(Fig. 2). These patterns were stable across years (Table 1),
similar to snow distribution patterns in relation to topogra-
phy (Keller et al., 2005). Three climatic features could have
caused the higher thermal input at eastern compared to
western slopes. Firstly, an important factor is likely the time
of the day when direct radiation is received (compare Vittoz
et al., 2010). On western slopes cool or cold night conditions
Mediterranean
East South West North
Prop
. tem
pera
ture
sum
s
0.7
0.8
0.9
1.0a a b b
(a)
Temperate
East South West North
a a b c
(b)
Boreal
East South West North
0.7
0.8
0.9
1.0a a ab b
(c)
Figure 2 Thermal input compared among cardinal directions of 67 European mountain summits in the Mediterranean (a), temperate(b), and boreal (c) biomes. Temperature sums were calculated by summing hourly measurements of soil temperature exceeding a
threshold value of 3 °C during the growing season (May to September) in the years 2002–2007. Proportional temperature sums werecalculated by dividing temperature sums for each cardinal direction by the highest value for the respective summit. Model estimates
� 95% confidence interval of proportional temperature sums at each cardinal direction are given. Different letters refer to significant
differences according to linear mixed-effects models with cardinal direction, year and their interaction as fixed effects (see Appendix S5).
Table 1 Fixed effects of linear mixed-effects models comparing soil temperature sums at 10-cm depth among cardinal directions and
years on European mountain summits in the (a) Mediterranean (number of regions Nreg = 4, number of summits Nsum = 15), (b)temperate (Nreg = 8, Nsum = 32), and (c) boreal biomes (Nreg = 5, Nsum = 20). Temperature sums represent values of hourly
measurements summed up above a threshold of 3 °C during the growing season (May to September). Gaps in temperaturemeasurement series were filled through imputation. This process was repeated 30 times. Models for each of the 30 imputed datasets and
mean estimates � standard error (SE) and t-values were calculated (for details see text). P-values are derived from the mean t-value, P-values below 0.05 are given in bold. For the categorical variables cardinal direction and year, the first level (i.e., ‘East’ for cardinal
direction, and ‘2002’ for year) is treated as the base level and all remaining levels are compared with the base level.
(a) Mediterranean (b) Temperate (c) Boreal
Estimate (� SE) t-value P-value Estimate (� SE) t-value P-value Estimate (� SE) t-value P-value
(Intercept) 0.96 � 0.03 27.65 < 0.001 0.92 � 0.03 31.41 < 0.001 0.90 � 0.03 26.43 < 0.001
North �0.15 � 0.04 �3.83 < 0.001 �0.16 � 0.03 �5.21 < 0.001 �0.14 � 0.04 �3.21 0.001
South �0.01 � 0.04 �0.28 0.781 0.02 � 0.03 0.58 0.561 0.00 � 0.04 �0.02 0.983
West �0.10 � 0.04 �2.55 0.011 �0.08 � 0.03 �2.67 0.008 �0.07 � 0.04 �1.58 0.114
Year 2003 �0.03 � 0.04 �0.66 0.508 �0.02 � 0.03 �0.61 0.543 0.00 � 0.04 0.10 0.917
Year 2004 �0.01 � 0.04 �0.14 0.885 �0.02 � 0.03 �0.55 0.584 �0.01 � 0.04 �0.34 0.738
Year 2005 �0.01 � 0.04 �0.20 0.839 �0.02 � 0.03 �0.50 0.619 �0.01 � 0.04 �0.23 0.819
Year 2006 0.00 � 0.04 �0.11 0.910 0.01 � 0.03 0.26 0.795 0.00 � 0.04 0.01 0.993
Year 2007 �0.01 � 0.04 �0.22 0.830 0.01 � 0.03 0.17 0.862 �0.02 � 0.04 �0.44 0.660
North: Year 2003 0.03 � 0.05 0.55 0.583 �0.04 � 0.04 �0.83 0.407 0.02 � 0.06 0.26 0.798
South: Year 2003 0.04 � 0.05 0.72 0.473 0.01 � 0.05 0.33 0.740 0.00 � 0.06 0.00 0.998
West: Year 2003 0.04 � 0.06 0.68 0.498 �0.02 � 0.04 �0.35 0.728 0.02 � 0.06 0.28 0.781
North: Year 2004 0.01 � 0.05 0.17 0.867 �0.05 � 0.04 �1.24 0.216 0.01 � 0.06 0.21 0.833
South: Year 2004 0.01 � 0.05 0.20 0.838 0.02 � 0.05 0.49 0.622 0.01 � 0.06 0.24 0.811
West: Year 2004 0.01 � 0.06 0.24 0.809 �0.02 � 0.04 �0.45 0.649 0.02 � 0.06 0.42 0.678
North: Year 2005 0.00 � 0.05 �0.05 0.958 �0.01 � 0.05 �0.13 0.895 0.01 � 0.06 0.17 0.868
South: Year 2005 0.01 � 0.05 0.14 0.888 0.00 � 0.05 0.07 0.947 0.00 � 0.06 0.08 0.934
West: Year 2005 0.00 � 0.06 0.09 0.931 �0.03 � 0.05 �0.73 0.463 0.02 � 0.06 0.31 0.756
North: Year 2006 0.00 � 0.05 0.00 0.998 �0.02 � 0.04 �0.42 0.677 0.02 � 0.06 0.33 0.739
South: Year 2006 0.01 � 0.05 0.12 0.903 �0.01 � 0.05 �0.14 0.892 0.02 � 0.06 0.32 0.746
West: Year 2006 0.00 � 0.06 �0.03 0.976 �0.02 � 0.04 �0.37 0.712 0.02 � 0.06 0.26 0.795
North: Year 2007 �0.01 � 0.05 �0.09 0.925 �0.02 � 0.04 �0.45 0.652 0.04 � 0.06 0.62 0.533
South: Year 2007 0.00 � 0.05 �0.01 0.994 0.00 � 0.05 �0.01 0.993 0.04 � 0.06 0.73 0.468
West: Year 2007 �0.01 � 0.06 �0.19 0.848 �0.02 � 0.04 �0.49 0.621 0.03 � 0.06 0.58 0.561
Journal of Biogeography 43, 2261–2273ª 2016 John Wiley & Sons Ltd
2266
M. Winkler et al.

persist longer during the day compared to eastern slopes,
which receive direct solar radiation early in the morning.
Secondly, convective cloud formation is a common phe-
nomenon, especially in temperate mountains, which occurs
most frequently after midday (Geiger, 1950; Hoeck, 1952). It
disproportionally reduces the daily direct radiation on the
western slopes compared to eastern ones. Thirdly, in most
European mountains, the western to north-western sides of
mountains are exposed to the main weather system and,
therefore, experience windier conditions, causing stronger
evaporative cooling (Barry, 2008) than eastern to south-east-
ern aspects.
The warmer, the richer . . .
Here, we provide a first pan-European view on relationships
of alpine vascular plant species diversity at different aspects
and their climatic conditions. We show that east- and south-
exposed mountain slopes favour local-scale species richness,
compared to the western and northern sides of the same
mountains (Fig. 3a), which largely confirms the results of
regional summit studies (Coldea & Pop, 2004; Stanisci et al.,
2005; Guti�errez-Gir�on & Gavil�an, 2010; Vittoz et al., 2010).
This pattern, however, is not consistent across the continent.
On temperate mountains the strong positive relation between
plant diversity and temperature (Table 2) is consistent with
the species-energy hypothesis (Wright, 1983) and other tem-
perature-related diversity hypotheses (Currie et al., 2004),
suggesting temperature-driven processes as decisive determi-
nants of vascular plant species richness. A number of studies
and reviews (Allen et al., 2002; Francis & Currie, 2003; Wil-
lig et al., 2003; Clarke & Gaston, 2006; O’Brien, 2006; Haw-
kins et al., 2007; Kreft & Jetz, 2007; Whittaker et al., 2007;
Hurlbert & Jetz, 2010; Gillman et al., 2015) discussed tem-
perature, solar radiation, water and potential evapotranspira-
tion as underlying determinants of species richness along
large-scale, mostly latitudinal gradients. Moser et al. (2005)
found that climatic variables such as temperature and poten-
tial evapotranspiration were by far the most important pre-
dictors of vascular plant species richness on a country-wide
scale in the Austrian Alps. Elevation gradients in species rich-
ness have also been associated with climatic gradients and
particularly gradients of solar energy received, as well as with
species–area relationships, since the available area decreases
with increasing elevation (Grabherr et al., 1995; Lomolino,
2001; Grytnes, 2003; Theurillat et al., 2003, 2011; Bruun
et al., 2006).
The strong match between patterns of thermal input and
plant species diversity in the temperate biome (Table 2)
might be related to the growing season that usually starts
around the summer solstice in the alpine zone. As morning
irradiation starts in the north-east at summer solstice, the
advantage in growing on an eastern slope is obvious and
especially pronounced when night-time temperature falls
close to or below the threshold for plant growth and when
afternoon radiation is reduced through convective cloud for-
mation. Diurnal periods of low temperature, which are detri-
mental to plant growth or other biotic processes may, thus,
be shorter on eastern than on western, northern and even on
southern slopes.
East South West North0.8
1.0
1.2
1.4
1.6
1.8
2.0
2.2
2.4
East South West NorthEast South West North
Shan
non
inde
x
0.8
1.0
1.2
1.4
1.6
1.8
2.0
2.2
2.4
Mediterranean
East South West North
Spec
ies
richn
ess
0.3
0.4
0.5
0.6
0.7
0.8 a a a a
(a)
Temperate
East South West North
a a b b
(b)
Boreal/Polar
East South West North
0.3
0.4
0.5
0.6
0.7
0.8a ab bc c
(c)
a a a a
(d)
a a b b
(e)
a ab b ab
(f)
Figure 3 Vascular plant species diversity on alpine summits in Mediterranean (a, d), temperate (b, e), and boreal/polar (c, f) Europe
recorded between 2001 and 2012. Model estimates (� 95% confidence interval) are given for species richness as proportion of the localspecies pool (upper panel) and Shannon index (lower panel) at each cardinal direction. Different letters refer to significant differences
according to generalised linear mixed models (GLMMs) with a binomial error distribution and logit link (upper panel, seeAppendix S6a); and linear mixed-effect models (lower panel, see Appendix S6b).
Journal of Biogeography 43, 2261–2273ª 2016 John Wiley & Sons Ltd
2267
Aspect preferences of alpine plants

. . .but not in all biomes
The pattern of the warmest conditions on eastern and
southern aspects compared to western and northern ones
was clearly more distinct in temperate than in Mediterranean
and boreal mountain regions of Europe (Fig. 2). This is in
concordance with latitude-dependent differences in direct
solar radiation being most pronounced among aspects at
temperate latitudes (Barry, 2008). In boreal and polar biomes
diurnal differences in solar radiation and thus in temperature
sums among aspects, are generally reduced due to long day
lengths at low sun angles. In contrast to temperate regions,
thermal differences on Mediterranean mountains between
east and south versus west and north slopes are not or only
Table 2 The influence of soil temperature on (a) species richness, and (b) the values of Shannon index on European mountain
summits in the Mediterranean (number of regions Nreg = 4, number of summits Nsum = 15), temperate (Nreg = 8, Nsum = 32), andboreal/polar biomes (Nreg = 5, Nsum = 20). Given are fixed effects of (a) generalised linear mixed-effects models with species richness
coded as a binomial variable (estimates are given on both the logit scale and the scale of the response variable, i.e., the probabilityscale), and (b) linear mixed-effects models. Temperature sums represent values of hourly measurements above a threshold of 3 °Csummed up during the growing season (May to September) and averaged for the years 2002–2007. Temperature sums of each cardinaldirection were divided by the highest temperature sum on the respective summit to rescale values between 0 and 1. Gaps in temperature
measurement series were filled through imputation. This process was repeated 30 times. Models for each of the 30 imputed datasets andmean parameter estimates were calculated (for details see text); P-values below 0.05 are given in bold.
(a) Species richness (b) Shannon index
Estimate
(probability scale)
Estimate � SE
(logit scale) z-value P-value Estimate � SE t-value P-value
Mediterranean
(Intercept) �1.86 � 0.64 �2.90 0.004 1.13 � 0.54 2.09 0.045
Temperature sum 0.050 2.12 � 0.67 3.15 0.002 0.40 � 0.54 0.75 0.460
Temperate
(Intercept) �1.19 � 0.19 �6.15 < 0.001 1.06 � 0.28 3.74 < 0.001
Temperature sum 0.040 1.56 � 0.22 7.10 < 0.001 0.83 � 0.29 2.86 0.005
Boreal/Polar
(Intercept) �0.20 � 0.42 �0.47 0.635 1.46 � 0.36 4.04 < 0.001
Temperature sum 0.015 0.61 � 0.44 1.39 0.164 �0.35 � 0.37 �0.95 0.348
East South West North0.0
0.1
0.2
0.3
East South West NorthEast South West North
Dis
appe
aran
ce
0.0
0.1
0.2
0.3
Mediterranean
East South West North
Col
oniz
atio
n
0.0
0.1
0.2
0.3
0.4ab a bc c
(a)
Temperate
East South West North
a a b b
(b)
Boreal
East South West North0.0
0.1
0.2
0.3
0.4a a a a
(c)
a a a a
(d)
a b b ab
(e)
a a a a
(f)
Figure 4 Colonization and disappearance of resident species on alpine summits in Mediterranean (a, d), temperate (b, e), and boreal(c, f) Europe between 2001 and 2008. Model estimates (� 95% confidence interval) are given for colonization (upper panel) and
disappearance (lower panel) as proportion of the local species pool at each cardinal direction. Different letters refer to significantdifferences according to generalised linear mixed models (GLMMs) with a binomial error distribution and logit link (see Appendix S7).
Journal of Biogeography 43, 2261–2273ª 2016 John Wiley & Sons Ltd
2268
M. Winkler et al.

weakly mirrored by plant diversity (Figs 2 & 3; Table 2;
compare with Kazakis et al., 2007), most likely due to inter-
fering effects of low water availability during the growing
season in the Mediterranean (Fig. 1; K€oppen & Geiger,
1936). Summer drought in Mediterranean mountains can act
as a filter preventing a number of species to grow in the
warmest habitats that are likely to suffer from increased
evapotranspiration (O’Brien, 2006; Gim�enez-Benavides et al.,
2007; Guti�errez-Gir�on & Gavil�an, 2013; Li et al., 2013). A
further reason for inconsistent results at the Mediterranean
sites might lie in regional idiosyncrasies regarding the onset
and length of the dry summer period, which can lead to a
differing severity of drought effects. Finally, the lower num-
ber of sites in the Mediterranean and boreal/polar biomes
and the lower species numbers may have contributed to less
significant differences among aspects.
The magnitude of species colonization
Observed species colonization was not evenly distributed
among cardinal directions on temperate and Mediterranean
summits. Colonizations were more frequently observed at
warmer eastern and southern sides than at northern or west-
ern exposed slopes (Fig. 4a,b). This pattern is consistent with
observations on Piz Linard, Switzerland, during the past six
decades (Pauli et al., 2003; Wipf et al., 2013). Disappearances
of species on the European GLORIA summits were less
common (see Appendix S1 and S7) and more randomly dis-
tributed among aspects than observed colonizations (Fig. 4),
probably due to the short period of observation with respect
to the longevity of alpine plants. Similarly, species turnover
on the majority of historical summit observation sites in the
Alps has been attributed to colonization rather than to local
extinction of species (Matteodo et al., 2013), although factors
that are not directly temperature-related may also be relevant
for the upward shift observed in comparison with historical
data from European summits (Grytnes et al., 2014). Our
results, however, show that climatically amenable mountain
slopes support stronger migration dynamics through suitable
habitat conditions and, probably, also through stronger con-
vective winds on warmer mountain slopes, which may pro-
mote diaspore propagation. Topography in high-mountain
environments, thus, can be a crucial determinant of the
velocity of climate change-induced migration processes.
CONCLUSIONS
Differences in plant species richness appear to be strongly
related to a thermal gradient caused by incident solar radia-
tion. The general pattern of higher species numbers on east-
ern sides, compared to western ones, could result from
combined effects of a longer solar exposure and wind shelter-
ing in a leeward position. Differences in species numbers and
temperature sums, however, are mainly observed in mesic
Table 3 Indices for thermal input, plant species diversity, colonization and disappearance of species compared among cardinal
directions of Mediterranean, temperate and boreal/polar European mountain summits. Given are raw data means and 95% confidenceintervals (CI) of (a) proportional temperature sums (i.e., temperature sums of each cardinal direction divided by the highest
temperature sum on the respective summit), (b) proportional species richness, (c) Shannon index, (d) proportional colonization, and(e) proportional disappearance of resident species. Proportional in (b)–(e) means relative to the local species pool. For details on the
definition of local species pool and computation of indices see text and Appendix S4.
Cardinal direction
Mean (95% CI)
Mediterranean Temperate Boreal/Polar
(a) Temperature sum East 0.940 (0.925–0.956) 0.910 (0.893–0.926) 0.891 (0.870–0.912)South 0.937 (0.915–0.960) 0.928 (0.914–0.942) 0.904 (0.873–0.934)West 0.841 (0.815–0.867) 0.809 (0.788–0.831) 0.846 (0.816–0.876)North 0.804 (0.768–0.841) 0.723 (0.697–0.750) 0.772 (0.744–0.801)
(b) Species richness East 0.467 (0.364–0.570) 0.582 (0.531–0.633) 0.594 (0.506–0.682)South 0.517 (0.424–0.610) 0.546 (0.493–0.599) 0.580 (0.506–0.654)West 0.560 (0.490–0.630) 0.448 (0.397–0.500) 0.560 (0.474–0.645)North 0.488 (0.388–0.587) 0.459 (0.412–0.505) 0.537 (0.445–0.630)
(c) Shannon index East 1.408 (1.068–1.749) 1.923 (1.762–2.085) 1.510 (1.260–1.760)South 1.422 (1.131–1.712) 1.900 (1.722–2.078) 1.394 (1.133–1.655)West 1.519 (1.283–1.755) 1.754 (1.581–1.927) 1.279 (1.027–1.531)North 1.531 (1.279–1.784) 1.656 (1.466–1.846) 1.492 (1.280–1.704)
(d) Colonization East 0.140 (0.048–0.232) 0.263 (0.167–0.360) 0.236 (0.119–0.353)South 0.220 (0.073–0.366) 0.169 (0.127–0.211) 0.160 (0.080–0.241)West 0.083 (0.004–0.161) 0.130 (0.096–0.165) 0.228 (0.103–0.354)North 0.066 (�0.023–0.154) 0.122 (0.070–0.174) 0.143 (0.047–0.238)
(e) Disappearance East 0.142 (0.057–0.227) 0.142 (0.088–0.195) 0.059 (0.022–0.096)South 0.100 (0.029–0.171) 0.106 (0.037–0.174) 0.054 (0.013–0.095)West 0.135 (0.030–0.239) 0.084 (0.038–0.129) 0.084 (0.020–0.147)North 0.187 (0.007–0.368) 0.085 (0.049–0.121) 0.058 (�0.003–0.120)
Journal of Biogeography 43, 2261–2273ª 2016 John Wiley & Sons Ltd
2269
Aspect preferences of alpine plants

temperate mountains, whereas boreal/polar as well as
Mediterranean mountains showed no relationship, probably
due to a more even diurnal radiation or because of unfa-
vourable aridity at the warmer sides, respectively. Coloniza-
tion of species was more frequent at the warmest sides of
temperate mountain peaks, indicating that thermal patterns
on mountain slopes are determinants of the pathways and of
the magnitude of species migration. Thus, aspect may
strongly influence the persistence of populations and most
likely the pace and dynamics of thermophilisation (Gottfried
et al., 2012), and the time lag until extinction debts will be
paid-off (Jackson & Sax, 2010; Dullinger et al., 2012) under
amplifying climate warming conditions (Mountain Research
Initiative E. D. W. Working Group, 2015).
ACKNOWLEDGEMENTS
We acknowledge the funding for species and temperature
data recording through the European Union FP-5 project
GLORIA-Europe (EVK2-CT-2000-0006), the Swiss MAVA
Foundation project ‘Climate change impacts in protected
areas of the Alps and high mountains of Eastern Europe and
the Mediterranean region’, and a number of projects sup-
ported by various national funding agencies such as the Slo-
vak grant agency (VEGA 2/0025/13), Switzerland (OFES
00.0184-1), Russian Foundation for Basic Research (RFBR
15-05-05549 A), the Norwegian Environment Agency, the
LTER ‘Zone Atelier Alpes’ funded by CNRS, the Madrid
Regional Government (REMEDINAL3-CM, S2013/MAE-
2719), and the Arag�on Regional Government (Dept. of Envi-
ronment, GLORIA-Arag�on Project). Data are stored at the
GLORIA head office, based at the Austrian Academy of
Sciences and the University of Natural Resources and Life
Sciences (BOKU), Vienna. We are grateful for the logistic and
financial support through protected area authorities, in partic-
ular of the National Parks Berchtesgaden (Germany), Ges€ause
(Austria), Mercantour (France), Sierra Nevada and Ordesa-
Monte Perdido (Spain), Cairngorms (Scotland), and the Swiss
National Park. We thank Georg Grabherr, Stefan Dullinger,
Philipp Semenchuck and Christian Lettner for their input on
earlier versions of the study, Manfred Bardy-Durchhalter for
preparing temperature series and Fig. 1, Andreas Futschik for
support in applying imputation algorithms for temperature
time series, Isla Meyers-Smith and two anonymous referees for
constructive comments on a previous version of the manu-
script and more than 150 co-workers for performing field
recording. We dedicate this paper to Michael Gottfried, col-
league and friend, who made important contributions to
establishing the GLORIA network and to designing this study,
until his sudden debilitating illness in 2012.
REFERENCES
Allen, A.P., Brown, J.H. & Gillooly, J.F. (2002) Global biodi-
versity, biochemical kinetics, and the energetic-equivalence
rule. Science, 297, 1545–1548.
Barry, R.G. (2008) Mountain weather and climate, 3rd edn.
Cambridge University Press, New York.
Bates, D., Maechler, M., Bolker, B.M. & Walker, S. (2015)
lme4: Linear mixed-effects models using Eigen and S4.
Journal of Statistical Software, 67, 1–48.Boeckli, L., Brenning, A., Gruber, S. & Noetzli, J. (2012) Per-
mafrost distribution in the European Alps: calculation and
evaluation of an index map and summary statistics. The
Cryosphere, 6, 807.
Braun, J. (1913) Die Vegetationsverh€altnisse der Schneestufe
in den R€atisch-Lepontischen Alpen. Neue Denkschrift der
Schweizerischen Naturforschenden Gesellschaft, 48, 1–348.Bruun, H.H., Moen, J., Virtanen, R., Grytnes, J.-A., Oksanen,
L. & Angerbj€orn, A. (2006) Effects of altitude and topogra-
phy on species richness of vascular plants, bryophytes and
lichens in alpine communities. Journal of Vegetation
Science, 17, 37–46.Clarke, A. & Gaston, K.J. (2006) Climate, energy and diver-
sity. Proceedings of the Royal Society B: Biological Sciences,
273, 2257–2266.Coldea, G. & Pop, A. (2004) Floristic diversity in relation to
geomorphological and climatic factors in the subalpine-
alpine belt of the Rodna Mountains (the Romanian
Carpathians). Pirineos, 158–159, 61–72.Crawford, R.M. (2008) Plants at the margin: ecological limits
and climate change. Cambridge University Press, New York.
Currie, D.J., Mittelbach, G.G., Cornell, H.V., Field, R., Gu�egan,
J.-F., Hawkins, B.A., Kaufman, D.M., Kerr, J.T., Oberdorff,
T., O’Brien, E. & Turner, J.R.G. (2004) Predictions and tests
of climate-based hypotheses of broad-scale variation in tax-
onomic richness. Ecology Letters, 7, 1121–1134.Dullinger, S., Gattringer, A., Thuiller, W. et al. (2012)
Extinction debt of high-mountain plants under twenty-
first-century climate change. Nature Climate Change, 2,
619–622.Francis, A.P. & Currie, D.J. (2003) A globally consistent rich-
ness-climate relationship for angiosperms. The American
Naturalist, 161, 523–536.Geiger, R. (1950) The climate near the ground. Harvard
University Press, Cambridge, MA.
Gillman, L.N., Wright, S.D., Cusens, J., McBride, P.D., Malhi,
Y. & Whittaker, R.J. (2015) Latitude, productivity and spe-
cies richness. Global Ecology and Biogeography, 24, 107–117.Gim�enez-Benavides, L., Escudero, A. & Iriondo, J.M. (2007)
Reproductive limits of a late-flowering high-mountain
Mediterranean plant along an elevational climate gradient.
New Phytologist, 173, 367–382.Gottfried, M., Pauli, H. & Grabherr, G. (1998) Prediction of
vegetation patterns at the limits of plant life: a new view
of the alpine-nival ecotone. Arctic and Alpine Research, 30,
207–221.Gottfried, M., Pauli, H., Futschik, A. et al. (2012) Continent-
wide response of mountain vegetation to climate change.
Nature Climate Change, 2, 111–115.Grabherr, G. (1997) The high-mountain ecosystems of the
Alps. Polar and alpine tundra. Ecosystems of the world
Journal of Biogeography 43, 2261–2273ª 2016 John Wiley & Sons Ltd
2270
M. Winkler et al.

(ed. by F.E. Wielgolaski), pp. 97–121. Elsevier, Amster-
dam.
Grabherr, G. (2003) Alpine vegetation dynamics and climate
change – a synthesis of long-term studies and observa-
tions. Alpine biodiversity in Europe – a Europe-wide assess-
ment of biological richness and change (ed. by L. Nagy, G.
Grabherr, C. K€orner and D.B.A. Thompson), pp. 399–409.Springer, Berlin.
Grabherr, G., Gottfried, M., Gruber, A. & Pauli, H. (1995)
Patterns and current changes in alpine plant diversity. Arc-
tic and alpine biodiversity: patterns, causes and ecosystem
consequences (ed. by F.S. Chapin III and C. K€orner), pp.
167–181. Springer, Berlin.Grabherr, G., Gottfried, M. & Pauli, H. (2001) Long-term
monitoring of mountain peaks in the Alps. Biomonitoring:
general and applied aspects on regional and global scales
(ed. by C.A. Burga and A. Kratochwil), pp. 153–177. Tasksfor Vegetation Science, Kluwer, Dordrecht.
Grytnes, J.A. (2003) Species-richness patterns of vascular
plants along seven altitudinal transects in Norway. Ecogra-
phy, 26, 291–300.Grytnes, J.-A., Kapfer, J., Jurasinski, G., Birks, H.H., Hen-
riksen, H., Klanderud, K., Odland, A., Ohlson, M., Wipf,
S. & Birks, H.J.B. (2014) Identifying the driving factors
behind observed elevational range shifts on European
mountains. Global Ecology and Biogeography, 23, 876–884.
Guti�errez-Gir�on, A. & Gavil�an, R. (2010) Spatial patterns
and interspecific relations analysis help to better under-
stand species distribution patterns in a Mediterranean high
mountain grassland. Plant Ecology, 210, 137–151.Guti�errez-Gir�on, A. & Gavil�an, R. (2013) Plant functional
strategies and environmental constraints in Mediterranean
high mountain grasslands in central Spain. Plant Ecology
& Diversity, 6, 435–446.Haeberli, W. (1975) Untersuchungen zur Verbreitung von Per-
mafrost zwischen Fl€uelapass und Piz Grialetsch (Graub€un-
den). Dissertation, Mitteilung VAW/ETHZ, 17, Universit€at
Basel, Basel.
Hawkins, B.A., Albuquerque, F.S., Ara�ujo, M.B. et al. (2007)
A global evaluation of metabolic theory as an explanation
for terrestrial species richness gradients. Ecology, 88, 1877–1888.
Hill, M.O. (1973) Diversity and evenness: a unifying notation
and its consequences. Ecology, 54, 427–432.Hoeck, E. (1952) Der Einfluss der Strahlung und der Temper-
atur auf den Schmelzprozess der Schneedecke. Beitr€age zur
Geologie der Schweiz – Geotechnische Serie – Hydrologie,
Lfg. 8. K€ummerly & Frey, Bern.
Holst, T., Rost, J. & Mayer, H. (2005) Net radiation balance
for two forested slopes on opposite sides of a valley. Inter-
national Journal of Biometeorology, 49, 275–284.Honaker, J., King, G. & Blackwell, M. (2011) Amelia II: a
program for missing data. Journal of Statistical Software,
45, 1–47.
Huggett, R.J. & Cheesman, J. (2002) Topography and the
environment. Pearson Education, Harlow, England.
Hurlbert, A.H. & Jetz, W. (2010) More than “more individu-
als”: the nonequivalence of area and energy in the scaling
of species richness. The American Naturalist, 176, E50–E65.
Jackson, S.T. & Sax, D.F. (2010) Balancing biodiversity in a
changing environment: extinction debt, immigration credit
and species turnover. Trends in Ecology and Evolution, 25,
153–160.Kazakis, G., Ghosn, D., Vogiatzakis, I.N. & Papanastasis, V.P.
(2007) Vascular plant diversity and climate change in the
alpine zone of the Lefka Ori, Crete. Biodiversity and Con-
servation, 16, 1603–1615.Keller, F., Goyette, S. & Beniston, M. (2005) Sensitivity anal-
ysis of snow cover to climate change scenarios and their
impact on plant habitats in alpine terrain. Climatic
Change, 72, 299–319.K€oppen, W. & Geiger, R. (eds) (1936) Handbuch der Klima-
tologie: Das geographische System der Klimate. Gebr€uder
Borntraeger, Berlin.
K€orner, C. (2012) Alpine treelines: functional ecology of the
global high elevation tree limits. Springer, Basel.
K€orner, C., Paulsen, J. & Pelaez-Riedl, S. (2003) A biocli-
matic characterisation of Europe’s alpine areas. Alpine bio-
diversity in Europe – a Europe-wide assessment of biological
richness and change (ed. by L. Nagy, G. Grabherr, C.
K€orner and D.B.A. Thompson), pp. 13–28. Ecological
Studies, Springer, Berlin.
Kreft, H. & Jetz, W. (2007) Global patterns and determinants
of vascular plant diversity. Proceedings of the National
Academy of Sciences USA, 104, 5925–5930.Larson, D.W., Matthes, U. & Kelly, P.E. (2000) Cliff ecology
– patterns and processes in cliff ecosystems. Cambridge
University Press, Cambridge, England.
Li, L., Wang, Z., Zerbe, S., Abdusalih, N., Tang, Z., Ma, M.,
Yin, L., Mohammat, A., Han, W. & Fang, J. (2013) Species
richness patterns and water-energy dynamics in the dry-
lands of northwest China. PLoS ONE, 8, e66450.
Lomolino, M.V. (2001) Elevation gradients of species-den-
sity: historical and prospective views. Global Ecology and
Biogeography, 10, 3–13.Matteodo, M., Wipf, S., St€ockli, V., Rixen, C. & Vittoz, P.
(2013) Elevation gradient of successful plant traits for col-
onizing alpine summits under climate change. Environ-
mental Research Letters, 8, 024043.
Moeslund, J.E., Arge, L., Bøcher, P.K., Dalgaard, T. & Sven-
ning, J.-C. (2013) Topography as a driver of local terres-
trial vascular plant diversity patterns. Nordic Journal of
Botany, 31, 129–144.Moser, D., Dullinger, S., Englisch, T., Niklfeld, H., Plutzar,
C., Sauberer, N., Zechmeister, H.G. & Grabherr, G. (2005)
Environmental determinants of vascular plant species rich-
ness in the Austrian Alps. Journal of Biogeography, 32,
1117–1127.
Journal of Biogeography 43, 2261–2273ª 2016 John Wiley & Sons Ltd
2271
Aspect preferences of alpine plants

Moser, W., Brzoska, W., Zachhuber, K. & Larcher, W.
(1977) Ergebnisse des IBP-Projekts “Hoher Nebelkogel
3184 m”. Sitzungsbericht der Oesterreichischen Akademie
der Wissenschaften, 186, 387–419.Mountain Research Initiative E. D. W. Working Group
(2015) Elevation-dependent warming in mountain regions
of the world. Nature Climate Change, 5, 424–430.O’Brien, E.M. (2006) Biological relativity to water–energydynamics. Journal of Biogeography, 33, 1868–1888.
Oksanen, J., Blanchet, F.G., Kindt, R., Legendre, P., Minchin,
P.R., O’Hara, B., Simpson, G.L., Solymos, P., Stevens,
M.H.H. & Wagner, H. (2015) Vegan: Community Ecology
Package. R package version 2.3-0. http://CRAN.R-projec-
t.org/package=vegan.
Pauli, H., Gottfried, M. & Grabherr, G. (1999) Vascular
plant distribution patterns at the low-temperature limits
of plant life – the alpine-nival ecotone of Mount
Schrankogel (Tyrol, Austria). Phytocoenologia, 29, 297–325.
Pauli, H., Gottfried, M. & Grabherr, G. (2003) The Piz
Linard (3411 m), the Grisons, Switzerland – Europe’s old-
est mountain vegetation study site. Alpine biodiversity in
Europe – a Europe-wide assessment of biological richness
and change (ed. by L. Nagy, G. Grabherr, C. K€orner and
D.B.A. Thompson), pp. 443–448. Springer, Berlin.Pauli, H., Gottfried, M., Hohenwallner, D., Reiter, K., Casale,
R. & Grabherr, G. (2004) The GLORIA field manual –multi-summit approach. European Commission DG
Research, EUR 21213, Office for Official Publications of
the European Communities, European Commission, Lux-
embourg.
Pauli, H., Gottfried, M., Dullinger, S. et al. (2012) Recent
plant diversity changes on Europe’s mountain summits.
Science, 336, 353–355.
Pauli, H., Gottfried, M., Lamprecht, A., Niessner, S., Rumpf,
S., Winkler, M., Steinbauer, K. & Grabherr, G.; coordinat-
ing authors and editors (2015) The GLORIA field manual
– standard Multi-Summit approach, supplementary methods
and extra approaches, 5th edn. GLORIA-Coordination,
Austrian Academy of Sciences & University of Natural
Resources and Life Sciences, Vienna.
R Development Core Team (2015) R: A language and envi-
ronment for statistical computing. R Foundation for Statisti-
cal Computing, Vienna, Austria.
Scherrer, D. & K€orner, C. (2010) Infra-red thermometry of
alpine landscapes challenges climatic warming projections.
Global Change Biology, 16, 2602–2613.Schr€oter, C. (1926) Das Pflanzenleben der Alpen. Eine Schil-
derung der Hochgebirgsflora, 2nd edn. Raustein, Z€urich.
Stanisci, A., Pelino, G. & Blasi, C. (2005) Vascular plant
diversity and climate change in the alpine belt of the cen-
tral Apennines (Italy). Biodiversity and Conservation, 14,
1301–1318.
Theurillat, J.-P., Felber, F., Geissler, P., Gobat, J.-M., Fierz,
M., Fischlin, A., K€upfer, P., Schl€ussel, A., Velluti, C., Zhao,
G.-F. & Williams, J. (1998) Sensitivity of plant and soil
ecosystems of the Alps to climate change. Views from the
Alps: regional perspectives on climate change (ed. by P.
Cebon, U. Dahinden, C.H. Davies, D.M. Imboden and
C.C. Jaeger), pp. 225–308. The MIT Press, Cambridge,
MA.
Theurillat, J.-P., Schl€ussel, A., Geissler, P., Guisan, A., Velluti,
C. & Wiget, L. (2003) Vascular plant and bryophyte diver-
sity along elevation gradients in the Alps. Alpine biodiver-
sity in Europe – a Europe-wide assessment of biological
richness and change (ed. by L. Nagy, G. Grabherr, C.
K€orner and D.B.A. Thompson), pp. 185–193. Springer,
Berlin.
Theurillat, J.-P., Iocchi, M., Cutini, M. & De Marco, G.
(2011) Vascular plant richness along an elevation gradi-
ent at Monte Velino (Central Apennines, Italy). Bio-
geographia. Lavori della Societ�a Italiana di Biogeografia,
28, 149–166.Vittoz, P., Camenisch, M., Mayor, R., Miserere, L., Vust,
M. & Theurillat, J.-P. (2010) Subalpine-nival gradient of
species richness for vascular plants, bryophytes and
lichens in the Swiss Inner Alps. Botanica Helvetica, 120,
139–149.Whittaker, R.J., Nogu�es-Bravo, D. & Ara�ujo, M.B. (2007)
Geographical gradients of species richness: a test of the
water-energy conjecture of Hawkins et al. (2003) using
European data for five taxa. Global Ecology and Biogeogra-
phy, 16, 76–89.Willig, M.R., Kaufman, D.M. & Stevens, R.D. (2003) Latitu-
dinal gradients of biodiversity: pattern, process, scale, and
synthesis. Annual Review of Ecology Evolution and System-
atics, 34, 273–309.Wipf, S., St€ockli, V., Herz, K. & Rixen, C. (2013) The oldest
monitoring site of the Alps revisited: accelerated increase
in plant species richness on Piz Linard summit since 1835.
Plant Ecology and Diversity, 6, 447–455.Wright, D.H. (1983) Species-energy theory – an extension of
species-area theory. Oikos, 41, 496–506.
SUPPORTING INFORMATION
Additional Supporting Information may be found in the
online version of this article:
Appendix S1 Characteristics of summits in 32 European
mountain regions.
Appendix S2 Temperature sum thresholds and growing
season lengths.
Appendix S3 Gaps in soil temperature measurements.
Appendix S4 Species pool definition.
Appendix S5 Soil temperature sums among cardinal direc-
tions.
Appendix S6 Plant diversity among cardinal directions.
Appendix S7 Species colonization and disappearance
among cardinal directions.
Journal of Biogeography 43, 2261–2273ª 2016 John Wiley & Sons Ltd
2272
M. Winkler et al.
BIOSKETCH
The authors represent the European chapter of the international long-term monitoring network GLORIA (www.gloria.ac.at). The
network was established at the beginning of the century and currently comprises over 400 summit sites in more than 120 moun-
tain regions globally. The purpose of GLORIA is to detect short- and long-term impacts of climate change on biodiversity and
habitat stability in high mountain environments.
Author contributions: A.L., K.S., J.P.T., F.B., P.C., S.E., A.G.G., G.R., P.V., M.A., C.B., J.L.B., T.B., M.L.C., E.C., J.D., B.E.,
R.F.C., A.M.F., R.G.G., D.G., K.G., D.H., R.K., G.K., M.K., J.K., T.K., P.L., L.V., M.M., O.M., P.M., D.M., U.M., J.M.M., U.M.C.,
L.N., M.P., M.Pu., A.S., M.S., A.Sy., M.T., P.U., T.U., M.G. and H.P. provided the data; M.G., A.L., H.P. and M.W. prepared
the data; H.P., M.G., M.W. and L.N. designed the study; M.W. and K.H. ran the analyses; H.P., M.W. and K.H. wrote the first
draft of the manuscript; A.L., K.S., J.P.T., F.B., P.C., S.E., A.G.G., C.R., G.R., P.V. contributed to the interpretation of the results.
All authors contributed to the final version of the manuscript.
Editor: Jens-Christian Svenning
Journal of Biogeography 43, 2261–2273ª 2016 John Wiley & Sons Ltd
2273
Aspect preferences of alpine plants