EDISTO BEACH COASTAL STORM DAMAGE … STORM DAMAGE REDUCTION GENERAL INVESTIGATION STUDY . ......
34
EDISTO BEACH COASTAL STORM DAMAGE REDUCTION GENERAL INVESTIGATION STUDY APPENDIX L COST ENGINEERING
Transcript of EDISTO BEACH COASTAL STORM DAMAGE … STORM DAMAGE REDUCTION GENERAL INVESTIGATION STUDY . ......

EDISTO BEACH COASTAL STORM DAMAGE REDUCTION
GENERAL INVESTIGATION STUDY APPENDIX L
COST ENGINEERING

i
TABLE OF CONTENTS
L COST ESTIMATES ............................................................................................................. 1 L1. GENERAL INFORMATION ....................................................................................... 1
L1.1 Recommended Alternative Plan.. .............................................................................. 2
L1.2 Construction Cost...................................................................................................... 2 L1.3 Non-construction Cost .............................................................................................. 2
L1.4 Plan Formulation Cost Estimates.............................................................................. 3
L1.5 Construction Schedule .............................................................................................. 3 L1.6 Total Project Cost Summary ..................................................................................... 3
L2. RECOMMENDED PLAN (NED) COST ESTIMATE ............................................... 4 L3. RISK AND UNCERTAINTY ANALYSIS ................................................................. 7
L3.1 Risk Analysis Methods ........................................................................................... 7 L3.2 Risk Analysis Results ............................................................................................. 7
L4. TOTAL PROJECT COST SUMMARY .................................................................... 7
L4.1 Total Project Cost Summary Spreadsheet .............................................................. 7 L5. COST MCX TPCS CERTIFICATION ..................................................................... 13
ATTACHMENT TO APPENDIX L
ATTACHMENT A: PROJECT COST AND SCHEDULE RISK ANALYSIS REPORT

L COST ESTIMATES
L1. GENERAL INFORMATION Corps of Engineers cost estimates for planning purposes are prepared in accordance with the following guidance:
• Engineer Technical Letter (ETL) 1110-2-573, Construction Cost Estimating Guide for Civil Works, 30 September 2008
• Engineer Regulation (ER) 1110-1-1300, Cost Engineering Policy and General Requirements, 26 March 1993
• ER 1110-2-1302, Civil Works Cost Engineering, 15 September 2008 • ER 1110-2-1150, Engineering and Design for Civil Works Projects, 31 August 1999 • ER 1105-2-100, Planning Guidance Notebook, 22 April 2000, as amended • Engineer Manual (EM) 1110-2-1304 (Tables Revised 31 March 2009), Civil Works
Construction Cost Index System, 31 March 2000 • CECW-CP Memorandum for Distribution, Subject: Initiatives to Improve the Accuracy
of Total Project Costs in Civil Works Feasibility Studies Requiring Congressional Authorization, 19 September 2007
• CECW-CE Memorandum for Distribution, Subject: Application of Cost Risk Analysis Methods to Develop Contingencies for Civil Works Total Project Costs, 3 July 2007
• Cost and Schedule Risk Analysis Process, March 2008
The goal of the cost estimates for the Edisto Beach Shore Protection Feasibility Study are to present a Total Project Cost (Construction and Non-Construction costs) for the recommended plan at the current price level to be used for project justification/authorization and to escalate costs for budgeting purposes. In addition, the costing efforts are intended to produce a final product (cost estimate) that is reliable and accurate, and that supports the definition of the Government’s and the Non-Federal sponsor’s obligations. The recommended plan consists of creation of a storm protection berm and dune system which will be periodically re-nourished. In addition, dune vegetation will be planted and replaced, as needed, at the time of the scheduled re-nourishments. For the initial construction, several of the existing groins will be lengthened to preserve the amount of protection from erosion of the newly placed material as the existing groin field. The quantities of sand for the initial construction and for the periodic nourishments were derived using the Beach-FX Coastal Engineering modeling software. To generate costs for the dredging and placement of the material, it was assumed that a 30” hydraulic pipeline dredge would be utilized. This type of dredge was used due to the proximity of the borrow area to the beach where the material is to be placed. The groin lengthening was assumed to require 5 tons of jetty stone per linear foot of lengthening with filter fabric and bedding stone. The beach vegetation was assumed to require 30 acres of planting for initial construction and 15 acres of planting for each periodic nourishment cycle. The unknowns for this project include the timeframe for Congressional funding (if authorized), the ability of the sponsor to obtain easements, the quantity of material required when the project is constructed and the availability of adequate competition for an acceptable bidding climate. Due to the types of equipment required, the acquisition strategy was assumed to be full and open for large contractors.
The cost estimating effort for the study also yielded unit costs for dredging per cubic yard and mobilization/demobilization costs that were used within the Coastal Engineering modeling
L-1

L-2
program Beach-FX to compare a series of alternative plan formulations for decision making based upon net benefits. The final set of plan formulation cost estimates used for plan selection rely on construction feature unit pricing and are prepared in Civil Works Work Breakdown Structure (CWWBS) format to the sub-feature level. The cost estimate supporting the National Economic Development (NED) plan (Recommended Plan) is prepared in MCACES/MII format to the CWWBS sub-feature level. This estimate is supported by the preferred labor, equipment, materials and crew/production breakdown. A fully funded (escalated for inflation through project completion) cost estimate, the Baseline Cost Estimate or Total Project Cost Summary, has also been developed. A risk analysis was prepared that addresses project uncertainties and sets contingencies for the Recommended Alternative Plan’s cost items. The final Cost and Schedule Risk Analysis Report produced by Charleston District Cost Engineering is attached to this appendix.
L1.1 Recommended Alternative Plan The final Recommended Plan was chosen by the Project Delivery Team (PDT) according to Cost Effectiveness/Incremental Cost Analysis procedures and resulted directly from the plan formulation described above. The Economics Appendix fully describes the plan selection. The scope of work for the Recommended Plan consists of construction of a mid-size dune and berm fill along approximately 22,000 feet of the beach as shown in Table 5.7 of the main report. The initial construction consists of placement of 924,000 cubic yards of material. Periodic nourishments are calculated to occur every 16 years with a quantity of 475,000 cubic yards of material. In addition, groin lengthening is included at 23 locations for a total of 1,130 feet as outlined in Table 5.8 of the main report. Dune vegetation is also included along approximately 30 acres of the project area. The MCACES/MII cost estimate for the Recommended Alternative Plan (Section L.2, below) is based on that scope and is formatted in the CWWBS. The notes provided in the body of the estimate detail the estimate parameters and assumptions. The cost estimate includes pricing at the Fiscal Year 2014 price level (1 October 2013-30 September 2014). A detailed Cost and Schedule Risk Analysis (CSRA) was done to establish the contingency for the Recommended Plan. Non-construction costs were included as percentages of the total construction contract cost for this level of comparison and screening. For project justification purposes, the estimated costs are categorized under the appropriate CWWBS code and include both construction and non-construction costs.
The construction costs fall under the following feature codes:
• 10 Breakwaters and Seawalls • 17 Beach Replenishment
The non-construction costs fall under the following feature codes:
• 01 Lands and Damages • 30 Planning, Engineering and Design • 31 Construction Management
L1.2 Construction Cost Construction costs were developed in MCACES/MII and include all major project components categorized under the appropriate CWWBS to the sub-feature level. The Total Project Cost Summary (TPCS) on the final Recommended Plan contains contingencies as noted in the estimate (below) and were determined as a result of the risk analysis. Additional information follows on the risk analysis.
L1.3 Non-construction Cost Non-construction costs typically include Lands and Damages (Real Estate), Planning Engineering & Design (PED) and Construction Management Costs (Supervision & Administration, S&A). These costs were provided by the PDT either as a lump sum cost or as a
L-3
percentage of the total Construction Contract Cost. Lands and Damages are provided by Real Estate and are best described in the Real Estate Appendix, Appendix K. PED costs are for the preparation of contract plans and specifications (P&S) and include percentages of total construction costs, as well as percentages for Engineering During Construction (EDC) and Planning During Construction (PDC) that were provided by the Chief of Engineering. Construction Management costs are for the supervision and administration of a contract and include Project Management and Contract Admin costs. These costs were provided by the Chief of Construction and are included as a percentage of the total construction contract cost.
The main report details both cost allocation and cost apportionment for the Federal Government and the Non-Federal Sponsor. Also included in the main report are the Non- Federal Sponsor’s obligations (items of local cooperation). L1.4 Plan Formulation Cost Estimates For the plan formulation cost estimates, unit costs for dredging per cubic yard and mobilization/demobilization costs were developed in the Corps of Engineers Dredge Estimating Program (CEDEP) and used within the Coastal Engineering modeling program Beach-FX to compare a series of alternative plan formulations for decision making based upon net benefits. For the plan formulation estimates a contingency of 25% was assumed due to the preliminary nature of design. Unit prices for the remaining major construction elements were developed in MCACES/MII based on input from the PDT. Design details, information and assumptions were provided in the Engineering Appendix. A detailed Cost and Schedule Risk Analysis (CSRA) was done to establish the contingency for the Recommended Plan. Non-construction costs were included as percentages of the total construction contract cost for this level of comparison and screening.
Refer to Economics Section in the main report for final plan formulation cost tables.
L1.5 Construction Schedule Due to the relatively short durations for the initial construction (4 months) and periodic nourishment cycles (approximately 1 month), a detailed construction schedule was not prepared. However, utilizing input from the PDT, a preliminary schedule was assumed with initial construction to begin in 2018. A 16 year period was calculated between nourishment cycles by Coastal Engineering resulting in 3 cycles through the 50 year life of this project. Since a hydraulic pipeline dredge was assumed to be used for construction, the only environmental restriction is the requirement for sea turtle nest observers during the period from April through October. Costs were included for these observers in the cost estimate and therefore construction can take place anytime during the year. The preliminary project schedule was used for the generation of the Total Project Cost Summary (TPCS), as well as the schedule portion of the Cost and Schedule Risk Analysis (CSRA). The construction schedule will change as the project moves through the various project lifecycle phases.
L1.6 Total Project Cost Summary The cost estimate for the Recommended Plan is prepared with an identified price level date and inflation factors are used to adjust the pricing to the project schedule. This estimate is known as the Fully Funded Cost Estimate or Total Project Cost Summary. It includes all Federal and Non-Federal costs: Lands, Easements, Rights of Way and Relocations; construction features; Preconstruction Engineering and Design; Construction Management; Contingency; and Inflation.

L-4
L2. RECOMMENDED PLAN (NED) COST ESTIMATE Refer to MII Printout on the next page. During preparation of cost estimates for alternative methods of construction, it was determined that due to the proximity of the borrow area to the placement area; an ocean certified hydraulic pipeline would be more economical than a medium sized hopper dredge. Therefore, the costs shown in the estimate are based upon using a 30” hydraulic pipeline dredge for sand placement on the beach. The checklists for the Corps of Engineers Dredge Estimating Program (CEDEP) for the initial construction and the periodic nourishment cycles is also included after the MII printout to show the derivation of the dredging costs in the MII estimate.

Print Date Fri 13 December 2013 U.S. Army Corps of Engineers - Charleston District Time 06:42:56Eff. Date 12/10/2013 Project : Edisto Beach First Cost Total 12-10-13
Official Government Cost Estimate Title Page
Labor ID: NLS2012 EQ ID: EP11R03 Currency in US dollars TRACES MII Version 4.2
*****FOR OFFICIAL USE ONLY. DO NOT RELEASE OUTSIDE THE GOVERNEMENT.*****
This report is not copyrighted, but the information contained herein is For Official Use Only.
Estimated Construction Time 120 DaysEffective Date of Pricing 12/10/2013
Preparation Date 12/10/2013
Prepared by Jeffery Fersner
Estimated by CESACDesigned by CESAC
Edisto Beach First Cost Total 12-10-13Edisto Beach, one of the barrier islands on the coast of South Carolina, is located in Colleton County, approximately 45 miles southwest of Charleston, South Carolina.
The US Army Corps of Engineers is studying the creation of a Federal Project to provide shoreline protection to Edisto Beach. This project consists of initial lengthening of existing groins and beach nourishment to Edisto Beach to maintain an adequate level of storm protection for the residents and businesses located on Edisto Beach.
The calculations for the dredging portion of this project is imported from the Corps of Engineers Dredge Estimating Program (CEDEP).
This estimate contains no contingency or escalation. These items are added in the Total Project Cost Summary. The contingencies in the TPCS were developed during Cost & Schedule Risk Analysis (CSRA).
Escalation is calculated inside the TPCS used the tables developed in the latest version distributed by the Cost MCX at Walla Walla District.
K2TSEJWF
Typewritten Text
L-5

Print Date Fri 13 December 2013 U.S. Army Corps of Engineers - Charleston District Time 06:42:56Eff. Date 12/10/2013 Project : Edisto Beach First Cost Total 12-10-13
Official Government Cost Estimate Project Owner Summary Page 1
Description UOM Quantity ProjectCost
Project Owner Summary 42,150,710.69
Initial Construction LS 1.00 16,769,480.86
01 Lands and Damages LS 1.00 785,400.00
10 Breakwaters and Seawalls LS 1.00 2,119,616.09
17 Beach Replenishment LS 1.00 12,830,464.77
30 Planning, Engineering and Design LS 1.00 839,000.00
31 Construction Management LS 1.00 195,000.00
First Nourishment Construction LS 1.00 8,460,409.94
17 Beach Replenishment LS 1.00 7,911,409.94
30 Planning, Engineering and Design LS 1.00 446,000.00
31 Construction Management LS 1.00 103,000.00
Second Nourishment Construction LS 1.00 8,460,409.94
17 Beach Replenishment LS 1.00 7,911,409.94
30 Planning, Engineering and Design LS 1.00 446,000.00
31 Construction Management LS 1.00 103,000.00
Third Nourishment Construction LS 1.00 8,460,409.94
17 Beach Replenishment LS 1.00 7,911,409.94
30 Planning, Engineering and Design LS 1.00 446,000.00
31 Construction Management LS 1.00 103,000.00
Labor ID: NLS2012 EQ ID: EP11R03 Currency in US dollars TRACES MII Version 4.2
K2TSEJWF
Typewritten Text
L-6

L3. RISK AND UNCERTAINTY ANALYSIS A Cost and Schedule Risk Analysis was conducted according to the procedures outlined in the manual entitled, “Cost and Schedule Risk Analysis Process” dated March 2008.
L3.1 Risk Analysis Methods The entire PDT participated in a cost and schedule risk analysis brainstorming session to identify risks associated with the recommended plan. The risks were listed in the risk register and evaluated by the PDT. Assumptions were made as to the likelihood and impact of each risk item, as well as the probability of occurrence and magnitude of the impact if it were to occur. A risk model was then developed in Crystal Ball in order to develop a contingency to apply to the project cost and schedule. After the model was run, the results were reviewed and all parameters were re-evaluated by the PDT as a sanity check of assumptions and inputs. Adjustments were made to the analysis accordingly and the final contingency was established. The contingency was applied to the recommended plan estimate in the Total Project Cost Summary in order to obtain the Fully Funded Cost.
L3.2 Risk Analysis Results Refer to the Project Cost and Schedule Risk Analysis Report provided by Charleston District Cost Engineering as an attachment to this appendix.
L4. TOTAL PROJECT COST SUMMARY The Total Project Cost Summary (TPCS) addresses inflation through project completion (accomplished by escalation to mid-point of construction for each phase of this project (initial construction and three nourishment cycles) per ER 1110-2-1302, Appendix C, Page C-2). It is based on the scope of the Recommended Plan and the official project schedule. The TPCS includes Federal and Non-Federal costs for Lands and Damages, all construction features, PED, S&A, along with the appropriate contingencies and escalation associated with each of these activities. The TPCS is formatted according to the WBS and uses Civil Works Construction Cost Indexing System factors for escalation (EM 1110-2-1304) of construction costs and Office of Management and Budget (EC 11-2-18X, 20 Feb 2008) factors for escalation of PED and S&A costs.
The Total Project Cost Summary was prepared using the MCACES/MII cost estimate on the Recommended Plan, as well as the contingency set by the risk analysis and the official project schedule.
L4.1 Total Project Cost Summary Spreadsheet Refer to the Total Project Cost Summary Spreadsheet on the next page.
L-7

K2TSEJWF
Typewritten Text
L-8
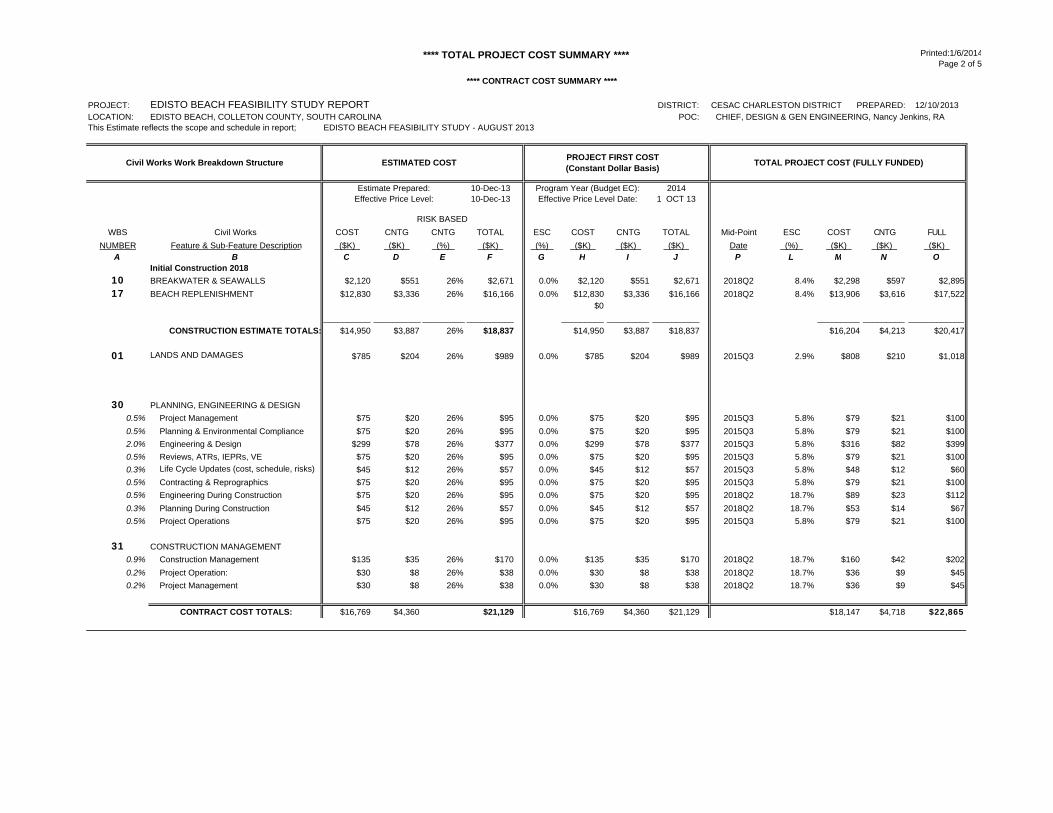
**** TOTAL PROJECT COST SUMMARY **** Printed:1/6/2014Page 2 of 5
**** CONTRACT COST SUMMARY ****
PROJECT: DISTRICT: CESAC CHARLESTON DISTRICT PREPARED: 12/10/2013LOCATION: EDISTO BEACH, COLLETON COUNTY, SOUTH CAROLINA POC: CHIEF, DESIGN & GEN ENGINEERING, Nancy Jenkins, RAThis Estimate reflects the scope and schedule in report; EDISTO BEACH FEASIBILITY STUDY - AUGUST 2013
10-Dec-13 2014 10-Dec-13 1 OCT 13
RISK BASED WBS Civil Works COST CNTG CNTG TOTAL ESC COST CNTG TOTAL Mid-Point ESC COST CNTG FULL
NUMBER Feature & Sub-Feature Description ($K) ($K) (%) ($K) (%) ($K) ($K) ($K) Date (%) ($K) ($K) ($K) A B C D E F G H I J P L M N O
Initial Construction 201810 BREAKWATER & SEAWALLS $2,120 $551 26% $2,671 0.0% $2,120 $551 $2,671 2018Q2 8.4% $2,298 $597 $2,895
17 BEACH REPLENISHMENT $12,830 $3,336 26% $16,166 0.0% $12,830 $3,336 $16,166 2018Q2 8.4% $13,906 $3,616 $17,522 $0
__________ __________ _________ __________ _________ _________ __________ _________ _________ ____________CONSTRUCTION ESTIMATE TOTALS: $14,950 $3,887 26% $18,837 $14,950 $3,887 $18,837 $16,204 $4,213 $20,417
01 LANDS AND DAMAGES $785 $204 26% $989 0.0% $785 $204 $989 2015Q3 2.9% $808 $210 $1,018
30 PLANNING, ENGINEERING & DESIGN0.5% Project Management $75 $20 26% $95 0.0% $75 $20 $95 2015Q3 5.8% $79 $21 $100
0.5% Planning & Environmental Compliance $75 $20 26% $95 0.0% $75 $20 $95 2015Q3 5.8% $79 $21 $1002.0% Engineering & Design $299 $78 26% $377 0.0% $299 $78 $377 2015Q3 5.8% $316 $82 $3990.5% Reviews, ATRs, IEPRs, VE $75 $20 26% $95 0.0% $75 $20 $95 2015Q3 5.8% $79 $21 $1000.3% Life Cycle Updates (cost, schedule, risks) $45 $12 26% $57 0.0% $45 $12 $57 2015Q3 5.8% $48 $12 $600.5% Contracting & Reprographics $75 $20 26% $95 0.0% $75 $20 $95 2015Q3 5.8% $79 $21 $1000.5% Engineering During Construction $75 $20 26% $95 0.0% $75 $20 $95 2018Q2 18.7% $89 $23 $112
0.3% Planning During Construction $45 $12 26% $57 0.0% $45 $12 $57 2018Q2 18.7% $53 $14 $670.5% Project Operations $75 $20 26% $95 0.0% $75 $20 $95 2015Q3 5.8% $79 $21 $100
31 CONSTRUCTION MANAGEMENT0.9% Construction Management $135 $35 26% $170 0.0% $135 $35 $170 2018Q2 18.7% $160 $42 $202
0.2% Project Operation: $30 $8 26% $38 0.0% $30 $8 $38 2018Q2 18.7% $36 $9 $450.2% Project Management $30 $8 26% $38 0.0% $30 $8 $38 2018Q2 18.7% $36 $9 $45
CONTRACT COST TOTALS: $16,769 $4,360 $21,129 $16,769 $4,360 $21,129 $18,147 $4,718 $22,865
ESTIMATED COST PROJECT FIRST COST(Constant Dollar Basis) TOTAL PROJECT COST (FULLY FUNDED)Civil Works Work Breakdown Structure
Estimate Prepared:Effective Price Level:
Program Year (Budget EC):Effective Price Level Date:
EDISTO BEACH FEASIBILITY STUDY REPORT
K2TSEJWF
Typewritten Text
L-9

**** TOTAL PROJECT COST SUMMARY **** Printed:1/6/2014Page 3 of 5
**** CONTRACT COST SUMMARY ****
PROJECT: DISTRICT: CESAC CHARLESTON DISTRICT PREPARED: 12/10/2013LOCATION: EDISTO BEACH, COLLETON COUNTY, SOUTH CAROLINA POC: CHIEF, DESIGN & GEN ENGINEERING, Nancy Jenkins, RAThis Estimate reflects the scope and schedule in report; EDISTO BEACH FEASIBILITY STUDY - AUGUST 2013
10-Dec-13 2014 10-Dec-13 1 OCT 13
WBS Civil Works COST CNTG CNTG TOTAL ESC COST CNTG TOTAL Mid-Point ESC COST CNTG FULL
NUMBER Feature & Sub-Feature Description ($K) ($K) (%) ($K) (%) ($K) ($K) ($K) Date (%) ($K) ($K) ($K) A B C D E F G H I J P L M N O
1st Nourishment 203410 BREAKWATER & SEAWALLS $0 $0 0% $0 0.0% $0 $0 $0 0 0.0% $0 $0 $0
17 BEACH REPLENISHMENT $7,911 $2,294 29% $10,206 0.0% $7,911 $2,294 $10,206 2034Q2 46.5% $11,588 $3,361 $14,949 $0
__________ __________ _________ __________ _________ _________ __________ _________ _________ ____________CONSTRUCTION ESTIMATE TOTALS: $7,911 $2,294 29% $10,206 $7,911 $2,294 $10,206 $11,588 $3,361 $14,949
01 LANDS AND DAMAGES $0 $0 0% $0 0.0% $0 $0 $0 0 0.0% $0 $0 $0
30 PLANNING, ENGINEERING & DESIGN0.5% Project Management $40 $12 29% $52 0.0% $40 $12 $52 2033Q2 138.0% $95 $28 $123
0.5% Planning & Environmental Compliance $40 $12 29% $52 0.0% $40 $12 $52 2033Q2 138.0% $95 $28 $1232.0% Engineering & Design $158 $46 29% $204 0.0% $158 $46 $204 2033Q2 138.0% $376 $109 $4850.5% Reviews, ATRs, IEPRs, VE $40 $12 29% $52 0.0% $40 $12 $52 2033Q2 138.0% $95 $28 $1230.3% Life Cycle Updates (cost, schedule, risks) $24 $7 29% $31 0.0% $24 $7 $31 2033Q2 138.0% $57 $17 $740.5% Contracting & Reprographics $40 $12 29% $52 0.0% $40 $12 $52 2033Q2 138.0% $95 $28 $1230.5% Engineering During Construction $40 $12 29% $52 0.0% $40 $12 $52 2034Q2 151.0% $100 $29 $130
0.3% Planning During Construction $24 $7 29% $31 0.0% $24 $7 $31 2034Q2 151.0% $60 $17 $780.5% Project Operations $40 $12 29% $52 0.0% $40 $12 $52 2033Q2 138.0% $95 $28 $123
31 CONSTRUCTION MANAGEMENT0.9% Construction Management $71 $21 29% $92 0.0% $71 $21 $92 2034Q2 151.0% $178 $52 $230
0.2% Project Operation: $16 $5 29% $21 0.0% $16 $5 $21 2034Q2 151.0% $40 $12 $520.2% Project Management $16 $5 29% $21 0.0% $16 $5 $21 2034Q2 151.0% $40 $12 $52
CONTRACT COST TOTALS: $8,460 $2,454 $10,914 $8,460 $2,454 $10,914 $12,917 $3,746 $16,662
ESTIMATED COST PROJECT FIRST COST(Constant Dollar Basis) TOTAL PROJECT COST (FULLY FUNDED)Civil Works Work Breakdown Structure
Estimate Prepared: Program Year (Budget EC):Effective Price Level: Effective Price Level Date:
EDISTO BEACH FEASIBILITY STUDY REPORT
K2TSEJWF
Typewritten Text
L-10

**** TOTAL PROJECT COST SUMMARY **** Printed:1/6/2014Page 4 of 5
**** CONTRACT COST SUMMARY ****
PROJECT: DISTRICT: CESAC CHARLESTON DISTRICT PREPARED: 12/10/2013LOCATION: EDISTO BEACH, COLLETON COUNTY, SOUTH CAROLINA POC: CHIEF, DESIGN & GEN ENGINEERING, Nancy Jenkins, RAThis Estimate reflects the scope and schedule in report; EDISTO BEACH FEASIBILITY STUDY - AUGUST 2013
10-Dec-13 2014 10-Dec-13 1 OCT 13
WBS Civil Works COST CNTG CNTG TOTAL ESC COST CNTG TOTAL Mid-Point ESC COST CNTG FULL
NUMBER Feature & Sub-Feature Description ($K) ($K) (%) ($K) (%) ($K) ($K) ($K) Date (%) ($K) ($K) ($K) A B C D E F G H I J P L M N O
2nd Nourishment Cycle 205010 BREAKWATER & SEAWALLS $0 $0 0% $0 0.0% $0 $0 $0 0 0.0% $0 $0 $0
17 BEACH REPLENISHMENT $7,911 $2,294 29% $10,206 0.0% $7,911 $2,294 $10,206 2050Q2 98.0% $15,661 $4,542 $20,202 $0
__________ __________ _________ __________ _________ _________ __________ _________ _________ ____________CONSTRUCTION ESTIMATE TOTALS: $7,911 $2,294 29% $10,206 $7,911 $2,294 $10,206 $15,661 $4,542 $20,202
01 LANDS AND DAMAGES $0 $0 0% $0 0.0% $0 $0 $0 0 0.0% $0 $0 $0
30 PLANNING, ENGINEERING & DESIGN0.5% Project Management $40 $12 29% $52 0.0% $40 $12 $52 2049Q3 468.2% $227 $66 $293
0.5% Planning & Environmental Compliance $40 $12 29% $52 0.0% $40 $12 $52 2049Q3 468.2% $227 $66 $2932.0% Engineering & Design $158 $46 29% $204 0.0% $158 $46 $204 2049Q3 468.2% $898 $260 $1,1580.5% Reviews, ATRs, IEPRs, VE $40 $12 29% $52 0.0% $40 $12 $52 2049Q3 468.2% $227 $66 $2930.3% Life Cycle Updates (cost, schedule, risks) $24 $7 29% $31 0.0% $24 $7 $31 2049Q3 468.2% $136 $40 $1760.5% Contracting & Reprographics $40 $12 29% $52 0.0% $40 $12 $52 2049Q3 468.2% $227 $66 $2930.5% Engineering During Construction $40 $12 29% $52 0.0% $40 $12 $52 2050Q2 491.3% $237 $69 $305
0.3% Planning During Construction $24 $7 29% $31 0.0% $24 $7 $31 2050Q2 491.3% $142 $41 $1830.5% Project Operations $40 $12 29% $52 0.0% $40 $12 $52 2049Q3 468.2% $227 $66 $293
31 CONSTRUCTION MANAGEMENT0.9% Construction Management $71 $21 29% $92 0.0% $71 $21 $92 2050Q2 491.3% $420 $122 $542
0.2% Project Operation: $16 $5 29% $21 0.0% $16 $5 $21 2050Q2 491.3% $95 $27 $1220.2% Project Management $16 $5 29% $21 0.0% $16 $5 $21 2050Q2 491.3% $95 $27 $122
CONTRACT COST TOTALS: $8,460 $2,454 $10,914 $8,460 $2,454 $10,914 $18,819 $5,457 $24,276
Estimate Prepared: Program Year (Budget EC):Effective Price Level: Effective Price Level Date:
ESTIMATED COST PROJECT FIRST COST(Constant Dollar Basis) TOTAL PROJECT COST (FULLY FUNDED)
EDISTO BEACH FEASIBILITY STUDY REPORT
Civil Works Work Breakdown Structure
K2TSEJWF
Typewritten Text
L-11

**** TOTAL PROJECT COST SUMMARY **** Printed:1/6/2014Page 5 of 5
**** CONTRACT COST SUMMARY ****
PROJECT: EDISTO BEACH FEASIBILITY STUDY REPORT DISTRICT: CESAC CHARLESTON DISTRICT PREPARED: 12/10/2013LOCATION: EDISTO BEACH, COLLETON COUNTY, SOUTH CAROLINA POC: CHIEF, DESIGN & GEN ENGINEERING, Nancy Jenkins, RAThis Estimate reflects the scope and schedule in report; EDISTO BEACH FEASIBILITY STUDY - AUGUST 2013
10-Dec-13 Program Year (Budget EC): 2014 10-Dec-13 Effective Price Level Date: 1 OCT 13 FULLY FUNDED PROJECT ESTIMATE
WBS Civil Works COST CNTG CNTG TOTAL ESC COST CNTG TOTAL Mid-Point ESC COST CNTG FULL
NUMBER Feature & Sub-Feature Description ($K) ($K) (%) ($K) (%) ($K) ($K) ($K) Date (%) ($K) ($K) ($K) A B C D E F G H I J P L M N O
3rd Nourishment Cycle 206610 BREAKWATER & SEAWALLS $0 $0 0% $0 0.0% $0 $0 $0 0 0.0% $0 $0 $0
17 BEACH REPLENISHMENT $7,911 $2,294 29% $10,206 0.0% $7,911 $2,294 $10,206 2066Q2 167.5% $21,164 $6,138 $27,302 $0
__________ __________ _________ __________ _________ _________ __________ _________ _________ ____________CONSTRUCTION ESTIMATE TOTALS: $7,911 $2,294 29% $10,206 $7,911 $2,294 $10,206 $21,164 $6,138 $27,302
01 LANDS AND DAMAGES $0 $0 0% $0 0.0% $0 $0 $0 0 0.0% $0 $0 $0
30 PLANNING, ENGINEERING & DESIGN0.5% Project Management $40 $12 29% $52 0.0% $40 $12 $52 2065Q3 1238.2% $535 $155 $690
0.5% Planning & Environmental Compliance $40 $12 29% $52 0.0% $40 $12 $52 2065Q3 1238.2% $535 $155 $6902.0% Engineering & Design $158 $46 29% $204 0.0% $158 $46 $204 2065Q3 1238.2% $2,114 $613 $2,7270.5% Reviews, ATRs, IEPRs, VE $40 $12 29% $52 0.0% $40 $12 $52 2065Q3 1238.2% $535 $155 $6900.3% Life Cycle Updates (cost, schedule, risks) $24 $7 29% $31 0.0% $24 $7 $31 2065Q3 1238.2% $321 $93 $4140.5% Contracting & Reprographics $40 $12 29% $52 0.0% $40 $12 $52 2065Q3 1238.2% $535 $155 $6900.5% Engineering During Construction $40 $12 29% $52 0.0% $40 $12 $52 2066Q2 1292.6% $557 $162 $719
0.3% Planning During Construction $24 $7 29% $31 0.0% $24 $7 $31 2066Q2 1292.6% $334 $97 $4310.5% Project Operations $40 $12 29% $52 0.0% $40 $12 $52 2065Q3 1238.2% $535 $155 $690
31 CONSTRUCTION MANAGEMENT0.9% Construction Management $71 $21 29% $92 0.0% $71 $21 $92 2066Q2 1292.6% $989 $287 $1,276
0.2% Project Operation: $16 $5 29% $21 0.0% $16 $5 $21 2066Q2 1292.6% $223 $65 $2870.2% Project Management $16 $5 29% $21 0.0% $16 $5 $21 2066Q2 1292.6% $223 $65 $287
CONTRACT COST TOTALS: $8,460 $2,454 $10,914 $8,460 $2,454 $10,914 $28,601 $8,294 $36,896
TOTAL PROJECT COST (FULLY FUNDED)
Estimate Prepared:Effective Price Level:
Civil Works Work Breakdown Structure ESTIMATED COST PROJECT FIRST COST(Constant Dollar Basis)
K2TSEJWF
Typewritten Text
L-12
L5. COST MCX TPCS CERTIFICATION The Recommended Plan estimate as well as the Cost and Schedule Risk Analysis and Total Project Cost Summary underwent Cost Review and Certification by the Walla Walla Mandatory Center of Expertise following the final ATR. The certification is attached on the next page.
L-13

WALLA WALLA COST ENGINEERING MANDATORY CENTER OF EXPERTISE
COST AGENCY TECHNICAL REVIEW
CERTIFICATION STATEMENT
For Project No. 113475
SAC - Edisto Island Storm Damage Reduction
The Edisto Island Storm Damage Reduction project as presented by Charleston District, has undergone a successful Cost Agency Technical Review (Cost ATR), performed by the Walla Walla District Cost Engineering Mandatory Center of Expertise (Cost MCX) team. The Cost ATR included study of the project scope, report, cost estimates, schedules, escalation, and risk-based contingencies. This certification signifies the products meet the quality standards as prescribed in ER 1110-2-1150 Engineering and Design for Civil Works Projects and ER 1110-2-1302 Civil Works Cost Engineering.
As of December 17, 2013, the Cost MCX certifies the estimated total project cost:
FY 2014 Project First Cost: $53,871,000 (Including 3 Nourishments) FY 2014 Initial Construction First Cost: $21,129,000 Fully Funded Amount: $100,699,000
It remains the responsibility of the District to correctly reflect these cost values within the Final Report and to implement effective project management controls and implementation procedures including risk management throughout the life of the project.
Kim C. Callan, PE, CCE, PM Chief, Cost Engineering MCX Walla Walla District
CALLAN.KIM.C.1231558221 2013.12.17 15:58:50 -08'00'
K2TSEJWF
Typewritten Text
L-14
Attachment A
EDISTO BEACH, COLLETON COUNTY, SOUTH CAROLINA COASTAL STORM DAMAGE REDUCTION FEASABILITY
REPORT RISK ANALYSIS
Prepared by: U.S. Army Corps of Engineers, Charleston District
Date: December 10, 2013

Attachment A
ii
TABLE OF CONTENTS
EXECUTIVE SUMMARY ......................................................................................................................... 1
Report Purpose ....................................................................................................................................... 1
Project Scope .......................................................................................................................................... 1
Risk Analysis Results ............................................................................................................................... 1
High Risk Items, Cost .............................................................................................................................. 1
Mitigation Recommendations ................................................................................................................ 2
Total Project Cost Summary ................................................................................................................... 2
PURPOSE/BACKGROUND ..................................................................................................................... 3
REPORT SCOPE ..................................................................................................................................... 4
Project Scope .......................................................................................................................................... 4
USACE Risk Analysis Process ................................................................................................................... 4
METHODOLOGY/PROCESS ................................................................................................................... 5
Identify and Assess Risk Factors ............................................................................................................. 6
Quantify Risk Factor Impacts .................................................................................................................. 6
Analyze Cost Estimate and Schedule Contingency ................................................................................. 7
KEY CONSIDERATIONS AND ASSUMPTIONS ........................................................................................... 7
RISK ANALYSIS RESULTS ....................................................................................................................... 7
Risk Register ........................................................................................................................................... 7
Cost Risk Analysis - Cost Contingency Results ........................................................................................ 9
LIST OF TABLES
Table 1 - Project Cost Summary ................................................................................................................... 3
Table 2 - Risk Register (Abridged) ................................................................................................................. 9
Table 3 – Contingency Analysis Results ...................................................................................................... 11
APPENDIX
APPENDIX A – Detailed Risk Register .......................................................................................................... 13

Attachment A
1
EXECUTIVE SUMMARY
Report Purpose The US Army Corps of Engineers (USACE), Charleston District, presents this cost and schedule risk analysis (CSRA) report for the Edisto Beach Coastal Storm Damage Reduction Feasibility Report. In compliance with Engineer Regulation (ER) 1110-2-1302 CIVIL WORKS COST ENGINEERING, dated September 15, 2008, a formal risk analysis, Monte-Carlo based-study was conducted by the Project Development Team (PDT) on the first cost as well as the periodic renourishment costs of the project. The purpose of this risk analysis study is to present the cost and schedule risks considered, those determined and respective project contingencies at a recommend 80% confidence level of successful execution to project completion.
Project Scope The project area is located on Edisto Beach, a barrier island on South Carolina’s coast in Colleton County. The entire island is approximately 7 miles in length. However, due to lack of any significant structures on the northern section, the project area consists of approximately 4 mile section of Edisto Beach. The plan calls for an initial placement of 924,000 cubic yards of material and a periodic nourishment of 475,000 cubic yards every sixteen years for the project life (3 total nourishments). Material for the project is to be dredged from an offshore location. The base costs used in the Cost and Schedule Risk Analysis (CSRA) were generated in the Micro-computer Aided Cost Estimating System Rev 2 - MCACES (MII) software with the dredging costs generated in the Corps of Engineers Dredge Estimating Program (CEDEP).
Risk Analysis Results A Cost and Schedule Risk Analysis (CSRA) update was performed on August 7, 2013 on this project to identify the 80% confidence level contingencies for the initial construction and renourishments. The study was performed on the Federal NED plan. The contingencies considered both cost and schedule with the schedule risk being converted to an additional cost risk. The results are that the examination of the of the risks for the first cost result in a 26% contingency at the 80% confidence level and the renourishments risk result in a slightly higher 29% contingency at the 80% level. These contingencies are applied to the remaining project activities such as Lands and Damages, Design and Construction Management as applicable. The following results were observed based on the MCACES Cost Estimate:
Construction Results Contingency Amount ($k) Contingency %
Initial Construction $3,887 26%
Periodic Renourishments $6,882 29%
High Risk Items The following were high risk items affecting cost. The complete risk register and analysis can be viewed in Appendix A.
• Market Conditions
Discussion: Dredging is a highly competitive industry and there are limited windows when dredging can be performed in this area. The PDT has planned to allow multiple types of dredges to be considered to increase competition for this project.

Attachment A
2
• Dredge size
Discussion: The choice of dredge size can affect efficiency and productivity, causing a difference between the government estimate and the bid price of the contract. The estimate assumed a 30” hydraulic pipeline dredge will be utilized, but the actual equipment is not restrictive within the proposed contract. The only restriction is the fact that the borrow area is outside the line of demarcation which requires an ocean certified dredge to be used.
• Contract Modifications/Claims:
Discussion- Contract modifications are always a risk in dredging. This work has a preferred window for construction and any environmental impacts in the region could potentially stop or delay the work that season resulting in remobilization costs.
• Other risks- Fuel, Quantities, and Borrow assumptions
Discussion- With dredging work the price of fuel is a significant cost and is usually a high risk factor along with the quantities and borrow assumptions. The quantity of material required to be placed is uncertain and can be affected by increases in erosion due to more frequent storm events. In addition, due to the time period between the feasibility study and initial construction, the expected quantity could change dramatically. Overall this is a relatively straightforward project and many of the risks are typical of similar projects.
Mitigation Recommendations
A positive outcome of the CSRA was a thorough discussion of the risks and their mitigation measures. PDT members worked through each risk item and how the risks would affect the overall project. Most could not be mitigated such as adverse weather and funding issues
Major recommendations are as follows for high risk items:
• Modifications/Claims during Project Construction Execution – Research into specific risk events which cause modification or claim during previous construction periods. From previous similar beach nourishment projects such as Folly Beach and Myrtle Beach, modifications normally average between 3% and 6% of the construction cost. Identify potential risk mitigation efforts from results.
• For the periodic renourishments, the quantities of material to be placed should be evaluated each year to ensure that the planned quantities are sufficient to maintain the level of protection required as the project progresses.
Total Project Cost Summary The following table portrays the first cost of the initial construction and the 6 periodic nourishments features based on the anticipated contracts. The costs are intended to address the necessary costs at authorization of the project. Costs are in thousands of dollars. The contingency is based on an 80% confidence level, as per USACE Civil Works guidance. First Costs are in FY14 dollars.

Attachment A
3
Table 1 - Project First Cost Summary
INITIAL CONSTRUCTION FIRST COSTS (FY14) FULLY FUNDED COSTS
ACCT DESCRIPTION COST
($k) CONTG
($k) TOTALS
($k) COST
($k) CONTG
($k) TOTALS
($k)
1 Lands & Damages $789 $205 $994 $808 $210 $1,018
17 Beach Replenishment $12,890 $3,351 $16,241 $13,906 $3,616 $17,522
10 Breakwaters & Seawalls $2,130 $554 $2,684 $2,298 $597 $2,895
Construction Costs $15,809 $4,110 $19,919
$17,012 $4,423 $21,435
30
Planning, Engineering & Design $843 $219 $1,062 $870 $226 $1,096
31 Supervision & Administration $196 $51 $247 $211 $55 $266
Summary 30 & 31 Account $1,039 $270 $1,309
$1,081 $281 $1,362 Total $16,848 $4,380 $21,228
$18,093 $4,704 $22,797
Renourishment First Cost
RENORISHMENT FULLY FUNDED COST
ACCT DESCRIPTION COST
($k)
CONTG
($k) TOTALS
($k)
COST ($k)
CONTG ($k)
TOTALS ($k)
17 Beach Replenishment $23,847 $6,916 $30,763
$48,413 $14,040 $62,453
Non-construction Costs
$48,413 $14,040 $62,453
30
Planning, Engineering & Design $1,344 $390 $1,734
$2,693 $781 $3,474
31 Supervision & Administration $309 $90 $399
$630 $183 $813
Summary 30 & 31 Account $1,653 $479 $2,132
$3,323 $964 $4,287 Total O&M Cost $25,500 $7,305 $32,895
$51,736 $15,003 $66,739
Total Initial plus O&M Cost $42,348 $11,775 $54,123
$69,829 $19,707 $89,536
PURPOSE/BACKGROUND
The US Army Corps of Engineers (USACE), Charleston District, presents this cost and schedule risk analysis (CSRA) report for the Edisto Beach Coastal Storm Damage Reduction Feasibility Report. In compliance with Engineer Regulation (ER) 1110-2-1302 CIVIL WORKS COST ENGINEERING, dated September 15, 2008, a formal risk analysis, Monte-Carlo based-study was conducted by the Project Development Team (PDT) on the costs to implement the selected alternative. The purpose of this risk analysis study is to present the cost and schedule risks considered, those determined and respective project contingencies at a recommend 80% confidence level of successful execution to project completion.

Attachment A
4
REPORT SCOPE The scope of the risk analysis report is to calculate and present the cost and schedule contingencies at the 80 percent confidence level using the risk analysis processes as mandated by U.S. Army Corps of Engineers (USACE) Engineer Regulation (ER) 1110-2-1150, Engineering and Design for Civil Works, ER 1110-2-1302, Civil Works Cost Engineering, and Engineer Technical Letter 1110-2-573, Construction Cost Estimating Guide for Civil Works. The report presents the contingency results for both the initial construction cost and the periodic nourishments risks for all project features. The project schedule was examined and schedule risks for the initial construction are only considered as the schedule risks for the long term nourishments are primarily limited by the funding received and are beyond the team to influence. The schedule risk for the initial construction is generally minor and is converted to costs and added to the cost risk model. It is assumed that after the initial construction is complete that the project would receive the necessary funding to complete future nourishment of the beach segments. The study and presentation can include or exclude consideration for operation and maintenance or life cycle costs, depending upon the program or decision document intended for funding.
Project Scope Major Project Features studied from the civil works work breakdown structure (CWWBS) for this project includes:
01 – Lands & Damages
10 – Breakwaters & Seawalls
17 – Beach Replenishment
30 - Planning, Engineering & Design
31 - Construction Management
USACE Risk Analysis Process The risk analysis process follows the USACE Headquarters requirements as well as the guidance provided by the Cost Engineering Directory of Expertise for Civil Works (Cost Engineering MCX). The risk analysis process reflected within the risk analysis report uses probabilistic cost and schedule risk analysis methods within the framework of the Crystal Ball software. The risk analysis results are intended to serve several functions, one being the establishment of reasonable contingencies reflective of an 80 percent confidence level to successfully accomplish the project work within that established contingency amount. Furthermore, the scope of the report includes the identification and communication of important steps, logic, key assumptions, limitations, and decisions to help ensure that risk analysis results can be appropriately interpreted. The risk study utilizes the MCACES cost estimate amount for all features then applies the resultant percentage of risk/contingency to the project first and fully funded costs.
Risk analysis results are also intended to provide project leadership with contingency information for scheduling, budgeting, and project control purposes, as well as provide tools to support decision making and risk management as the project progresses through planning and implementation. To fully recognize its benefits, cost and schedule risk analyses should be considered as an ongoing process conducted concurrent to, and iteratively with, other important project processes such as scope and execution plan development, resource planning, procurement planning, cost estimating, budgeting, and scheduling.
In addition to broadly defined risk analysis standards and recommended practices, the risk analysis is performed to meet the requirements and recommendations of the following documents and sources:
• ER 1110-2-1150, Engineering and Design for Civil Works Projects.
• ER 1110-2-1302, Civil Works Cost Engineering.
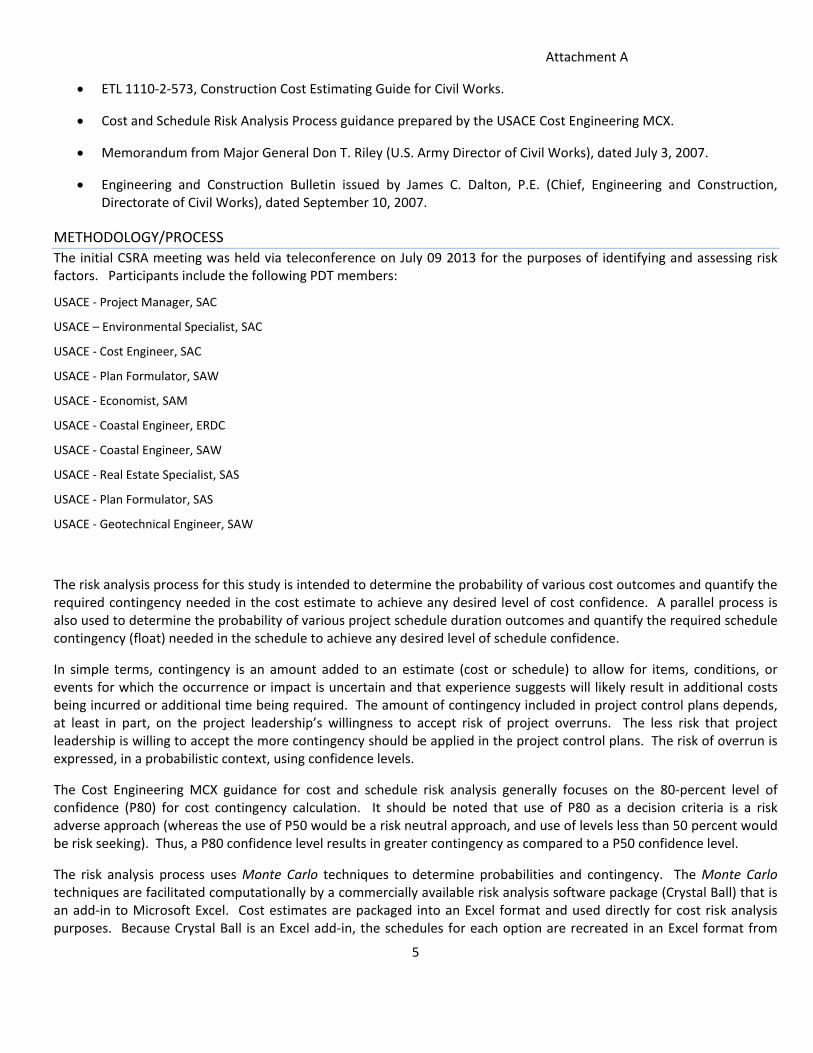
Attachment A
5
• ETL 1110-2-573, Construction Cost Estimating Guide for Civil Works.
• Cost and Schedule Risk Analysis Process guidance prepared by the USACE Cost Engineering MCX.
• Memorandum from Major General Don T. Riley (U.S. Army Director of Civil Works), dated July 3, 2007.
• Engineering and Construction Bulletin issued by James C. Dalton, P.E. (Chief, Engineering and Construction, Directorate of Civil Works), dated September 10, 2007.
METHODOLOGY/PROCESS The initial CSRA meeting was held via teleconference on July 09 2013 for the purposes of identifying and assessing risk factors. Participants include the following PDT members:
USACE - Project Manager, SAC
USACE – Environmental Specialist, SAC
USACE - Cost Engineer, SAC
USACE - Plan Formulator, SAW
USACE - Economist, SAM
USACE - Coastal Engineer, ERDC
USACE - Coastal Engineer, SAW
USACE - Real Estate Specialist, SAS
USACE - Plan Formulator, SAS
USACE - Geotechnical Engineer, SAW
The risk analysis process for this study is intended to determine the probability of various cost outcomes and quantify the required contingency needed in the cost estimate to achieve any desired level of cost confidence. A parallel process is also used to determine the probability of various project schedule duration outcomes and quantify the required schedule contingency (float) needed in the schedule to achieve any desired level of schedule confidence.
In simple terms, contingency is an amount added to an estimate (cost or schedule) to allow for items, conditions, or events for which the occurrence or impact is uncertain and that experience suggests will likely result in additional costs being incurred or additional time being required. The amount of contingency included in project control plans depends, at least in part, on the project leadership’s willingness to accept risk of project overruns. The less risk that project leadership is willing to accept the more contingency should be applied in the project control plans. The risk of overrun is expressed, in a probabilistic context, using confidence levels.
The Cost Engineering MCX guidance for cost and schedule risk analysis generally focuses on the 80-percent level of confidence (P80) for cost contingency calculation. It should be noted that use of P80 as a decision criteria is a risk adverse approach (whereas the use of P50 would be a risk neutral approach, and use of levels less than 50 percent would be risk seeking). Thus, a P80 confidence level results in greater contingency as compared to a P50 confidence level.
The risk analysis process uses Monte Carlo techniques to determine probabilities and contingency. The Monte Carlo techniques are facilitated computationally by a commercially available risk analysis software package (Crystal Ball) that is an add-in to Microsoft Excel. Cost estimates are packaged into an Excel format and used directly for cost risk analysis purposes. Because Crystal Ball is an Excel add-in, the schedules for each option are recreated in an Excel format from

Attachment A
6
their native format. The level of detail recreated in the Excel-format schedule is sufficient for risk analysis purposes that reflect the established risk register, but generally less than that of the native format.
The primary steps, in functional terms, of the risk analysis process are described in the following subsections. Risk analysis results would be provided in section 6.
Identify and Assess Risk Factors Identifying the risk factors via the PDT are considered a qualitative process that results in establishing a risk register that serves as the document for the further study using the Crystal Ball risk software. Risk factors are events and conditions that may influence or drive uncertainty in project performance. They may be inherent characteristics or conditions of the project or external influences, events, or conditions such as weather or economic conditions. Risk factors may have either favorable or unfavorable impacts on project cost and schedule.
Checklists or historical databases of common risk factors are sometimes used to facilitate risk factor identification. However, key risk factors are often unique to a project and not readily derivable from historical information. Therefore, input from the entire PDT is obtained using creative processes such as brainstorming or other facilitated risk assessment meetings. In practice, a combination of professional judgment from the PDT and empirical data from similar projects is desirable and is considered.
The initial formal meeting focused primarily on risk factor identification using brainstorming techniques, but also included some facilitated discussions based on risk factors common to projects of similar scope and geographic location. Discussions focused primarily on risk factor assessment and quantification.
Quantify Risk Factor Impacts The quantitative impacts of risk factors on project plans are analyzed using a combination of professional judgment, empirical data, and analytical techniques. Risk factor impacts are quantified using probability distributions (density functions), because risk factors are entered into the Crystal Ball software in the form of probability density functions.
Similar to the identification and assessment process, risk factor quantification involves multiple project team disciplines and functions. However, the quantification process relies more extensively on collaboration between cost engineering, designers, and risk analysis team members with lesser inputs from other functions and disciplines.
The following is an example of the PDT quantifying risk factor impacts by using an iterative, consensus-building approach to estimate the elements of each risk factor:
• Maximum possible value for the risk factor.
• Minimum possible value for the risk factor.
• Most likely value (the statistical mode), if applicable.
• Nature of the probability density function used to approximate risk factor uncertainty.
• Mathematical correlations between risk factors.
• Affected cost estimate and schedule elements.

Attachment A
7
Risk discussions focused on the various project features as presented within the USACE Civil Works Work Breakdown Structure for cost accounting purposes. It was recognized that the various features carry differing degrees of risk as related to cost, schedule, design complexity, and design progress.
The resulting product from the PDT discussions is captured within a risk register as presented in Appendix A, for both cost and schedule risk concerns. Note that the risk register records the PDT’s risk concerns, discussions related to those concerns, and potential impacts to the current cost and schedule estimates. The concerns and discussions are meant to support the team’s decisions related to event likelihood, impact, and the resulting risk levels for each risk event.
Analyze Cost Estimate and Schedule Contingency Contingency is analyzed using the Crystal Ball software, an add-in to the Microsoft Excel format of the cost estimate and schedule. Monte Carlo simulations are performed by applying the risk factors (quantified as probability density functions) to the appropriate estimated cost and schedule elements identified by the PDT. Contingencies are calculated by applying only the moderate and high level risks identified for each option (i.e., low-level risks are typically not considered, but remain within the risk register to serve historical purposes as well as support follow-on risk studies as the project and risks evolve).
For the cost estimate, the contingency is calculated as the difference between the P80 cost forecast and the base cost estimate. Each option-specific contingency is then allocated on a civil works feature level based on the dollar-weighted relative risk of each feature as quantified by Monte Carlo simulation. Standard deviation is used as the feature-specific measure of risk for contingency allocation purposes. This approach results in a relatively larger portion of all the project feature cost contingency being allocated to features with relatively higher estimated cost uncertainty.
For schedule contingency analysis, the option schedule contingency is calculated as the difference between the P80 option duration forecast and the base schedule duration. These contingencies are then used to calculate the time value of money impact of project delays that are included in the presentation of total cost contingency in section 6. The resulting time value of money, or added risk escalation, is then added into the contingency amount to reflect the USACE standard for presenting the “total project cost” for the fully funded project amount.
Schedule contingency is analyzed only on the basis of each option and not allocated to specific tasks. Based on Cost Engineering MCX guidance, only critical path and near critical path tasks are considered to be uncertain for the purposes of contingency analysis.
KEY CONSIDERATIONS AND ASSUMPTIONS
Key assumptions include the following:
• Adequate quantity of borrow currently exists for the project within the defined borrow area.
• Contract acquisition strategy will be full and open.
RISK ANALYSIS RESULTS
Risk Register Risk is unforeseen or unknown factors that can affect a project’s cost or schedule. Time and money have a direct relationship due to the time value of money. A risk register is a tool commonly used in project planning and risk analysis and serves as the basis for the risk studies and Crystal Ball risk models. The risk register describes risks in terms of cost

Attachment A
8
and schedule. A summary risk register that includes typical risk events studied (high and moderate levels) is presented in this section. The risk register reflects the results of risk factor identification and assessment, risk factor quantification, and contingency analysis. A more detailed risk register is provided in Appendix A. The detailed risk registers of Appendix A include low level and unrated risks, as well as additional information regarding the specific nature and impacts of each risk.
It is important to note that a risk register can be an effective tool for managing and communicating identified risks throughout the project life cycle. As such, it is generally recommended that risk registers be updated as the designs, cost estimates, and schedule are further refined, especially on large projects with extended schedules. Recommended uses of the risk register going forward include:
• Documenting risk mitigation strategies being pursued in response to the identified risks and their assessment in terms of probability and impact.
• Providing project sponsors, stakeholders, and leadership/management with a documented framework from which risk status can be reported in the context of project controls.
• Communicating risk management issues.
• Providing a mechanism for eliciting risk analysis feedback and project control input.
• Identifying risk transfer, elimination, or mitigation actions required for implementation of risk management plans.
A correlation is a dependency that exists between two risks and may be direct or indirect. An indirect correlation is one in which large values of one risk are associated with small values of the other. Indirect correlations have correlation coefficients between 0 and -1. A direct correlation is one in which large values of one risk are associated with large values of the other. Direct correlations have correlation coefficients between 0 and 1. Correlations were not identified in this analysis.
The risk register identifies thirty one different risks. There are eight that are either moderate or high risks. An abridged version of the risk register is presented below.

Attachment A
9
Table 2 - Risk Register (Abridged)
TASBPDT Discussions & Conclusions Likelihood* Impact* Risk Level* Likelihood* Impact* Risk Level* Technical L
PPM-3Congressional Funding - Construction
Concern is that construction funding will not be appropriated in accordance with the project schedule and incur additional escalation for the project.
Due to relatively low B/C ratio and elimination of earmarks, Congressional funding for construction could be delayed. Likely Marginal MODERATE Very Likely Marginal MODERATE 1
TECHNICAL RISKS
T-2 Quantities of material.
Required quantities defined by Beach-FX. However, quantities can change over time due to beach erosion during the PED phase and geotechnical overfill ratios--additionally funding delays may increase quantities.
Overall quantities are based on average volumes. There could be variation over time over the models . Likely Significant HIGH Likely Marginal MODERATE 2
CONSTRUCTION RISKS
CON-1 Contract ModificationsThere may be modification issues that have not been captured in current risks.
The normal modifications for dredging is quantities. Each contract will likely carry the intended quantities per contract. Competing work, loss of dredger, quantity assumption can cause modifications such as remobilizations and delays. Other modification potentials could include borrow source remobilization resulting from environmental impacts. Likely Marginal MODERATE Unlikely Significant MODERATE 3
ESTIMATE AND SCHEDULE RISKS
EST-1 Dredge, type & sizeEstimate choice can effect efficiency and productivity, causing a change to the estimate.
Estimate assumed a single 30" pipeline dredge but equipment is not restrictive w/in contract. The chosen estimate dredge size can affect the cost and productivity. A large pipeline results in greater efficiency as compared to smaller pipeline dredges, but may be impacted by weather/wave conditions. Due to requirement for ocean certified dredge, expect either 27" or 30" pipeline. Likely Marginal MODERATE Likely Marginal MODERATE 4
EST-2 Fuel Fuel fluctuations can impact dredging costs.
On dredging projects, fuel is a major cost driver for equipment. Fuel costs have been very volatile in the past 18 months. Study should be for time of funding date estimate. Likely Significant HIGH Unlikely Marginal LOW 5
EST-3 Dredge Productivity
The estimate assumes a certain productivity based on a 30" pipeline dredge. Productivity may vary if different dredge is used.
The current estimate makes assumptions in the size and productivity for a single 30" pipeline dredge with an average pumpimng distance of 18,220 LF. Those estimate assumptions establish the schedule. Productivity of a pipeline dredge can vary due to various conditions such as weather/waves and mechanical failure. Productivity could be 60-80% EWT. Likely Marginal MODERATE Likely Negligible LOW 6
Programmatic Risks (External Risk Items are those that are generated, caused, or controlled exclusively outside the PDT's sphere of influence.)
EXT-1 Market ConditionsMarket conditions and competing projects may impact bid competition.
Currently, there are a lot of projects planned when considering the number of dredges available. It is a tough bidding climate based on dwindling number of dredging contractors. Likely Significant HIGH Likely Negligible LOW 7
EXT-5 Esc exceeds OMB ratesOver longer periods of time, the actual market may be greater than the OMB rates, impacting contract costs.
Volatile fuel, being a larger risk on dredging projects, may not correlate with the OMB rates and may be higher as time passes. Likely Marginal MODERATE Unlikely Negligible LOW 8
Edisto Beach Feasability Study 2013 CSRARisk No. Risk/Opportunity Event Concerns
Project Cost Project Schedule
PROJECT & PROGRAM MGMTContract Risks (Internal Risk Items are those that are generated, caused, or controlled within the PDT's sphere of influence.)
Cost Risk Analysis - Cost Contingency Results The project Cost Contingency at the 80% confidence level for the initial construction is 26%. This level was established by analyzing the different cost risk factors that affect the project. Cost contingencies can be either positive or negative. The cost sensitivity chart demonstrates relative cost contingency of individual risks for the initial construction. The chart for the renourishments is similar with long term variables such as escalation, fuel, and the borrow sources having slightly higher rankings. The sensitivity charts for the initial construction cost and renourishments are as depicted below.

Attachment A
10

Attachment A
11
• Dredge type/size
Discussion: The choice of dredge size can affect efficiency and productivity, causing a difference between the government estimate and the bid price of the contract. The estimate assumed a 30” hydraulic pipeline dredge will be utilized, but the actual equipment is not restrictive within the proposed contract. The only restriction is the fact that the borrow area is outside the line of demarcation which requires an ocean certified dredge to be used.
• Market Conditions
Discussion: Dredging is a highly competitive industry and there are limited windows when dredging can be performed in this area. The PDT has planned to allow multiple types of dredges to be considered to increase competition for this project.
• Quantities:
Discussion- The quantity of material required to be placed is uncertain and can be affected by increases in erosion due to more frequent storm events. In addition, due to the time period between the feasibility study and initial construction, the expected quantity could change dramatically.
Schedule Risk Analysis - Schedule Contingency Results No specific schedule risk was derived from team’s analysis. Schedule risks for the construction window were assessed for their impacts to cost and added to the cost contingency for both the first and the nourishment costs. The cost contingency analysis results are in the tables below.
Table 3 - Contingency Analysis Results – Initial and Periodic Nourishments
MCACES
First Costs Contingency
% Rounded % Rounded $
0% $16,769,500 ($550,181) $16,219,319 -3.28% -4% $ (670,780) 5% $16,769,500 $890,726 $17,660,226 5.31% 6% $ 1,006,170 10% $16,769,500 $1,213,344 $17,982,844 7.24% 8% $ 1,341,560 15% $16,769,500 $1,497,879 $18,267,379 8.93% 9% $ 1,509,255 20% $16,769,500 $1,762,856 $18,532,356 10.51% 11% $ 1,844,645 25% $16,769,500 $1,976,260 $18,745,760 11.78% 12% $ 2,012,340 30% $16,769,500 $2,180,241 $18,949,741 13.00% 14% $ 2,347,730 35% $16,769,500 $2,383,992 $19,153,492 14.22% 15% $ 2,515,425 40% $16,769,500 $2,561,710 $19,331,210 15.28% 16% $ 2,683,120 45% $16,769,500 $2,756,849 $19,526,349 16.44% 17% $ 2,850,815 50% $16,769,500 $2,958,095 $19,727,595 17.64% 18% $ 3,018,510 55% $16,769,500 $3,140,141 $19,909,641 18.73% 19% $ 3,186,205 60% $16,769,500 $3,396,253 $20,165,753 20.25% 21% $ 3,521,595 65% $16,769,500 $3,536,741 $20,306,241 21.09% 22% $ 3,689,290 70% $16,769,500 $3,756,720 $20,526,220 22.40% 23% $ 3,856,985 75% $16,769,500 $3,973,609 $20,743,109 23.70% 24% $ 4,024,680 80% $16,769,500 $4,247,469 $21,016,969 25.33% 26% $ 4,360,070 85% $16,769,500 $4,664,156 $21,433,656 27.81% 28% $ 4,695,460 90% $16,769,500 $5,132,276 $21,901,776 30.60% 31% $ 5,198,545 95% $16,769,500 $5,808,264 $22,577,764 34.64% 35% $ 5,869,325 100% $16,769,500 $7,387,092 $24,156,592 44.05% 45% $ 8,546,275

Attachment A
12
MCACES
Norishment Costs
Contingency
% Rounded % Rounded $
0% $8,460,410 $48,301 $8,508,711 0.57% 1% $ 84,604 5% $8,460,410 $806,192 $9,266,602 9.53% 10% $ 846,041 10% $8,460,410 $1,064,974 $9,525,384 12.59% 13% $ 1,099,853 15% $8,460,410 $1,229,951 $9,690,361 14.54% 15% $ 1,269,062 20% $8,460,410 $1,368,716 $9,829,126 16.18% 17% $ 1,438,270 25% $8,460,410 $1,465,389 $9,925,799 17.32% 18% $ 1,522,874 30% $8,460,410 $1,552,619 $10,013,029 18.35% 19% $ 1,607,478 35% $8,460,410 $1,631,571 $10,091,981 19.28% 20% $ 1,692,082 40% $8,460,410 $1,735,803 $10,196,213 20.52% 21% $ 1,776,686 45% $8,460,410 $1,801,130 $10,261,540 21.29% 22% $ 1,861,290 50% $8,460,410 $1,890,562 $10,350,972 22.35% 23% $ 1,945,894 55% $8,460,410 $1,977,361 $10,437,771 23.37% 24% $ 2,030,498 60% $8,460,410 $2,047,372 $10,507,782 24.20% 25% $ 2,115,103 65% $8,460,410 $2,142,506 $10,602,916 25.32% 26% $ 2,199,707 70% $8,460,410 $2,223,450 $10,683,860 26.28% 27% $ 2,284,311 75% $8,460,410 $2,336,847 $10,797,257 27.62% 28% $ 2,368,915 80% $8,460,410 $2,438,643 $10,899,053 28.82% 29% $ 2,453,519 85% $8,460,410 $2,551,940 $11,012,350 30.16% 31% $ 2,622,727 90% $8,460,410 $2,723,914 $11,184,324 32.20% 33% $ 2,791,935 95% $8,460,410 $2,954,928 $11,415,338 34.93% 35% $ 2,961,144 100% $8,460,410 $4,077,754 $12,538,164 48.20% 49% $ 4,145,601

Attachment A
13
APPENDIX A DETAILED RISK REGISTER

Attachment A
14
Risk No.
Risk/Opportunity Event Concerns
Project Cost Project Schedule
PDT Discussions & Conclusions Likelihoo
d* Impact* Risk
Level* Likelihoo
d* Impact* Risk Level*
Contract Risks (Internal Risk Items are those that are generated, caused, or controlled within the PDT's sphere of influence.) PROJECT & PROGRAM MGMT
PPM-1 Congressional Funding - Feasibility
Due to additional requirements for CSRA and IEPR, Congressional funding to complete the feasibility study is in question
Funding is in place to complete feasibility study in FY13 with signature in FY14. If additional changes are required, funding is not available in FY14. Likely Negligible LOW Likely Negligible LOW
PPM-2 Congressional Funding - PED
Concern is that the PED Congressional funding is uncertain, post feasibility.
Chiefs report scheduled for June 14. Request for PED funding is in for FY15. Likely Negligible LOW Unlikely Marginal LOW
PPM-3
Congressional Funding - Construction
Concern is that construction funding will not be appropriated in accordance with the project schedule and incur additional escalation for the project.
Due to relatively low B/C ratio and elimination of earmarks, Congressional funding for construction could be delayed. Likely Marginal
MODERATE Very Likely Marginal MODERATE
PPM-4 Stakeholder funding capability
Sponsor has small tax base, but is expected to provide cost share agreement for funding.
Sponsors must fund portion of 50% feasibility, 25% PED and 35% initial construction plus 100% real estate acquisition. Unlikely Negligible LOW Unlikely Negligible LOW
PPM-5 Adequate PDT Resources
PDT has been through significant personnel changes during study.
The District feels that there is adequate District support and team development for future efforts. Unlikely Negligible LOW Unlikely Negligible LOW
PPM-6 Sponsor Support
Sponsor support and agreement with the project plan.
Official Sponsor coordination and support is ongoing. However, some concerns about selected plan exists with residents of Edisto. Unlikely Negligible LOW Unlikely Negligible LOW
PPM-7 Schedule quality
Concern whether current schedule is realistic, optimistic.
The PM is confident of the schedule for PED and construction durations. Unlikely Negligible LOW Unlikely Negligible LOW
CONTRACT ACQUISITION RISKS
CA-1 Contract Acquisition Strategy
The acquisition strategy could impact the construction cost and schedule.
Work type is not complicated. It is likely that it will be a FFP large business, based on historical and small business does not have capability. The contract packages will consider the estimate schedule projections related to productivity. Expected strategy is for full and open for large business. Unlikely Negligible LOW Unlikely Negligible LOW
TECHNICAL RISKS
T-1 Borrow material Quality
Limited borings done on borrow source. However, there is a pretty good data set from previous projects.
There may be pockets of material that are not suitable but overall there is more than enough material to complete the project. More data will be obtained in PED phase but generally thought to be a low risk. Unlikely Marginal LOW Unlikely Negligible LOW
T-2 Quantities of material.
Required quantities defined by Beach-FX. However, quantities can change over time due to beach erosion during the PED phase and geotechnical overfill ratios--additionally funding delays may increase quantities.
Overall quantities are based on average volumes. There could be variation over time over the models . Likely Significant HIGH Likely Marginal MODERATE
T-3 Hard Bottom Encounter
Hard bottoms may be uncovered later in out years .
Sand bottom may be covering hard bottoms, leaving a risk in the borrow quantity available at each site. It could damage the hopper dredge. Risk is increased in the out years, because in the near term the dredge can simply relocate. Better clarification should occur during PED phase with better surveys.
Very Unlikely Marginal LOW Unlikely Marginal LOW
LANDS AND DAMAGES RISKS
RE-1 Acquire real estate
Concern that RE cannot acquire real estate easements in timely fashion to support the construction contracts.
Historically, RE has a good track record of acquiring easements. This is a function of the sponsor who is highly motivated to begin this project. Unlikely Negligible LOW Unlikely Negligible LOW
RE-2 Real Estate Estimate Real Estate estimate may cause cost impact.
Historical information is good. The estimate currently includes a 25% contingency. This should be re-evaluated within the risk analysis outcome. Unlikely Negligible LOW Unlikely Negligible LOW
REGULATORY AND ENVIRONMENTAL RISKS

Attachment A
15
ENV-1 UXO Area is near sites for Civil War naval battles.
Area surveyed for cultural resources with magnetometer. No UXO detected.
Very Unlikely Negligible LOW Unlikely Negligible LOW
ENV-2
Critical Habitat Designation Sea Turtle Site
Designation of area as critical habitat could change work window.
Area could be designated as a "critical habitat" and have more restrictions on work window, sand quality, etc. Unlikely Marginal LOW Unlikely Marginal LOW
ENV-3 SAD Turtle Incidental Take
Other projects encountering sea turtles
Other SAD impacts or "takes" should not impact this project. Project expected to use hydraulic pipeline dredge and should not be impacted. Unlikely Marginal LOW Unlikely Marginal LOW
ENV-4 Bird Nesting TES Bird nesting impacts construction.
Nesting areas are generally outside of construction zone. Risk is minimized, but such an encounter may shut down work activity for a period of time. Unlikely Marginal LOW Unlikely Marginal LOW
ENV-5 Right Whale Restrictions
Encounter potential impacts dredge.
The current estimate assumes hydraulic pipeline dredge which should not encounter right whales during dredging operations due to slow movements.
Very Unlikely Negligible LOW Unlikely Negligible LOW
ENV-6 Environmental Monitoring
Environmental monitoring required during dredging.
Dredge relocation to another borrow source would be required if impacts are found. Environmental group will have a separate monitoring contract. The monitoring costs have been included for the initial construction. Unlikely Marginal LOW Unlikely Marginal LOW
ENV-7 Dune vegetation Dune Revegetation required
Estimate includes first vegetation. Smaller Dune Revegetation is included in nourishment cycles. Likely Negligible LOW Likely Negligible LOW
ENV-8 Archeological
Concern that there may be uncovered archeological finds during the underwater excavations.
Borrow area has been well established with adequate investigation to determine exclusion areas. If anything was discovered, another section of the larger borrow areacould be used.
Very Unlikely Marginal LOW
Very Unlikely Marginal LOW
CONSTRUCTION RISKS
CON-1 Contract Modifications
There may be modification issues that have not been captured in current risks.
The normal modifications for dredging is quantities. Each contract will likely carry the intended quantities per contract. Competing work, loss of dredger, quantity assumption can cause modifications such as remobilizations and delays. Other modification potentials could include borrow source remobilization resulting from environmental impacts. Likely Marginal
MODERATE Unlikely Significant MODERATE
CON-2 Hopper Dredge
The estimate assumes a pipeline dredge because of proximity of borrow site to Edisto.
Hopper dredge not likely due to proximity of borrow area and relatively low quantities of material. Unlikely Marginal LOW Unlikely Marginal LOW
ESTIMATE AND SCHEDULE RISKS
EST-1 Dredge, type & size
Estimate choice can effect efficiency and productivity, causing a change to the estimate.
Estimate assumed a single 30" pipeline dredge but equipment is not restrictive w/in contract. The chosen estimate dredge size can affect the cost and productivity. A large pipeline results in greater efficiency as compared to smaller pipeline dredges, but may be impacted by weather/wave conditions. Due to requirement for ocean certified dredge, expect either 27" or 30" pipeline. Likely Marginal
MODERATE Likely Marginal MODERATE
EST-2 Fuel Fuel fluctuations can impact dredging costs.
On dredging projects, fuel is a major cost driver for equipment. Fuel costs have been very volatile in the past 18 months. Study should be for time of funding date estimate. Likely Significant HIGH Unlikely Marginal LOW
EST-3 Dredge Productivity
The estimate assumes a certain productivity based on a 30" pipeline dredge. Productivity may vary if different dredge is used.
The current estimate makes assumptions in the size and productivity for a single 30" pipeline dredge with an average pumpimng distance of 18,220 LF. Those estimate assumptions establish the schedule. Productivity of a pipeline dredge can vary due to various conditions such as weather/waves and mechanical failure. Productivity could be 60-80% EWT. Likely Marginal
MODERATE Likely Negligible LOW
Programmatic Risks
(External Risk Items are those that are generated, caused, or controlled exclusively outside the PDT's sphere of influence.)
EXT-1 Market Conditions
Market conditions and competing projects may impact bid competition.
Currently, there are a lot of projects planned when considering the number of dredges available. It is a tough bidding climate based on Likely Significant HIGH Likely Negligible LOW

Attachment A
16
dwindling number of dredging contractors.
EXT-2 External Opposition
External opposition may cause scope or schedule change.
Feds adhering to the environmental requirements. Sponsors in favor of project. No serious historical intervention because it is a beach renourishment project. Unlikely Marginal LOW Unlikely Marginal LOW
EXT-3 Acts of God Severe weather may impact cost or schedule.
Nor'easters, tropical storms or hurricanes could impact construction as well as beach profile. Due to turtle nesting season, construction will most likely occur from October 15 thru April 15 which is outside of hurricane season and storms are not a likely impact. Due to the short duration of construction, 4 months for initial and less than 1 month for nourishment cycles, the likelihood of an impact is very unlikely.
Very Unlikely Critical LOW Unlikely Marginal LOW
EXT-4 Borrow Competition
External entities may compete for the borrow sources.
For initial construction this is unlikely. Due to the exclusion of the state park from the Federal Project, the state may decide to nourish state park in the future. Due to the large borrow area for this project and the relatively small quantities required for the nourishment cycles, there should not be a significant impact. Unlikely Marginal LOW Unlikely Marginal LOW
EXT-5 Esc exceeds OMB rates
Over longer periods of time, the actual market may be greater than the OMB rates, impacting contract costs.
Volatile fuel, being a larger risk on dredging projects, may not correlate with the OMB rates and may be higher as time passes. Likely Marginal
MODERATE Unlikely Negligible LOW