Edison Healthcare Insight - · PDF fileYakult Honsha in Japan. ... 4SC has recently announced...
42
Edison Healthcare Insight September 2017 Published by Edison Investment Research
Transcript of Edison Healthcare Insight - · PDF fileYakult Honsha in Japan. ... 4SC has recently announced...

Edison Healthcare Insight
September 2017
Published by Edison Investment Research

The Edison healthcare team www.edisongroup.com
Maxim Jacobs Dr Nathaniel Calloway
Max joined Edison’s healthcare team in December 2014. Prior to this he worked as a senior analyst at Guidepoint Global. Max has also previously worked as a senior analyst at Ridgemark Capital, a sector head at Broadfin Capital and as a senior analyst at Mehta Partners. He is a CFA charter holder.
Nathaniel Calloway joined the healthcare team in December 2015. Before Edison, he performed healthcare investment research for a fund at Bishop Rosen and for Wainscott Capital Partners. Prior to his role as an analyst he performed molecular neuroscience research at Cornell Medical School and holds a PhD in chemistry from Cornell. He has published eight scientific papers on topics ranging from physical chemistry to immunology, and he has been recognised as an American Heart Association fellow and an American Chemical Society Medicinal Chemistry fellow.
Pooya Hemami Dr John Savin
Pooya is a licensed optometrist with over five years of experience in life sciences equity research. Prior to joining Edison, he covered the Canadian healthcare sector as a research analyst at Desjardins Capital Markets. He holds a doctor of optometry degree from the University of Montreal, and an MBA (finance concentration) from McGill University. He received his CFA charter in 2011.
John is an analyst working on biotech, pharma, medical device and diagnostics companies. As founder CEO of Physiomics, he devised the strategy, raised funds and took the company to AIM in 2004. At Greig Middleton, John was director in charge of the pharma and biotech analyst team and worked with corporate finance on fund-raising, IPOs and corporate restructuring. He has an industry background in sales and marketing with GE Healthcare and AstraZeneca and is a co-author on a number of scientific publications.
Juan Pedro Serrate Dr Dennis Hulme
Juan joined Edison’s Healthcare team in April 2016. A veterinarian by training, he has held business positions in the healthcare sector over the past 12 years. Juan has collaborated with independent equity research firms, specialising in fundamental analysis and valuations. For more than six years, he co-managed a seed capital fund in Spain that invested in biotech start-ups and projects. Earlier in his career, he was a research fellow at the Yale University School of Medicine. He has a Master’s degree in biotechnology, as well as an MBA from IESE Business School.
Dennis joined Edison in December 2014. Prior to this he worked as an analyst at BBY Stockbrokers and as a research scientist at CSIRO. Dennis was ranked number two healthcare stock picker in the 2010 Starmine Analyst Awards and has a PhD in veterinary sciences.
Dr Linda Pomeroy Dr Susie Jana
Linda joined Edison in early 2016. She has co-founded an orthopaedic company, worked for a number of years as a consultant on various NHS projects, and previously worked at Numis Securities as a life sciences analyst. Linda has a PhD from Imperial College Business School and an MPhil in bioscience enterprise from the University of Cambridge.
Susie joined the team in September 2015 and has 16 years’ experience in the healthcare sector. She is a qualified medical doctor, having studied medicine at UCL. She also holds an intercalated BSc in psychology. After a few years working as a junior doctor in the NHS, Susie joined the investment banking industry for six years on the sell-side covering biotechnology stocks, then mid- to large-cap pharmaceuticals at Société Générale. Most recently she worked as a buy-side analyst, covering European biotech, pharma and medtech stocks at F&C Investments for five years.
Dr Jonas Peciulis Dr Daniel Wilkinson
Jonas joined Edison in November 2015. He is a qualified medical doctor with several years of clinical practice. He then moved into equity research as a healthcare analyst at Norne Securities, focused on Norwegian companies, and received two StarMine awards for stock picking in 2013. Most recently, he worked for a London-based life sciences venture capital company before completing his MBA degree.
Daniel joined Edison’s Healthcare team in January 2016. He spent four years at Imperial College London, where he undertook both a Master’s in Chemical Biology of Health & Disease and a PhD in Biosensors and Biotechnology in Diabetes. Before this he worked at eTect, a spin-out company from the University of Leeds that was focused on biosensor technology. He is currently studying for the Investment Management Certificate (IMC).

Contents
Company profiles 3
Company coverage 36
Prices at 14 September 2017 Published 20 September 2017
Welcome to the September edition of the Edison Healthcare Insight. In this edition we have profiled 66 of our healthcare companies under coverage.
Readers wishing more detail should visit our website, where reports are freely available for download (www.edisongroup.com). All profit and earnings figures shown are normalised, excluding amortisation of acquired intangibles, exceptional items and share-based payments.
Edison is an investment research and advisory company, with offices in North America, Europe, the Middle East and AsiaPac. The heart of Edison is our world renowned equity research platform and deep multi-sector expertise. At Edison Investment Research, our research is widely read by international investors, advisors and stakeholders. Edison Advisors leverages our core research platform to provide differentiated services including investor relations and strategic consulting. Edison is authorised and regulated by the Financial Conduct Authority. Edison is a registered investment adviser regulated by the state of New York.
We welcome any comments/suggestions our readers may have.
Neil Shah & Maxim Jacobs
Healthcare Research
Edison Healthcare Insight | 20 September 2017 2
Company profiles
Prices at 14 September
US$/£ exchange rate: 0.7518
€/£ exchange rate: 0.8942
C$/£ exchange rate: 0.6170
A$/£ exchange rate: 0.6009
NZ$/£ exchange rate: 0.5434
SEK/£ exchange rate: 0.0937
DKK/£ exchange rate: 0.1202
NOK/£ exchange rate: 0.0953
JPY/£ exchange rate: 0.0068
NIS/£ exchange rate: 0.2100
CHF/£ exchange rate: 0.7791

Sector: Pharma & healthcare
Price: €4.64Market cap: €142mMarket FRA
Share price graph (€)
Company description4SC is a Munich-based cancerbiopharmaceutical company.Resminostat is the lead candidate forcutaneous T-Cell lymphoma (pivotalstudy started Q416) and partnered withYakult Honsha in Japan. It has asecond anti-cancer compound,4SC-202 (planned Phase II H217) anda preclinical asset, 4SC-208. It alsopartners a Phase I oncology asset.Price performance% 1m 3m 12mActual 6.0 28.4 115.1Relative* 2.8 31.2 78.0* % Relative to local indexAnalystDr Linda Pomeroy
4SC (VSC)
INVESTMENT SUMMARY
4SC has recently announced an updated and progressive development plan, which itintends to fund from the recent equity capital raise (€41m gross). It has initiated (late 2016)its pivotal 150-patient study with anti-cancer compound resminostat (HDAC inhibitor) forcutaneous T-cell lymphoma (CTCL). Top-line data is expected by 2019. Resminostat hasalso been licensed to Yakult Honsha in Japan. 4SC announced in 2016 positive Phase IIresults from a more detailed analysis of the HCC Yakult trial data, which could lead tofurther clinical development. Alongside resminostat, 4SC intends to advance 4SC-202 into afirst pivotal study (late 2018) and complete formal development of 4SC-208 with the aim ofstarting Phase I clinical testing (early 2019). Other ongoing positives include a partnershipwith Link Health in China for its oncology Eg5 inhibitor, 4SC-205 and a worldwide license for4SC’s preclinical inhibitors of the Kv1.3 ion channel.
INDUSTRY OUTLOOK
Resminostat could become the first HDAC inhibitor to gain EU approval for CTCL (vs twoHDACs approved in the US). CTCL has been validated as a target indication for HDACs,with vorinostat (Merck & Co) and romidepsin (Celgene) FDA-approved on Phase II data.
Y/E Dec Revenue EBITDA PBT EPS P/E P/CF(€m) (€m) (€m) (c) (x) (x)
2015 3.3 (7.9) (8.4) (58.58) N/A N/A
2016 2.1 (10.9) (10.9) (54.17) N/A N/A
2017e N/A N/A N/A N/A N/A N/A
2018e N/A N/A N/A N/A N/A N/A
Sector: Pharma & healthcare
Price: 34.0pMarket cap: £73mMarket AIM
Share price graph (p)
Company descriptionAbzena provides proprietarytechnologies and complementaryservices to enable the developmentand manufacture of biopharmaceuticalproducts.
Price performance% 1m 3m 12mActual (25.3) (19.1) (26.9)Relative* (24.7) (17.2) (33.4)* % Relative to local indexAnalystDr Linda Pomeroy
Abzena (ABZA)
INVESTMENT SUMMARY
Abzena offers fully integrated research and manufacturing services/technologies that enablesafer and more effective biological products. This includes immunogenicity assessment,protein/antibody engineering, bioconjugation, biomanufacturing and chemistry/conjugation.It has a fully integrated offering which has a global operating presence and cross sellingopportunities across the group. Recent fundraising of £25m (gross) will enable it to expandits service offering and capacity. Fee-for-services provides stable revenues today (H117£9.0m), while successful commercialisation of products created using Abzena’stechnologies offers the prospect of substantial future revenues (small % royalties); 12 suchproducts are now in the clinic, eg Gilead’s GS-5745 (Phase III for gastric cancer) andRoche's RG6125 (formerly SDP051). Abzena has recently announced another licensingdeal for its ADC linker technology (ThioBridge™), which adds to the previous deals for up toten ADC products in one case and with Halozyme for up to three ADC targets.
INDUSTRY OUTLOOK
The biological services industry is highly competitive but Abzena's deepening portfolio oftechnologies and services is compelling, while its ADC technology offers safety and efficacyadvantages over competitors.
Y/E Mar Revenue EBITDA PBT EPS P/E P/CF(£m) (£m) (£m) (p) (x) (x)
2016 9.9 (6.8) (7.4) (5.86) N/A N/A
2017 18.7 (7.5) (8.3) (5.82) N/A N/A
2018e N/A N/A N/A N/A N/A N/A
2019e N/A N/A N/A N/A N/A N/A
3Edison Healthcare Insight | 20 September 2017

Sector: Pharma & healthcare
Price: SEK18.90Market cap: SEK435mMarket NASDAQ OMX First North
Share price graph (SEK)
Company descriptionAcarix, a Swedish company, hasdeveloped the CE-marked CADScor toenable about half of the patients to beruled out from further, expensivetesting. Private sales in Germany havestarted. Full EU sales may start from2019. US sales might start from 2021.
Price performance% 1m 3m 12mActual (7.8) (3.1) N/ARelative* (3.8) 3.0 N/A* % Relative to local indexAnalystDr John Savin
Acarix (ACARIX)
INVESTMENT SUMMARY
Acarix sold three CADScore units in H1 worth SEK 193k. The loss was SEK 11m. H1 cashoutflow was SEK 26.8m with 30 June cash of SEK 116m. The cash outflow was increasedafter paying SEK 13.7m of other liabilities and working capital movements due to sales.EPS including exceptional items was SEK (3.63). The first sale in the crucial Germanmarket was to a private Berlin cardiology clinic. This follows the first sale in Denmark.CADScore helps doctors to identify the patients who probably require no further riskyinvasive clinical testing.
INDUSTRY OUTLOOK
Germany has a strong private healthcare insurance sector (about 10% of people covered)which might adopt quickly given that there are stated to be over 1 million hospital cardiacassessments each year, many unnecessary. Major German and EU sales will need publicreimbursement probably from 2019. US marketing will probably require a US clinical study,with sales from 2021 possible. The US has over 3.8 million tests for coronary artery diseaseper year.
Y/E Dec Revenue EBITDA PBT EPS P/E P/CF(SEKm) (SEKm) (SEKm) (öre) (x) (x)
2015 N/A (15.2) (15.4) (114.0) N/A N/A
2016 N/A (26.8) (26.8) (183.0) N/A N/A
2017e 3.0 (51.8) (51.4) (211.0) N/A N/A
2018e 3.8 (49.6) (49.5) (203.0) N/A N/A
Sector: Pharma & healthcare
Price: US$3.57Market cap: US$488mMarket NASDAQ
Share price graph (US$)
Company descriptionAchillion is engaged in the discoveryand development of drugs from itsresearch platform in its novel factor Dprogramme. ACH-4471 is now indevelopment for PNH, as well as C3Gand IC-MPGN.
Price performance% 1m 3m 12mActual (26.7) (16.2) (53.6)Relative* (27.6) (18.1) (60.5)* % Relative to local indexAnalystMaxim Jacobs
Achillion Pharmaceuticals (ACHN)
INVESTMENT SUMMARY
Achillion is progressing its oral factor-D program in rare diseases, such as PNH,C3G andimmune-complex membranoproliferative glomerulonephritis (IC-MPGN), as well as in largeropportunities including geographic atrophy, an advanced form of dry AMD. The companyrecently announced positive interim data in untreated PNH patients for ACH-4471, its oralfactor-D candidate.
INDUSTRY OUTLOOK
Achillion is currently focused on drug development in relatively rare diseases. This strategyhas multiple advantages including smaller trials, premium pricing, orphan drug protectionand the ability to market the products without a large pharmaceutical partner.
Y/E Dec Revenue EBITDA PBT EPS P/E P/CF(US$m) (US$m) (US$m) (c) (x) (x)
2015 66.1 (4.3) (3.9) (3.11) N/A 100.9
2016 15.0 (52.9) (50.7) (37.10) N/A N/A
2017e 0.0 (85.9) (85.0) (59.24) N/A N/A
2018e 0.0 (89.2) (89.2) (59.18) N/A N/A
4Edison Healthcare Insight | 20 September 2017

Sector: Pharma & healthcare
Price: NZ$2.50Market cap: NZ$243mMarket NZSX
Share price graph (NZ$)
Company descriptionAFT Pharmaceuticals is a specialtypharmaceutical company that operatesprimarily in Australasia but has productdistribution agreements across theglobe. The company’s product portfolioincludes prescription andover-the-counter drugs to treat a rangeof conditions and a proprietarynebuliser.Price performance% 1m 3m 12mActual (12.0) 8.7 (18.0)Relative* (12.1) 4.8 (21.3)* % Relative to local indexAnalystMaxim Jacobs
AFT Pharmaceuticals (AFT)
INVESTMENT SUMMARY
AFT Pharmaceuticals is a New Zealand-based speciality pharmaceutical company thatcurrently sells 130 prescription speciality generics and OTC products through its own salesforce in New Zealand, Australia and South-East Asia and has been expanding itsgeographic footprint. Maxigesic, its combination acetaminophen/ibuprofen product that isaddressing a $10.4b market, is currently sold and launched in 9 countries and distributionagreements are in place in a total of 124. AFT is targeting between 30-40 launches forMaxigesic in FY18. AFT is also developing a handheld device called SURF Nebuliser, whichis able to deliver therapies intranasally, with a main focus on the $3 billion conscioussedation market, while carrying out a preliminary study in sinusitis in parallel, with the aim offiling in H2 2018.
INDUSTRY OUTLOOK
AFT is a multi product company targeting pharmacy prescription, OTC and hospitalmarkets. Data for Maxigesic offers them a competitive advantage in a fragmented industry.
Y/E Mar Revenue EBITDA PBT EPS (fd) P/E P/CF(NZ$m) (NZ$m) (NZ$m) (c) (x) (x)
2016 64.0 (7.8) (10.8) (11.12) N/A N/A
2017 69.2 (15.1) (18.5) (19.12) N/A N/A
2018e 97.7 1.3 (0.6) (0.61) N/A 318.2
2019e 124.2 16.5 14.7 15.10 16.6 18.2
Sector: Pharma & healthcare
Price: NIS1.04Market cap: NIS68mMarket TASE
Share price graph (NIS)
Company descriptionAllium Medical Solutions is a companyfocused on developing and marketingminimally invasive devices in variousareas: cardiovascular, metabolic,genitourinary and gastrointestinal. Thecompany has three selling productlines: Allium Stents, IBI (EndoFast)and Gardia Medical.
Price performance% 1m 3m 12mActual 36.5 (9.3) (25.4)Relative* 33.7 (8.7) (27.1)* % Relative to local indexAnalystJuan Pedro Serrate
Allium Medical (ALMD)
INVESTMENT SUMMARY
Allium Medical Solutions is a company focused on developing and marketing minimallyinvasive devices in various areas: cardiovascular, metabolic, genitourinary andgastrointestinal. The company has three selling product lines: Allium Stents, IBI (EndoFast)and Gardia Medical. Peripheral stents and EndoFast urogynecology devices generate thebulk of revenues (70% of NIS7.3m in 2016). Allium has achieved revenue CAGR of 23% in2011-16. The investment case rests on Allium’s ability to execute on its ambitious growthstrategy, with revenues expanding at a double-digit rate as the company continues to gainmarket share in established and new regions. Cash equivalents and short-term deposits atend June 2017 plus proceeds of July 2017 equity raise were NIS25.6m.
INDUSTRY OUTLOOK
We expect Allium’s growth to accelerate in the medium term, driven by new markets,resulting in 2016-20e revenue CAGR of 46%. Allium also has two devices in preclinicaldevelopment: Allevetix for diabetes and obesity (start a clinical trial in 2017) and TruLeaf, amitral valve replacement device that will develop until completion of clinical trial. GardiaMedical’s Wirion device has met the primary endpoint of its clinical trial, important forstrategic partnering discussions.
Y/E Dec Revenue EBITDA PBT EPS P/E P/CF(NISm) (NISm) (NISm) (NIS) (x) (x)
2015 5.2 (16.3) (18.5) (0.65) N/A N/A
2016 7.4 (20.4) (22.0) (0.49) N/A N/A
2017e 9.7 (19.5) (20.3) (0.35) N/A N/A
2018e 16.6 (6.8) (7.3) (0.11) N/A N/A
5Edison Healthcare Insight | 20 September 2017

Sector: Pharma & healthcare
Price: 36.8pMarket cap: £27mMarket AIM
Share price graph (p)
Company descriptionAngle is a world leading liquid biopsycompany with a potentially disruptiveplatform technology. The patentedParsortix cell separation platform canharvest circulating tumour cells andother very rare cells from a bloodsample for downstream analysis.
Price performance% 1m 3m 12mActual (18.3) (42.1) (42.6)Relative* (17.7) (40.8) (47.7)* % Relative to local indexAnalystDr Jonas Peciulis
Angle (AGL)
INVESTMENT SUMMARY
Angle's patented Parsortix cell separation platform is used to detect and harvest circulatingtumour cells (CTCs) from blood. CTCs provide the complete picture since viable, intactCTCs can be used for DNA, RNA and protein analysis as well as culturing and xenograftmodels. Recently the company reported initial results from its two lead clinical studies(n=200 each) for triaging women with ovarian masses before surgery. Reported sensitivitywas up to 95%, while specificity was significantly higher than existing tests. The company isnow optimizing the assay before undertaking clinical validation studies. Another key catalystis the completion of the FDA clinical studies in breast cancer expected in H118, which is apart of the approval process in the US. More recently Angle has announced a co-marketingagreement with Qiagen, which could boost research use sales, which in FY17 were £498k,up from initial sales of £361k in H216. Clinical use sales represent much larger potential inthe future. We are updating our estimates.
INDUSTRY OUTLOOK
The precision medicine approach is an initiative aiming to improve treatment efficacy bytailoring the treatment to the patient and their disease with liquid biopsy being one of the keyenabling tools.
Y/E Apr Revenue EBITDA PBT EPS P/E P/CF(£m) (£m) (£m) (p) (x) (x)
2016 0.4 (4.9) (5.0) (7.97) N/A N/A
2017 0.5 (6.7) (6.9) (8.03) N/A N/A
2018e N/A N/A N/A N/A N/A N/A
2019e N/A N/A N/A N/A N/A N/A
Sector: Pharma & healthcare
Price: 200.0pMarket cap: £192mMarket LSE
Share price graph (p)
Company descriptionArix Bioscience is a life sciencesportfolio company specialising intherapeutic and diagnostic companies.The portfolio currently includes directand indirect investments across the lifesciences.
Price performance% 1m 3m 12mActual 8.1 (3.7) N/ARelative* 9.0 (1.5) N/A* % Relative to local indexAnalystMaxim Jacobs
Arix Bioscience (ARIX)
INVESTMENT SUMMARY
Arix is a new transatlantic life sciences portfolio company drawing from managerialexpertise at all levels of the pharma industry to engage in opportunities ranging from seedinvesting to public equity. It draws on a network of deal sources established throughagreements with academia, life science accelerators, other funds, and through partnershipswith big pharma. The portfolio currently includes a number of direct investments (Depixus,Artios, OptiKira, Autolus, Verona, Iterum, Harpoon, Mitoconix, LogicBio PreciThera andAmplyx), and Arix is taking an active role in the operations of these companies with boardpositions in each.
INDUSTRY OUTLOOK
Biopharma venture investing has historically outperformed the broader market, and Arix'spermanent capital model allows it to capitalize on these opportunities without being boundto specific exit timing.
Y/E Dec Revenue EBITDA PBT EPS P/E P/CF(£m) (£m) (£m) (p) (x) (x)
2015 N/A N/A N/A N/A N/A N/A
2016 0.0 (2.2) (2.2) (21.52) N/A N/A
2017e 5.3 (5.1) (4.5) (4.68) N/A N/A
2018e 2.1 (6.0) (0.5) (0.49) N/A N/A
6Edison Healthcare Insight | 20 September 2017

Sector: Pharma & healthcare
Price: US$0.61Market cap: US$7mMarket NASDAQ
Share price graph (US$)
Company descriptionBased in Seattle, WA, Atossa Geneticsis focused on the development oflocally administered pharmaceuticalsfor the treatment of pre-cancer andearly-stage breast cancer. Leadcandidate afimoxigene topical gel isexpected to start a Phase II study in2016 in breast hyperplasia or DCIS.
Price performance% 1m 3m 12mActual 67.4 22.2 (73.1)Relative* 65.4 19.4 (77.1)* % Relative to local indexAnalystPooya Hemami
Atossa Genetics (ATOS)
INVESTMENT SUMMARY
Atossa is advancing oral endoxifen, a metabolite of tamoxifen, as a potential treatment forbreast cancer patients refractory to tamoxifen. About 20-25% of the 1.0m women takingtamoxifen worldwide develop resistance to it, and have an increased risk for cancerrecurrence. Atossa is also advancing a topical endoxifen formulation to treat high breastdensity, a possible precursor to cancer. The firm recently completed a 48-pt Phase I studyon endoxifen. Atossa is also advancing its proprietary intraductal microcatheter (IDMC),intended to selectively introduce drugs to breast ducts, potentially improving drug targetingfor chemotherapy. It is combining its IDMC with established cancer drug fulvestrant andopened enrolment for a 30-patient Phase II study in March 2016.
INDUSTRY OUTLOOK
IDMC-fulvestrant development may hinge on future FDA guidance on whether the projectscan fall under the 505(b)2 development pathway, which would reduce the breadth of clinicaldata needed to support a marketing application. Atossa had $3.7 net cash at Q217, whichwe estimate extends its runway into Q417.
Y/E Dec Revenue EBITDA PBT EPS P/E P/CF(US$m) (US$m) (US$m) (c) (x) (x)
2015 0.0 (9.5) (9.8) (514.81) N/A N/A
2016 0.0 (6.9) (7.3) (245.98) N/A N/A
2017e 0.0 (9.7) (9.9) (210.84) N/A N/A
2018e 0.0 (10.9) (11.2) (216.54) N/A N/A
Sector: Pharma & healthcare
Price: CHF80.40Market cap: CHF953mMarket Swiss Stock Exchange
Share price graph (CHF)
Company descriptionBasilea is a Swiss biopharmaceuticalcompany focused on anti-infectivesand oncology. Its lead products areCresemba, an antifungal that isapproved in the US and Europe andZevtera, an anti-MRSAbroad-spectrum antibiotic, approved inEurope for pneumonia.
Price performance% 1m 3m 12mActual 0.7 4.5 14.2Relative* 0.2 1.9 2.8* % Relative to local indexAnalystDr Susie Jana
Basilea Pharmaceutica (BSLN)
INVESTMENT SUMMARY
Basilea has two approved hospital-based products: Cresemba for severe mold infectionsand Zevtera for bacterial infections. Zevtera should enter US phase III development in thenext 3-6 months following agreement of the SPA with the FDA and the award of a BARDAcontract (worth up to $108m). Basilea's earlier-stage oncology pipeline focuses on drugsthat target resistance to current cancer therapies. BAL101553 is being developed as atumor checkpoint controller and recently presented final phase I/IIa data at ASCO.BAL3833, a panRAF kinease inhibitor, is in Phase I development. Our forecasts are underreview following the announcement of the major license agreement with Pfizer forCresemba commercialisation in Europe (ex Nordics), Russia, Turkey and Israel and thedistribution agreement with Cardiome for Zevtera in Europe and Israel.
INDUSTRY OUTLOOK
There is an increasing need for novel antimicrobial agents with efficacy against resistantstrains of bacteria (eg MRSA), and/or improved side effect profiles. Hence the opportunitiesfor Zevtera and Cresemba could be significant.
Y/E Dec Revenue EBITDA PBT EPS (fd) P/E P/CF(CHFm) (CHFm) (CHFm) (CHFc) (x) (x)
2015 52.8 (58.9) (61.3) (607.22) N/A N/A
2016 66.0 (41.6) (50.9) (505.74) N/A N/A
2017e N/A N/A N/A N/A N/A N/A
2018e N/A N/A N/A N/A N/A N/A
7Edison Healthcare Insight | 20 September 2017

Sector: Pharma & healthcare
Price: NIS15.06Market cap: NIS55mMarket TASE
Share price graph (NIS)
Company descriptionBased in Israel, BioLight is anemerging ophthalmic companyfocused on the development andcommercialisation of products andproduct candidates that address ocularconditions. Lead products IOPtiMateand VS-101 are directed towards thetreatment of glaucoma.
Price performance% 1m 3m 12mActual 5.0 18.7 12.3Relative* 2.9 19.4 9.7* % Relative to local indexAnalystPooya Hemami
Bio-Light Life Sciences (BOLT)
INVESTMENT SUMMARY
BioLight Life Sciences is advancing several eyecare products and technologies. It's IOPtimasubsidiary (of which it holds a 70% stake) markets IOPtiMate, a laser-based surgical deviceto treat moderate to advanced glaucoma. BioLight is also advancing Eye-D VS-101, anextended-dose latanoprost drug implant designed to treat glaucoma that recently reportedpositive data in a Phase I/IIa trial, and TeaRx, a dry eye syndrome diagnostic test. VS-101can be helpful for the 20-60% of glaucoma patients who do not comply with daily eye droptherapy.
INDUSTRY OUTLOOK
IOPtima signed a non-binding term sheet in April 2017 for it to be acquired by ChengduKanghong Pharma. While there is uncertainty on whether the deal will proceed, thetransaction could potentially provide IOPtima shareholders with $17m (NIS62m) within sixmonths of completion. This amount will be allocated to IOPtima shareholders on a pro ratabasis according to the preferences assigned to different classes of IOPtima shares, and thepotential allocation to BioLight has not been disclosed. BioLight’s H117 net cash position ofNIS25.5m (with NIS13.5m held at the parent company and the remainder at its subsidiaries)should be sufficient for the company to maintain operations into Q417.
Y/E Dec Revenue EBITDA PBT EPS P/E P/CF(NISm) (NISm) (NISm) (NIS) (x) (x)
2015 1.4 (24.3) (25.1) (6.96) N/A N/A
2016 2.1 (20.2) (26.3) (5.55) N/A N/A
2017e 2.2 (27.2) (30.1) (6.88) N/A N/A
2018e 8.9 (32.1) (34.6) (8.81) N/A N/A
Sector: Pharma & healthcare
Price: NIS0.62Market cap: NIS120mMarket TASE
Share price graph (NIS)
Company descriptionBiondVax is developing a potentiallyuniversal influenza vaccine and thelead candidate M-001 could bepositioned as a primer for seasonal orpandemic vaccines or as a standaloneinfluenza vaccine. So far M-001 hasbeen tested in two Phase I/II and threePhase II trials and consistentlydemonstrated immunogenicity tomultiple virus strains.Price performance% 1m 3m 12mActual (18.1) (9.3) 69.7Relative* (19.8) (8.7) 65.8* % Relative to local indexAnalystDr Jonas Peciulis
BiondVax Pharmaceuticals (BVXV)
INVESTMENT SUMMARY
BiondVax with its epitope-based multimeric vaccine candidate M-001 is among the leadersin the development of the universal influenza vaccine worldwide. In July 2017, the companyannounced positive Phase IIb trial results with both primary endpoints achieved (safety andinfluenza-specific cellular immune responses).Before that M-001 was tested in two Phase I/II and three Phase II trials involving 479participants in total and was shown to be consistently safe and immunogenic, anddemonstrated synergy with conventional flu vaccines. At end-Q217, BiondVax had cash of$9.6m (NIS37m), but also have access to €20m following loan agreement with theEuropean Investment Bank. This will support the development of M-001 well into Phase III,which is now in planning stage.
INDUSTRY OUTLOOK
Current influenza vaccines are solely strain specific, needs to be updated every year withthe effectiveness still lingering around 40%. There is a clear need for a more reliablevaccine that is both more immunoprotective and with coverage against a wider range of flustrains for the entire population and in particular for the elderly.
Y/E Dec Revenue EBITDA PBT EPS P/E P/CF(NISm) (NISm) (NISm) (NIS) (x) (x)
2015 0.0 (10.7) (10.2) (0.10) N/A N/A
2016 0.0 (11.3) (9.2) (0.07) N/A N/A
2017e 0.0 (14.7) (15.2) (0.10) N/A N/A
2018e 0.0 (19.0) (20.1) (0.12) N/A N/A
8Edison Healthcare Insight | 20 September 2017

Sector: Pharma & healthcare
Price: €24.80Market cap: €147mMarket Alternext Paris
Share price graph (€)
Company descriptionCarmat is developing a biocompatible,artificial heart to satisfy the lack ofdonor hearts available for terminalheart failure patients. The developmentprocess combines the expertise of awide range of technical and medicalexperts.
Price performance% 1m 3m 12mActual (0.6) (11.4) (37.0)Relative* (2.7) (11.2) (47.5)* % Relative to local indexAnalystPooya Hemami
Carmat (ALCAR)
INVESTMENT SUMMARY
Carmat obtained approval in May 2017 from the French regulatory agency (ANSM) toresume its pivotal trial for the Carmat heart. This follows a favourable review by ANSM ofthe actions and analyses taken by Carmat following the trial’s suspension after the death inQ416 of this trial’s first patient six weeks after his implantation. Carmat is now working toexpand access in the 20-25-patient study to other European countries, and is preparing anew and more automated production site. Given the firm’s year-end 2016 net cash positionof €28.0m, we estimate Carmat can finance operations into Q218.
INDUSTRY OUTLOOK
The Carmat artificial heart is being developed as a permanent replacement or destinationtherapy (DT) for chronic biventricular heart failure or acute myocardial infarction patients,who do not have access to a human donor heart. Despite the high EU and US prevalence ofStage IV heart failure (c 500,000 patients), the shortfall in donor hearts is such that onlyabout 3,800 human heart transplants were performed in Europe and the US in 2013.
Y/E Dec Revenue EBITDA PBT EPS P/E P/CF(€m) (€m) (€m) (c) (x) (x)
2015 0.0 (19.4) (20.6) (381.32) N/A N/A
2016 0.3 (24.1) (25.7) (379.73) N/A N/A
2017e 0.0 (22.0) (22.1) (367.12) N/A N/A
2018e 0.0 (24.7) (26.3) (435.57) N/A N/A
Sector: Pharma & healthcare
Price: €44.52Market cap: €424mMarket Euronext Brussels
Share price graph (€)
Company descriptionCelyad is developing an innovativeNatural Killer Receptor CAR T-celltherapy (CYAD-01). This targetstargets five solid and two hematologiccancers in the THINK study. Acolorectal cancer study withchemotherapy (SHRINK) is underway.
Price performance% 1m 3m 12mActual 23.7 6.4 127.7Relative* 21.2 4.0 100.0* % Relative to local indexAnalystDr John Savin
Celyad (CYAD)
INVESTMENT SUMMARY
Celyad uses a novel Natural Killer Receptor CAR T-cell approach with the US and EUTHINK Phase Ib trial underway in AML and MM plus five solid tumours (ovarian, triplenegative breast, bladder, colorectal and pancreatic). In the first dose cohort, two colorectalpatients showed stable disease after three months; no toxicity was seen. The SHRINK trialis underway in mCRC with FOLFOX therapy; combining T-cell therapy with chemotherapywill be necessary in solid cancers. Celyad has paid $25m in cash and shares to reduce theNKR royalties payable. Cash on 30 June was €66.8m.
INDUSTRY OUTLOOK
The August FDA approval of Novartis' Kymriah, a CD19 CAR T-cell for ALL, shows thatCAR-T therapy can be approved. Kite's Axi-cell therapy for DLBCL may be approved byNovember. Celyad's NKR CAR T-cells target ubiquitous "stress" cancer antigens. Celyadalso has a leading position in allogeneic therapy; Novartis has a non-exclusive licence in a$96m deal. Options for C-Cure cardiac therapy are being explored.
Y/E Dec Revenue EBITDA PBT EPS P/E P/CF(€m) (€m) (€m) (c) (x) (x)
2015 0.0 (27.8) (27.6) (317.0) N/A N/A
2016 8.5 (24.1) (22.8) (209.0) N/A N/A
2017e 8.3 (26.7) (27.2) (286.0) N/A N/A
2018e 9.0 (24.7) (25.2) (265.0) N/A N/A
9Edison Healthcare Insight | 20 September 2017

Sector: Pharma & healthcare
Price: NIS0.43Market cap: NIS58mMarket TASE
Share price graph (NIS)
Company descriptionCollPlant is an Israel-basedregenerative medicine company. It isfocused on developing andcommercialising tissue repair productswith its plant-based technology,rhCollagen. It has two products on themarket, VergenixSTR andVergenixFG.
Price performance% 1m 3m 12mActual 39.2 9.9 (54.8)Relative* 36.4 10.6 (55.8)* % Relative to local indexAnalystDr Linda Pomeroy
Collplant Holdings (CLPT)
INVESTMENT SUMMARY
CollPlant’s investment story is built on the versatility of its plant-based technology,rhCollagen, and its application in regenerative medicine. It has strong potential acrossvarious subsectors, initially focusing on orthobiologics, advanced wound care and 3Dprinting of tissue and organs. Two products have recently been launched: VergenixFG,targeting chronic and acute wounds, and VergenixSTR, targeting tendinopathy. 2016 wasan important year for CollPlant as it completed a clinical study and received its CE approvalfor VergenixSTR, entered into an exclusive distribution agreement with Arthrex tocommercialise VergenixSTR in EMEA and launched VergenixFG in Europe. We expectCollPlant to build on this progress in 2017 by increasing its distribution of VergenixFG andorders from Arthrex, alongside developing its earlier-stage rhCollagen technology BioInk for3D printing of organs and tissues. Recent announcement of a $5m placing leaves thecompany well-financed to progress.
INDUSTRY OUTLOOK
Orthobiologics and advanced wound care are substantial growing markets and areestimated to be worth $6.7bn (according to GlobalData) and $8.5bn (according to Smith &Nephew) respectively.
Y/E Dec Revenue EBITDA PBT EPS P/E P/CF(NISm) (NISm) (NISm) (NIS) (x) (x)
2015 0.0 (18.0) (18.7) (22.03) N/A N/A
2016 0.3 (27.0) (27.9) (27.72) N/A N/A
2017e 1.3 (15.5) (16.3) (12.72) N/A N/A
2018e 2.9 (17.2) (17.8) (13.86) N/A N/A
Sector: Pharma & healthcare
Price: €5.45Market cap: €48mMarket Euronext Paris
Share price graph (€)
Company descriptionCrossject develops new therapeuticentities to be administered using itsproprietary, needle-free injectionsystem, ZENEO. Crossject has sevenproducts in its development pipeline,including products for rheumatoidarthritis, anaphylactic shock, migraineand Parkinson’s.
Price performance% 1m 3m 12mActual 2.8 (5.2) (30.6)Relative* 0.7 (5.0) (42.2)* % Relative to local indexAnalystMaxim Jacobs
Crossject (ALCJ)
INVESTMENT SUMMARY
Crossject has developed a deep pipeline of products that are based on its proprietaryneedle-free injection system, ZENEO, across a variety of indications. The benefits ofZENEO include no need for needles, as well as a simple and quick (~1/10th of a second)delivery of the drug. Its first commercial product, ZENEO Sumatriptan for the acutetreatment of migraines, should reach the market in 2019. The next products to reach themarket include ZENEO Midazolam and ZENEO Adrenaline for epilepsy and anaphylacticshock, respectively. They should reach the market in 2019/20.
INDUSTRY OUTLOOK
Traditional injections have multiple issues with them which inhibit patient acceptance. Theseoften include: lack of convenience, a multi-step injection process, difficulty in performing theinjection correctly, and difficulty delivering the injection to the right tissue, particularly foroverweight patients.
Y/E Dec Revenue EBITDA PBT EPS P/E P/CF(€m) (€m) (€m) (c) (x) (x)
2014 1.7 (4.1) (5.3) (65.64) N/A N/A
2015 2.4 (5.5) (6.7) (85.33) N/A N/A
2016e 1.4 (5.6) (7.3) (85.19) N/A N/A
2017e 2.9 (4.7) (5.4) (43.99) N/A N/A
10Edison Healthcare Insight | 20 September 2017

Sector: Pharma & healthcare
Price: 10.6pMarket cap: £29mMarket AIM
Share price graph (p)
Company descriptione-Therapeutics is a UK-based drugdiscovery company that has developeda proprietary network pharmacologydiscovery platform. Its focus is now oncommercialisation: securing partnersfor its discovery and developmentprojects.
Price performance% 1m 3m 12mActual (1.2) 2.4 (1.2)Relative* (0.4) 4.8 (10.0)* % Relative to local indexAnalystDr Charlotte Hetzel
e-Therapeutics (ETX)
INVESTMENT SUMMARY
e-Therapeutics (ETX) offers public market investors a unique opportunity to gain exposureto a proprietary, cutting-edge in silico drug discovery platform that has already attractedsignificant investment and has been fully operational since 2014. This second-generationplatform has generated new chemical entities (NCEs) in several different disease areasand, under a new CEO, is on the cusp of commercial validation. The priority for thecompany is securing deals to provide external validation of this approach. ETX’s strength isits discovery capability, particularly in complex disease; it also has two internal discoveryprojects with the prospect of more to come.
INDUSTRY OUTLOOK
Network-driven approaches could potentially revolutionise drug discovery and shorten thepath to market by minimising technical risks and drug development costs. ETX isdifferentiated from its competitors through its expertise in curating, processing andanalysing data in the context of mechanistic modelling of disease.
Y/E Jan Revenue EBITDA PBT EPS P/E P/CF(£m) (£m) (£m) (p) (x) (x)
2016 0.0 (11.3) (11.1) (3.3) N/A N/A
2017 0.0 (13.5) (13.4) (3.9) N/A N/A
2018e 0.0 (8.9) (8.9) (2.6) N/A N/A
2019e 0.0 (9.0) (9.0) (2.7) N/A N/A
Sector: Pharma & healthcare
Price: €1.70Market cap: €132mMarket Euronext Paris
Share price graph (€)
Company descriptionGenticel and privately-held companyGenkyotex have signed a contributionagreement to form a combined entityfocused on the development of NOXinhibitors for fibrosis and otherindications. The transaction has beenapproved by Genticel’s shareholders.
Price performance% 1m 3m 12mActual (9.1) (17.1) 2.4Relative* (11.0) (16.9) (14.7)* % Relative to local indexAnalystJuan Pedro Serrate
Genkyotex (GKTX)
INVESTMENT SUMMARY
Genkyotex is a biotech company focused on NOX science and the development of smallmolecule NOX inhibitors for fibrosis and inflammation. Lead product GKT831 is in a Phase IIclinical trial in primary biliary cholangitis (PBC) with data in 2018. Second product GKT771is in advanced preclinical stage and will be Phase I ready by end 2017 and focus oninflammation and angiogenesis. A Phase II investigator-sponsored trial in patients with Type1 diabetes (T1D) and kidney disease will start in Australia in H217. The company also has aportfolio of early stage NOX inhibitors for oncology, hearing loss and neurology indications.Genkyotex has partnership with the Serum Institute of India Ltd (SIIL) which involves up to$57m of milestone payments and single-digit royalties on net sales. Cash and equivalentswere €18.1m at 30 June 2017, sufficient until 2018.
INDUSTRY OUTLOOK
The new company is focused on NOX science, an enzyme complex that generates reactiveoxygen species (ROS). Increased NOX activity has been linked to various diseases; inparticular to metabolic and cardiovascular diseases and neurodegeneration.
Y/E Dec Revenue EBITDA PBT EPS P/E P/CF(€m) (€m) (€m) (c) (x) (x)
2014 N/A N/A N/A N/A N/A N/A
2015 N/A N/A N/A N/A N/A N/A
2016e 1.3 (21.7) (21.7) (27.8) N/A N/A
2017e 0.0 (12.0) (12.0) (15.4) N/A N/A
11Edison Healthcare Insight | 20 September 2017

Sector: Pharma & healthcare
Price: US$107.14Market cap: US$2700mMarket NASDAQ
Share price graph (US$)
Company descriptionGW is a UK-based speciality pharmacompany developing cannabinoidmedicines. Lead pipeline candidateEpidiolex is undergoing Phase III trialsfor childhood epilepsy. Sativex ismarketed by partners in a number ofEU countries for MS spasticity.
Price performance% 1m 3m 12mActual 4.7 8.4 4.9Relative* 3.5 5.9 (10.7)* % Relative to local indexAnalystMaxim Jacobs
GW Pharmaceuticals (GWPH)
INVESTMENT SUMMARY
GW Pharmaceuticals (GW) is developing an extensive cannabinoid portfolio with potentialto treat a broad range of diseases. The lead pipeline asset is Epidiolex, now undergoing amultiple Phase III clinical study program for refractory childhood epilepsies. Initial top-linePhase III data from their one trial in Dravet syndrome and two trials in Lennox-Gastautsyndrome (LGS) were all statistically significant. A rolling NDA submission has commencedand is expected to be completed in October. A filing in the EU is expected in Q417. Theyhave also commenced Phase III trials in Tuberous Sclerosis Complex (TSC) and infantilespasms (IS).
INDUSTRY OUTLOOK
GW is the leading player in cannabinoid medicines. Cannabinoids are diverse chemicalcompounds that GW extracts from cannabis plant varieties (chemotypes) it has bred.Epidiolex has the potential to treat a broad range of treatment-refractory epilepsy conditions,while the portfolio extends to other orphan indications such as TSC epilepsy and NHIE.
Y/E Sep Revenue EBITDA PBT EPS P/E P/CF(US$m) (US$m) (US$m) (c) (x) (x)
2015 37.1 (70.9) (72.5) (274.14) N/A N/A
2016 13.4 (109.1) (110.3) (345.47) N/A N/A
2017e 12.1 (166.8) (167.4) (568.42) N/A N/A
2018e 12.9 (161.6) (162.6) (551.07) N/A N/A
Sector: Pharma & healthcare
Price: 3742.5pMarket cap: £2273mMarket AIM, NASDAQ
Share price graph (p)
Company descriptionHutchison China MediTech (HCM) isan innovative China-based biopharmacompany targeting the global marketfor novel, highly selective oraloncology and immunology drugs. Itsestablished China Healthcare businessis growing ahead of the market. HCMis the healthcare arm of CK Hutchison(c 40% listed on AIM and NASDAQ).Price performance% 1m 3m 12mActual 1.9 16.5 104.0Relative* 2.7 19.2 85.8* % Relative to local indexAnalystDr Susie Jana
Hutchison China MediTech (HCM)
INVESTMENT SUMMARY
HCM has built a substantial pipeline of potential first-in-class or best-in-class tyrosine kinaseinhibitor (TKI) drugs, some of which are in development with strategic partners. HCM havesubmitted a new drug application (partnered with Eli Lilly) for fruquintinib in CRC to theChina FDA (full Phase III CRC data [China] was presented at ASCO 2017), marking a majormilestone in the company's life. Separately in collaboration with AstraZeneca, HCM haveinitated SAVOIR, a global Phase III trial of savolitinib in PRCC. PBT excludes the earningscontributions from JVs, which in 2016 reported at $66.2m (as equity in investees, net of tax).
INDUSTRY OUTLOOK
HCM’s profitable Chinese healthcare business continues to benefit from the fast-growingdomestic market, while the clinical, regulatory and technological environments are highlyconducive to novel drug development. In the longer term, if the oncology and immunologypipeline comes to fruition, HCM has the potential to become a global oncology andimmunology player.
Y/E Dec Revenue EBITDA PBT EPS P/E P/CF(US$m) (US$m) (US$m) (c) (x) (x)
2015 178.2 (7.8) (10.5) 14.6 332.5 N/A
2016 216.1 (44.3) (47.4) 19.6 247.7 N/A
2017e 234.2 (48.6) (53.8) (34.9) N/A N/A
2018e 262.5 (30.9) (36.9) (16.0) N/A N/A
12Edison Healthcare Insight | 20 September 2017
Sector: Pharma & healthcare
Price: €0.60Market cap: €28mMarket Alternext Paris
Share price graph (€)
Company descriptionHybrigenics is a French biotechcompany. It provides protein-proteinand small molecule analysis servicesand is conducting anti-cancer studieson lead drug inecalcitol, primarily inadult leukaemias.
Price performance% 1m 3m 12mActual 3.4 (20.5) (31.8)Relative* 1.3 (20.3) (43.2)* % Relative to local indexAnalystJuan Pedro Serrate
Hybrigenics (ALHYG)
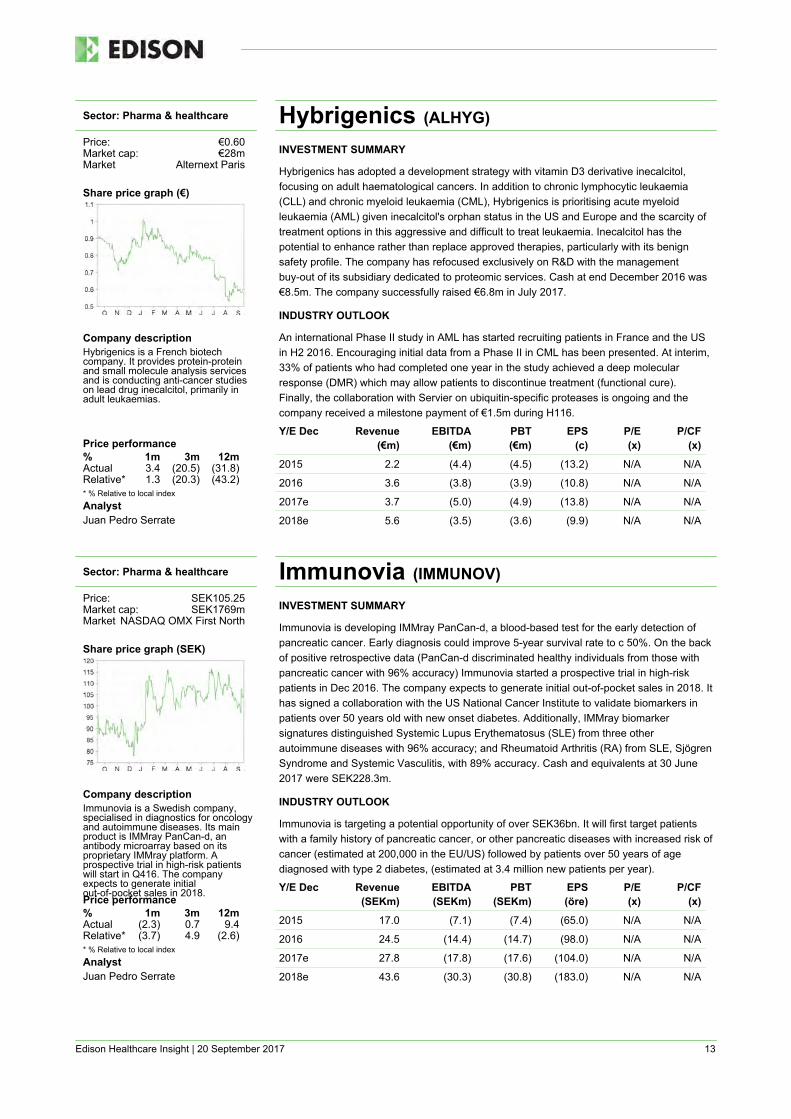
INVESTMENT SUMMARY
Hybrigenics has adopted a development strategy with vitamin D3 derivative inecalcitol,focusing on adult haematological cancers. In addition to chronic lymphocytic leukaemia(CLL) and chronic myeloid leukaemia (CML), Hybrigenics is prioritising acute myeloidleukaemia (AML) given inecalcitol's orphan status in the US and Europe and the scarcity oftreatment options in this aggressive and difficult to treat leukaemia. Inecalcitol has thepotential to enhance rather than replace approved therapies, particularly with its benignsafety profile. The company has refocused exclusively on R&D with the managementbuy-out of its subsidiary dedicated to proteomic services. Cash at end December 2016 was€8.5m. The company successfully raised €6.8m in July 2017.
INDUSTRY OUTLOOK
An international Phase II study in AML has started recruiting patients in France and the USin H2 2016. Encouraging initial data from a Phase II in CML has been presented. At interim,33% of patients who had completed one year in the study achieved a deep molecularresponse (DMR) which may allow patients to discontinue treatment (functional cure).Finally, the collaboration with Servier on ubiquitin-specific proteases is ongoing and thecompany received a milestone payment of €1.5m during H116.
Y/E Dec Revenue EBITDA PBT EPS P/E P/CF(€m) (€m) (€m) (c) (x) (x)
2015 2.2 (4.4) (4.5) (13.2) N/A N/A
2016 3.6 (3.8) (3.9) (10.8) N/A N/A
2017e 3.7 (5.0) (4.9) (13.8) N/A N/A
2018e 5.6 (3.5) (3.6) (9.9) N/A N/A
Sector: Pharma & healthcare
Price: SEK105.25Market cap: SEK1769mMarket NASDAQ OMX First North
Share price graph (SEK)
Company descriptionImmunovia is a Swedish company,specialised in diagnostics for oncologyand autoimmune diseases. Its mainproduct is IMMray PanCan-d, anantibody microarray based on itsproprietary IMMray platform. Aprospective trial in high-risk patientswill start in Q416. The companyexpects to generate initialout-of-pocket sales in 2018.Price performance% 1m 3m 12mActual (2.3) 0.7 9.4Relative* (3.7) 4.9 (2.6)* % Relative to local indexAnalystJuan Pedro Serrate
Immunovia (IMMUNOV)
INVESTMENT SUMMARY
Immunovia is developing IMMray PanCan-d, a blood-based test for the early detection ofpancreatic cancer. Early diagnosis could improve 5-year survival rate to c 50%. On the backof positive retrospective data (PanCan-d discriminated healthy individuals from those withpancreatic cancer with 96% accuracy) Immunovia started a prospective trial in high-riskpatients in Dec 2016. The company expects to generate initial out-of-pocket sales in 2018. Ithas signed a collaboration with the US National Cancer Institute to validate biomarkers inpatients over 50 years old with new onset diabetes. Additionally, IMMray biomarkersignatures distinguished Systemic Lupus Erythematosus (SLE) from three otherautoimmune diseases with 96% accuracy; and Rheumatoid Arthritis (RA) from SLE, SjögrenSyndrome and Systemic Vasculitis, with 89% accuracy. Cash and equivalents at 30 June2017 were SEK228.3m.
INDUSTRY OUTLOOK
Immunovia is targeting a potential opportunity of over SEK36bn. It will first target patientswith a family history of pancreatic cancer, or other pancreatic diseases with increased risk ofcancer (estimated at 200,000 in the EU/US) followed by patients over 50 years of agediagnosed with type 2 diabetes, (estimated at 3.4 million new patients per year).
Y/E Dec Revenue EBITDA PBT EPS P/E P/CF(SEKm) (SEKm) (SEKm) (öre) (x) (x)
2015 17.0 (7.1) (7.4) (65.0) N/A N/A
2016 24.5 (14.4) (14.7) (98.0) N/A N/A
2017e 27.8 (17.8) (17.6) (104.0) N/A N/A
2018e 43.6 (30.3) (30.8) (183.0) N/A N/A
13Edison Healthcare Insight | 20 September 2017

Sector: Pharma & healthcare
Price: NIS26.69Market cap: NIS693mMarket TASE
Share price graph (NIS)
Company descriptionIntec Pharma is a drug deliverycompany that has developed theaccordion pill, a novel gastroretentivecontrolled release formulation. Thecompany is currently using thistechnology to develop AP-CDLD forParkinson’s in Phase III and AP-ZP forinsomnia in Phase II.
Price performance% 1m 3m 12mActual 44.7 37.6 17.8Relative* 41.7 38.5 15.1* % Relative to local indexAnalystMaxim Jacobs
Intec Pharma (NTEC)
INVESTMENT SUMMARY
Intec Pharma is a drug delivery company that has developed a novel drug delivery devicetermed the accordion pill (AP), a folded, multilayer membrane packaged into a normalcapsule, which expands to a sheet within the stomach to many times its original size. Thisproperty causes the pill to be retained in the stomach for up to 12 hours. This is ideal fordrugs with local activity in the stomach or upper digestive tract or with poor solubility.AP-CDLD, a controlled release formulation of carbidopa and levodopa for Parkinson’s is inPhase III with enrollment expected to complete by YE17 with data in mid-2018. They havealso completed a Phase I trial of AP-CBD/THC, their cannabinoid program and will make anannouncement regarding its future by YE17.
INDUSTRY OUTLOOK
Parkinson’s disease is a neurodegenerative disease in which the dopamine secretingneurons in the brain are lost, leading to severe motor defects and cognitive impairment.Approximately one million people in the US have Parkinson’s.
Y/E Dec Revenue EBITDA PBT EPS P/E P/CF(US$m) (US$m) (US$m) (c) (x) (x)
2015 0.0 (8.3) (7.2) (92.16) N/A N/A
2016 0.0 (14.5) (13.4) (116.72) N/A N/A
2017e 0.0 (21.7) (20.8) (78.49) N/A N/A
2018e 0.0 (18.3) (17.3) (62.26) N/A N/A
Sector: Pharma & healthcare
Price: US$1.64Market cap: US$7mMarket OTCQX
Share price graph (US$)
Company descriptionInternational Stem Cell is anearly-stage biotechnology companydeveloping therapeutic, biomedical andcosmeceutical applications for itsproprietary stem form of pluripotentstem cells – human parthenogeneticstem cells (hpSCs). Its lead candidateis a cell therapy treatment forParkinson’s disease.Price performance% 1m 3m 12mActual 21.5 33.3 (11.4)Relative* 20.0 30.3 (24.5)* % Relative to local indexAnalystMaxim Jacobs
International Stem Cell (ISCO)
INVESTMENT SUMMARY
International Stem Cell (ISCO) is an early-stage cell therapy company currently in PhaseI/IIa clinical trials to treat Parkinson’s disease (PD), and is currently dosing the secondcohort of patients (6 so far). The company is also preparing to initiate a Phase II trial intraumatic brain injury in the coming months. With its hpSC technology, ISCO has created 15stem cell lines, each of which is a different HLA type. From this, it creates different cell typessuch as liver cells, neural cells and three-dimensional eye structures. In addition, ISCO sellsskincare and biomedical supplies to the market, generating $7.2m in sales and $1.3m inunderlying operating profit in 2016.
INDUSTRY OUTLOOK
ISCO’s technology platform is based on human parthenogenetic stem cells (hpSCs).Parthenogenetic stem cells are created from unfertilized human eggs (oocytes) chemicallyactivated to make the cells pluripotent. As hpSCs express fewer parental histocompatibilityantigens, they reduce the risk of immune rejection.
Y/E Dec Revenue EBITDA PBT EPS P/E P/CF(US$m) (US$m) (US$m) (c) (x) (x)
2015 7.6 (5.0) (4.6) (129.29) N/A N/A
2016 7.2 (5.2) (4.9) (33.82) N/A N/A
2017e 7.6 (4.6) (4.9) (122.16) N/A N/A
2018e 8.3 (7.3) (8.2) (196.08) N/A N/A
14Edison Healthcare Insight | 20 September 2017
Sector: Pharma & healthcare
Price: €5.60Market cap: €82mMarket Euronext Amsterdam
Share price graph (€)
Company descriptionKiadis Pharma is a biotech companyfocused on cell-basedimmunotherapies to overcomecomplications associated with stemcell transplants in blood diseases.ATIR101 for leukaemia is in Phase IIand will file for EU approval in Q117.ATIR201 (thalassemia) started aPhase I/II in December 2016.Price performance% 1m 3m 12mActual (5.1) (12.3) (49.1)Relative* (6.6) (13.6) (57.6)* % Relative to local indexAnalystJuan Pedro Serrate
Kiadis Pharma (KDS)
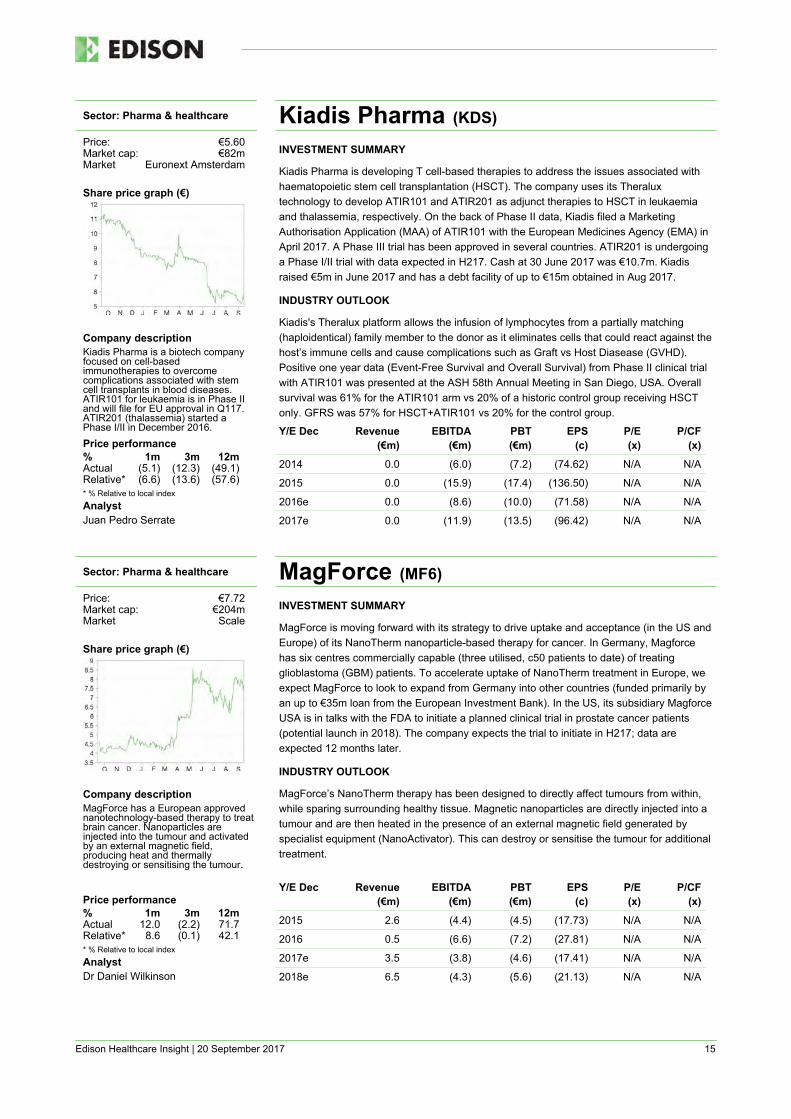
INVESTMENT SUMMARY
Kiadis Pharma is developing T cell-based therapies to address the issues associated withhaematopoietic stem cell transplantation (HSCT). The company uses its Theraluxtechnology to develop ATIR101 and ATIR201 as adjunct therapies to HSCT in leukaemiaand thalassemia, respectively. On the back of Phase II data, Kiadis filed a MarketingAuthorisation Application (MAA) of ATIR101 with the European Medicines Agency (EMA) inApril 2017. A Phase III trial has been approved in several countries. ATIR201 is undergoinga Phase I/II trial with data expected in H217. Cash at 30 June 2017 was €10.7m. Kiadisraised €5m in June 2017 and has a debt facility of up to €15m obtained in Aug 2017.
INDUSTRY OUTLOOK
Kiadis's Theralux platform allows the infusion of lymphocytes from a partially matching(haploidentical) family member to the donor as it eliminates cells that could react against thehost’s immune cells and cause complications such as Graft vs Host Diasease (GVHD).Positive one year data (Event-Free Survival and Overall Survival) from Phase II clinical trialwith ATIR101 was presented at the ASH 58th Annual Meeting in San Diego, USA. Overallsurvival was 61% for the ATIR101 arm vs 20% of a historic control group receiving HSCTonly. GFRS was 57% for HSCT+ATIR101 vs 20% for the control group.
Y/E Dec Revenue EBITDA PBT EPS P/E P/CF(€m) (€m) (€m) (c) (x) (x)
2014 0.0 (6.0) (7.2) (74.62) N/A N/A
2015 0.0 (15.9) (17.4) (136.50) N/A N/A
2016e 0.0 (8.6) (10.0) (71.58) N/A N/A
2017e 0.0 (11.9) (13.5) (96.42) N/A N/A
Sector: Pharma & healthcare
Price: €7.72Market cap: €204mMarket Scale
Share price graph (€)
Company descriptionMagForce has a European approvednanotechnology-based therapy to treatbrain cancer. Nanoparticles areinjected into the tumour and activatedby an external magnetic field,producing heat and thermallydestroying or sensitising the tumour.
Price performance% 1m 3m 12mActual 12.0 (2.2) 71.7Relative* 8.6 (0.1) 42.1* % Relative to local indexAnalystDr Daniel Wilkinson
MagForce (MF6)
INVESTMENT SUMMARY
MagForce is moving forward with its strategy to drive uptake and acceptance (in the US andEurope) of its NanoTherm nanoparticle-based therapy for cancer. In Germany, Magforcehas six centres commercially capable (three utilised, c50 patients to date) of treatingglioblastoma (GBM) patients. To accelerate uptake of NanoTherm treatment in Europe, weexpect MagForce to look to expand from Germany into other countries (funded primarily byan up to €35m loan from the European Investment Bank). In the US, its subsidiary MagforceUSA is in talks with the FDA to initiate a planned clinical trial in prostate cancer patients(potential launch in 2018). The company expects the trial to initiate in H217; data areexpected 12 months later.
INDUSTRY OUTLOOK
MagForce’s NanoTherm therapy has been designed to directly affect tumours from within,while sparing surrounding healthy tissue. Magnetic nanoparticles are directly injected into atumour and are then heated in the presence of an external magnetic field generated byspecialist equipment (NanoActivator). This can destroy or sensitise the tumour for additionaltreatment.
Y/E Dec Revenue EBITDA PBT EPS P/E P/CF(€m) (€m) (€m) (c) (x) (x)
2015 2.6 (4.4) (4.5) (17.73) N/A N/A
2016 0.5 (6.6) (7.2) (27.81) N/A N/A
2017e 3.5 (3.8) (4.6) (17.41) N/A N/A
2018e 6.5 (4.3) (5.6) (21.13) N/A N/A
15Edison Healthcare Insight | 20 September 2017

Sector: Pharma & healthcare
Price: €12.98Market cap: €287mMarket FRA
Share price graph (€)
Company descriptionMedigene is a German biotechcompany with a core business incancer immunotherapy. Dendritic cell(DC) vaccines are in Phase I/II clinicalstudies, while a T-cell receptor (TCR)candidate should enter the clinic in2017.
Price performance% 1m 3m 12mActual 38.0 14.6 89.4Relative* 33.8 17.1 56.8* % Relative to local indexAnalystDr Linda Pomeroy
Medigene (MDG1)
INVESTMENT SUMMARY
Medigene is focused on the rapid development of its cancer immunotherapy technologyplatforms: dendritic cell (DC) cancer vaccines, adoptive T-cell therapy (TCR) and T-cellspecific antibodies (TAB). Phase I/II studies are ongoing with DC vaccines for prostatecancer and acute myeloid leukaemia (investigator-sponsored) and acute myeloid leukaemia(Medigene). For TCRs, Medigene plans to start up to three clinical trials; the first in 2017(investigator-led) and company-led late 2017 and 2018. Important progress includes analliance with bluebird bio, a prominent T-cell immunology company, to utilise its TCRtechnology platform to identify four therapeutic candidates against four targets. This ispositive as it validates its TCR technology and offers potential upside from anydevelopment. Medigene is well-funded to execute its clinical programme, particularlyfollowing a recent fund-raising (€20.7m gross).
INDUSTRY OUTLOOK
Cancer immunotherapy is attracting huge biotech investor interest. Medigene's DC vaccinetechnology is a new generation, with multiple potential efficacy and manufacturing benefitsover the forerunners, eg Provenge. The TCR programme has similarities to CAR-Tproducts, but with potentially significant efficacy and safety advantages.
Y/E Dec Revenue EBITDA PBT EPS P/E P/CF(€m) (€m) (€m) (c) (x) (x)
2015 6.8 (9.4) (12.8) (73.55) N/A N/A
2016 9.7 (10.2) (11.3) (55.51) N/A N/A
2017e 9.0 (17.6) (18.6) (88.63) N/A N/A
2018e 9.3 (19.5) (20.2) (91.11) N/A N/A
Sector: Pharma & healthcare
Price: A$1.38Market cap: A$649mMarket ASX
Share price graph (A$)
Company descriptionMesoblast is developing adult stem celltherapies based on its proprietary MPCand culture-expanded MSC platforms.It has six late-stage clinical trialsacross four areas.
Price performance% 1m 3m 12mActual (21.0) (31.7) 14.3Relative* (21.3) (30.9) 5.0* % Relative to local indexAnalystDr Dennis Hulme
Mesoblast (MSB)
INVESTMENT SUMMARY
Mesoblast cleared an interim futility analysis of the Phase III trial of its MPC-150-IMregenerative therapy in heart failure patients in April - over 400 of the target of 600 patientshave been enrolled. In December Mesoblast granted Mallinckrodt Pharmaceuticals up to 9months to exclusively negotiate commercial and development agreements for MPC-06-ID inchronic low back pain (CLBP) and MSC-100-IV in graft vs host disease (GvHD). Both ofthese products are in pivotal studies: MSC-100-IV has been granted Fast Track designationby the FDA and is due to report results from a Phase III in children with GvHD in Q417; a360-patient Phase III of MPC-06-ID in CLBP is underway. Partner JCR Pharmaceuticals ismarketing Mesoblast’s GvHD therapy in Japan following approval in 2015. Cash balance at30 June of US$46m has since been boosted by a US$40m raise in July. Mesoblast also hasaccess to a US$90m equity finance facility to extend its funding runway.
INDUSTRY OUTLOOK
Mesoblast is the leading mesenchymal stem cell development company, with two platforms(MPCs, MSCs) and nine clinical candidates in Phase II and III. Alliances with JCR andLonza underpin the key programmes.
Y/E Jun Revenue EBITDA PBT EPS (fd) P/E P/CF(US$m) (US$m) (US$m) (c) (x) (x)
2015 32.4 (98.0) (96.2) (29.99) N/A N/A
2016 44.2 (86.3) (87.4) (0.20) N/A N/A
2017e 5.8 (81.3) (82.0) (20.59) N/A N/A
2018e 9.0 (80.3) (81.0) (18.92) N/A N/A
16Edison Healthcare Insight | 20 September 2017

Sector: Pharma & healthcare
Price: €2.44Market cap: €84mMarket FRA
Share price graph (€)
Company descriptionMologen is a German biotechcompany developing cancerimmunotherapies. The lead product islefitolimod (MGN1703) for metastaticcolorectal cancer maintenance, SCLCand HIV. Development of MGN1601, atherapeutic renal cell vaccine, wouldbe reinitiated on successfulout-licensing of lefitolimod. Price performance% 1m 3m 12mActual (11.2) (39.0) 76.8Relative* (13.9) (37.8) 46.3* % Relative to local indexAnalystDr Susie Jana
Mologen (MGN)
INVESTMENT SUMMARY
Mologen is developing novel immunotherapies for use in the post-chemo maintenancesetting in cancer and for the treatment of infectious diseases. Mologen's efforts are focusedon its lead product candidate lefitolimod. IMPALA a 540-pt pivotal study in metastaticcolorectal cancer (mCRC) maintenance; recently completed full enrollment. Full data hasbeen presented at ESMO 2017 for the 102-patient Phase II trial (IMPULSE) in small-celllung cancer (SCLC). Topline results in the Phase I TEACH study to treat HIV (the firstnon-cancer study for MGN1703) have been announced (failed primary endpoint tracking thesize of the viral reservoir). A 60-patient Phase I combination study of lefitolimod with Yervoyin solid tumours is now being conducted by MD Anderson, enrollment has started. Grosscash of €14.2m as of 30th June 2017 should be sufficient to fund Mologen into early 2018.
INDUSTRY OUTLOOK
Results for IMPALA are expected in 2018/19. Final overall survival (OS) data from IMPACT(Phase II in mCRC) and IMPULSE may offer fresh financing/partnering opportunities forlefitolimod before then.
Y/E Dec Revenue EBITDA PBT EPS P/E P/CF(€m) (€m) (€m) (c) (x) (x)
2015 0.0 (20.4) (20.5) (0.99) N/A N/A
2016 0.1 (20.6) (20.8) (0.91) N/A N/A
2017e 0.0 (21.0) (21.4) (0.63) N/A N/A
2018e 0.0 (15.5) (15.9) (0.47) N/A N/A
Sector: Pharma & healthcare
Price: €65.96Market cap: €1935mMarket FRA
Share price graph (€)
Company descriptionMorphoSys is a German biotechnologycompany that uses its proprietaryantibody platforms to produce humanantibodies for therapeutic use across arange of indications for partners and todevelop its own pipeline.
Price performance% 1m 3m 12mActual 14.8 6.7 81.0Relative* 11.3 8.9 49.8* % Relative to local indexAnalystMaxim Jacobs
MorphoSys (MOR)
INVESTMENT SUMMARY
MorphoSys has a broad portfolio with 114 programmes, 29 of those in clinical development,including the proprietary programmes for MOR208, MOR202 and MOR209. MOR208 is anFc-enhanced antibody targeting CD19, which is being developed for DLBCL and CLL, whileMOR202 is an anti-CD38 antibody in Phase I/IIa for multiple myeloma. MOR209, ananti-PSMA/CD3 antibody, is in Phase I trials for prostate cancer. Among the partneredprogrammes, J&J announced in July the FDA approval of Guselkumab, an anti-IL-23antibody, for psoriasis. It is the first antibody generated from their proprietary HuCALantibody technology to receive marketing approval.
INDUSTRY OUTLOOK
The pharmaceutical industry is out-licensing more drug discovery and developing morebiological products, both trends that should benefit MorphoSys. Also, there is increasingdemand for novel therapies, such as those in MorphoSys's proprietary pipeline.
Y/E Dec Revenue EBITDA PBT EPS P/E P/CF(€m) (€m) (€m) (c) (x) (x)
2015 106.2 20.7 22.6 64.8 101.8 N/A
2016 49.7 (56.2) (57.8) (220.5) N/A N/A
2017e 61.5 (63.0) (62.2) (146.9) N/A N/A
2018e 29.5 (85.8) (85.1) (201.7) N/A N/A
17Edison Healthcare Insight | 20 September 2017
Sector: Pharma & healthcare
Price: €18.48Market cap: €325mMarket Euronext Paris
Share price graph (€)
Company descriptionNanobiotix is a French nanomedicinecompany developing NBTXR3 for thetreatment of cancer, which interactswith ionizing radiation to locallyincrease the energy. NBTXR3 is inpivotal clinical development in STS inEurope and is partnered withPharmaEngine in Asia-Pacific.
Price performance% 1m 3m 12mActual 1.4 (9.4) 12.6Relative* (0.7) (9.1) (6.2)* % Relative to local indexAnalystDr Jonas Peciulis
Nanobiotix (NANO)
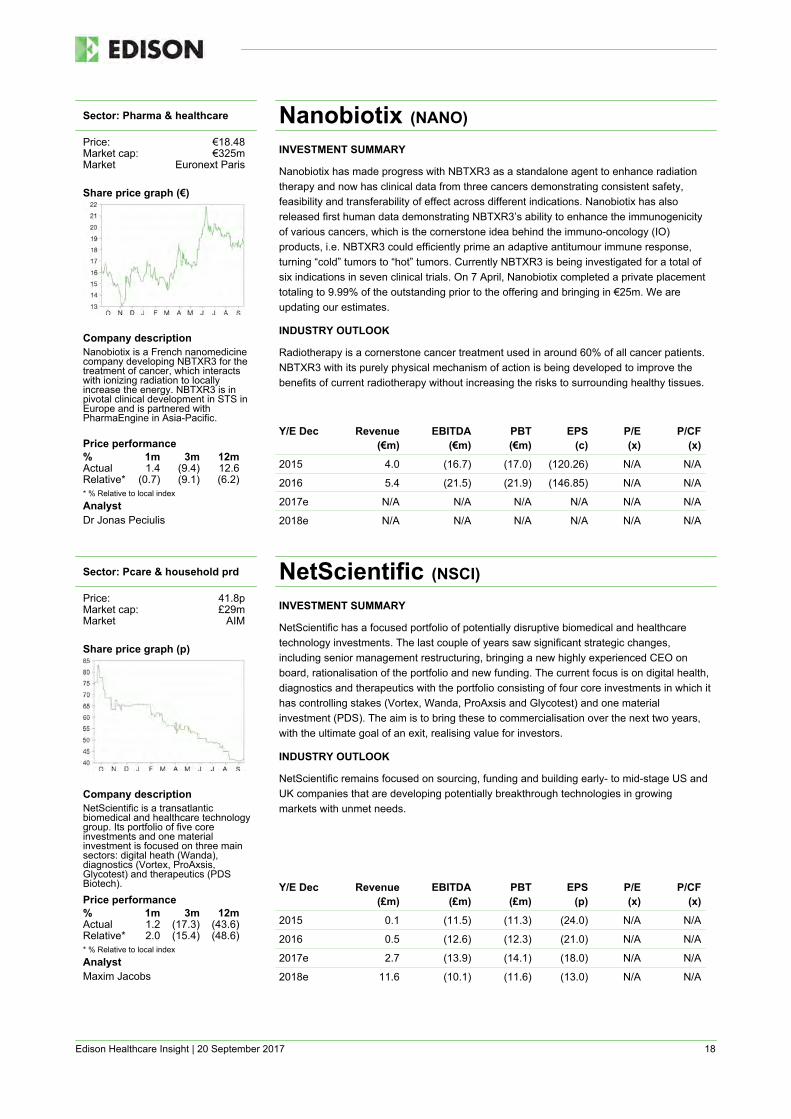
INVESTMENT SUMMARY
Nanobiotix has made progress with NBTXR3 as a standalone agent to enhance radiationtherapy and now has clinical data from three cancers demonstrating consistent safety,feasibility and transferability of effect across different indications. Nanobiotix has alsoreleased first human data demonstrating NBTXR3’s ability to enhance the immunogenicityof various cancers, which is the cornerstone idea behind the immuno-oncology (IO)products, i.e. NBTXR3 could efficiently prime an adaptive antitumour immune response,turning “cold” tumors to “hot” tumors. Currently NBTXR3 is being investigated for a total ofsix indications in seven clinical trials. On 7 April, Nanobiotix completed a private placementtotaling to 9.99% of the outstanding prior to the offering and bringing in €25m. We areupdating our estimates.
INDUSTRY OUTLOOK
Radiotherapy is a cornerstone cancer treatment used in around 60% of all cancer patients.NBTXR3 with its purely physical mechanism of action is being developed to improve thebenefits of current radiotherapy without increasing the risks to surrounding healthy tissues.
Y/E Dec Revenue EBITDA PBT EPS P/E P/CF(€m) (€m) (€m) (c) (x) (x)
2015 4.0 (16.7) (17.0) (120.26) N/A N/A
2016 5.4 (21.5) (21.9) (146.85) N/A N/A
2017e N/A N/A N/A N/A N/A N/A
2018e N/A N/A N/A N/A N/A N/A
Sector: Pcare & household prd
Price: 41.8pMarket cap: £29mMarket AIM
Share price graph (p)
Company descriptionNetScientific is a transatlanticbiomedical and healthcare technologygroup. Its portfolio of five coreinvestments and one materialinvestment is focused on three mainsectors: digital heath (Wanda),diagnostics (Vortex, ProAxsis,Glycotest) and therapeutics (PDSBiotech).Price performance% 1m 3m 12mActual 1.2 (17.3) (43.6)Relative* 2.0 (15.4) (48.6)* % Relative to local indexAnalystMaxim Jacobs
NetScientific (NSCI)
INVESTMENT SUMMARY
NetScientific has a focused portfolio of potentially disruptive biomedical and healthcaretechnology investments. The last couple of years saw significant strategic changes,including senior management restructuring, bringing a new highly experienced CEO onboard, rationalisation of the portfolio and new funding. The current focus is on digital health,diagnostics and therapeutics with the portfolio consisting of four core investments in which ithas controlling stakes (Vortex, Wanda, ProAxsis and Glycotest) and one materialinvestment (PDS). The aim is to bring these to commercialisation over the next two years,with the ultimate goal of an exit, realising value for investors.
INDUSTRY OUTLOOK
NetScientific remains focused on sourcing, funding and building early- to mid-stage US andUK companies that are developing potentially breakthrough technologies in growingmarkets with unmet needs.
Y/E Dec Revenue EBITDA PBT EPS P/E P/CF(£m) (£m) (£m) (p) (x) (x)
2015 0.1 (11.5) (11.3) (24.0) N/A N/A
2016 0.5 (12.6) (12.3) (21.0) N/A N/A
2017e 2.7 (13.9) (14.1) (18.0) N/A N/A
2018e 11.6 (10.1) (11.6) (13.0) N/A N/A
18Edison Healthcare Insight | 20 September 2017

Sector: Pharma & healthcare
Price: SEK3.89Market cap: SEK197mMarket NASDAQ OTCQX
Share price graph (SEK)
Company descriptionNeuroVive Pharmaceutical is aSwedish biopharmaceutical companywith deep expertise in mitochondrialmedicine. It has a diversified portfolioin terms of indications and employs adual strategy: it develops a coreportfolio of assets for orphan diseasesand seeks to out-license proprietaryproducts for non-orphan indications.Price performance% 1m 3m 12mActual (17.2) 3.5 (41.5)Relative* (18.4) 7.8 (47.9)* % Relative to local indexAnalystDr Jonas Peciulis
NeuroVive Pharmaceutical (NVP)
INVESTMENT SUMMARY
NeuroVive Pharmaceutical is a mitochondrial medicine specialist with a diversified assetportfolio. NeuroVive’s core portfolio, which the company aims to develop internally, targetsorphan indications: traumatic brain injury (TBI) with NeuroSTAT, various geneticmitochondrial diseases with KL1333 and NVP015, and mitochondrial myopathy withNVP025. Recent R&D news regarding the positive outcome in a Phase IIa study withNeuroSTAT means that the drug candidate is ready for a proof-of-concept study. Thesecond most advanced product KL1333 was in-licensed from Yungjin Pharm in May 2017and currently is in Phase I. Product portfolio for out-licensing includes NV556 and NVP022for non-alcoholic steatohepatitis (NASH) and NVP024 for hepatocellular carcinoma (HCC).
INDUSTRY OUTLOOK
NeuroVive has a rather diversified portfolio in terms of indications; however, all the assetsare based on improving mitochondrial metabolism and function. This puts NeuroVive amongthe very few experts in mitochondrial medicine in the industry, in our view. Central toNeuroVive’s strategy is maintaining a network of KOLs, academic institutions and researchorganisations, which help to run innovative design and cost-effective studies.
Y/E Dec Revenue EBITDA PBT EPS P/E P/CF(SEKm) (SEKm) (SEKm) (öre) (x) (x)
2015 2.5 (89.1) (89.6) (300.43) N/A N/A
2016 0.0 (69.9) (70.7) (172.27) N/A N/A
2017e 0.0 (80.2) (80.0) (172.19) N/A N/A
2018e 0.0 (95.8) (95.9) (193.56) N/A N/A
Sector: Pharma & healthcare
Price: CHF18.25Market cap: CHF289mMarket Swiss Stock Exchange
Share price graph (CHF)
Company descriptionNewron is a CNS-focused biotech.Xadago (partnered with Zambon, USWorldMeds, Meiji Seika, Sequirus) forPD has been launched in Europe.Other pipeline assets include Sarizotan(Phase III for Rett syndrome) andEvenamide (Phase II forschizophrenia).
Price performance% 1m 3m 12mActual (4.9) (11.2) (21.3)Relative* (5.4) (13.4) (29.2)* % Relative to local indexAnalystDr Susie Jana
Newron Pharmaceuticals (NWRN)
INVESTMENT SUMMARY
Newron's lead product, Xadago (safinamide) for Parkinson's disease (PD) has beenlaunched in 12 European countries and is generating sales through commercial partnerZambon (ex-Japan/Asia). Additionally, Xadago was recently launched in the US bysublicensee US WorldMeds. Other pipeline assets include sarizotan for Rett syndrome, thepivotal trial STARS (placebo-controlled Phase II/III trial) to investigate breathing disordersassociated with RS has initiated. Full data from the Phase II study of evenamide as anadd-on to atypical antipsychotics, published in March 2017, demonstrated efficacy in termsof improvement on the symptoms of schizophrenia assessed by the Positive and NegativeSyndrome Scale (PANSS). Newron raised CHF26.1m in 2016 in a private placement that itexpects will help fund operations through 2018.
INDUSTRY OUTLOOK
Parkinson's disease is a growing market. Xadago could have a unique position, withonce-a-day dosing and a clean safety profile.
Y/E Dec Revenue EBITDA PBT EPS P/E P/CF(€m) (€m) (€m) (c) (x) (x)
2015 2.4 (17.6) (18.3) (117.21) N/A N/A
2016 6.7 (15.3) (15.2) (103.69) N/A N/A
2017e 15.3 (7.6) (7.2) (45.77) N/A N/A
2018e 15.6 (4.5) (3.9) (24.42) N/A N/A
19Edison Healthcare Insight | 20 September 2017

Sector: Pharma & healthcare
Price: A$0.04Market cap: A$19mMarket ASX
Share price graph (A$)
Company descriptionNovogen's two main drug technologyplatforms are super-benzopyrans andanti-tropomyosins. SBP compoundsshow potent activity against cancerstem cells with potential application indegenerative diseases; ATMS showsynergy with anti-mitotics in cancer.
Price performance% 1m 3m 12mActual (11.1) (24.5) (60.0)Relative* (11.4) (23.7) (63.3)* % Relative to local indexAnalystDr Dennis Hulme
Novogen (NRT)
INVESTMENT SUMMARY
Novogen is developing two groups of anti-cancer compounds, including GDC-0084, a phaseII-ready PI3K inhibitor licensed from Genentech that is intended for glioblastoma. Thecompany has transferred the IND from Genentech and is finalising design for a Phase IIstudy expected to start in Q417. Its super-benzopyran drugs include Cantrixil and Trilexium,which are potent against cancer stem cells that are resistant to standard chemotherapydrugs, both in vitro and in vivo. A 60-patient Phase I trial of Cantrixil in ovarian cancer whichcommenced in December 2016 is expected to report MTD in Q118; while the primary aim isto assess safety and tolerability, radiological responses and biomarkers will be assessed forindications of efficacy. Novogen has terminated development of its preclinicalanti-tropomyosin drug Anisina, but has initiated a next-generation anti-tropomyosin drugdiscovery program supported by an A$3m government grant. The company had A$11.5mcash at June 2017.
INDUSTRY OUTLOOK
Novogen is a biotechnology company listed on the ASX and NASDAQ. Its two main drugtechnology platforms are super-benzopyrans (SBP) and a PI3K inhibitor. SBP compoundsshow potent activity against cancer stem cells.
Y/E Jun Revenue EBITDA PBT EPS P/E P/CF(A$m) (A$m) (A$m) (c) (x) (x)
2016 3.7 (10.6) (11.6) (2.8) N/A N/A
2017 8.6 (10.2) (10.9) (2.3) N/A N/A
2018e 7.5 (16.0) (17.3) (3.6) N/A N/A
2019e 17.6 (9.3) (10.8) (2.2) N/A N/A
Sector: Pharma & healthcare
Price: SEK15.70Market cap: SEK673mMarket NASDAQ OMX First North
Share price graph (SEK)
Company descriptionNuevolution is a Copenhagen-basedbiopharmaceutical company. Its patentprotected Chemetics drug discoveryplatform enables the selection of drugsto an array of tough-to-drug diseasetargets. To date it has entered into 17agreements with major pharmaceuticalcompanies.
Price performance% 1m 3m 12mActual 0.6 (4.3) 57.8Relative* (0.8) (0.3) 40.6* % Relative to local indexAnalystDr Susie Jana
Nuevolution (NUE)
INVESTMENT SUMMARY
Nuevolution’s proprietary Chemetics DNA-encoded screening platform technology enablesfast and accurate small molecule drug discovery. The technology has received powerfulexternal validation, including three recent collaborations (Amgen, Almirall and Janssen) thatcould generate significant value in the coming years. In addition, we expect Nuevolution toprogress at least one internally generated asset into clinical development in the near future.Net cash of SEK175.2m ($23.5m) (30th June 2017) suggests a cash runway into FY19.
INDUSTRY OUTLOOK
Significant promise is seen in DNA-encoded libraries due to the potential to rapidly developsmall molecule drugs to ‘tough-to-drug’ targets. We continue to see major investment in thespace from an array of companies, notably GSK, Roche and Novartis.
Y/E Jun Revenue EBITDA PBT EPS P/E P/CF(SEKm) (SEKm) (SEKm) (öre) (x) (x)
2015 N/A N/A N/A N/A N/A N/A
2016 21.3 N/A (151.9) (397.00) N/A N/A
2017e 139.4 N/A 15.1 4.00 392.5 N/A
2018e 186.0 N/A 56.4 86.00 18.3 N/A
20Edison Healthcare Insight | 20 September 2017

Sector: Pharma & healthcare
Price: €2.16Market cap: €109mMarket Euronext Paris
Share price graph (€)
Company descriptionOnxeo is focused on orphan cancerand has three late-stage orphanoncology assets it could commercialisealone in Europe (Livatag, Beleodaqand Validive). Royalty-earningBeleodaq (belinostat) is launched inthe US, along with two non-core,partnered, specialty products.
Price performance% 1m 3m 12mActual (46.0) (57.6) (31.2)Relative* (47.1) (57.5) (42.7)* % Relative to local indexAnalystDr Jonas Peciulis
Onxeo (ONXEO)
INVESTMENT SUMMARY
Onxeo's Phase III asset Livatag did not meet the primary overall survival endpointcompared to standard of care arm, where survival was unexpectedly high. Onxeo is nowanalyzing the full data set to decide further steps. On a more positive note Onxeoout-licensed its Phase III ready orphan oncology asset Validive to Monopar Therapeutics fora total deal value of $108m with up to double-digit royalties. Recently, Onxeo's AsiDNAdemonstrated first preclinical PoC data showing potential to be administrated intravenously.AsiDNA, a first-in-class DNA repair inhibitor, has already been tested in a Phase I trial inmelanoma with promising safety and initial efficacy results. Onxeo aims to file theinvestigational new drug application by end-2017 and will explore AsiDNA's potential incombination with PARP inhibitors. Onxeo’s Beleodaq is already launched in the US withpartner Spectrum for r/r peripheral T-cell lymphoma (r/r PTCL), generating royalties forOnxeo.
INDUSTRY OUTLOOK
The patent expiry of blockbuster drugs and increased competition from generics has shiftedthe focus of the pharmaceutical industry to orphan drugs. Government support, as well asinput from the regulatory bodies provide incentives for orphan drug developers.
Y/E Dec Revenue EBITDA PBT EPS P/E P/CF(€m) (€m) (€m) (c) (x) (x)
2015 3.5 (20.4) (20.0) (43.53) N/A N/A
2016 4.4 (21.2) (20.4) (48.04) N/A N/A
2017e 7.9 (21.7) (21.7) (46.33) N/A N/A
2018e N/A N/A N/A N/A N/A N/A
Sector: Pharma & healthcare
Price: US$2.33Market cap: US$36mMarket NASDAQ OTCQX
Share price graph (US$)
Company descriptionOrexigen is a biopharmaceuticalcompany focusing on obesitytreatments. It will sell its sole product,Contrave, through its own salesforce inthe US after taking back the rights frompartner, Takeda. Contrave waslaunched in the US in Oct 2014 andapproved in the EU in March 2015under the trade name Mysimba.Price performance% 1m 3m 12mActual (4.1) (18.0) (31.9)Relative* (5.3) (19.9) (42.0)* % Relative to local indexAnalystMaxim Jacobs
Orexigen Therapeutics (OREX)
INVESTMENT SUMMARY
Orexigen’s obesity drug, Contrave, is an extended-release oral combination oflong-marketed bupropion (Wellbutrin for depression) and Naltrexone (Revia for addiction).Now the leading branded obesity treatment in the US, Orexigen announced the acquisitionof US rights to Contrave in the US from partner Takeda in mid-March 2016. The company isnow marketing the drug with a new dedicated salesforce of 160 reps with a focus on theconsumer. Contrave is approved under the brand Mysimba in most international markets. Ithas now launched in 17 countries, including South Korea, Spain, Poland, UK and Ireland.Launches in an additional 10-15 countries are expected by Q118.
INDUSTRY OUTLOOK
Orexigen is a biopharmaceutical company focusing on obesity treatments. Contrave waslaunched in the US in October 2014 and approved in the EU in March 2015, under the tradename Mysimba.
Y/E Dec Revenue EBITDA PBT EPS P/E P/CF(US$m) (US$m) (US$m) (c) (x) (x)
2015 24.5 (60.3) (67.3) (523.81) N/A N/A
2016 33.7 (134.6) (138.1) (972.82) N/A N/A
2017e 94.0 (138.3) (141.4) (796.12) N/A N/A
2018e 160.3 (68.1) (72.7) (467.47) N/A N/A
21Edison Healthcare Insight | 20 September 2017

Sector: Pharma & healthcare
Price: SEK33.00Market cap: SEK1140mMarket NASDAQ OMX Mid Cap
Share price graph (SEK)
Company descriptionOrexo is a Swedish speciality pharmacompany, with expertise in drugdelivery/reformulation technologies (inparticular sublingual formulations) anda US commercial infrastructure foropioid dependence therapy Zubsolv(also filed in Europe). Orexo also hastwo clinical assets and three preclinicalprogrammes.Price performance% 1m 3m 12mActual (5.4) 19.6 (34.3)Relative* (6.8) 24.6 (41.5)* % Relative to local indexAnalystDr Susie Jana
Orexo (ORX)
INVESTMENT SUMMARY
Strong Q217 US Zubsolv sales (SEK124.1m +10% vs Q216) and ongoing cost controlunderpinned a seventh consecutive quarter of positive operating cash flow and a strongerbalance sheet (SEK45.7m net debt). FY17 guidance for positive EBITDA and Zubsolv USYOY net revenue growth remained unchanged. IP infringement litigation remains anoverhang. The court ruling on the ’996 Zubsolv patent precludes Actavis generic launchbefore September 2019; Orexo has filed a separate ‘996 US IP infringement suit againstActavis for their Suboxone/Subutex generics. Zubsolv’s IP portfolio includes patentsextending to 2032 (’900 and ’421) which with an appeal outcome on the invalidity of ’330expected around end-2017, represent significant hurdles ahead of generic launch. TheCHMP of the European Medicines Agency (EMA) issued in September a positive opinion forZubsolv (buprenorphine and naloxone sublingual tablet) for use in the treatment of opioiddependence; final decision for approval is expected in Q417.
INDUSTRY OUTLOOK
Opioid dependence diagnosis/treatment rates are low due to social stigma, limited access totherapy in parts of the US and affordability. Competition includes Suboxone film (Indivior),Bunavail (BDSI) and six generic bup/nal tablets.
Y/E Dec Revenue EBITDA PBT EPS P/E P/CF(SEKm) (SEKm) (SEKm) (öre) (x) (x)
2015 646.2 (99.9) (203.6) (607.0) N/A N/A
2016 705.9 76.7 35.6 84.0 39.3 6.2
2017e 688.0 87.8 43.4 72.0 45.8 5.6
2018e 729.1 117.6 93.1 216.0 15.3 7.1
Sector: Pharma & healthcare
Price: €2.06Market cap: €70mMarket Madrid Stock Exchange
Share price graph (€)
Company descriptionOryzon is a Spanish biotechnologycompany focused on developing novelepigenetic compounds. Leadcompound ORY-1001 is partnered withRoche and is undergoing a Phase I/IIastudy for acute leukaemia. ORY-2001has potential for Alzheimer’s diseaseand has been approved to enter PhaseI.Price performance% 1m 3m 12mActual (8.0) (28.9) (27.7)Relative* (7.1) (26.1) (39.3)* % Relative to local indexAnalystDr Jonas Peciulis
Oryzon Genomics (ORY)
INVESTMENT SUMMARY
Oryzon’s expertise lies in developing small molecule inhibitors for epigenetic targets. Thelead product ORY-1001 is a first-in-class inhibitor of lysine specific demethylase 1 (LSD1)with positive data from the Phase I/IIa in acute leukemia announced in December 2016.Oryzon's former partner Roche has also initiated a Phase I trial with ORY-1001 in small celllung cancer. Oryzon is now continuing the development of ORY-1001 in both indications.Oryzon’s second product, ORY-2001, targets Alzheimer’s disease (AD) and reportedsupportive Phase I data in early April. Preclinical data also support its use in multiplesclerosis and other neurodegenerative indications. ORY-3001 has been recently revealedas the third product to enter pre-clinical development in non-oncological indications. Cashposition was €37.5m at end Q217.
INDUSTRY OUTLOOK
Epigenetics is a relatively young field in terms of drug development. HDACs were amongthe first epigenetic therapeutics brought to market, and although effective, they have sideeffects. Oryzon is among the leading clinical stage drug developers with a secondgeneration of epigenetic therapeutics, which have greater selectivity and are expected toshow a favourable safety/efficacy profile.
Y/E Dec Revenue EBITDA PBT EPS P/E P/CF(€m) (€m) (€m) (c) (x) (x)
2015 7.2 0.7 (0.1) (0.57) N/A 47.3
2016 5.0 (3.7) (4.7) (17.02) N/A N/A
2017e 4.4 (5.0) (6.4) (20.40) N/A N/A
2018e 7.9 (9.7) (11.0) (32.18) N/A N/A
22Edison Healthcare Insight | 20 September 2017

Sector: Pharma & healthcare
Price: 8.0pMarket cap: £249mMarket LSE
Share price graph (p)
Company descriptionOxford BioMedica is a leader in geneand cell therapy. The lentivectortechnology is wide ranging, covering invivo and ex vivo vector products. Thetechnology underpins the proprietaryclinical development pipeline inaddition to third party manufacturingcontracts which add validation to theplatform. Price performance% 1m 3m 12mActual (9.5) 49.3 110.2Relative* (8.8) 52.7 91.5* % Relative to local indexAnalystDr Susie Jana
Oxford BioMedica (OXB)
INVESTMENT SUMMARY
We expect OXB’s strategic vision to come to further fruition through 2017/18. Novartis’sCAR-T Kymriah (OXB provide the lentiviral vector) is now approved (in pediatric ALL) by theFDA with approvals in Europe and in DLBCL expected in the near future. OXB should nowstart earning royalties and substantial manufacturing fees from Kymriah. The possiblespin-out/out-licensing of its priority development pipeline assets is ongoing (OXB-102,OXB-202, and OXB-302). As of 31st July, OXB have £22.1m in cash.
INDUSTRY OUTLOOK
Cell- and gene-therapy is the focus of much industry attention as it can dramatically alter theoutcomes of many diseases. The proprietary lentivector platform is a flexible and efficientsystem that is promising in many indications.
Y/E Dec Revenue EBITDA PBT EPS P/E P/CF(£m) (£m) (£m) (p) (x) (x)
2015 15.9 (12.5) (16.6) (0.49) N/A N/A
2016 27.8 (7.6) (20.0) (0.59) N/A N/A
2017e 40.4 2.4 (5.4) (0.04) N/A 22.4
2018e 47.2 10.5 2.9 0.22 36.4 39.2
Sector: Pharma & healthcare
Price: NZ$0.48Market cap: NZ$190mMarket NZSX
Share price graph (NZ$)
Company descriptionPacific Edge develops and sells aportfolio of molecular diagnostic testsbased on biomarkers for the earlydetection and management of cancer.Tests utilising its Cxbladder technologyfor detecting and monitoring bladdercancer are sold in the US, NewZealand and Australia.
Price performance% 1m 3m 12mActual 1.1 (2.1) (3.1)Relative* 1.0 (5.5) (6.9)* % Relative to local indexAnalystMaxim Jacobs
Pacific Edge (PEB)
INVESTMENT SUMMARY
Pacific Edge develops and sells a portfolio of molecular diagnostic tests based onbiomarkers for the early detection and management of cancer. Tests utilising its Cxbladdertechnology for detecting and monitoring bladder cancer are sold in the US, New Zealandand Australia. The company announced the signing of a Federal Supply Schedule to theVeterans Administration, allowing the marketing of Cxbladder tests within the organization -the largest integrated healthcare system in the US. The company has also signed anagreement recently with Tricare, which handles the healthcare for all uniformed servicemembers and their families. The company also announced positive data from a userprogramme with Kaiser Permanente Southern California, which could lead to a commercialagreement with that group.
INDUSTRY OUTLOOK
Molecular diagnostics is a growing, but increasingly competitive field. Lead time from theinitiation of user programmes to payment can be long.
Y/E Mar Revenue EBITDA PBT EPS P/E P/CF(NZ$m) (NZ$m) (NZ$m) (c) (x) (x)
2016 6.4 (14.9) (15.5) (4.1) N/A N/A
2017 9.3 (19.6) (20.8) (5.4) N/A N/A
2018e 18.5 (8.2) (9.2) (2.3) N/A N/A
2019e 41.8 12.3 11.2 1.9 25.3 13.5
23Edison Healthcare Insight | 20 September 2017

Sector: Pharma & healthcare
Price: €2.82Market cap: €172mMarket FRA
Share price graph (€)
Company descriptionPAION is an emerging specialtypharma company developinganaesthesia products. Its lead product,remimazolam, is partnered withYichang in China, Hana Pharma in SKorea, Cosmo in the US, Pendopharmin Canada and R-Pharm in CIS,Turkey and MENA.
Price performance% 1m 3m 12mActual (1.9) 4.6 28.8Relative* (4.8) 6.9 6.6* % Relative to local indexAnalystDr Dennis Hulme
Paion (PA8)
INVESTMENT SUMMARY
Paion announced positive top-line results from a Phase III trial of remimazolam forprocedural sedation in bronchoscopy in June, adding to the positive results of a Phase IIIcolonoscopy trial. It is currently conducting Phase I studies to assess abuse potential as thefinal step of its US clinical development program. In the bronchoscopy trial 82.5% ofpatients on remimazolam achieved the primary outcome vs 3.4% on placebo and 34.8% onmidazolam. While replacing midazolam as the primary target, planned changes in the USreimbursement of day procedures favouring less supervision by anaesthetists could furtherincentivise uptake of remimazolam. €27.1m cash at 30 June plus €8m placement in July issufficient to complete ongoing development and to file for procedural sedation in the US(filing by partner Cosmo expected H218), as well as a Japanese filing for remimazolam ingeneral anaesthesia (GA) by Paion (expected by mid-2018). Paion has outlined a €20-25mprogramme that could see it restart Phase III studies in GA in Europe.
INDUSTRY OUTLOOK
Remimazolam has important advantages over competing products, including fast onset andoffset of action with lower risk of cardiopulmonary events than the standard of caremidazolam and propofol, and a reversal agent exists if there is over sedation.
Y/E Dec Revenue EBITDA PBT EPS P/E P/CF(€m) (€m) (€m) (c) (x) (x)
2015 0.1 (34.1) (34.0) (55.7) N/A N/A
2016 4.3 (24.3) (24.3) (36.4) N/A N/A
2017e 5.9 (16.4) (16.4) (21.2) N/A N/A
2018e 3.5 (13.0) (12.9) (17.7) N/A N/A
Sector: Pharma & healthcare
Price: US$3.23Market cap: US$498mMarket NASDAQ
Share price graph (US$)
Company descriptionPDL has reinvented itself through athree-pronged strategy: investing inroyalty streams of marketed anddevelopment-stage therapeutics andproviding high-yield debt financing todevice & diagnostic companies withnear-term product launches.
Price performance% 1m 3m 12mActual 15.8 38.0 4.9Relative* 14.4 34.8 (10.7)* % Relative to local indexAnalystMaxim Jacobs
PDL BioPharma (PDLI)
INVESTMENT SUMMARY
PDL BioPharma is reinventing itself as a healthcare-focused finance company through athree-pronged strategy: investing in royalty streams, providing high-yield financing to lifescience companies with near-term product launches as well as through the purchase ofapproved drugs to be sold by Noden Pharma (which is currently a wholly owned subsidiary)on a high margin basis. This strategy allows investors to gain exposure in healthcarethrough a relatively low-risk, diversified vehicle.
INDUSTRY OUTLOOK
PDL BioPharma is one of the only companies that will give broad exposure to diverseroyalty streams as well as corporate debt and high margin approved products.
Y/E Dec Revenue EBITDA PBT EPS P/E P/CF(US$m) (US$m) (US$m) (c) (x) (x)
2015 590.4 550.4 530.1 203.69 1.6 1.8
2016 244.3 193.1 175.5 77.72 4.2 5.2
2017e 264.2 176.8 157.9 59.33 5.4 8.5
2018e 122.2 37.3 19.9 13.58 23.8 N/A
24Edison Healthcare Insight | 20 September 2017

Sector: Pharma & healthcare
Price: €3.62Market cap: €805mMarket Madrid Stock Exchange
Share price graph (€)
Company descriptionPharmaMar is a Spanishbiopharmaceutical group with a corefocus on the development ofmarine-based drugs for cancer.Yondelis is approved in the EU andUS, and partnered with Janssen (J&J)in the US and Taiho in Japan.
Price performance% 1m 3m 12mActual (2.6) (8.0) 30.2Relative* (1.6) (4.3) 9.3* % Relative to local indexAnalystMaxim Jacobs
PharmaMar (PHM)
INVESTMENT SUMMARY
PharmaMar has built a pipeline of first-in-class cancer drugs for development with strategicpartners. Royalty income from Yondelis for soft tissue sarcoma in Japan and the US shoulddrive strong profit growth from 2017. Aplidin could potentially be approved for multiplemyeloma in Europe by the end of the year. Top-line data from the Zepsyre (akalurbinectedin and PM1183) Phase III in platinum-resistant ovarian cancer is due by early2018. A second pivotal study is evaluating lurbinectedin in combination with doxorubicin inpatients with small cell lung cancer. A Phase III in BRCA2-mutated breast cancer is plannedfor 2017, and pivotal studies in endometrial cancer have been flagged following a 44%response rate in Phase I.
INDUSTRY OUTLOOK
PharmaMar's oncology portfolio has been validated through multiple global partnerships, egJ&J in the US and Taiho in Japan (for Yondelis) and Chugai in certain EU countries (forAplidin).
Y/E Dec Revenue EBITDA PBT EPS P/E P/CF(€m) (€m) (€m) (c) (x) (x)
2015 162.0 17.6 5.9 3.0 120.7 78.9
2016 164.0 (11.5) (24.7) (10.8) N/A N/A
2017e 174.0 15.7 3.6 1.6 226.3 46.9
2018e 192.7 17.7 5.5 2.5 144.8 228.0
Sector: Pharma & healthcare
Price: NOK24.00Market cap: NOK517mMarket Oslo
Share price graph (NOK)
Company descriptionPhotocure specialises in photodynamictherapy. Its bladder cancer imagingproduct is sold as Hexvix in Europeand Cysview in the US. Photocurehandles the marketing in Nordiccountries and the US, while Ipsen is itsmarketing partner in the EU.
Price performance% 1m 3m 12mActual 2.6 (5.9) (38.0)Relative* (1.5) (13.3) (50.3)* % Relative to local indexAnalystMaxim Jacobs
Photocure (PHO)
INVESTMENT SUMMARY
Photocure specialises in photodynamic therapy. Its bladder cancer imaging product (knownas Hexvix in Europe and Cysview in the US) improves detection rates and helps prolongrecurrence-free survival. The company recently announced positive Phase III data in thesurveillance setting which may vastly increase their addressable market size as well as anew CMS draft rule which could increase reimbursement in the United States. Cevira is aPhase III-ready product for HPV-related diseases of the cervix and Visonac is a PhaseIII-ready product for acne. Photocure recently announced that the search for partners forCevira and Visonac is expanded to include outright sale of those products, possible spinoffsor other strategic alternatives.
INDUSTRY OUTLOOK
Photocure is a photodynamic therapy company focused on bladder cancer imaging,HPV-related diseases and acne. As its products typically are a combination of a drug and adevice, hurdles for generics are typically higher than with other therapeutics.
Y/E Dec Revenue EBITDA PBT EPS P/E P/CF(NOKm) (NOKm) (NOKm) (öre) (x) (x)
2015 134.7 (18.1) (17.4) (82.0) N/A N/A
2016 143.6 (8.0) 12.8 59.0 40.7 26.9
2017e 149.4 (38.9) (44.9) (208.0) N/A N/A
2018e 242.5 9.0 5.0 23.0 104.3 259.5
25Edison Healthcare Insight | 20 September 2017

Sector: Pharma & healthcare
Price: €5.45Market cap: €72mMarket Euronext Paris
Share price graph (€)
Company descriptionPixium Vision develops retinal implantsfor patients with severe vision loss. Itslead product Iris is an epi-retinalimplant, which received CE markapproval in 2016; a sub-retinal implant(Prima) is expected to start a humanstudy in 2017 .
Price performance% 1m 3m 12mActual 0.6 (14.3) (20.4)Relative* (1.5) (14.1) (33.7)* % Relative to local indexAnalystPooya Hemami
Pixium Vision (PIX)
INVESTMENT SUMMARY
Pixium Vision is developing two different retinal implant systems that transform images intoelectrical signals to elicit visual perception in patients with severe retinal disease. Thedevices consist of an implant and a pair of glasses with an embedded camera, andhandheld control. Pixium received CE Mark approval for the Iris II epiretinal implant in July2016. It is also conducting EU clinical trials with Iris II (10th and final implantation of thestudy completed in early 2017). Interim study data should assist reimbursement applicationsin EU markets. Positive pre-clinical data with Prima, a subretinal implant potentiallyproviding better visual acuity than Iris II, should support first human testing in H217. Pixiumheld €14.9m in gross cash at 30 June 2017 and has up to €3m available in additional debtfinancing available.
INDUSTRY OUTLOOK
Second Sight (EYES) is commercialising an epiretinal implant (Argus II) in the US and EU.The Iris II offers 150 electrodes (vs 60 on Argus II), potentially offering better vision, whilealso being the first potentially explantable (and upgradable) epiretinal implant. Prima is lesssurgically invasive and could potentially be a viable treatment option for maculardegeneration patients.
Y/E Dec Revenue EBITDA PBT EPS P/E P/CF(€m) (€m) (€m) (c) (x) (x)
2015 3.3 (14.6) (15.6) (122.88) N/A N/A
2016 2.5 (11.4) (12.4) (97.60) N/A N/A
2017e 3.8 (10.8) (12.6) (95.23) N/A N/A
2018e 14.9 (13.6) (17.9) (132.86) N/A N/A
Sector: Pharma & healthcare
Price: US$4.68Market cap: US$457mMarket NASDAQ, TASE
Share price graph (US$)
Company descriptionPluristem is a biotech company,headquartered in Israel, focused onthe development of cell-basedtherapeutics derived from placenta.The company is advancing PLX-PADfor critical limb ischemia (CLI) with aPhase III study on hip fracture.PLX-R18 is being advanced for acuteradiation syndrome and hematopoieticcell transplant.Price performance% 1m 3m 12mActual 16.2 (0.6) (25.3)Relative* 13.8 0.0 (27.0)* % Relative to local indexAnalystMaxim Jacobs
Pluristem Therapeutics (PSTI)
INVESTMENT SUMMARY
Pluristem Therapeutics is developing allogenic cell therapies derived from donated placentaltissue. The lead program, PLX-PAD is in Phase III for critical limb ischemia (CLI). Based onfeedback from both the FDA and EMA, a single pivotal 250-patient study will be required forapproval. The company also recently reported data from its study of PLX-R18 for thetreatment of acute radiation syndrome (ARS) in which the product compared favorably toNeupogen and showed a benign safety profile.
INDUSTRY OUTLOOK
Pluristem has been investigating the potential therapeutic benefit of cells derived from theplacenta which offers a rich supply of cells of multiple lineages from tissue that wouldotherwise be medical waste. Although these cells are not stem cells and lack the immortalityand pluripotency to meet that definition, they secrete a wide array of cytokines and growthfactors and can exert a potent influence on the function of other cells in the body.
Y/E Jun Revenue EBITDA PBT EPS P/E P/CF(US$m) (US$m) (US$m) (c) (x) (x)
2015 0.4 (27.3) (24.7) (35.11) N/A N/A
2016 2.8 (25.5) (23.2) (29.22) N/A N/A
2017e 0.0 (31.5) (28.9) (33.10) N/A N/A
2018e 0.0 (41.2) (41.5) (41.79) N/A N/A
26Edison Healthcare Insight | 20 September 2017

Sector: Pharma & healthcare
Price: A$0.02Market cap: A$50mMarket ASX
Share price graph (A$)
Company descriptionPrima's pipeline is based on threeproducts using a LAG-3 immunecontrol system: IMP321 for cancerchemo-immunotherapy and partneredproducts IMP731 (GSK) and IMP701(Novartis). Ph II asset CVac is anautologous dendritic cell vaccine.
Price performance% 1m 3m 12mActual 0.0 (32.3) (44.7)Relative* (0.3) (31.5) (49.2)* % Relative to local indexAnalystDr Dennis Hulme
Prima BioMed Ltd (PRR)
INVESTMENT SUMMARY
Prima BioMed has three promising clinical assets based on a versatile immunotherapytarget Lymphocyte activation gene-3, LAG-3 (one partnered with GSK and a secondpartnered with Novartis). The lead in-house LAG-3 product, IMP321, is being developedinitially in metastatic breast cancer in combination with chemotherapy (recruitmentunderway in 226-patient randomised Phase IIb, a 47% response rate was reported from the15-patient dose-escalation phase) and in melanoma in combination with the anti-PD1checkpoint inhibitor Keytruda (Phase I currently recruiting 3rd and final cohort). Novartis andGSK are progressing clinical trials of partnered LAG-3 programmes, providing additionalvalidation for the technology. Prima’s pipeline also includes IMP761, a first-in-class LAG-3agonist antibody in preclinical development which could potentially help treat autoimmunediseases.
INDUSTRY OUTLOOK
Immunotherapies are among the most promising class of products for cancer andautoimmune diseases. The LAG-3 products are potentially first-in-class, each with distinctmechanisms and applications.
Y/E Jun Revenue EBITDA PBT EPS P/E P/CF(A$m) (A$m) (A$m) (c) (x) (x)
2015 1.3 (13.3) (12.9) (0.9) N/A N/A
2016 1.9 (12.1) (13.7) (0.6) N/A N/A
2017e 1.3 (13.1) (12.7) (0.6) N/A N/A
2018e 10.6 (4.3) (4.0) (0.2) N/A N/A
Sector: Pharma & healthcare
Price: €13.90Market cap: €114mMarket Euronext Amsterdam
Share price graph (€)
Company descriptionProbiodrug is a biopharma companydeveloping its clinical pipeline for thetreatment of Alzheimer’s. Lead productcandidate, PQ912, has entered Ph IIa.PQ912 is a small molecule inhibitor ofQC, which is essential for theformation of pGlu-Abeta. Two furtherproducts are in preclinical stages.
Price performance% 1m 3m 12mActual (6.8) (20.8) (29.3)Relative* (8.3) (22.0) (41.1)* % Relative to local indexAnalystDr Jonas Peciulis
Probiodrug (PBD)
INVESTMENT SUMMARY
Probiodrug is developing a clinical pipeline focusing on the novel target of pGlu-Abeta, atoxic variant of amyloid-beta (Abeta) that has been implicated in the initiation andsustainment of the pathological cascade that leads to Alzheimer’s disease (AD). Leadcandidate PQ912 is an inhibitor of the enzyme glutaminyl cyclase, which is essential for theformation of pGlu-Abeta. Initial results from the Phase IIa study, SAPHIR, study werereported on 12 June. While primarily safety/tolerability study, several secondary endpointsespecially piqued our interest, with CSF biomarker, EEG and a couple of cognitive testspointing to a positive overall picture of the dataset. Recently new preclinical data alsoshowed that PQ912 demonstrated efficacy in Huntington’s disease in an animal model.Subject to further preclinical work, PQ912 could be fast-tracked to the clinic, which woulddiversify Probiodrug’s R&D pipeline with a new indication.
INDUSTRY OUTLOOK
There are 44m dementia sufferers worldwide, 60% of whom have AD. The lack ofdisease-modifying therapies leaves a vast unmet clinical need. This, combined withincreasing understanding of the disease process and the development of biomarkers, hasled to increased optimism that a disease-modifying therapy may be found.
Y/E Dec Revenue EBITDA PBT EPS P/E P/CF(€m) (€m) (€m) (c) (x) (x)
2015 0.0 (13.3) (13.5) (196.10) N/A N/A
2016 0.0 (13.7) (13.8) (181.30) N/A N/A
2017e 0.0 (10.5) (10.5) (128.47) N/A N/A
2018e 0.0 (8.6) (8.7) (105.76) N/A N/A
27Edison Healthcare Insight | 20 September 2017

Sector: Pharma & healthcare
Price: €2.97Market cap: €33mMarket Alternext Paris
Share price graph (€)
Company descriptionQuantum Genomics is abiopharmaceutical companydeveloping QGC001, a brainaminopeptidase A inhibitor for thetreatment of hypertension and heartfailure. Its mechanism is implicated inthe 25% of patients resistant totreatment.
Price performance% 1m 3m 12mActual (6.3) (61.2) (48.0)Relative* (8.3) (61.1) (56.7)* % Relative to local indexAnalystMaxim Jacobs
Quantum Genomics (ALQGC)
INVESTMENT SUMMARY
Quantum Genomics is a biopharmaceutical company investigating brain aminopeptidase Ainhibitors, a new class of drug, for the treatment of hypertension and heart failure. Theyrecently announced the results from their 34-patient Phase IIa study of QGC001 for thetreatment of mild to moderate arterial hypertension. It showed a 2.7 mmHgplacebo-adjusted reduction in ambulatory systolic blood pressure (SBP) and a 4.7 mmHgreduction in in-office SBP. A Phase IIb trial is expected to begin in H217. Data in heartfailure is expected in H118.
INDUSTRY OUTLOOK
The angiotensin pathway is one of the primary methods of modulating blood pressure and itis the target of some of the most successful anti-hypertensive drugs: angiotensin convertingenzyme (ACE) inhibitors, and angiotensin receptor blockers (ARBs). However, there is aparallel pathway in the brain responsible for the secretion of vasopressin and heart rate thatis unaddressed by these classes of drug and that is being targeted by Quantum Genomics.
Y/E Dec Revenue EBITDA PBT EPS P/E P/CF(€m) (€m) (€m) (c) (x) (x)
2015 0.1 (4.3) (4.5) (54.70) N/A N/A
2016 0.0 (6.2) (6.2) (59.79) N/A N/A
2017e 0.0 (7.2) (7.2) (68.62) N/A N/A
2018e 0.0 (10.9) (12.5) (115.39) N/A N/A
Sector: Pharma & healthcare
Price: US$8.55Market cap: US$146mMarket NASDAQ, TASE
Share price graph (US$)
Company descriptionRedHill Biopharma is a specialtypharma company with a broad R&Dpipeline focusing on gastrointestinaland inflammatory diseases and alsopromotes three GI products in the US.The most advanced programs areTALICIA (RHB-105) for H. pyloriinfection, RHB-104 for Crohn’s diseaseand NTM infections and Bekinda forgastroenteritis and IBS-D.Price performance% 1m 3m 12mActual 0.5 (8.3) (42.5)Relative* (0.7) (10.4) (51.0)* % Relative to local indexAnalystDr Jonas Peciulis
RedHill Biopharma (RDHL)
INVESTMENT SUMMARY
RedHill has a broad R&D pipeline, but is focusing on GI and inflammatory diseases. Themost advanced assets are TALICIA (RHB-105) for H. pylori infection (confirmatory Phase IIIstudy ongoing); RHB-104 for Crohn’s disease (the first Phase III trial ongoing),nontuberculous mycobacteria infections (pivotal Phase III trial to start in Q118) and r/rmultiple sclerosis (promising Phase IIa data in Q416); and BEKINDA for both gastroenteritis(successful top-line Phase III results announced in June 2017) and diarrhoea-predominantIBS (top line Phase II results expected in September 2017). RedHill is building a commercialbusiness in the US and has initiated promotion of GI products Donnatal and EnteraGam inQ217 with initial sales of $483k booked in the last two weeks of June; the promotion ofEsomeprazole Strontium DR Capsules 49.3mg was also initiated in September.
INDUSTRY OUTLOOK
RedHill's main focus on GI and inflammation include a range of conditions, which althoughcan be treated with a variety of innovative and established products, there is still an unmetneed in each of the diseases. In our view, carefully positioned, innovative solutions for thepatients will attract attention.
Y/E Dec Revenue EBITDA PBT EPS P/E P/CF(US$m) (US$m) (US$m) (c) (x) (x)
2015 0.0 (21.9) (21.1) (19.03) N/A N/A
2016 0.1 (30.5) (29.4) (22.85) N/A N/A
2017e 15.0 (41.4) (41.4) (24.39) N/A N/A
2018e 30.0 (32.2) (32.5) (18.90) N/A N/A
28Edison Healthcare Insight | 20 September 2017

Sector: Pharma & healthcare
Price: A$0.12Market cap: A$25mMarket ASX
Share price graph (A$)
Company descriptionRegeneus is a clinical-stageregenerative medicine companydeveloping innovative cell-basedtherapies for the human & animalhealth markets.
Price performance% 1m 3m 12mActual 0.0 (7.7) (14.3)Relative* (0.3) (6.7) (21.3)* % Relative to local indexAnalystDr Dennis Hulme
Regeneus (RGS)
INVESTMENT SUMMARY
Regeneus is developing its mesenchymal stem cell technology for musculoskeletalconditions in humans (Progenza) and animals (CryoShot). In December 2016 Regeneusentered a US$16.5m collaboration with AGC Asahi Glass (AGC) for manufacture ofProgenza cells for the Japanese market. Regeneus and AGC have formed a 50:50 JV forclinical development and commercialisation of Progenza in Japan – we expect the JV tosub-license one or more partners to undertake clinical trials in a number of indications.Japanese legislation offers an accelerated path to market for regenerative medicines.Progenza therapy led to meaningful reductions in osteoarthritis knee pain in Phase I.Regeneus holds global rights to autologous cancer vaccine technologies for human(RGSH4K, in Phase I) and veterinary (Kvax) applications. It was awarded a US patent inJuly for its Sygenus topical secretions technology, which is currently in preclinical studies.
INDUSTRY OUTLOOK
Regeneus' strategy is to focus on early-stage product development, then partner. In additionto the AGC deal for Progenza in Japan, it has partnered with a global animal healthcompany for CryoShot Canine. It will seek to identify wider applications of Progenza,beyond osteoarthritis.
Y/E Jun Revenue EBITDA PBT EPS P/E P/CF(A$m) (A$m) (A$m) (c) (x) (x)
2016 1.7 (3.4) (3.6) (1.70) N/A N/A
2017 10.0 4.9 3.3 1.57 7.6 7.0
2018e 7.8 2.1 1.9 0.89 13.5 7.7
2019e 1.2 (4.2) (4.4) (2.08) N/A N/A
Sector: Pharma & healthcare
Price: 1.7pMarket cap: £54mMarket LSE
Share price graph (p)
Company descriptionReNeuron is a UK biotech companydeveloping allogeneic cell therapies:CTX neural stem cell products forstroke disability (Phase IIa) and criticallimb ischaemia (Phase I); and humanretinal progenitor cells for retinitispigmentosa (Phase I/II).
Price performance% 1m 3m 12mActual (12.8) (6.9) (35.2)Relative* (12.1) (4.7) (41.0)* % Relative to local indexAnalystDr Linda Pomeroy
ReNeuron Group (RENE)
INVESTMENT SUMMARY
ReNeuron is funded (£60m H117) to undertake pivotal studies with two cell therapy-basedprogrammes. This includes the CTX neural stem cell programme (recently announced apositive end of Phase II meeting with the FDA and intends to go for SPA/RMAT designationfor stroke at Phase III) and hRPC (human retinal progenitor cells) programme for retinitispigmentosa (currently in Phase I/II). Also be commencing a Phase II trial in cone-roddystrophy. ReNeuron also has promising early data for its exosome nanomedicine platformin oncology. The company is constructing a GMP cell manufacturing and research facility.
INDUSTRY OUTLOOK
Limited drug development has targeted chronic stroke to date, which is the area in whichReNeuron is attempting to demonstrate a meaningful reduction in disability. If shown, itwould offer a compelling case for further development and/or partnering. Initial three monthfollow-up data from its Phase IIa stroke study was sufficiently strong to progress to a pivotalcontrolled Phase III clinical study in early 2018. The hRPC programme (Orphan (EU/US)and Fast Track (US) designation) is generating Phase II data in a larger cohort of patients in2018, with read-outs in 2019.
Y/E Mar Revenue EBITDA PBT EPS P/E P/CF(£m) (£m) (£m) (p) (x) (x)
2016 0.0 (13.6) (12.8) (0.44) N/A N/A
2017 0.0 (19.7) (18.2) (0.49) N/A N/A
2018e 0.0 (32.6) (32.3) (0.96) N/A N/A
2019e 0.0 (34.0) (34.5) (1.03) N/A N/A
29Edison Healthcare Insight | 20 September 2017

Sector: Pharma & healthcare
Price: €16.00Market cap: €800mMarket Madrid Stock Exchange
Share price graph (€)
Company descriptionLaboratorios Farmacéuticos ROVI is afully integrated Spanish specialitypharmaceutical company involved inthe development, in-licensing,manufacture and marketing of smallmolecule and speciality biologic drugswith a particular expertise in lowmolecular weight heparin (LMWH).
Price performance% 1m 3m 12mActual 0.0 2.8 19.4Relative* 1.0 6.9 0.3* % Relative to local indexAnalystDr Susie Jana
ROVI Laboratorios Farmaceuticos (ROVI)
INVESTMENT SUMMARY
ROVI, a profitable, speciality healthcare company, markets ~30 proprietary and in-licensedproducts across nine core franchises mainly in its domestic Spanish market. ROVI is at amajor inflection point; its internally developed biosimilar enoxaparin is the first to launch inkey European markets (marketing initiated in Germany in September), transforming thesales growth and operating margins of the business. Other top-line drivers include furtherproduct in-licensing and the potential launch (2021) of Risperidone-ISM (schizophrenia).
INDUSTRY OUTLOOK
ROVI has a strong presence in the Spanish heparin market (and select internationalmarkets through partners), where it has been manufacturing and marketing its flagshipproduct Hibor (second-generation LMWH) since 1998.
Y/E Dec Revenue EBITDA PBT EPS P/E P/CF(€m) (€m) (€m) (c) (x) (x)
2015 246.0 31.8 22.9 43.99 36.4 34.4
2016 265.2 39.3 30.3 58.11 27.5 27.0
2017e 277.3 28.7 19.6 36.87 43.4 17.4
2018e 305.4 40.7 31.1 58.16 27.5 34.8
Sector: Pharma & healthcare
Price: 48.27PLNMarket cap: PLN665mMarket Warsaw Stock Exchange
Share price graph (PLN)
Company descriptionSelvita is an R&D and drug discoveryservices company. It employs 352 staff(30% PhDs) and operates two mainbusiness units: Innovations Platform(internal NME pipeline) and ResearchServices (medicinal chemistry/biology,biochemistry).
Price performance% 1m 3m 12mActual (5.4) (28.0) 101.1Relative* (10.3) (34.0) 39.3* % Relative to local indexAnalystDr Jonas Peciulis
Selvita (SLV)
INVESTMENT SUMMARY
Selvita is an R&D and drug discovery services company. In H117 sales jumped by 109%y-o-y reflecting strong organic growth and an upfront payment from the partnering deal withBerlin Chemie/Menarini. SEL24’s out-licensing to Menarini in March 2017 was the first dealfor a proprietary clinical-stage asset and the total potential value of the deal was €89.1m.SEL24 is dual PIM/FLT3 inhibitor in Phase I/II for AML and the first such compound toprogress to Phase I/II, to our knowledge. Selvita's second lead product SEL120 is a CDK8inhibitor, partnered with the Leukemia & Lymphoma Society for AML and is undergoingIND-enabling studies. Multiple collaborations signed with partners such as Merck KGaA, H3Biomedicine (Eisai) and joint venture with Epidarex Capital to form Nodthera validateSelvita’s research capabilities. Cash position was PLN38m as of 11 September 2017. Weare updating our estimates.
INDUSTRY OUTLOOK
The profiles of SEL24 and SEL120 are potentially unique when compared to existingclinical-stage competitors and both candidates may offer efficacy and safety advantages.Contract research is a fiercely competitive, but still rapidly growing market and we believeSelvita’s geographical location and lower cost benefits make it well placed to compete.
Y/E Dec Revenue EBITDA PBT EPS P/E P/CF(PLNm) (PLNm) (PLNm) (gr) (x) (x)
2015 56.1 10.2 7.6 83.58 57.8 N/A
2016 66.7 8.3 4.6 64.22 75.2 N/A
2017e N/A N/A N/A N/A N/A N/A
2018e N/A N/A N/A N/A N/A N/A
30Edison Healthcare Insight | 20 September 2017

Sector: Pharma & healthcare
Price: US$2.21Market cap: US$52mMarket NASDAQ
Share price graph (US$)
Company descriptionSunesis Pharmaceuticals is apharmaceutical company focused ononcology. The company hasdeveloped SNS-062, a BTK inhibitorfor CLL for Imbruvica refractorypatients currently in Phase I/II.
Price performance% 1m 3m 12mActual (8.3) (25.3) (50.7)Relative* (9.4) (27.1) (58.0)* % Relative to local indexAnalystMaxim Jacobs
Sunesis Pharmaceuticals (SNSS)
INVESTMENT SUMMARY
Sunesis is a pharmaceutical company developing small molecule oncology drugs. Its leadprogram is SNS-062, a novel non-covalent, oral BTK inhibitor that may work in Imbruvicarelapsed and refractory patients. Data from a Phase Ia study in healthy volunteers wasrecently presented and indicated an attractive PK/PD profile with twice a day dosing. Thedrug is in a Phase Ib/II dose escalation/expansion trial targeting completion by September2018. The trial will enroll up to seven dose cohorts and up to 124 patients with confirmedImbruvica resistance mutations.
INDUSTRY OUTLOOK
Sunesis is an oncology company with an early stage asset with a validated target targetingpatients that are in B-cell malignancies.
Y/E Dec Revenue EBITDA PBT EPS P/E P/CF(US$m) (US$m) (US$m) (c) (x) (x)
2015 3.1 (35.8) (36.7) (301.72) N/A N/A
2016 2.5 (36.3) (38.0) (242.37) N/A N/A
2017e 0.7 (32.8) (33.8) (157.71) N/A N/A
2018e 0.0 (33.1) (35.5) (158.75) N/A N/A
Sector: Pharma & healthcare
Price: ¥227.00Market cap: ¥11120mMarket Tokyo
Share price graph (¥)
Company descriptionSymBio is a Japanese specialtypharma company with a focus ononcology, haematology and painmanagement. Treakisym wasin-licensed from Astellas in 2005.Rigosertib was in-licensed fromOnconova and IONSYS wasin-licensed from The MedicinesCompany.Price performance% 1m 3m 12mActual 0.4 (9.9) (8.5)Relative* (1.6) (12.2) (26.3)* % Relative to local indexAnalystDr Dennis Hulme
SymBio Pharmaceuticals (4582)
INVESTMENT SUMMARY
SymBio is well on the way to becoming a key speciality pharma partner for Asia-Pacificmarkets. The company has in-licensing deals for two orphan blood cancer products and apain management device (IONSYS). Treakisym is approved for r/r low grade NHL/MCL andduring 2016 received approvals in CLL and first-line low grade NHL/MCL; these recentapprovals could more than double current sales (JPY4.7bn in 2016). In August SymBioinitiated a Phase III trial in Japan of Treakisym in r/r diffuse large B-cell lymphoma.Intravenous Rigosertib is in development for myelodysplastic syndromes (MDS) and hasstarted a pivotal Phase III global study; SymBio is enrolling patients in Japan and interimdata are expected during H217. SymBio has initiated a Phase I study of high-dose oralrigosertib and intends to participate in a planned global trial in untreated higher-risk MDSpatients.
INDUSTRY OUTLOOK
SymBio is focused on in-licensing niche opportunities in hard-to-treat indications oftenoverlooked by big pharma. An in-house screening process to select additional pipelinecandidates for development and commercialisation will be key to driving operating leverage.
Y/E Dec Revenue EBITDA PBT EPS (fd) P/E P/CF(¥m) (¥m) (¥m) (¥) (x) (x)
2015 1933.0 (2527.0) (2630.0) (81.3) N/A N/A
2016 2368.0 (2101.0) (2317.0) (59.0) N/A N/A
2017e 2902.0 (3161.0) (3261.0) (69.1) N/A N/A
2018e 3820.0 (2272.0) (2284.0) (47.7) N/A N/A
31Edison Healthcare Insight | 20 September 2017
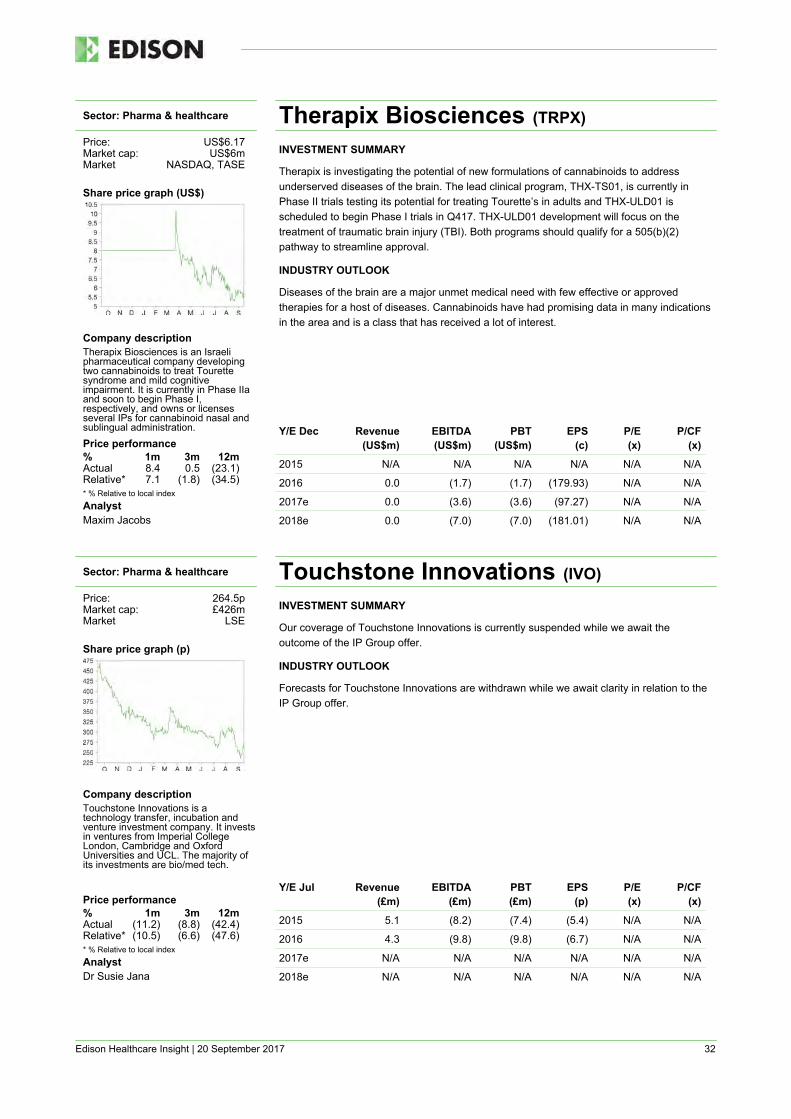
Sector: Pharma & healthcare
Price: US$6.17Market cap: US$6mMarket NASDAQ, TASE
Share price graph (US$)
Company descriptionTherapix Biosciences is an Israelipharmaceutical company developingtwo cannabinoids to treat Tourettesyndrome and mild cognitiveimpairment. It is currently in Phase IIaand soon to begin Phase I,respectively, and owns or licensesseveral IPs for cannabinoid nasal andsublingual administration.Price performance% 1m 3m 12mActual 8.4 0.5 (23.1)Relative* 7.1 (1.8) (34.5)* % Relative to local indexAnalystMaxim Jacobs
Therapix Biosciences (TRPX)
INVESTMENT SUMMARY
Therapix is investigating the potential of new formulations of cannabinoids to addressunderserved diseases of the brain. The lead clinical program, THX-TS01, is currently inPhase II trials testing its potential for treating Tourette’s in adults and THX-ULD01 isscheduled to begin Phase I trials in Q417. THX-ULD01 development will focus on thetreatment of traumatic brain injury (TBI). Both programs should qualify for a 505(b)(2)pathway to streamline approval.
INDUSTRY OUTLOOK
Diseases of the brain are a major unmet medical need with few effective or approvedtherapies for a host of diseases. Cannabinoids have had promising data in many indicationsin the area and is a class that has received a lot of interest.
Y/E Dec Revenue EBITDA PBT EPS P/E P/CF(US$m) (US$m) (US$m) (c) (x) (x)
2015 N/A N/A N/A N/A N/A N/A
2016 0.0 (1.7) (1.7) (179.93) N/A N/A
2017e 0.0 (3.6) (3.6) (97.27) N/A N/A
2018e 0.0 (7.0) (7.0) (181.01) N/A N/A
Sector: Pharma & healthcare
Price: 264.5pMarket cap: £426mMarket LSE
Share price graph (p)
Company descriptionTouchstone Innovations is atechnology transfer, incubation andventure investment company. It investsin ventures from Imperial CollegeLondon, Cambridge and OxfordUniversities and UCL. The majority ofits investments are bio/med tech.
Price performance% 1m 3m 12mActual (11.2) (8.8) (42.4)Relative* (10.5) (6.6) (47.6)* % Relative to local indexAnalystDr Susie Jana
Touchstone Innovations (IVO)
INVESTMENT SUMMARY
Our coverage of Touchstone Innovations is currently suspended while we await theoutcome of the IP Group offer.
INDUSTRY OUTLOOK
Forecasts for Touchstone Innovations are withdrawn while we await clarity in relation to theIP Group offer.
Y/E Jul Revenue EBITDA PBT EPS P/E P/CF(£m) (£m) (£m) (p) (x) (x)
2015 5.1 (8.2) (7.4) (5.4) N/A N/A
2016 4.3 (9.8) (9.8) (6.7) N/A N/A
2017e N/A N/A N/A N/A N/A N/A
2018e N/A N/A N/A N/A N/A N/A
32Edison Healthcare Insight | 20 September 2017

Sector: Pharma & healthcare
Price: €3.32Market cap: €187mMarket Euronext Paris
Share price graph (€)
Company descriptionTransgene is a French companydeveloping immunotherapy agents forcancer and infectious diseases.Oncolytic virus Pexa-Vec (Phase III forHCC) and cancer vaccine TG4010(Phase II for NSCLC) are the leadclinical candidates.
Price performance% 1m 3m 12mActual (2.1) 0.9 25.6Relative* (4.1) 1.2 4.7* % Relative to local indexAnalystJuan Pedro Serrate
Transgene (TNG)
INVESTMENT SUMMARY
Transgene is focused on the development of its cancer immunotherapy products (oncolyticvirus Pexa-Vec, MUC1 cancer vaccine TG4010) and infectious disease programs (TG1050for HBV and TG4001 for HPV) in combination with immune checkpoint inhibitors (ICIs). Fourcombination clinical trials have started: a Phase 2 trial testing TG4010+Opdivo in 2nd-lineNSCLC, a Phase 1 trial with Pexa-Vec+Yervoy in solid tumours, a Phase 1/2 ofPexa-Vec+metronomic cyclophosphamide in HER2 negative breast cancer and a Phase IIwith Pexa-Vec+Opdivo in 1st line advanced liver cancer. Transgene and partner Sillajen arerunning a global 600-patient Phase III study in liver cancer. TG1050 for HBV is advancingthrough Phase I/Ib testing. It has an agreement with Merck and Pfizer to evaluate TG4001with Avelumab in HPV+ Head & Neck Cancer patients in a Phase I/II study. Transgene alsohas a collaboration with BMS to test TG4010 in combination with Opdivo and chemotherapyin 1L NSCLC. Cash at 30 June 2017 was €43.9m, sufficient into end 2018.
INDUSTRY OUTLOOK
Immunotherapies are among the most promising class of products for cancer. Increasedattention is now being paid to the use of combination therapy approaches to improve cancerresponse rates further.
Y/E Dec Revenue EBITDA PBT EPS P/E P/CF(€m) (€m) (€m) (c) (x) (x)
2015 9.9 (25.7) (28.9) (78.08) N/A N/A
2016 10.3 (20.4) (23.1) (42.90) N/A N/A
2017e 8.3 (32.0) (35.0) (62.11) N/A N/A
2018e 8.6 (33.6) (36.8) (65.19) N/A N/A
Sector: Pharma & healthcare
Price: €1.66Market cap: €34mMarket Euronext Paris
Share price graph (€)
Company descriptionTxCell is developing regulatory T-celltherapies against autoimmune andinflammatory disorders. It is nowfocused on a novel CAR Tregtechnology platform. A clinical trial intransplantation may start in 2018.Ovasave for Crohn’s disease is atclinical stage but is on hold.
Price performance% 1m 3m 12mActual 5.1 (22.8) (43.5)Relative* 2.9 (22.6) (53.0)* % Relative to local indexAnalystDr John Savin
TxCell (TXCL)
INVESTMENT SUMMARY
TxCell has agreed a vital manufacturing supply contract with Lentigen, a producer of thecritical lentivirus reagent essential for modifying T-cells. This is a core element for thedevelopment of CAR-modified regulatory T-cells (CAR Treg). Production of any modifiedT-cell therapy is complex and companies need to be able to scale up production and keepcosts under control. In 2018, warrants could bring a further €10.8m in cash covering costsuntil the IND is filed for the first ever CAR Treg clinical trial. Cash on 30 June was €8.7m.
INDUSTRY OUTLOOK
Celgene’s $300m acquisition of Delinia, a preclinical Treg company, gives a benchmark onTreg deals. TxCell is developing two platform technologies: ENTrIA and ASTrIA. ENTrIAuses chimeric antigen receptor (CAR) technology. A granted European patent offers broadprotection. CAR Treg development is ongoing in transplant, lupus nephritis, Bullbouspemphigoid (skin) and multiple sclerosis. A collaboration with INSERM on MS andtransplant was announced in May.
Y/E Dec Revenue EBITDA PBT EPS P/E P/CF(€m) (€m) (€m) (c) (x) (x)
2015 0.9 (10.8) (10.8) (87.7) N/A N/A
2016 0.0 (11.9) (12.7) (97.6) N/A N/A
2017e 0.0 (11.1) (11.3) (55.5) N/A N/A
2018e 0.0 (11.0) (11.0) (31.4) N/A N/A
33Edison Healthcare Insight | 20 September 2017

Sector: Pharma & healthcare
Price: 15.6pMarket cap: £82mMarket AIM
Share price graph (p)
Company descriptionVernalis is a UK speciality pharmacompany with an FDA-approved,prescription-only cough cold treatment,Tuzistra XR; an FDA approvedamoxicillin, Moxatag; and a late-stageUS cough cold pipeline of fourproducts.
Price performance% 1m 3m 12mActual (2.3) (14.4) (63.9)Relative* (1.6) (12.4) (67.1)* % Relative to local indexAnalystDr Susie Jana
Vernalis (VER)
INVESTMENT SUMMARY
Investment into addressing barriers to higher Tuzistra XR prescribing is starting to translateinto higher prescription (Rx) rates; both Rx and sales are showing positive trends andgathering momentum. The FDA has issued a Complete Response Letter for the CCP-07NDA highlighting undisclosed outstanding questions (unrelated to formulation andpharmacokinetics), and CCP-08 NDA (indicating that the outstanding items which resultedin the CRL for CCP-07 remain and need to be addressed prior to the resubmission andapproval of both NDAs). We are placing our forecasts under review following the financialyear ended 30 June 2017 results.
INDUSTRY OUTLOOK
Generic IR liquid products dominate the US Rx cough cold market, reflecting difficulties informulating ER liquids that satisfy current FDA regulations; Tuzistra XR meets thesestandards. Favourable pricing and reimbursement of the five cough cold products indevelopment by Vernalis would value the addressable market at up to $3.5bn.
Y/E Jun Revenue EBITDA PBT EPS P/E P/CF(£m) (£m) (£m) (p) (x) (x)
2016 12.0 (23.9) (16.2) (3.4) N/A N/A
2017 20.8 (23.3) (21.2) (3.6) N/A N/A
2018e N/A N/A N/A N/A N/A N/A
2019e N/A N/A N/A N/A N/A N/A
Sector: Pharma & healthcare
Price: A$0.89Market cap: A$214mMarket ASX, OTC QX
Share price graph (A$)
Company descriptionViralytics is a biopharmaceuticalcompany developing Cavatak oncolyticvirotherapy to target late-stagemelanoma and other solid tumourtypes. It is trialling Cavatak as amonotherapy and in combination withcheckpoint inhibitors.
Price performance% 1m 3m 12mActual 1.1 (8.7) (3.8)Relative* 0.8 (7.7) (11.6)* % Relative to local indexAnalystDr Dennis Hulme
Viralytics (VLA)
INVESTMENT SUMMARY
Viralytics presented data at the American Association for Cancer Research (AACR) in Aprilshowing a 50% response rate (11/22) in patients with advanced melanoma treated with itsCavatak virotherapy in combination with Yervoy in the Phase Ib MITCI trial. An update atASCO showed a 23% response rate (3/13) in the subset of patients who had failed PD1/L1checkpoint inhibitor therapy; the trial has been expanded to recruit an extra 44 patients whohad failed prior PD1/L1 therapy. The CAPRA trial of Cavatak plus Keytruda has beenexpanded to enrol up to 50 late-stage melanoma patients following a 60% response rate inthe first 15 patients. Other ongoing trials include the Phase I/II CANON trial in superficialbladder cancer; and Keynote 200 (STORM Part B), a Phase Ib trial of IV Cavatak andKeytruda in advanced lung and bladder cancer. Cash at 30 June was A$34m.
INDUSTRY OUTLOOK
The FDA approval of Amgen's Imlygic has made oncolytic virotherapy a commercial reality.The December 2016 licence deal between Bristol-Myers Squibb and PsiOxus for itspreclinical oncolytic virus NG-348 highlights the potential value of oncolytic virotherapyproducts; terms included US$50m upfront and up to US$886m in milestones.
Y/E Jun Revenue EBITDA PBT EPS (fd) P/E P/CF(A$m) (A$m) (A$m) (c) (x) (x)
2015 2.5 (6.0) (5.5) (3.0) N/A N/A
2016 4.7 (8.5) (8.0) (3.8) N/A N/A
2017e 4.3 (12.2) (11.7) (4.9) N/A N/A
2018e 4.8 (11.7) (11.4) (4.7) N/A N/A
34Edison Healthcare Insight | 20 September 2017

Sector: Pharma & healthcare
Price: US$2.80Market cap: US$74mMarket NYSE MKT
Share price graph (US$)
Company descriptionVolitionRx is a Belgium-baseddiagnostics company focused ondeveloping blood-based cancerdiagnostics based on its proprietaryNu.Q™ technology. Its lead program isin colorectal cancer, which entered theEuropean market in 2017.
Price performance% 1m 3m 12mActual (3.4) (19.1) (42.3)Relative* (4.6) (21.0) (50.8)* % Relative to local indexAnalystMaxim Jacobs
VolitionRx (VNRX)
INVESTMENT SUMMARY
VolitionRx's proprietary Nu.Q™ technology detects the level and structure of nucleosomesin the blood using one drop of blood serum. It is currently focused on colorectal cancer(CRC), a very large opportunity with around 225 million people eligible for screening(US/EU). The company recently announced its first product, the Nu.Q™ Colorectal CancerScreening Triage Test received a CE Mark and may be included in the Danish nationalscreening program. Also, the company presented the final data from its 8,000-personclinical validation study of the Nu.Q™ Colorectal Cancer Screening Triage Test. Patientsscreened with this product would have required 24.5% fewer colonoscopies. VolitionRx willbe participating in a 13,500 undiagnosed person trial in the US to gain FDA approval.
INDUSTRY OUTLOOK
The blood-based cancer screening market is in its nascent stages with great potential andserves an unmet medical need. Currently there are few, if any, non-invasive screeningmethods for the vast majority of cancers.
Y/E Dec Revenue EBITDA PBT EPS P/E P/CF(US$m) (US$m) (US$m) (c) (x) (x)
2015 0.0 (10.0) (9.7) (54.49) N/A N/A
2016 0.0 (12.3) (12.3) (53.22) N/A N/A
2017e 0.0 (13.7) (13.7) (51.23) N/A N/A
2018e 1.3 (17.4) (18.5) (66.88) N/A N/A
Sector: Pharma & healthcare
Price: SEK80.50Market cap: SEK478mMarket NASDAQ OMX First North
Share price graph (SEK)
Company descriptionXbrane Biopharma is a Swedishdeveloper of generics . The leadproduct is triptorelin generic,Spherotide, for prostate cancer. Salesare being made in Iran. Xlucane, aLucentis biosimilar is produced usingan efficient manufacturing system.
Price performance% 1m 3m 12mActual 82.1 136.8 96.3Relative* 79.5 146.7 74.9* % Relative to local indexAnalystDr John Savin
Xbrane Biopharma (XBRANE)
INVESTMENT SUMMARY
The Iranian regulator approved the triptorelin generic Spherotide one-month formulation inJuly. H1 sales (mostly bulk Spherotide) were SEK 16.7m. Sales overall in 2017 could beover SEK 20m. The reported H1 loss was SEK 19.5m with a cash outflow before investmentand funding of SEK 16.2m. There was a May net SEK 17m equity issue; SEK 20m gross.Cash on 30 June was SEK 32.3m. European trials of Spherotide (one month) are plannedfor 2018. A three month formulation is in preclinical development. Xbrane hopes to concludea European partnering deal in the near term. A Chinese partner is expected bymanagement before the year end. A partner is being sought for Xlucane development.
INDUSTRY OUTLOOK
Triptorelin treats advanced prostate cancer, endometriosis and uterine fibroids. Sales in2015 for these were $380m. Xbrane is developing Xlucane, a biosimilar of Lucentis(ranibizumab) to treat wet age-related macular degeneration. Xbrane has a productionmethod that claims to lower biosimilar costs by 85%.
Y/E Dec Revenue EBITDA PBT EPS (fd) P/E P/CF(SEKm) (SEKm) (SEKm) (öre) (x) (x)
2015 0.4 (10.7) (11.0) (254.4) N/A N/A
2016 2.5 (26.9) (29.5) (585.5) N/A N/A
2017e 24.0 (13.6) (16.9) (363.1) N/A N/A
2018e 22.1 (92.2) (95.5) (2008.6) N/A N/A
35Edison Healthcare Insight | 20 September 2017

Edison Healthcare Insight | 20 September 2017 36
Company coverage
Company Note Date published 4SC Update; Update 30/03/2017; 17/05/2017 Abzena
Update; Update 11/07/2017; 19/07/2017 Acarix Update; Update 15/05/2017; 13/07/2017
Achillion Pharmaceuticals Update; Update 28/09/2016; 08/05/2017 AFT Pharmaceuticals
Update; Update 03/03/2017; 31/05/2017 Allium Medical Update; Update 24/07/2017; 05/09/2017
Angle Flash; Flash 16/06/2017; 05/07/2017 Arix Bioscience Initiation 20/04/2017 Atossa Genetics Flash; Update 30/03/2017; 30/05/2017 Basilea Pharmaceuticals Update; Update 07/03/2017; 11/07/2017 Bio-Light Life Sciences Update; Update 07/08/2017; 12/09/2017
Biondvax Pharmaceuticals Update; Update 15/05/2017; 13/07/2017
Carmat Flash; Outlook 05/05/2017; 31/07/2017
Celyad Update; ADR Update 14/08/2017; 15/08/2017 Collplant Holdings Update; Update 05/06/2017; 18/09/2017
Crossject Update; Update 09/12/2016; 07/04/2017 e-Therapeutics Outlook; Update 05/05/2017; 27/07/2017 Genkyotex Outlook; Update 30/05/2017; 06/07/2017 GW Pharmaceuticals Outlook; Update 05/04/2017; 22/08/2017 Hutchison China Meditech Update; ADR Update 13/06/2017; 13/06/2017 Hybrigenics Outlook; Update 12/05/2017; 29/08/2017 Immunovia Update; Update 20/12/2016; 30/03/2017
Intec Pharma Update; Update 27/07/2017; 29/08/2017 International Stem Cell Update; Update 27/04/2017; 24/05/2017 Kiadis Pharma Update; Update 08/12/2016; 06/01/2017
MagForce DB Update; Update 13/07/2017; 11/08/2017
Medigene Update; Update 11/07/2017; 03/08/2017 Mesoblast Update; Update 05/04/2017; 07/06/2017 Mologen Update; Update 14/11/2016; 16/05/2017 MorphoSys Outlook 17/05/2016 Nanobiotix Outlook; Outlook 31/05/2016; 02/02/2017 NetScientific Update; Update 05/05/2017; 13/07/2017
NeuroVive Pharmaceutical Initiation; Update 29/06/2017; 25/08/2017
Newron Pharmaceuticals Update; Flash 13/03/2017; 22/03/2017 Novogen Update; ADR Update 11/09/2017; 11/09/2017
Nuevolution QuickView; Initiation 04/01/2017; 16/02/2017
Onxeo Flash; Flash 06/07/2017; 14/09/2017
Orexigen Therapeutics Outlook; Update 16/06/2017; 17/08/2017
Orexo Update; Update 09/06/2017; 08/08/2017
Oryzon Genomics Flash; Update 21/07/2017; 22/08/2017
Oxford BioMedica Update; Update 25/07/2017; 01/09/2017
Pacific Edge Update; Update 13/02/2017; 01/06/2017
Paion Update; Update 07/07/2017; 14/08/2017
PDL BioPharma Update; Update 10/05/2017; 10/08/2017
PharmaMar Update; Update 03/05/2017; 19/07/2017
Photocure Update; Update 06/06/2017; 01/09/2017

Edison Healthcare Insight | 20 September 2017 37
Pixium Vision Flash; Update 26/05/2017; 22/08/2017
Pluristem Therapeutics Update; Update 28/02/2017; 20/06/2017
Prima BioMed ADR Update; Update 23/03/2017; 23/06/2017
Probiodrug Update; Update 16/06/2017; 18/09/2017
Quantum Genomics Update; Update 04/04/2017; 27/06/2017
Redhill Biopharma Update; Update 17/07/2017; 22/08/2017
Regeneus Update; Update 31/05/2017; 07/09/2017
ReNeuron Group Update; Update 02/05/2017; 06/07/2017
ROVI Laboratorios Farmaceuticos Initiation 12/07/2017
Selvita Outlook; Flash 20/03/2017; 28/03/2017 Sunesis Pharmaceuticals Update; Update 10/05/2017; 03/08/2017
SymBio Pharmaceuticals Outlook; ADR Outlook 27/02/2017; 27/02/2017
Therapix Biosciences Initiation; Update 29/06/2017; 18/08/2017
Touchstone Innovations Update; Update 06/01/2017; 04/04/2017
Transgene Update; Outlook 24/03/2017; 18/07/2017
TxCell Update; Update 14/03/2017; 11/07/2017 Vernalis Update; Update 24/04/2017; 19/07/2017
Viralytics Update; Outlook 09/03/2017; 19/04/2017 VolitionRx
Update; Update 16/05/2017; 21/08/2017
Xbrane Biopharma Initiation; Update 10/02/2017; 01/03/2017

Edison Healthcare Insight | 20 September 2017 38
Investment companies
BB Biotech AG Investment trust review 09/02/2016; 27/02/2017
Biotech Growth Trust (The)
Investment trust review 20/07/2016; 21/02/2017
International Biotechnology Trust
Investment trust review
03/03/2015; 11/12/2015
QuickViews
To view the QuickViews we publish see the healthcare sector profile page on our website.

Healthcare quarterly | 10 April 2013 2
Edison is an investment research and advisory company, with offices in North America, Europe, the Middle East and AsiaPac. The heart of Edison is our world-renowned equity research platform and deep multi-sector expertise. At Edison Investment Research, our research is widely read by international investors, advisers and stakeholders. Edison Advisors leverages our core research platform to provide differentiated services including investor relations and strategic consulting. Edison is authorised and regulated by the Financial Conduct Authority. Edison Investment Research (NZ) Limited (Edison NZ) is the New Zealand subsidiary of Edison. Edison NZ is registered on the New Zealand Financial Service Providers Register (FSP number 247505) and is registered to provide wholesale and/or generic financial adviser services only. Edison Investment Research Inc (Edison US) is the US subsidiary of Edison and is regulated by the Securities and Exchange Commission. Edison Investment Research Limited (Edison Aus) [46085869] is the Australian subsidiary of Edison and is not regulated by the Australian Securities and Investment Commission. Edison Germany is a branch entity of Edison Investment Research Limited [4794244]. www.edisongroup.com DISCLAIMER Copyright 2017 Edison Investment Research Limited. All rights reserved. This report has been prepared and issued by Edison for publication globally. All information used in the publication of this report has been compiled from publicly available sources that are believed to be reliable, however we do not guarantee the accuracy or completeness of this report. Opinions contained in this report represent those of the research department of Edison at the time of publication. The securities described in the Investment Research may not be eligible for sale in all jurisdictions or to certain categories of investors. This research is issued in Australia by Edison Aus and any access to it, is intended only for "wholesale clients" within the meaning of the Australian Corporations Act. The Investment Research is distributed in the United States by Edison US to major US institutional investors only. Edison US is registered as an investment adviser with the Securities and Exchange Commission. Edison US relies upon the "publishers' exclusion" from the definition of investment adviser under Section 202(a)(11) of the Investment Advisers Act of 1940 and corresponding state securities laws. As such, Edison does not offer or provide personalised advice. We publish information about companies in which we believe our readers may be interested and this information reflects our sincere opinions. The information that we provide or that is derived from our website is not intended to be, and should not be construed in any manner whatsoever as, personalised advice. Also, our website and the information provided by us should not be construed by any subscriber or prospective subscriber as Edison’s solicitation to effect, or attempt to effect, any transaction in a security. The research in this document is intended for New Zealand resident professional financial advisers or brokers (for use in their roles as financial advisers or brokers) and habitual investors who are “wholesale clients” for the purpose of the Financial Advisers Act 2008 (FAA) (as described in sections 5(c) (1)(a), (b) and (c) of the FAA). This is not a solicitation or inducement to buy, sell, subscribe, or underwrite any securities mentioned or in the topic of this document. This document is provided for information purposes only and should not be construed as an offer or solicitation for investment in any securities mentioned or in the topic of this document. A marketing communication under FCA rules, this document has not been prepared in accordance with the legal requirements designed to promote the independence of investment research and is not subject to any prohibition on dealing ahead of the dissemination of investment research. Edison has a restrictive policy relating to personal dealing. Edison Group does not conduct any investment business and, accordingly, does not itself hold any positions in the securities mentioned in this report. However, the respective directors, officers, employees and contractors of Edison may have a position in any or related securities mentioned in this report. Edison or its affiliates may perform services or solicit business from any of the companies mentioned in this report. The value of securities mentioned in this report can fall as well as rise and are subject to large and sudden swings. In addition it may be difficult or not possible to buy, sell or obtain accurate information about the value of securities mentioned in this report. Past performance is not necessarily a guide to future performance. Forward-looking information or statements in this report contain information that is based on assumptions, forecasts of future results, estimates of amounts not yet determinable, and therefore involve known and unknown risks, uncertainties and other factors which may cause the actual results, performance or achievements of their subject matter to be materially different from current expectations. For the purpose of the FAA, the content of this report is of a general nature, is intended as a source of general information only and is not intended to constitute a recommendation or opinion in relation to acquiring or disposing (including refraining from acquiring or disposing) of securities. The distribution of this document is not a “personalised service” and, to the extent that it contains any financial advice, is intended only as a “class service” provided by Edison within the meaning of the FAA (ie without taking into account the particular financial situation or goals of any person). As such, it should not be relied upon in making an investment decision. To the maximum extent permitted by law, Edison, its affiliates and contractors, and their respective directors, officers and employees will not be liable for any loss or damage arising as a result of reliance being placed on any of the information contained in this report and do not guarantee the returns on investments in the products discussed in this publication. FTSE International Limited (“FTSE”) © FTSE 2017. “FTSE®” is a trade mark of the London Stock Exchange Group companies and is used by FTSE International Limited under license. All rights in the FTSE indices and/or FTSE ratings vest in FTSE and/or its licensors. Neither FTSE nor its licensors accept any liability for any errors or omissions in the FTSE indices and/or FTSE ratings or underlying data. No further distribution of FTSE Data is permitted without FTSE’s express written consent.

Frankfurt+49 (0)69 78 8076 960 Schumannstrasse 34b 60325 Frankfurt Germany
London +44 (0)20 3077 5700 280 High Holborn London, WC1V 7EE United Kingdom
New York +1 646 653 7026 295 Madison Avenue, 18th Floor 10017, New York US
Sydney +61 (0)2 8249 8342 Level 12, Office 1205 95 Pitt Street, Sydney NSW 2000, Australia
Edison Investment Research Limited is registered in England. Registered office: 280 High Holborn, London, WC1V 7EE. Company number 4794244. www.edisongroup.com