
Edinburgh Research Explorer · IEE Proceedings on Generation, Transmission and Distribution...
18
Edinburgh Research Explorer Vulnerability of Hydropower Projects to Climate Change Citation for published version: Harrison, G & Whittington, HW 2002, 'Vulnerability of Hydropower Projects to Climate Change' IEE Proceedings on Generation, Transmission and Distribution, vol. 149, pp. 249-255. DOI: 10.1049/ip- gtd:20020173 Digital Object Identifier (DOI): 10.1049/ip-gtd:20020173 Link: Link to publication record in Edinburgh Research Explorer Document Version: Peer reviewed version Published In: IEE Proceedings on Generation, Transmission and Distribution Publisher Rights Statement: This paper is a preprint of a paper accepted by IEE Proc Generation, Transmission and Distribution and is subject to Institution of Engineering and Technology Copyright. When the final version is published, the copy of record will be available at IET Digital Library General rights Copyright for the publications made accessible via the Edinburgh Research Explorer is retained by the author(s) and / or other copyright owners and it is a condition of accessing these publications that users recognise and abide by the legal requirements associated with these rights. Take down policy The University of Edinburgh has made every reasonable effort to ensure that Edinburgh Research Explorer content complies with UK legislation. If you believe that the public display of this file breaches copyright please contact [email protected] providing details, and we will remove access to the work immediately and investigate your claim. Download date: 02. Dec. 2018
Transcript of Edinburgh Research Explorer · IEE Proceedings on Generation, Transmission and Distribution...

Edinburgh Research Explorer
Vulnerability of Hydropower Projects to Climate Change
Citation for published version:Harrison, G & Whittington, HW 2002, 'Vulnerability of Hydropower Projects to Climate Change' IEEProceedings on Generation, Transmission and Distribution, vol. 149, pp. 249-255. DOI: 10.1049/ip-gtd:20020173
Digital Object Identifier (DOI):10.1049/ip-gtd:20020173
Link:Link to publication record in Edinburgh Research Explorer
Document Version:Peer reviewed version
Published In:IEE Proceedings on Generation, Transmission and Distribution
Publisher Rights Statement:This paper is a preprint of a paper accepted by IEE Proc Generation, Transmission and Distribution and issubject to Institution of Engineering and Technology Copyright. When the final version is published, the copy ofrecord will be available at IET Digital Library
General rightsCopyright for the publications made accessible via the Edinburgh Research Explorer is retained by the author(s)and / or other copyright owners and it is a condition of accessing these publications that users recognise andabide by the legal requirements associated with these rights.
Take down policyThe University of Edinburgh has made every reasonable effort to ensure that Edinburgh Research Explorercontent complies with UK legislation. If you believe that the public display of this file breaches copyright pleasecontact [email protected] providing details, and we will remove access to the work immediately andinvestigate your claim.
Download date: 02. Dec. 2018

Vulnerability of Hydropower Projects to Climate Change Revision: 20th December 2001 Dr Gareth P. Harrison and Prof. H. (Bert) W. Whittington Department of Electronics & Electrical Engineering, University of Edinburgh Address: Department of Electronics & Electrical Engineering
University of Edinburgh King's Buildings Mayfield Road Edinburgh EH9 3JL
Telephone: 0131 650 5583 Email: [email protected]

Abstract Gaseous emissions from fossil-fuelled electricity generation are major contributors to climate change. Limiting the extent of such change will depend, among other things, on the continuing and increased use of renewable sources including hydropower. Paradoxically, climate change itself may alter the availability of this natural resource, adversely affecting the financial viability of both existing and potential schemes. Here, a model is described to assess the relationship between changes in climate and the viability, technical and financial, of hydro development. A case study is presented both to validate the model and to predict the impact of climate change on a large potential scheme in Africa.

1. Introduction Despite international effort anthropogenic increases in atmospheric concentrations of “greenhouse” gases look set to rise further with the threefold increase in world energy demand expected by the end of the twenty-first century [1]. By 2100 global mean temperatures are forecast to rise by 1.4 to 5.8°C with an accompanying global mean precipitation levels will increase [2]. The impacts of such changes will be significant and far-reaching. Plans to control the rise in greenhouse gas concentrations have been put forward [3]: these aim to cut or stabilise emissions relative to 1990 levels, but to achieve the targets, the energy sector will have to change. Proposals include reducing reliance on fossil fuels, using more renewable energy and practising greater energy efficiency. Together with changes in other sectors, it is hoped that these measures will allow the climate to stabilise at a new equilibrium level. Over the next century or so, during which this new set of equilibrium conditions will be reached, a significant amount of new and replacement generating plant will be required to meet global demand. Internationally, the trend is towards deregulated electricity systems, so private investment will have to be used to fund this plant build. This, in turn, means that the behaviour of current and future investors will play a major role in whether emissions cuts are achieved. 2. Climate Change and Hydropower A rising demand for electricity, likely increases in fossil-fuel prices and the need for clean emission-free generation sources all appear to be trends in favour of increasing generation from alternative sources, including hydropower. Indeed, global hydropower production, currently supplying around 19% of global demand, is anticipated to increase threefold over the next century [1]. However, two issues may prevent this from occurring: 1. Increasing involvement of private capital may work against hydropower for a number of
reasons. Firstly private investors generally have a preference for lower capital cost options with faster payback; hydro capital costs are relatively high and payback periods longer than competing technologies. In addition, private investment generally expects a higher return than public investment.
2. The second issue is the role of climate. While precipitation is anticipated to increase on a global level, many parts of the world are anticipated to see significant drying [2]. Studies carried out indicate that declining river flows as a result of changes in climate will lead to declining hydropower production [4].
The two issues are linked: falling production potential will be detrimental to the economic viability of a scheme, reducing returns, raising unit prices and making investment in hydropower less likely. Analysis of these aspects is timely and important. 3. Investment Appraisal To assess the threat that climate change poses to future hydropower investment, there is a requirement for a robust appraisal methodology. The diverse nature of hydropower installations and climatic conditions precludes any form of accurate regional or global analysis at this stage, so analysis on a case by case basis is necessary. To assess the impact on investment, it is necessary to consider the problem from the standpoint of potential investors. They will be primarily concerned with the impact on a range of investment indicators, and, as such, a methodology derived from traditional hydropower appraisal has been devised by the authors. The techniques of hydropower appraisal are long established: basically, historic data on water flow characteristics are used as a predictor of future flow variations and levels. However, reliance on historic river flows may not be prudent given the prospect of climate change. Some

recent project appraisals have attempted to deal with climate change by uniformly altering river flows [5]. Unfortunately, this practice is inadequate as it fails to take into account the tendency of a river basin to amplify the effects of precipitation changes [6]. The necessary changes made to the traditional appraisal process are described in the following section. 4. Analytical Tool To take account of climate change, the traditional reliance on historic river flows was abandoned. A link was made between climatic variables and river flows in the form of a hydrological (or rainfall-runoff) model. This allows the relationship between climate and financial performance to be examined. The revised appraisal process is shown in Figure 1. The complexity of the task necessitated the development of software to facilitate a rapid and accurate exploration of the relationship between climate, hydropower production and financial performance. In line with standard practice for hydropower studies and recognising the limitations of available climatic data, the technique uses a monthly time step. Whilst recognising that this may reduce accuracy, it allows the use of simple representations for several components in the model, a priority, given the preliminary nature of the study. 4.1 Hydrological Model Hydrological models convert climatic inputs into runoff or other hydrological outputs and are in use in water resource design, operation and forecasting. A wide variety of examples exist with varying requirements for temporal and spatial data. For this application, a relatively simple water balance model was adopted and incorporated into the software to provide a basic accounting procedure for water flows within the catchment. The framework for the 'WatBal' model was originally developed by Kaczmarek and Krasuski [7] and elements of their approach adapted by Yates [8]. The simple lumped-parameter model represents the catchment as a single storage 'bucket' with inwards flows of water in the form of precipitation and outward flows of evapotranspiration (a measure of total moisture loss from the land surface from evaporation and plant transpiration) and several runoff components. It is shown schematically in Figure 2 [9]. The WatBal model has been widely reported, used in a variety of catchments with different climate types and sizes, and has compared favourably with other models. The model is novel in that it uses continuous functions of soil water storage levels to represent runoff and evapotranspiration. The water mass balance is represented as a differential equation [9]:
),,(),(),()( tzPETAETRtzRtzRtPdtdz
S BSSSEFFMAX −−−−= (1)
where SMAX is the maximum soil moisture storage, z is relative storage, PEFF is effective precipitation, RS is surface runoff, RSS is sub-surface runoff, RB is baseflow and PET and AET are, respectively, potential and actual evapotranspiration. All values are in mm/day except SMAX (in mm) and z (a value between 0 and 1). The inputs to the model are effective precipitation and a variety of climatic variables that enable PET to be calculated. In most cases, the former is simply the incident rainfall, although for snow-dominated catchments, a snowmelt and accumulation model is required. The key variable in the model is the relative soil moisture level, defined as the fraction of the maximum SMAX. The maximum soil moisture depends on the soil type and the topology, with deep soils, characteristic of tropical forests, possessing a large capacity, and thin rocky soils in mountainous areas having a relatively small capacity. The individual components of Equation 1 are presented in more detail as follows.

The maximum rate of moisture loss from the land surface through evaporation and plant transpiration is given by potential evapotranspiration. However, the actual evapotranspiration rate is a function of soil moisture level and PET [8]:
325
)(),,(2zz
tPETtzPETAET−= (2)
Although PET can be measured directly, it is more common to use one of many estimation methods (summarised by Shuttleworth [10]). The estimation method chosen for this application is the Priestley-Taylor reference crop measure, which provides good estimates with lower data requirements than other more complex techniques, and is given by [10]:
PET = � ( � / � + � ) (Rn - G) (3)
where Rn is the net radiation exchange for the surface (mm/day), ∆ is the gradient of the saturated water vapour pressure curve and γ the psychrometric constant (kPa °C-1). These values may be calculated using mean monthly temperature, vapour pressure and cloud cover data. The coefficient β depends on the climate type and may be taken as 1.26 or 1.74 in humid or arid climates, respectively [10]. For estimates over a reasonably large area the soil heat flux (G) is effectively zero and can be ignored [8]. All effective precipitation (PEFF) is assumed to enter the soil. Some will leave as surface runoff (RS), when the precipitation level is in excess of the baseflow, with the rate determined by the soil state and the surface runoff exponent (ε). Where there is a precipitation deficit, all moisture percolates deeper into the soil, according to:
)( BEFFS RPzR −= ε for PEFF > RB, else zero (4) The sub-surface discharge RSS is dependent on the storage state and the sub-surface runoff coefficient and exponents, α (mm/day) and κ, respectively. For most catchments, the relationship is quadratic, although in some cases a more linear relationship may be more appropriate [8]. καzRSS = (5) The total runoff RT (in mm/day) for a given time step is given by the sum of the three components with the baseflow determined from the 95% exceedance flow:
BSSST RRRR ++= (6) 4.1.1 Solution and Calibration The complexity of the differential equation (Equation 1) necessitates a numerical solution. The Runge-Kutta method was found to be most effective for this application as it avoids the finding of second derivatives (as in Taylor expansions) yet maintains accuracy [11]. Three model parameters require calibration in order to allow reproduction of historic river flow patterns: � , � and SMAX. Several search methods have been employed to calibrate the various forms of the WatBal model including heuristic approaches [8] and genetic algorithms (GA) [9]. In this instance a GA was chosen for calibration (by maximising the correlation between observed and simulated flows) and is also used for reservoir operations optimisation (see Section 4.5).

4.2 Reservoir Model The reservoir model takes a series of inflows and determines the energy produced based on the operating rules. It is designed to one of two types of operating rule, either on the basis of specified production targets or storage levels. The routines operate iteratively to capture the inter-relationships between many aspects of hydropower operation including hydraulic head and evaporation levels. Both routines account for spillage and evaporation, both of which are important when considering future climate effects. Operation on the basis of production target is controlled by a routine based on the industry standard US Army Corps of Engineers HEC-5 package [12] (as inferred from the user manuals). The routines assess the feasibility of meeting energy targets while taking account of the end storage levels and flow or energy limits. Although production is simulated on a monthly basis, the routine can cope with situations that demand greater temporal detail, e.g., where energy prices vary hourly. Adopting the approach of Simonovic and Srinivasan [13], each month can be divided such that each sub-period (e.g. an hour) represents the aggregation of conditions during that specified period throughout the month. To ensure continuity of data the starting storage in a given period of time is set at the level from the preceding period. Inflow and evaporation rates are assumed to be constant over the month and energy production considered constant over each sub-period. The second, more simple routine, determines the release necessary to meet the specified end-of-period storage level: where this would violate flow or storage constraints, the release is adjusted accordingly. 4.3 Electricity Market Model The electricity market model uses the energy production estimates from the reservoir model to determine revenue in each period. The model is designed to allow simulation of a wide variety of different market systems by allowing the user to specify the type of purchase contract for the station's output. A possible limitation on model validity is the simplifying assumption that the electricity network absorbs all energy produced, but the authors do not consider this to be a major impediment for preliminary investigations. The market model can utilise the genetic algorithm (described in Section 4.5) to determine optimal operational strategy. Dependent on the operational aim of the reservoir model, combinations of monthly storage levels or energy targets can be optimised to realise maximum financial benefit. An additional routine allows firm power capability to be determined on the basis of a user-defined reliability level. 4.4 Financial Model The financial model determines the financial performance of the project based on the revenue earned. It is fairly standard and allows the user to enter assumptions regarding project costs, future rates of inflation and interest and financing structure. The economic lifetime of the station determines the length of the financial analysis and, in this case, is limited by the availability of climatic and hydrological data. The minimum acceptable rate of return (MARR) defines the real discount rate used in net present value (NPV) and discounted payback calculations. The financial analysis determines a range of other measures including benefit-cost ratio, internal rate of return (IRR), return on investment (ROI), levelised unit cost, and various coverage ratios. 4.5 Analytical tools
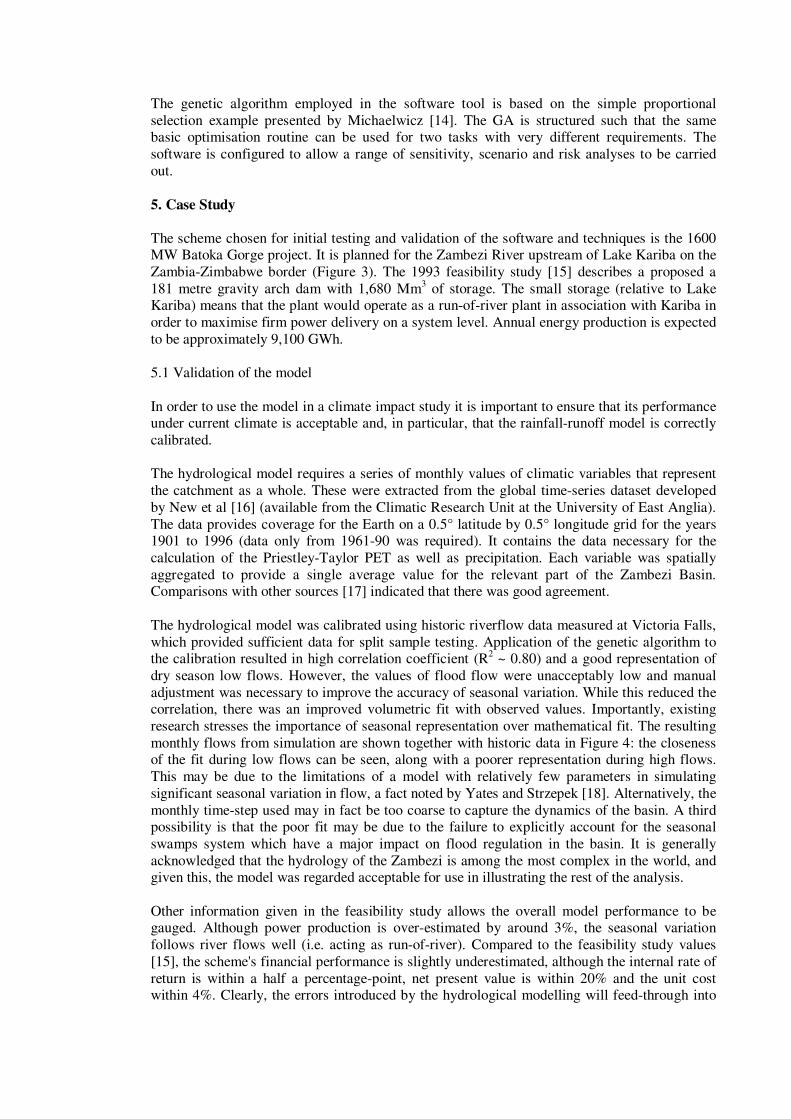
The genetic algorithm employed in the software tool is based on the simple proportional selection example presented by Michaelwicz [14]. The GA is structured such that the same basic optimisation routine can be used for two tasks with very different requirements. The software is configured to allow a range of sensitivity, scenario and risk analyses to be carried out. 5. Case Study The scheme chosen for initial testing and validation of the software and techniques is the 1600 MW Batoka Gorge project. It is planned for the Zambezi River upstream of Lake Kariba on the Zambia-Zimbabwe border (Figure 3). The 1993 feasibility study [15] describes a proposed a 181 metre gravity arch dam with 1,680 Mm3 of storage. The small storage (relative to Lake Kariba) means that the plant would operate as a run-of-river plant in association with Kariba in order to maximise firm power delivery on a system level. Annual energy production is expected to be approximately 9,100 GWh. 5.1 Validation of the model In order to use the model in a climate impact study it is important to ensure that its performance under current climate is acceptable and, in particular, that the rainfall-runoff model is correctly calibrated. The hydrological model requires a series of monthly values of climatic variables that represent the catchment as a whole. These were extracted from the global time-series dataset developed by New et al [16] (available from the Climatic Research Unit at the University of East Anglia). The data provides coverage for the Earth on a 0.5° latitude by 0.5° longitude grid for the years 1901 to 1996 (data only from 1961-90 was required). It contains the data necessary for the calculation of the Priestley-Taylor PET as well as precipitation. Each variable was spatially aggregated to provide a single average value for the relevant part of the Zambezi Basin. Comparisons with other sources [17] indicated that there was good agreement. The hydrological model was calibrated using historic riverflow data measured at Victoria Falls, which provided sufficient data for split sample testing. Application of the genetic algorithm to the calibration resulted in high correlation coefficient (R2 ~ 0.80) and a good representation of dry season low flows. However, the values of flood flow were unacceptably low and manual adjustment was necessary to improve the accuracy of seasonal variation. While this reduced the correlation, there was an improved volumetric fit with observed values. Importantly, existing research stresses the importance of seasonal representation over mathematical fit. The resulting monthly flows from simulation are shown together with historic data in Figure 4: the closeness of the fit during low flows can be seen, along with a poorer representation during high flows. This may be due to the limitations of a model with relatively few parameters in simulating significant seasonal variation in flow, a fact noted by Yates and Strzepek [18]. Alternatively, the monthly time-step used may in fact be too coarse to capture the dynamics of the basin. A third possibility is that the poor fit may be due to the failure to explicitly account for the seasonal swamps system which have a major impact on flood regulation in the basin. It is generally acknowledged that the hydrology of the Zambezi is among the most complex in the world, and given this, the model was regarded acceptable for use in illustrating the rest of the analysis. Other information given in the feasibility study allows the overall model performance to be gauged. Although power production is over-estimated by around 3%, the seasonal variation follows river flows well (i.e. acting as run-of-river). Compared to the feasibility study values [15], the scheme's financial performance is slightly underestimated, although the internal rate of return is within a half a percentage-point, net present value is within 20% and the unit cost within 4%. Clearly, the errors introduced by the hydrological modelling will feed-through into
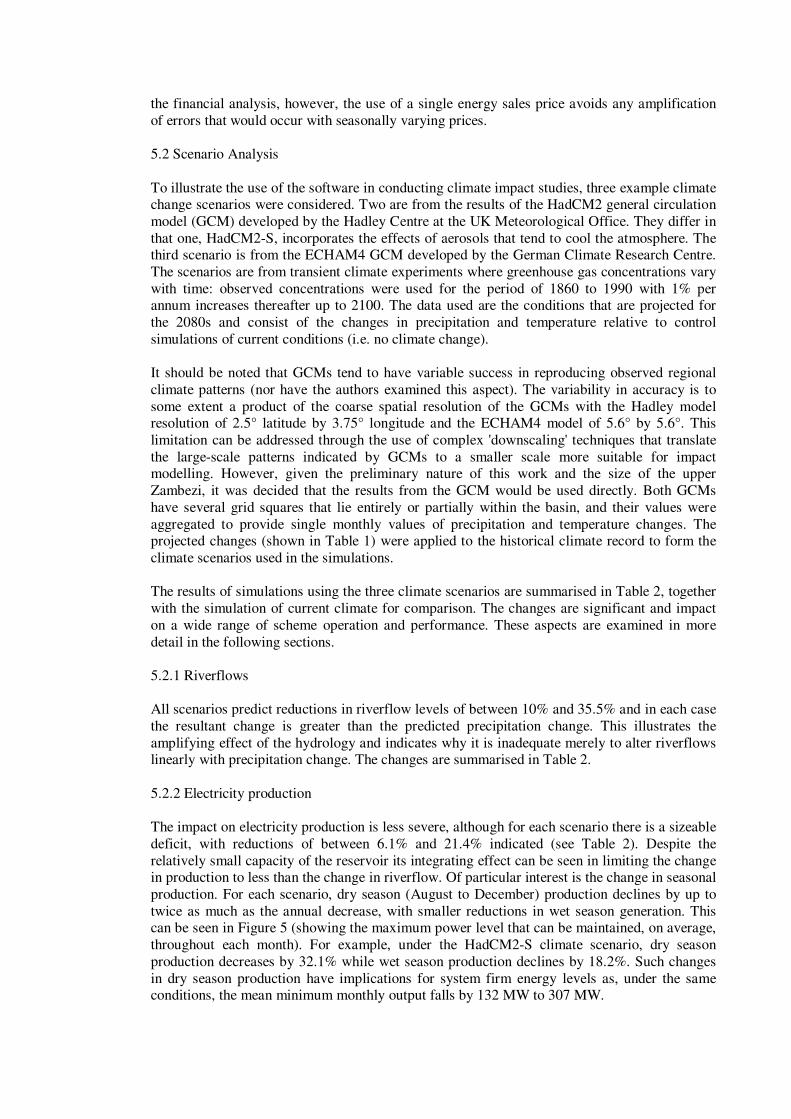
the financial analysis, however, the use of a single energy sales price avoids any amplification of errors that would occur with seasonally varying prices. 5.2 Scenario Analysis To illustrate the use of the software in conducting climate impact studies, three example climate change scenarios were considered. Two are from the results of the HadCM2 general circulation model (GCM) developed by the Hadley Centre at the UK Meteorological Office. They differ in that one, HadCM2-S, incorporates the effects of aerosols that tend to cool the atmosphere. The third scenario is from the ECHAM4 GCM developed by the German Climate Research Centre. The scenarios are from transient climate experiments where greenhouse gas concentrations vary with time: observed concentrations were used for the period of 1860 to 1990 with 1% per annum increases thereafter up to 2100. The data used are the conditions that are projected for the 2080s and consist of the changes in precipitation and temperature relative to control simulations of current conditions (i.e. no climate change). It should be noted that GCMs tend to have variable success in reproducing observed regional climate patterns (nor have the authors examined this aspect). The variability in accuracy is to some extent a product of the coarse spatial resolution of the GCMs with the Hadley model resolution of 2.5° latitude by 3.75° longitude and the ECHAM4 model of 5.6° by 5.6°. This limitation can be addressed through the use of complex 'downscaling' techniques that translate the large-scale patterns indicated by GCMs to a smaller scale more suitable for impact modelling. However, given the preliminary nature of this work and the size of the upper Zambezi, it was decided that the results from the GCM would be used directly. Both GCMs have several grid squares that lie entirely or partially within the basin, and their values were aggregated to provide single monthly values of precipitation and temperature changes. The projected changes (shown in Table 1) were applied to the historical climate record to form the climate scenarios used in the simulations. The results of simulations using the three climate scenarios are summarised in Table 2, together with the simulation of current climate for comparison. The changes are significant and impact on a wide range of scheme operation and performance. These aspects are examined in more detail in the following sections. 5.2.1 Riverflows All scenarios predict reductions in riverflow levels of between 10% and 35.5% and in each case the resultant change is greater than the predicted precipitation change. This illustrates the amplifying effect of the hydrology and indicates why it is inadequate merely to alter riverflows linearly with precipitation change. The changes are summarised in Table 2. 5.2.2 Electricity production The impact on electricity production is less severe, although for each scenario there is a sizeable deficit, with reductions of between 6.1% and 21.4% indicated (see Table 2). Despite the relatively small capacity of the reservoir its integrating effect can be seen in limiting the change in production to less than the change in riverflow. Of particular interest is the change in seasonal production. For each scenario, dry season (August to December) production declines by up to twice as much as the annual decrease, with smaller reductions in wet season generation. This can be seen in Figure 5 (showing the maximum power level that can be maintained, on average, throughout each month). For example, under the HadCM2-S climate scenario, dry season production decreases by 32.1% while wet season production declines by 18.2%. Such changes in dry season production have implications for system firm energy levels as, under the same conditions, the mean minimum monthly output falls by 132 MW to 307 MW.

Declining production has a direct and negative impact on the revenue stream. Mean monthly sales fall from $16.9 million to between $13.1 and $15.9 million (in 1993 US$, see Table 2). In addition to altering mean values, the climate-change scenarios result in more variation in production levels. Hence the revenue stream also becomes more variable, with the normalised standard deviation rising from 44.9% to between 49.4% and 57.2%. This is of importance as greater revenue variability could indicate potential for short-term cash flow problems. 5.2.3 Financial Viability of Scheme Reductions in electricity sales of these magnitudes have a major impact on the financial viability of the scheme. The impact on Net Present Value is significant, as Figure 6 shows. Here, the scenarios reduce NPV from $98.0 million by between $60.8 million and $214.8 million, with both Hadley scenarios indicating negative values. IRR also falls, from 11.00% to between 8.65% and 10.35%, while unit costs rise from US¢1.52/kWh to US¢1.62-1.92/kWh (again the changes may be found in Table 2). Under the rules of investment appraisal, a scheme will be considered viable if the NPV is positive at the chosen discount rate. Under the ECHAM4 scenario, NPV remains positive and would still be considered as a viable investment. However, both Hadley scenarios imply that the scheme would be regarded as non-viable and, on the basis of financial performance alone, would not proceed. 5.2.4 Implications of the Analysis Overall, the climate change scenarios examined here result in river flows, production and financial performance that are significantly different than that from historic climate conditions. Such climate changes would adversely affect the performance of the Batoka Gorge scheme, both in terms of its productive capability and its financial return. The scenarios presented here represent only a sample of the many plausible climate change scenarios that may deliver temperature changes in the range of 1.4 to 5.8°C. More importantly, the range of precipitation changes implied by the full range of scenarios includes many that project increased precipitation. With such a range of possibilities it is difficult to determine the most likely scenario of change. While expected value analysis will yield a single value for expected economic return, at present it is not possible to do this in an objective fashion, as there is major uncertainty attached to the probability of any given climate change scenario. However, given that a large component of investment decision-making still relies on subjective estimates, this does not rule out the use of climate scenarios for this purpose. Furthermore, as the scenarios used here compare the effects of climate change in isolation, they are therefore not fully realistic. It assumes that those managing the system have made no changes to the operational practice of the scheme despite the passing of a century, and that the climate has experienced a step change that may be regarded as highly unlikely. As such, the scenarios presented could be regarded as worst cases. A more realistic treatment would be to assume an evolving climate and, albeit less importantly, an evolving programme of operational practice. 6. Conclusions The use of fossil fuels in electricity generation is a major contributor to climate change. Limiting the extent of future change will depend very much on the continuing and increased use of renewable sources including hydropower. The trend towards deregulation will involve increasing amounts of private investment in the ESI and this may not favour hydro. More importantly, the very fact that climate is changing may alter the availability of this natural

resource. The impact of such changes in terms of their effect on the financial viability of schemes will be of particular interest to investors. In order to quantify the relationship between changing climate and scheme financial viability, a model was developed. Based on the traditional hydro appraisal process, the technique avoids the reliance on historic river flow patterns by linking climatic variables with river flows through the use of a hydrological model. The use and performance of the prototype software was examined through a case study. The model was found to perform well, given the inherent difficulties in the task. Simulations with scenarios depicting current and potential future climates were compared and illustrate the sensitivity of the case study scheme to changes in climate. Under the future climatic conditions examined there would be significant reductions in river flows, declining power production, reductions in electricity sales revenue and consequently an adverse impact on a range of investment measures; indeed, in several cases the scheme would be non-economic. While the authors do not claim that their analysis, in its current form, presents an exact predictor, they believe that the results of this study should be taken seriously. Therefore, efforts should be made to refine the methodology and to apply it in other regions of the world, since hydroelectric exploitation and climate change are both global issues.

Acknowledgements The authors wish to thank the Zambezi River Authority for their permission to use and publish data relating to the Batoka Gorge scheme. The first author is grateful for the financial support of the Department of Electronics and Electrical Engineering at the University of Edinburgh through the award of a Ph.D. Scholarship. The monthly climate time-series data was supplied by the Climate Impacts LINK Project (UK Department of the Environment Contract EPG 1/1/16) on behalf of the Climatic Research Unit, University of East Anglia.
References 1. NAKICENOVIC, N., GRUBLER, A. and MCDONALD, A. (EDS): 'Global Energy
Perspectives' (Cambridge University Press, Cambridge, 1998) 2. IPCC: 'Climate Change 2001: The Scientific Basis', Intergovernmental Panel on Climate
Change (Cambridge University Press, 2001) 3. UNFCCC: 'Kyoto Protocol to the United Nations Framework Convention on Climate
Change' (UNFCCC, Germany, 1998) 4. HARRISON, G.P. and WHITTINGTON, H.W.: 'Impact of climatic change on hydropower
investment', Hydropower in the new millennium - Proceedings of the 4th international conference, Hydropower '01, June 2001, Bergen, Norway, pp. 257-261
5. ARTHUR, J.: Private communication, 1999 6. ARNELL, N.: 'Global Warming, River Flows and Water Resources' (Wiley, Chichester,
1996) 7. KACZMAREK, Z. and KRASUSKI, D.: 'Sensitivity of water balance to climate change and
variability', Working Paper 91-47, International Institute for Applied Systems Analysis, Laxenburg, Austria, 1997
8. YATES, D.N.: 'WatBal: An integrated water balance model for climate impact assessment of river basin runoff', Water Resources Development, 1996, 12 (2), pp. 121-139
9. BOWLING, O.P. and STRZEPEK, K.M.: 'Examining the impacts of land-use change on hydrologic resources', Interim Report 97-31, International Institute for Applied Systems Analysis, Laxenburg, Austria, 1997
10. SHUTTLEWORTH, W.J.: 'Evaporation'. In: Maidment, D.R (Ed.), Handbook of Hydrology (McGraw-Hill, London, 1992, pp. 4.1-4.53)
11. MATHEWS, J.H.: 'Numerical Methods for Computer Science, Engineering, and Mathematics' (Prentice Hall International, Englewood Cliffs, 1987, pp. 395-444)
12. US ARMY CORPS OF ENGINEERS: 'HEC-5 Simulation of Flood Control and Conservation Systems', Users Manual, Hydrologic Engineering Center, Davis, USA, 1990
13. SIMONOVIC, S.P. and SRINIVASAN, R.: 'Explicit Stochastic Approach for Planning the Operation of Reservoirs for Hydropower Production'. In: Kundzewicz, Z.W., Rosbjerg, D., Simonovic, S.P. & Takeuchi, K. (Eds.), Extreme Hydrological Events: Precipitation, Floods and Droughts (IAHS Press, 1993, pp. 349-359)
14. MICHAELWICZ, Z.: 'Genetic algorithms + data structures = evolution programs' (Springer, London, 1996)
15. BATOKA JOINT VENTURE CONSULTANTS: 'Batoka Gorge Hydro Electric Scheme Feasibility Study Final Report', Zambezi River Authority, Lusaka, Zambia, 1993
16. NEW, M.G., HULME, M. and JONES, P.D.: 'Representing Twentieth Century space-time climate variability. II: Development of 1901-1996 monthly grids of terrestrial surface climate', J. Climate, 2000, 13, pp. 2217-2238
17. REIBSAME, W.E., STRZEPEK, K.M., WESCOAT JR., J.L., PERRITT, R., GAILE, G.L., JACOBS, J., LEICHENKO, R., MAGADZA, C., PHIEN, H., URBIZTONDO, B.J., RESTREPO, P., ROSE, W.R., SALEH, M., TI, L.H., TUCCI, C. and YATES, D.: 'Complex River Basins'. In: Strzepek, K.M. and Smith, J.B. (Eds.), As Climate Changes: International Impacts and Implications (Cambridge University Press, Cambridge, 1995, pp. 57-91)
18. YATES, D. and STRZEPEK, K.: 'Comparison of Models for Climate Change Assessment of River Basin Runoff', Working Paper WP-94-45, International Institute for Applied Systems Analysis, Laxenburg, Austria, 1994
Tables
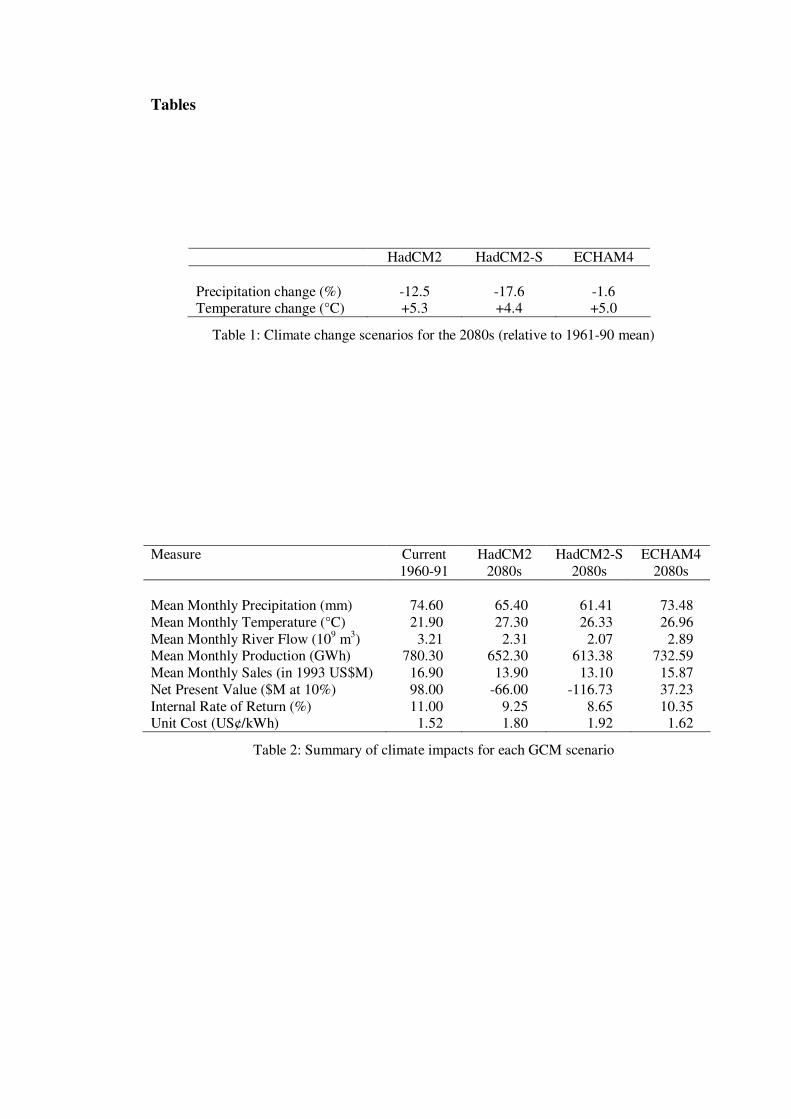
HadCM2 HadCM2-S ECHAM4 Precipitation change (%) -12.5 -17.6 -1.6 Temperature change (°C) +5.3 +4.4 +5.0
Table 1: Climate change scenarios for the 2080s (relative to 1961-90 mean) Measure Current
1960-91 HadCM2
2080s HadCM2-S
2080s ECHAM4
2080s Mean Monthly Precipitation (mm) 74.60 65.40 61.41 73.48 Mean Monthly Temperature (°C) 21.90 27.30 26.33 26.96 Mean Monthly River Flow (109 m3) 3.21 2.31 2.07 2.89 Mean Monthly Production (GWh) 780.30 652.30 613.38 732.59 Mean Monthly Sales (in 1993 US$M) 16.90 13.90 13.10 15.87 Net Present Value ($M at 10%) 98.00 -66.00 -116.73 37.23 Internal Rate of Return (%) 11.00 9.25 8.65 10.35 Unit Cost (US¢/kWh) 1.52 1.80 1.92 1.62
Table 2: Summary of climate impacts for each GCM scenario

Captions for Illustrations Figure 1: Adapting the financial appraisal process to take account of climate change Figure 2: Conceptual structure of the 'WatBal' hydrological model Figure 3: The Zambezi River Basin and the location of the proposed Batoka Gorge scheme Figure 4: Comparison of monthly observed and simulated river flows Figure 5: Monthly mean power levels under current and GCM scenarios Figure 6: Project NPV with Current and GCM Scenarios for the 2080s

Figures Figure 1
Figure 2
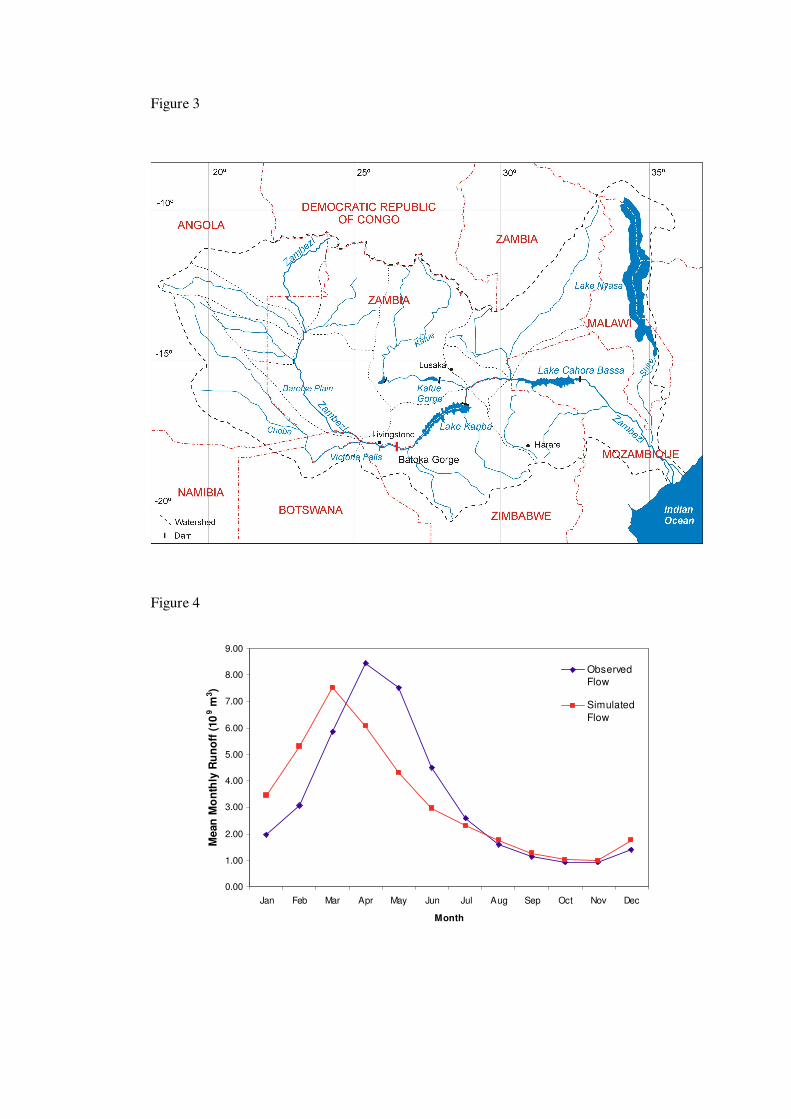
Figure 3
Figure 4
0.00
1.00
2.00
3.00
4.00
5.00
6.00
7.00
8.00
9.00
Jan Feb Mar Apr May Jun Jul Aug Sep Oct Nov Dec
Month
Mea
n M
ont
hly
Ru
noff
(10
9 m3 )
ObservedFlow
SimulatedFlow
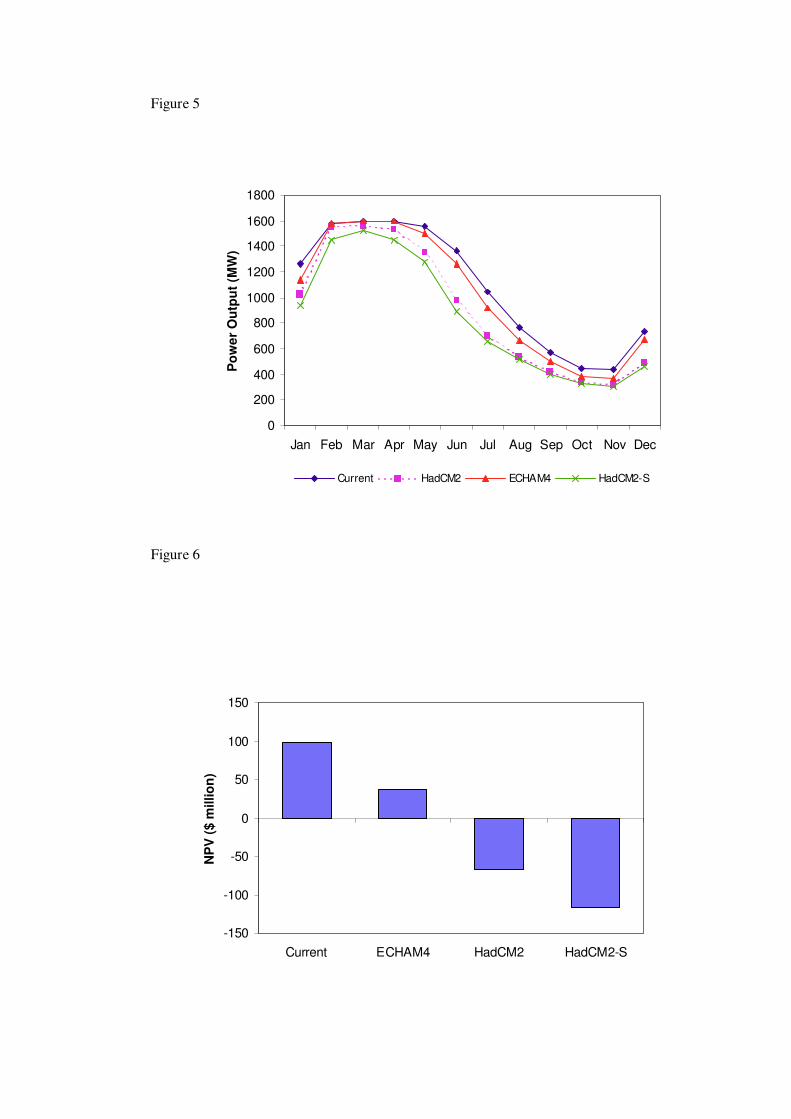
Figure 5
Figure 6
0
200
400
600
800
1000
1200
1400
1600
1800
Jan Feb Mar Apr May Jun Jul Aug Sep Oct Nov Dec
Pow
er O
utpu
t (M
W)
Current HadCM2 ECHAM4 HadCM2-S
-150
-100
-50
0
50
100
150
Current ECHAM4 HadCM2 HadCM2-S
NP
V ($
mill
ion)