EDGAR-HTAP: a harmonized gridded air pollution emission dataset ...
43
EDGAR-HTAPV1 SO 2 total emissions in ton per 0.1°x0.1° EDGAR-HTAP: a harmonized gridded air pollution emission dataset based on national inventories Greet Janssens-Maenhout, Frank Dentener, John van Aardenne, Suvi Monni, Valerio Pagliari, Lorenzo Orlandini, Zbigniew Klimont, Jun-ichi Kurokawa, Hajime Akimoto, Toshimasa Ohara, Robert Wankmüller, Bill Battye, Doug Grano, André Zuber, Terry Keating EUR 25229 EN - 2012 ° × ° 1 . 0 1 . 0 2 tonSO
Transcript of EDGAR-HTAP: a harmonized gridded air pollution emission dataset ...

EDGAR-HTAPV1 SO2 total emissions in ton per 0.1°x0.1°
EDGAR-HTAP: a harmonized gridded air pollution emission dataset based on national inventories
Greet Janssens-Maenhout, Frank Dentener, John van Aardenne, Suvi Monni, Valerio Pagliari, Lorenzo Orlandini, Zbigniew Klimont, Jun-ichi Kurokawa,
Hajime Akimoto, Toshimasa Ohara, Robert Wankmüller, Bill Battye, Doug Grano, André Zuber, Terry Keating
EUR 25229 EN - 2012
°×° 1.01.02tonSO

European Commission Joint Research Centre Institute for Environment and Sustainability Contact information Greet Janssens-Maenhout Address: Via E. Fermi, 2749 E-mail: [email protected] Tel: +390332785831 Fax: +390332785837 http://ies.jrc.ec.europa.eu/ http://www.jrc.ec.europa.eu/ Legal Notice Neither the European Commission nor any person acting on behalf of the Commission is responsible for the use which might be made of this publication.
Europe Direct is a service to help you find answers to your questions about the European Union
Freephone number (*):
00 800 6 7 8 9 10 11
(*) Certain mobile telephone operators do not allow access to 00 800 numbers or these calls may be billed.
A great deal of additional information on the European Union is available on the Internet. It can be accessed through the Europa server http://europa.eu/ JRC 68434 EUR 25229 ISBN 978-92-79-23123-0 doi:10.2788/14102 Luxembourg: Publications Office of the European Union © European Union, 2012 Reproduction is authorised provided the source is acknowledged Printed in Italy

3
EDGAR-HTAP: a harmonized gridded air pollution emission dataset based on national inventories
October 2011
Greet Janssens-Maenhout1, Frank Dentener1, John van Aardenne2, Suvi Monni3, Valerio Pagliari1, Lorenzo Orlandini4, Zbigniew Klimont5, Jun-ichi Kurokawa6, Hajime Akimoto6, Toshimasa Ohara7, Robert Wankmüller8, Bill Battye9, Doug Grano9, André Zuber11, Terry Keating10 1 EC Joint Research Centre (JRC), Inst. Environment & Sustainbility, Via Fermi, 2749, 21027 Ispra, ITALY 2 ex-JRC, now at European Environment Agency, Kongens Nytorv, 6, 1050 Copenhagen, DENMARK 3 ex-JRC, now at Benviroc Ltd. Lekkerikuja, 1B21, 02230 Espoo, FINLAND 4 ex-JRC, now at EC DG Agriculture & Rural Development, Rue de la Loi 130, B-1049 Brussels, BELGIUM 5 International Institute for Applied Analysis, Schloßplatz, 12361 Laxenburg, AUSTRIA 6 Asia Center for air Pollution Research, 1182 Sowa, Nishi-ku, Niigata 950-2144, JAPAN 7 National Institute for Environmental Studies, 16-2 Onogawa, Tsukuba 305-8506, JAPAN 8 Federal Environment Agency, Spittelauer Lände, 5, 1090 Vienna, AUSTRIA 9 EC/R Inc., 501 Eastowne Drive, Suite 250,Chap. Hill, North-Carolina 27524, USA, contracted by U.S. EPA10 U.S. EPA - Office of Air & Radiation, 1200 Pennsylvania Av. NW, Washington DC 20460, USA 11 EC DG Environment, EG-ENV-C1, Beaulieulaan, B-1160 Brussels, BELGIUM

4
Abstract On the global scale the harmonization and improvement of emission inventories is imperative to get consolidated estimates on formation of global air pollution, and it’s influence on human health and climate, and so on the benefit of future policies combating these air pollution aspects. The EDGAR-HTAP project compiled a global emission dataset with annual inventories for CH4, NMVOC, CO, SO2, NOx, NH3, PM10, PM2.5, BC and OC and covering the period 2000-2005 using, to the extent possible, official or scientific inventories at the national or regional scale that are likely to be acceptable for policy makers in each region of the world. This compilation of different official inventories from EMEP, UNFCCC, EPA for USA, GAINS for China and REAS was first gap-filled with global emission data of EDGARv4.1. The IPCC code or UNFCCC’s Common Reporting Format, is used as key for harmonizing the data at sector level. Next, the resulting emissions by country and sector were allocated to a 0.1º × 0.1º grid consistently using the EDGARv4.1 proxy data. The emissions of EDGAR-HTAP were compared with the emission inventory used for the Representative Concentration Pathways for the next IPCC Assessment Report Differences between the national inventories and other bottom-up estimates shows the impact of using higher tier methods and/or country-specific emission factors for compiling a national inventory. Weaknesses in the official emission reports in the EMEP domain were in particular found for diffusive sources. A paradigm of high quality emission inventories consists in scoring high for IPCC’s ‘T-A-C-C-C-A’ (Transparency –Accuracy- Consistency – Comparability –Completeness) principles. Weaknesses remain in the coherency across borders between different national inventories, in particular when using different datasets applying different inventorying techniques. Therefore the EDGAR-HTAP_V1 can not be considered as a consistent global time series dataset, but can be recommended as a summary with indicative national totals subject to emission reduction policies.

5
Table of contents
Abstract
1. Introduction
2. EDGAR-HTAP Datasets
2.1 Components of EDGAR-HTAP
2.2 EMEP: Inventories submitted by Parties to the LRTAP Convention
2.3 UNFCCC: Inventories submitted by Annex I Parties of the Kyoto Protocol
2.4 Asian countries: GAINS and REAS inventories
2.5 Other regions: Gap-filling and gridding with EDGARv4.1
2.6 US EPA dataset for 2002 and 2005
3 Results
3.1 HTAP_V1 emission inventory
3.1.1 Sector-specific annual totals for 2000-2005
3.1.2 Geospatial distribution on gridmaps of 0.1°x0.1°
3.2 Intercomparison of HTAP_V1 2000 inventory with RCP data and with EDGARv4.2
4 Concluding discussion with lessons learned for the future
4.1 Concluding remarks
4.2 Outlook
References
Annexes
Annex 1: Relationship between EMEP, UNFCCC, GAINS, EDGAR and HTAP emission categories.
Annex 2: Country total emissions
Annex 3: Proxy datasets.

6

7
1. Introduction
Common international understanding of global air pollution, and its influence on human health and climate, is imperative for providing a basis for future international policies and a prime objective for the Task Force Hemispheric Transport of Air Pollution (TF HTAP), www.htap.org. While nowadays many countries and regions report their air pollutant emissions, these emissions may not be readily accessible, their quality may widely differ, and they are presented in various details and formats. On request of the European Commission’s DG ENV, the Joint Research Centre (JRC) has, together with a number of international organizations, compiled a harmonized global, gridded, air pollution emission dataset for 2000 to 2005 using, to the extent possible, officially reported inventories at the national scale, complemented with science based inventories where nationally reported data were not available. JRC’s team in charge of the Emissions Database for Global Atmospheric Research (EDGAR) named the resulting inventory, EDGAR-HTAP, which is a compilation, as opposed to a globally consistent inventory calculated using activity data and emission factors. In order to provide a complete global picture, this compilation of different official inventories is represented in a harmonized way and gap-filled with global emission data of EDGARv4.1 (http://edgar.jrc.ec.europa.eu, July 2010). The final emission datasets are reported for the years 2000-2005, for 10 aggregated sectors and on a global 0.1º × 0.1º resolution. A separate a 0.5º × 0.5º gridded dataset is available from the US EPA, for the years 2002 and 2005, complementary to the data in EDGAR-HTAP, providing additional details in sectoral, spatial and temporal resolution than EDGAR-HTAP. EDGAR-HTAP-v1 was completed in October 2010, and partly described in the final report of TF HTAP (HTAP, 2010). Box 1 gives an overview of the different datasets available at the EDGAR-server. This document further describes the contents of EDGAR-HTAP, the assumptions, dataflows and consistency of the data used to create EDGAR-HTAP. A comparison of country and region data between a number of contributing and alternative datasets is also presented.
Box 1: Nomenclature EDGARv4 is a bottom-up emissions database based on JRC’s evaluation of internationally reported activity data (i.e. fuel use, land-use, quantity of industrial products, number of animals), and worldwide consistent assumptions on emission factors associated with these activities for each technology and corrected for end-of-pipe abatement measures. The resulting sector-specific emission trends are publicly available as country totals or on a 0.1°x0.1° grid. EDGARv4.1 can be accessed on http://edgar.jrc.ec.europa.eu/overview.php since July 2010. In the summer 2011 version v4.1 was updated with the release of the EDGARv4.2 version, with some air pollutants to follow in 2012. EOLO: Both the EDGARv4.1 database and the EDGAR-HTAP emission dataset were included and generated using JRC EOLO webserver http://edgar.jrc.it/eolo. Access to EOLO (password protected) is granted on a case-by-case basis. EDGAR-HTAP uses nationally reported emissions, combined with regional scientific inventories, all gridded with geospatial data from EDGARv4.1, and for countries or sector without reported data, complemented with data directly from EDGARv4.1. EDGAR-HTAP is available from EOLO, both versions HTAP_V1 of October 2010, also used in Chapter 3 of the HTAP report. The static version of the EDGAR-HTAP (EDGAR-HTAP_V1) is currently made available via http://edgar.jrc.ec.europa.eu/national_reported_data/htap.php, and the CIERA server, distribution via the ECCAD server is also foreseen.

8
2. EDGAR-HTAP Datasets
2.1 Components of EDGAR-HTAP
Currently available global emission inventories differ in the compounds considered, regions, emission sources covered, in short they differ in completeness, spatial and temporal resolution. Lamarque et al. (2010) provides a unique example of comprehensive historical dataset but based on emissions for the baseyear 2000 that is extrapolated in time according Representative Concentration Pathways. Atmospheric modelers, therefore, often compile their own emission inputs, drawing upon different pieces of the available inventories. These compilations, involve sometimes arbitrary choices, and are often not clearly described. For example, the atmospheric modeling groups, who contributed to the HTAP multi-model experiments and described in HTAP (2010), used their own best estimates for emissions for the year 2001, resulting in some cases similar global emissions (e.g. NOx, SO2), and sometimes large differences (NMVOC emissions). Moreover, in HTAP (2010) the consistency with nationally reported emission data is not clear. To serve policymakers, utmost use of well documented national inventories was a prime objective and gapfilling with scientific inventories for completing the global picture a second one. In this way, a global emissions dataset. EDGAR-HTAP was compiled for 2000 to 2005 using, to the extent possible, official or scientific inventories at the national or regional scale and hence mostly consistent with information available on national policy level in each region of the world. With view on the later use in chemical transport models the inventory included all air pollutants and particles as listed in box 2.
The resulting inventory is a compilation, as opposed to a top-down consistent inventory calculated using activity data and emission factors. The name EDGAR-HTAP was chosen to reflect that the database was generated, on request of the Task Force Hemispheric Transport of Air pollution, by the EDGAR team using the EOLO infrastructure, to generate complete, gridded, and gap-filled emission data for further use by modelers. However, as outlined below, a number of other international institutions have significantly contributed provided data to facilitate the generation of EDGAR-HTAP. The task of the EDGAR team was three-fold: a) collection and selection of official emission inventories, which were mainly provided by other international institutions, b) gapfilling for some regions or for some sectors, c) gridding of the compiled global emission inventory. The third task was preferred to the possible cut-and-paste action of available emission gridmaps because gridding of the global emission inventory with one single proxy dataset ensures single location of multi-pollutant sources and as such chemical reaction of co-emitted substances. An initial version, EDGAR-HTAP_V0, was generated in 2009, but never released to the public. After several quality improvements, EDGAR-HTAP_V1 was completed in October 2010, and version HTAP_V1 is partly described in HTAP-report, Chapter 3 of Streets et al (2010). Further updates of EDGAR-HTAP are anticipated to further improve known quality and inconsistency issues. This new version (anticipated in 2012) will have a version number 2. In order to provide a complete global picture of emissions, this compilation of different official inventories needed to be represented in a harmonized way, and gap-filled with global emission data of EDGARv4.1, as made public at http://edgar.jrc.ec.europa.eu by EC/JRC/PBL (2010).
Box 2: List of Air Pollutants included in the EDGAR-HTAP inventory Ozone precursor gases: CH4, NMVOC, CO, NOx Acidifying/ Eutrophying gases: SO2, NH3 , (and NOx) Particulate Matter: PM10, PM2.5, BC and OC

9
The EDGAR-HTAP inventory for air pollutants has been compiled using the following inventories in descending priority order:
1. UNCLRTAP/EMEP 2. UNFCCC/US EPA 3. GAINS 4. REAS 5. EDGARv4.1 and updates
An overview of the publicly available sources, which were considered for the EDGAR-HTAP inventory is presented in Figure 1. The purpose of this figure is to point to the areas for which given sources of some or all air pollutant emissions were considered as alternative source to complement the official inventories.
Fig.1 Chemical substances and geographical region covered by the EDGAR-HTAP datasets used with decreasing order of priority in the procedure to compile the available data into one global emission dataset. The Intergovernmental Panel on Climate Change (IPCC) code—defined by the IPCC Guidelines (1996) and conforming the United Nations Framework Convention on Climate Change (UNFCCC) Common Reporting Format, CRF—is used as the key for harmonizing the sector-specific data. A corresponding EDGAR-HTAP coding system is developed to allow aggregation at different levels of detail, using the same CRF structure with three levels represented each by 3 characters1 and separated with a point. The category number is expressed at first level from 1 to 7, the second level represents the CRF subcategory letter expressed by a letter from A to G and the third level incorporates all further CRF details 1a etc. As an example the power plant industry with CRF code “1A1a” was converted into “yy1.yyA.1ay” or in short “ 1. A.1a “. The table with all sectors and corresponding translation to other sector structures are given in Table1 and Annex 1 gives the detailed conversion matrix for all sector specifications between the different datasets used. It should be mentioned that different levels of detail as present for the different countries are kept to the extent possible in order to keep transparency on the ingredients of sector-specific emission totals. In the exercise to establish a harmonized dataset with uniformly defined sectors, the greatest
1 A blank is replaced by “y”.

10
common denominator could be selected, avoiding artificial subdivision of country-specific emission data. Obviously, some sectors in EDGAR-HTAP are not as complete as in some individual official datasets, because some other national inventories or EDGAR4.1 miss the estimates of some subactivities, most notably unpaved road dust, road abrasion, brake and tire wear in the road transport sector The resulting emissions by country and sector were allocated to a 0.1º × 0.1º grid using the EDGARv4.1 proxy data (for urban/rural population density, animal density, power, steel and non-ferrous metal industry, coal mines, oil and gas production fields, roads, shipping and aircraft routes, crop- and grasslands, rice fields). The final emission datasets are reported for the years 2000-2005, for 10 aggregrated sectors and on a global 0.1º × 0.1º grid. These data, presented in CF1 compliant NetCDF files, comprise (uncompressed) ca. 10 Gb of data. Complimentary to EDGAR-HTAP emission data, the US EPA (Vukovich, 2009), provided an additional 0.5º × 0.5º gridded dataset, covering the United States geographical domain, for the years 2002 and 2005 and providing additional sector-specific details than EDGAR-HTAP. Vukovich (2009) describes in detail the assumptions, and workflow of the EPA database. The US EPA emission dataset (Vukovich, 2009) is based on a much more accurate regional coverage of activity data, emission factors and abatement measures in the period 2000-2005 and therefore differs in total emission per sector and in geographical distribution. In this document we provide a short overview of the difference of this dataset with EDGAR-HTAP_V1 in section 2.6. Using a sector-specific translation table, given in this report, the EDGAR-HTAP data can be substituted for further model sensitivity analysis. We further notice that significant parts of preliminary versions of EDGAR-HTAP have been used in the construction of the harmonized emission dataset for the year 2000, commonly know as the RCP database (http://www.iiasa.ac.at/web-apps/tnt/RcpDb/dsd?Action=htmlpage&page=welcome); Lamarque et al (2010), meaning that there is some correspondence of EDGAR-HTAP_V1 and RCP data for the year 2000. Section 2.7 compares the RCP 2000 emissions with those of EDGAR-HTAP_V1.
Box 3: List of Sectors included in EDGAR-HTAP The EDGAR-HTAP emissions are grouped in 10 sectors, the consistent IPCC reporting format in brackets. Annex 1 provides further details.
o htap_1_Aircraft (1A3a), o htap_2_Ships (1A3d), o htap_3_Energy combustion & fuel production/distribution (1A1a-b-c, 1A2, 1B1-2), o htap_4_Industry processes (2A-B-C-D-G), o htap_5_Ground transport (1A3b-c-e), o htap_6_Residential sector (1A4-5), o htap_7_Solvents (3), o htap_8_Agriculture (4.A-B-C-D (not 4E, which is Savannah burning)), o htap_9_Agricultural waste burning (4.F-G) and o htap_10_Waste (6.A-B-C-D).
Due very incomplete reporting, and the large uncertainties and importance of land-use and forest related emissions of air pollutants (“large-scale biomass burning”) emissions, EDGAR-HTAP does not report these emissions. For modelling, we recommend the use of recent, satellite product based inventories, such as GFED3 (van der Werf, 2010).

11
2.2 EMEP: Inventories submitted by parties to the LRTAP convention.
Countries that are parties to the LRTAP Convention provide annual emission inventory data for CO, NH3, NMVOC, NOx, SOx, particulate matter, heavy metals and persistent organic pollutants. These inventories are reported on the national level to the European Monitoring and Evaluation Programme‘s (EMEP) Centre on Emission Inventories and Projections (CEIP – www.ceip.at). Emissions as reported by Parties, version2 NFR08 of 2009 for the years 2000-2007 have been kindly provided by CEIP, www.ceip.at/ceip (Robert Wankmueller, personal communication, July 2009) and the dataset is documenten by EMEP report of Mareckova et al (2009) at http://www.ceip.at/review-process/review-2009. We did not use the gridded expert data, as used in the EMEP model but the country-specific totals, which are more complete (geographically) and more detailed with regard to the sector-specific breakdown. The sector-specific categories are taken up in Annex 1and for a full description the reader is referred to the CORINAIR Atmospheric Emissions Inventory Guidebook (2009). These data have been summed to IPCC source categories using the conversion table from the Nomenclature for Reporting to CRF (see Annex 1 for the conversion table). The results can be found underneath in Table 1. Table 1: Sector-specific aggregations for EDGAR-HTAP and link with EMEP sectors3.
EMEP EDGAR-HTAP sector-specific aggregation
for emission subtotals for gridding
Combustion in energy and transformation industries 1.A.1a, 1.A.1b, 1.A.1c htap_3
Non-industrial combustion plants 1.A.4, 1.A.5 htap_6
Combustion in manufacturing industry 1.A.2 htap_3
Production processes 2 (2.A., 2.B., 2.C. …, 2.G.) htap_4
Extraction and distribution of fossil fuels and geothermal energy
1.B.1, 1.B.2 htap_3
Solvents and other product use 3.. htap_7
Road transport 1.A.3b htap_5
Non-road ground transport (rail, pipeline) 1.A.3c, 1.A.3e htap_5
Other mobile sources and machinery 1.A.5 htap_6
Agriculture 4.A., 4.B., 4.C., 4.D. htap_8
Agricultural waste burning 4.F. htap_9
Waste treatment and disposal 6 (6.A., 6.B., 6.C., 6.D.) htap_10
It was recognized that the description and breakdown of national emissions data differ significantly in level of detail between the EMEP countries, because not all countries have the same reporting obligations. To illustrate the quality and completeness of the EMEP dataset, Table 2 shows the countries, which did not report for all years. Consultation of other datasets was preferred to interpolation for the temporal and sectoral gapfilling. In order to avoid double-counting for the bunker statistics, these were excluded and only domestic aviation and inland waterways were taken up. The bunker statistics are treated on global scale in the EDGARv4.1 emissions calculations and directly included as global totals.
2 Data which was only available in NFR02 at this time we converted to NFR08. In the meantime the format changed again to NFR09, which is almost the same as NFR08. 3 Because the EOLO-system operates with a sector-specific coding composed of groups of tree characters, separated with a point, the “y” was used where needed to complete the three character series.

12
Table 2: Non-reported emissions in the EMEP domain (with countries: AZE= Azerbaijan, BGR=Bulgaria, BLR=Belarus, CZE= Czech Republic, FIN=Finland, GRC= Greece, HRV= Bosnia-Herzegovina, HUN=Hungary, LIE= Liechtenstein, LTU= Lithuania, MCO=Monaco, MKD= Macedonia, MLT = Malta, POL= Poland, ROU= Romania, RUS= Russia, SRB = Serbia, TUR= Turkey, UKR= Ukraine and USA)
2000 emissions missing More years missing emissions
CO BGR, BLR, CZE, MCO, MKD, POL AZE, GRC, HRV, HUN, LIE, LTU, ROU, RUS, TUR, UKR, USA
NH3 BGR, BLR, CZE, MCO, POL HRV, HUN, LIE, LTU, MKD, MLT, ROU, RUS, TUR, UKR, USA
NMVOC BGR, CZE, MCO, POL AZE, BLR, GRC, HRV, HUN, LIE, LTU, MKD, MLT, ROU, RUS, TUR, UKR, USA
NOx BGR, BLR, CZE, MCO, MKD, POL AZE, GRC, HRV, HUN, LIE, LTU, MLT, ROU, RUS, SRB, TUR, UKR, USA
SOx BGR, BLR, CZE, MCO, MKD, POL AZE, GRC, HRV, HUN, LIE, LTU, MLT, ROU, RUS, SRB, TUR, UKR, USA
PM10 CZE, POL BLR, HRV, HUN, LIE, LTU, ROU, RUS, UKR, USA
PM2.5 POL BLR,CZE,HRV,HUN,LTU,MLT,RUS, UKR,USA
2.3 UNFCCC
The so-called Annex I countries of the Kyoto Protocol (industrialized countries and economies in transition) report since their base year (for most of them 1990) annual country totals of emissions of greenhouse gases (CO2, CH4, N2O, F-gases) and indirect greenhouse gases pollutants (CO, NMVOC, NOx, and SO2). These data have to follow specific guidelines in reporting and inventory construction. The UNFCCCinventory expert teams have to mandate for a thorough review of all (Kyoto-Protocol) greenhouse gases, but sometimes also air pollutants are subject to such external review. For the EDGAR-HTAP inventory, UNFCCC emissions data were downloaded from the UNFCCC data portal (http://unfccc.int/ghg_data) in the CRF format, in May 2009 for the reported inventory time series from 1990-2007. Non-Annex I parties submit emission inventory data to the UNFCCC periodically under different reporting requirements than Annex I parties. These data vary in quality and detail, especially regarding air pollutants, and do seldom provide complete time-series. For this reason, non-Annex I data were not used in the EDGAR-HTAP inventory. UNFCCC emissions follow IPCC source classifications, and the EDGAR conversion tables include IPCC source classification. It should be noted that there are 5 EMEP countries, which are not belonging to Annex I: Cyprus, Malta, Macedonia, Moldova and Turkey. For these countries no officially reported CH4-inventory was available. Malta and Turkey deserve a special note, due to recent negotiations with UNFCCC. Since October 2010 Malta is considered an Annex I Party for the purpose of the Convention but not for the Protocol. But it was not an Annex I Party at the time of the dataset compilation. Turkey ratified the Kyoto Protocol in 2009, and is nowadays an Annex I Party both for the Convention and the Protocol. Turkey began to report regularly in 2007, but the first inventories were not complete. For the United States, the U.S. EPA National Emission Inventory (NEI) data for the years 2002 and 2005 have not been included in the EDGAR-HTAP database, but the EMEP data for the components NOx, SO2, NMVOC, PM2.5, PM10, NH3, and CO was used instead because of timeseries consistency. The USA inventory for CH4 was taken from UNFCCC.

13
The UNFCCC and EMEP datasets have been merged for each country and source category, giving priority for the CH4 greenhouse gas to the (internationally reviewed) UNFCCC data, that is in large detail (also at sub-sector level) described by the IPCC Guidelines. The other substances, CO, NMVOC, NOx and SO2 are not reviewed and ranked second order after the EMEP data. Even though it is expected to find for the EMEP countries consistently the same emissions for the substances, differences are found in several countries, mainly because of different reporting organizations. Rarely the emissions of the EMEP countries reported to EMEP are in all details found back in the emissions reported to UNFCCC for each of the substances CO, NMVOC, NOx and SO2. Not all countries report the voluntary substances. No complete dataset (reporting for CO, NMVOC, NOx, SO2 of all years 2000-2005 to UNFCCC) by Bulgaria, Belarus, Canada, Cyprus, Czech Rep., Finland, Greece, Croatia, Hungary, Iceland, Liechtenstein, Lithuania, Luxembourg, Monaco, Moldova, Macedonia, Malta Poland, Roumania, Russia, Turkey, Ukraine and USA. Larger deviations are present due to additional source categories, e.g. Austria reports 60% more NMVOC to EMEP as it included also the 5E category (emissions due to land-use changes for settlements), e.g. The Netherlands reports the double SO2, since they include here also all shipping emissions up to 12 miles from their coastal zone. An overview of a first global comparison is given in Table 3. The purpose of this table is to identify the good matching regions (in function of the chemical substance) and to pave the way for further analysis through identification of where it is necessary to fill the gaps. Table 3: Ratio of the global emissions for CO, NMVOC, NOx and SO2 reported to UNFCCC to those reported to EMEP. Zero indicates no reported emission inventory for EMEP was available. Green colors are ratios between 0.98 and 1.02, red colors indicate larger deviations.
No sector-specific gapfilling was performed, because the Parties of the UNFCCC are requested to provide complete inventories. In case no emissions are reported for a given sector, the emission sources might be not applicable, not existing, confidential or included elsewhere and as such sector-specific gapfilling requires a dialogue with the national inventory experts to avoid double-counting. Also for CH4, again the bunker statistics were excluded and only domestic aviation and inland waterways were taken up. The CH4 from bunker statistics were directly imported from EDGARv4.1 emissions calculations as one global total.

14
Data gaps in time series of the EMEP inventory were first gapfilled by using the UNFCCC inventory. If the remaining time series was incomplete for some years in the period 2000-2005, linear interpolation or extrapolation from the last/first year available was performed. Only in case no officially reported data was available for an air pollutant, EDGARv4.1 is used for gap-filling. For the particulate matter (PM10, PM2.5, BC or OC) a preliminary dataset of EDGARv4.2 is used, as was developed by October 2010.
2.4 Asian countries: GAINS and REAS
For China, emissions were provided by IIASA (Z. Klimont, personal communication, 2009) taken from the GAINS-China dataset, drawing largely on the GAINS-Asia project from 2006-2008 and documented for selected pollutants in Klimont et al. (2009). Data were available for the years 2000 and 2005 for the IPCC source categories and the years in between were generated by linear interpolation for each subcategory. No gap-filling with EDGARv4.1 was necessary for China. The sector-specific emission sources for each substance are specified in Table 4. Table 4a: CH4, NH3, CO, NMVOC and NOx Emissions from GAINS for China following the EDGAR-HTAP code reflecting the CRF code with in yellow the energy, fossil fuel and manufacturing industries, in red the transport, in violet the residential sector, in light blue the fugitive from mining, in grey the industrial processes, in green the agricultural sectors and in brown the waste sector. The uncolored one represents the miscellaneous activities.

15
It should be noted that only totals for China as single country has been taken up and distributed at once, even though GAINS contains emissions at province level. The EDGARv4.1 proxy data on EOLO are structured at country-level regardless the surface area of the country. In updated versions a two-step gridding will be performed, with first split-up of the national total at province level and in a second step the province totals will be distributed with the proxy data. This is not only important for China, but also for other countries with large surface area such as USA, India, Brazil, Russia. For a next version 2 of EDGAR-HTAP this two-step gridding approach will only apply for countries where data at province level are available, i.e. China, India and USA. Table 4b: PM10, PM2.5, BC, OC and SO2 Emissions from GAINS for China following the EDGAR-HTAP code reflecting the CRF code with in yellow the energy, fossil fuel and manufacturing industries, in red the transport, in violet the residential sector, in light blue the fugitive from mining, in grey the industrial processes, in green the agricultural sectors and in brown the waste sector. The uncolored one represents the miscellaneous activities.
For other countries in Asia (outside China) the REAS inventory as received from J. Kurokawa (personal communication, 2009) has been included by country and detailed sector for CH4, CO, NOx, SO2, NH3, OC and BC emissions. Emissions have been allocated to IPCC source categories (see conversion Table of Annex 1). REAS represents the Regional Emission inventory in Asia, which was developed by the Japanese Frontier Research Centre for Global Change (FRCGC) and documented by Ohara et al. (2007). The period of REAS historical data is from 1980 to 2003. Kurokawa et al. (2009) extended the dataset until 2005 using the new statistics. The latter dataset (2000-2005) was used for the EDGAR-HTAP inventory. The dataset cover a target area of South, Southeast, and East Asia, whose range is from 50oN to 10oS in latitude and from 60oE to 150oE in longitude. Countries in REAS, include aside China: Japan, South Korea, North Korea, Mongolia, Taiwan, Macau, Brunei, Cambodia, Indonesia, Laos, Malaysia, Myanmar, Philippines, Singapore, Thailand, Vietnam, Bangladesh, Bhutan, India, Nepal, Pakistan, Sri Lanka, Afghanistan and the Maldives. It should be noted that from these countries, Japan is the only one that also belongs to the Annex I group. Emissions in Japan have been taken from the official inventory submitted to the UNFCCC,

16
completed with REAS data mainly for NH3, OC and BC but also for some sectoral gapfilling. A comparison between the UNFCCC and REAS totals for CO, NOx and SO2 are given in Table 5, which shows that REAS mostly concentrates on mobile source and remains incomplete for stationary combustion. Therefore the CO, NOx and SO2 from UNFCCC were preferred for all categories where data existed. The REAS estimates for SO2 from rail and inland waterways were added to complete the UNFCCC estimates for SO2. More the REAS inventory focused also for all other REAS countries on energy-related activities and not on agricultural activities. Only NOx emissions were reported for the agricultural soils sectors and that not even for all REAS countries. Japan, North and South Korea and Macao did not show agricultural emissions at all. All missing agricultural emissions for all (other) substances and countries) were gapfilled with EDGARv4.1 data. Also for other sectors where REAS emissions were reported to be zero, gaps were filled using inter/extrapolation to complete time series or using EDGARv4.1 data to complete missing compounds or missing sectors (i.e., NMVOC, PM10 and PM2.5). Table 5: CO, NOx and SO2 emissions for Japan in 2000 and 2005: comparison of the data reported to UNFCCC and the estimated emissions data in the REAS inventory. The values of the green cells
have been included in EDGAR-HTAP_V1. The red cells indicate absence of emission estimates.
2.5 Gap-filling and gridding: EDGARv4.1
The Emission Database for Global Atmospheric Research (EDGAR) is hosted at the European Commission, Joint Research Centre, Institute for Environment and Sustainability (EC JRC IES) and continuously maintained and further developed by IES in collaboration with the Dutch Environment Assessment Agency (PBL)4. EDGAR provides historical (1970-2005) global anthropogenic emissions of greenhouse gases CO2, CH4, N2O, HFCs, PFCs and SF6, of precursor gases CO, NOx, NMVOC and SO2 and the aerosols BC and OC per source category both at country and region levels as well as on grid. Emissions are calculated by taking into account activity data such as fuel consumption by sector, different technologies with installed abatement measures, uncontrolled emission factors and 4 The EDGAR database was originally developed by Olivier (2002), and since 2008 run by JRC/EC

17
emission reduction effects of control measures. Emissions are calculated for all world countries (246 entities) for the emission source (sub)groups; (i) combustion/conversion in energy industry, manufacturing industry, transport and residential sectors, (ii) industrial processes, (iii) solvents and other product use, (iv) agriculture, (v) large scale biomass burning, (vi) waste and (vii) miscellaneous sources. A detailed overview of the EDGAR emissions database with its sectors is found at edgar.jrc.ec.europa.eu. The EDGARv4 inventory aims at a transparent and consistent comparison between non-Annex I and Annex I countries. Therefore default emission factors and default uncertainty ranges, following the 2006 IPCC guidelines and the CORINAIR EMEP/EEA guidebook (2009) are combined with globally consistent use of international statistics for the fuel consumption, choice of technology mix, and underlying assumptions such as livestock characteristics, vehicle mileage of cars, fraction of total waste deposited in landfills to derive emission inventories for all individual countries. Differences between EDGARv4.1 and UNFCCC reports of Annex I identify strengths and weaknesses from the recommended IPCC 2006 guidelines, Tier 1 or 2 for GHG, as consistently used by EDGARv4.1. National inventories are normally more detailed and as such the difference might also indicate the impact of higher Tier or country-specific emission estimates. For the air pollutants the differences between EDGARv4.1 and EMEP reports indicate where shortcomings and improvements are largest. Moreover verification with inverse modelling of atmospheric measurements helped to improve the quality of the EDGARv4.1 dataset. For this EDGAR-HTAP inventory the EDGARv4.1, released on the edgar.jrc.ec.europa.eu in July 2010 was used, for gap-filling for all air pollutants. The v4.1 dataset did not include yet an officially published version for the particulate matter, black and organic carbon (PM, BC, OC). Thereto a preliminary version of EDGARv4.2 was the only available one and used with its development status of October 2010. For the spatial distribution of the EDGAR emissions data, the EOLO system disposes over an extensive set of global proxy data that are representative for major source sectors. Emission sources are, depending on the source sector or subsector, considered either as diffuse or as point source. The diffuse sources are distributed over the grid cells with the proxy data covering the globe entirely or partially, whereas the point sources are allocated to points within a grid cell. In order to make both additive, the point sources are smeared out over the corresponding grid cell and their value is corrected by a geographical fraction such that the sum of the discrete grid cell values for a given (sub)sector corresponds to the country-specific total of that sector. A key proxy dataset is the gridded population of the world (total, urban or rural) from Center for International Earth Science Information Network (CIESIN) of the Columbia University (2005) that was modified such to exactly match the country area and population taking into account also the fraction of country-data in the cells with an intersection of country borders. Permanent ice and large lakes have been merged with neighbouring polygons to make a layer more appropriate for cartographic visualization of the data. Industrial activities are well localised and mainly distributed on point source gridmaps, allocating the industrial activities to their plant location coordinates. For the point sources in the combustion sector, point source maps for power and industrial plants, oil refineries, coal mines, oil and gas fields, road network, shipping and aircraft routes are applied. A combination of proxy data grid maps was needed for sectors, such as in the road transport (based on population density and the road network). For the diffusive agricultural emission sources, different types of grid maps were applied, ranging from agricultural land use and soil type maps, such as grassland and cropland cover data sets, rice cultivation area and animal density maps from FAO and other references. All proxy datasets applied for the gridding of the different sector-specific sources are given in Annex 3.
2.6 US EPA dataset for 2002 and 2005
A separate 0.5º × 0.5º gridded dataset in NetCDF is available from the US EPA, for the years 2002 and 2005, complementary to the data in EDGAR-HTAP, providing additional sectoral-specific and spatial emissions data. It should be noted that the sectoral, temporal resolution and the spatial resolution (incl. cell definition) of these NetCDF gridmaps differ from those of EDGAR-HTAP. Whereas the global gridmaps have 0.1ºx0.1º grid cells that are left bottom corner centered, the US

18
EPA gridmaps cover the USA with 0.5ºx0.5º grid cells, that are centered at the .25 and 0.75 degree lines. The emissions dataset was developed from a very detailed emissions inventory that is maintained by the US EPA, and that is compiled from reports from the individual industrial plants, and the 50 US states. Lee Tooly of the US EPA assigned each of the 10000 subcategories to one of the major NFR categories. Vukovich et al. (2009) documented the procedure followed to generate these emissions. Table 6 correlates the sectors of USEPA with EDGAR-HTAP. It is worth to mention that the USA EPA dataset includes resuspended dust: (i) "R-Other" includes fugitive dust from paved and unpaved roads, as well as some other miscellaneous fugitive sources and (ii) "P-Agricultural, Other" includes the dust from the grain elevators, dust from tilling, and ammonia from fertilizers. Moreover the field burning of agricultural waste, under "Q-Agricultural, Waste" is restricted, but mainly the restrictions limit what times of year that it can be done. It is prevented in only a few regions of the country. Table 6: correlation table of US EPA and EDGAR-HTAP sectors.
US EPA EDGAR-HTAP Remarks
A - Public Power htap_3 B - Industrial Combustion htap_4
C - Small Combustion Sources htap_6
Includes residential commercial/institutional sources, off-highway, LPG engines, commercial and government waste disposal, space heaters
D - Industrial Processes htap_4 does not generally include the fuel combustion in boilers at the facilities. That is in category “B – Industrial Combustion”
E - Fugitive Emissions htap_3 F – Solvents htap_7 G - Road and Rail Emissions htap_5 H – Shipping htap_2 coastal and inland waterways.
I - OffRoad Mobile Sources htap_5
Includes fuel combustion from recreational vehicles, construction equipment, industrial equipment (such as cranes), lawn and garden equipment, agricultural equipment, commercial motors, mining equipment, and forestry equipment.
J - Civil Landings and Takeoffs htap_1 Different treatment in 2002 and 2005: include in point sources in 2005
L - Other Waste Disposal htap_10 M - Wastewater Treatment htap_10 N - Waste Incineration htap_10 O - Agriculture, Livestock htap_8 P - Agriculture, Other htap_8 Q - Agriculture, Wastes htap_8
R – Other Not included
Most diffusive emissions from agriculture, mainly of importance for PM2.5 and PM10
S - Natural Emission Sources Not included
Include (non-prescribed) forest fires. Non-fire biogenic emissions
Table 7a and b give an overview of the 2002 and 2005 emissions of US EPA emissions. More details can be found in Vukovich et al. (2009).

19
Table 7a: USA total emissions for the year 2002 by US EPA
Table 7b: USA total emissions for the year 2005 by US EPA
The USA emissions of the EDGAR-HTAP_V1 dataset are compared at the detail available with the US-EPA dataset in Table 8a for NMVOC, NH3 and CO. Please note that only the years 2002 and 2005 are compared, because only those years are available in the US-EPA dataset. Major differences are found for air pollutant emissions of the waste sector (missing waste incineration in the EDGAR-HTAP_V1 dataset), in the agricultural sector (NH3 emissions of agriculture are found in EDGAR-HTAP_V1 under “Agricultural waste”, but in the US EPA inventory they are found under “Other agricultural sectors”) and in the shipping sector (US EPA seems to lack NMVOC and CO emissions from domestic and coastal shipping). The inconsistency with the latter sector might be caused by applying in EDGAR the UNFCCC definition of domestic shipping which is not restricted to the 12

20
miles coastal zone (and which considers for USA also e.g. the trajectories to Hawaii). The large discrepancy with EDGAR-HTAP_V1 showing e.g. 34 times higher NMVOC emissions in 2002 is becoming smaller (factor less than 10) in 2005 because the US-EPA shipping emissions increase from 2002 to 2005 with a factor 3.5 for NMVOC and almost 2 for CO). Table 8b summarizes the EDGAR-HTAP_V1 and US EPA dataset for NOx, SO2 and particulate matter emissions of USA. Largest discrepancies are found for particulate matter, for which the emissions of EDGAR-HTAP_V1 sum up to not even one quarter of the reported US EPA PM totals. PM10 from industrial processes and agriculture contribute in the US EPA inventory to 28% and respectively 32% of the PM10 emission total and are missing in EDGAR-HTAP_V1. Also the PM emissions of road transport and off-road mobile sources – in particular the latter sector includes so-called superemitters on unpaved roads - are underestimated in EDGAR-HTAP_V1 with a factor ½. Reasons for these discrepancies can be found in the diffusive emission sources such as pave dust & tyre / brake dust, construction dust, which are not taken up in many inventories: nor in many national inventories reported to EMEP, neither in the EDGARv4.1 inventory. Table 8a: Comparison of US EPA data for NMVOC, NH3 and CO with the EDGAR-HTAP_V1 dataset for USA at the sectoral split of USEPA. Color index: Green = agreement within 25% margin between US EPA and EDGAR-HTAP_V1. Yellow = EDGAR-HTAP_V1 emissions (for coastal shipping & for agricultural waste) are 5 - 90 times larger than in US EPA. Red = EDGAR-HTAP_V1 lacks emissions, which the US EPA inventory includes (several sectors are small, except waste & agriculture).

21
Table 8b: Comparison of US EPA data for NOx, SO2, PM10 and PM2.5 with the EDGAR-HTAP_V1 dataset for USA at the sectoral split of USEPA. Color index: Green = agreement (within 25% margin) between US EPA and EDGAR-HTAP_V1 emission estimates. Redish = EDGAR-HTAP_V1 lacks data, in particular for PM emitted by industrial processes (D), Off-road mobile sources (I), Waste incineration (N) and Agriculture (O,P,Q), for which the US EPA inventory provides a much more complete inventory.

22
3. Results
3.1 HTAP_V1 emission inventory
3.1.1. Sector-specific annual emission totals for 2000-2005 Table 9: Global totals of HTAP_V1 for 2000-2005 and aggregated sectors
23
The first public version of EDGAR-HTAP, Version HTAP_V1 is described in Chapter 3.2.1 of the HTAP report by Streets et al. (2010). EDGAR-HTAP_v1 does not include Savannah burning ( 4. E), nor biogenic emissions from the land use change and forestry sector ( 5), where only very incomplete reporting was available, and objectives satellite based alternatives exist. The EDGAR v4.1&v4.2 global estimates for yy4.yyE and yy5 are based on the GFEDv2 database by G. van der Werf et al. (2006), which provide directly the inventory on gridmap in detail. Alternatively GFEDv3 http://www.falw.vu/~gwerf/GFED/ can be used. The global totals are for the period 2000-2005 at highest aggregated level represented in Table 9. Even though the time series are less consistently built over a relative small time period, it can be seen that over these 6 years in the waste sector (yy6) the emission sources for BC and OC decrease 40%, for PM2.5 and PM10 30%, and for SO2 and NOx 10%. Moreover NOx emissions decrease also in the industry sector with another 10%. The overview figure 2 summarizes the regions-specific totals. Country-specific totals are given in Annex 2, and colored according the reference source. Fig. 2a: Regional totals for the air pollutants (ozone precursors and acidifying substances) CH4, CO,
SO2, NH3, NMVOC and NOx from the EDGAR-HTAP_V1 database for the period 2000-2005

24
Fig. 2b Regional totals for the particulate matter PM10, PM2.5, BC and OC from the EDGAR-HTAP_V1 database for the period 2000-2005
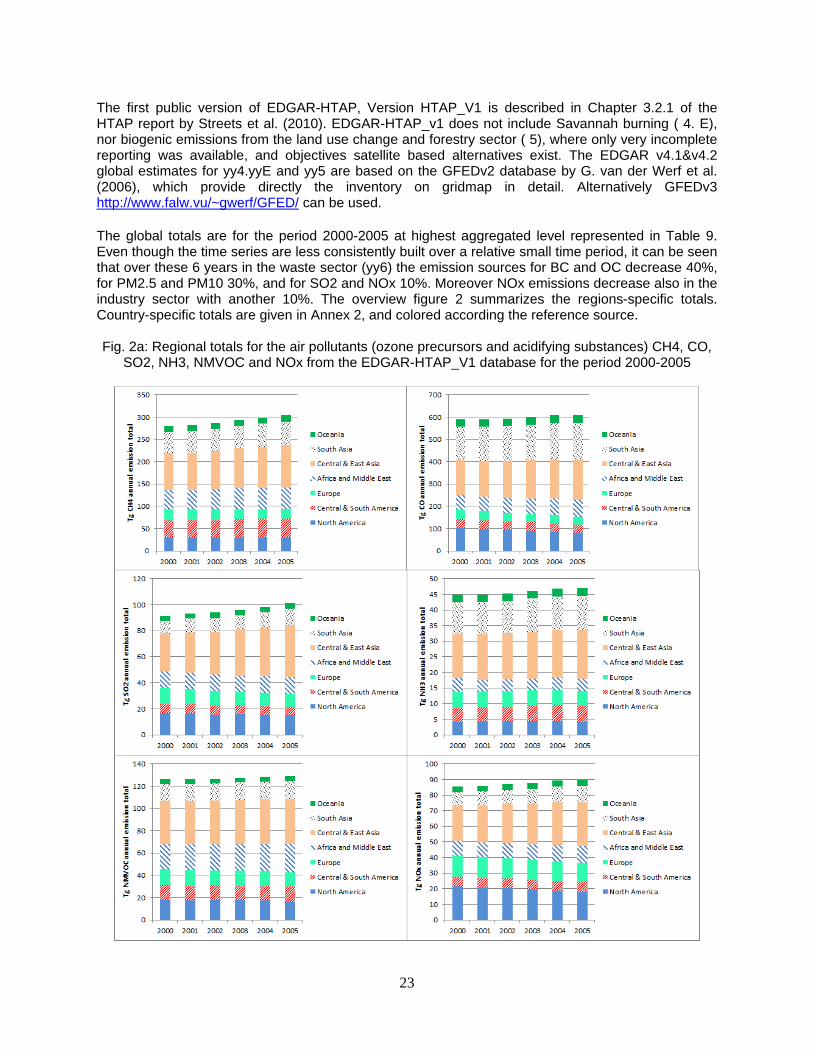
3.1.2. Geospatial distribution on gridmaps of 0.1°x0.1° All the emissions are gridded allocating the EDGAR proxy datasets to each sector or subsector so that no information is lost, even at highest level of detail. Applying consistently the EDGAR proxy data allows (i) a geocoverage of all world-countries and (ii) representation of single multi-pollutant sources. The results are presented in an aggregated manner, because of discontinuities in level of reporting and because of differences in allocation to subsectors. The global gridmaps show all a fine resolution with 0.1ºx0.1º grid cells that are left bottom corner centered. In addition USA EPA provided for the HTAP project additional gridmaps, which cover only the USA with 0.5ºx0.5º grid cells, that are centered at the .25 and 0.75 degree lines. Fig. 3 and 4 illustrate the global outcome for the emission totals of each substance and more sector-specific gridmaps are made available on the CIERA webserver: http://ciera-air.org/services. All documentation is made available on the http://www.htap.org website and summarized at EDGAR’s homepage http://edgar.jrc.ec.europa.eu under “Other activities”, national reported data.

25
NOx totals (excl. Savannah burning) in ton NO2/grid cell
SO2 totals (excl. Savannah burning) in ton SO2/grid cell
CH4 totals (no land-use change & forestry)in ton CH4/grid cell
NH3 totals (no land use change & forestry) in ton NH3/grid cell
VOC totals in ton NMVOC species/ grid cell
CO totals (no Savannah burning) in ton CO/grid cell
PM10 totals (no Savannah burning) in ton species/grid cell
PM2.5 totals (no Savannah burning) in ton species/ grid cell
BC totals (no Savannah burning) in ton C/ grid cell
OC totals (no Savannah burning) in ton species/ grid cell
Fig. 3 Gridded maps of anthropogenic emission totals in 2005 for each compound in the EDGAR-HTAP emissions database on a 0.1° × 0.1° grid (in tons of species/grid cell). (Biomass is included but neither biogenic emissions from land use change and forestry nor savannah burning.)
°×° 1.01.0BCton
°×° 1.01.0OCton
°×° 1.01.05.2PMton
°×° 1.01.010PMton
°×° 1.01.0VOCton
°×° 1.01.0COton
°×° 1.01.03NHton
°×° 1.01.04CHton
°×° 1.01.02tonNO
°×° 1.01.02tonSO
26
ton NO2 emissions from aviation (international+domestic) /cell
ton SO2 shipping emissions (international +inland waterways) /cell
ton CH4 emissions for the waste sector per cell ton NH3 emissions for agriculture (no savannah/waste
burning) /cell
ton NMVOC emission from solvent industry per cell
ton CO emission of agricultural waste burning (no savannah fire) /cell
ton PM10 emission of energy combustion & fuel production /cell
ton PM2.5 process emissions from industry per cell
ton BC emissions from residential sector per cell
ton OC emissions from ground transport (road – rail) per cell
Fig. 4. Gridmaps for 2005 for significant sectors-specific contributions to the emissions, as used in the EDGAR-HTAP emissions database on a 0.1° × 0.1° grid (in tons of species/grid cell). (Biomass is included.)
°×° 1.01.0BCton
°×° 1.01.0OCton
°×° 1.01.05.2PMton
°×° 1.01.010PMton
°×° 1.01.0VOCton
°×° 1.01.0COton
°×° 1.01.03NHton
°×° 1.01.04CHton
°×° 1.01.02tonNO
°×° 1.01.02tonSO

27
3.4 Intercomparison of HTAP_V1 2000 inventory with RCP data and EDGARv4.2
Comparing the EDGAR-HTAP_V1 with other datasets was done on global scale, in the HTAP (2010) report (Figures 3.3, 3.8 – 3.15). Fig. 3.5 of the HTAP(2010) report compared the 2000 EDGAR-HTAP inventory to the emission inputs used in the SR1 run of the HTAP multi-model experiments representing 2001. The comparison is presented for the global total and each of the four HTAP source regions. For the SR1 inputs, the HTAP_V1 inventory tends to underestimate the ensemble of emissions currently used in global models, in particular for BC (for the northern hemisphere) and OC (for all regions). Focusing on the Representative Concentration pathways chosen for AR5 and described by Moss et al (2010) and Lamarque et al (2010), the HTAP (2010) report (Figures 3.11 – 3.17) compares the EDGAR-HTAP_V1 inventory to only the lower emissions of the RCP2000 (base), RCP8.5 (2030) and RCP2.6 (2050) for all compounds and all regions except for NH3 in East and South Asia, and for BC and OC in South Asia. It should be noted that the RCP scenarios include Savannah burning ( 4. E sector) and land use change emissions ( 5 sector) whereas EDGAR-HTAP_v1 does not. The comparison is repeated here for all scenarios but with the same composition of sectors. In the figures 5 and 6 below a comparison with equal inclusion of sectors (omission of 4. E and 5 sectors) is represented: first at global level in figures 5a and b for particulate matter and air pollutants CH4, CO, SO2, NH3, NOx, NMVOC respectively. Figure 6 then presents the regional totals, following the definition of the TF HTAP source-receptor regions: North America (NA), Europe (EU), South Asia (SA) and East Asia (EA).
Fig. 5a: Comparison of the EDGAR-HTAP_V1 global inventory for 2000 with the RCP 2000 base inventory per sector for the aerosols: BC and OC

28
Fig. 5b: Comparison of the EDGAR-HTAP_V1 global inventory for 2000 with the RCP 2000 base inventory per sector for the air pollutants CH4, CO, SO2, NH3, NOx, NMVOC

29
Fig. 6: Comparison of the EDGAR-HTAP_V1 inventory for 2000 with the RCP 2000 base inventory per sector and per region for the air pollutants (CH4, CO, SO2, NH3, NOx, NMVOC) and the aerosols (BC, OC). The regions are not covering the globe but are defined as the TF HTAP regions: North America (NA), Europe (EU), East Asia (EA) and South Asia (SA)

30
4 Concluding discussion and lessons learned for the future
4.1 Concluding remarks
To setup a world emission inventory that represents the officially reported emissions by individual countries and regions, proved a difficult task full of compromises. In addition to UNFCCC’s principles of transparency-accuracy-completeness-comparability-consistency, this exercise provided also some insights on how much “official” inventories are coherent across countries. Groups of countries with similar characteristics could be identified and alternative emission sources could be appreciated in completeness and accuracy. Different official sources can be publicly accessed, such as UNFCCC and EMEP, but do not cover the globe. Complementary sources, GAINS, REAS are available but limited concerning comprehensiveness in time or types of human activities. At disaggregated level inconsistencies are encountered for several reasons: (i) application of slightly different definition of the emission sources and corresponding different allocation to emitting subsector (e.g. the not estimated sources, or included elsewhere sources); (ii) different focus: EMEP focuses on reactive chemical substances for the pollution of the atmosphere, whereas UNFCCC focuses on GHGs and their warming climate effect; (iii) different methodology for the bottom-up emission calculations (Even though UNFCCC has standardised the methodology with the IPCC guidelines and standards for emission factors, it collects national inventories with a Tier 1 aside inventories with Tier 2 or even Tier 3 approach), (iv) the inventories published are not the most recent, and not for the whole time period 2000-2005 developed, and as such they are prone to updates and extrapolations. It seemed that aggregation tends to result in more equilibrated emission inventories, which might be caused by compensation of underestimates in one sector with overestimates in another. Of course common biases across different sources of emission inventories are not detected this way but could be found when confronted to real in-situ measurements, via inverse modelling techniques. The resulting inventory tries to harmonize the official data, but the six annual inventories should not be considered as consistent time series. The harmonisation includes (i) taking out scarcely reported sectors, (ii) gapfilling agricultural emission sources where energy-related ones only are reported and completing with full inventories for countries with no officially reported data 2000-2005. The set of sector-specific emission-sources is stripped off (i) diffusive dust sources from unpaved roads, tires and brakes (in IPCC sector 1A3b) and dust from construction demolitions, (ii) Savannah burning (IPCC sector 4E) conform GFED3, (iii) large-scale biomass burning (5A and 5F), and (iv) the rest of the land-use change and forestry emissions (rest of IPCC sector 5). For the afore mentioned sector-specific emission source a global geo-coverage is obtained and the geospatial distribution is consistently performed with the EDGAR proxy datasets only. As such the resulting dataset has advantages above a patchwork of gridmaps delivered by different sources and is consistently represented for multi-pollutant emission sources on a 0.1°x0.1° gridmap5. However also the proxy datasets have their limitations and point sources might be erroneously positioned or absent. It should be also noted that some proxy data, such as rural/urban population data of CIESIN are for some countries (e.g. Egypt, Western Sahara) of poor quality, which is directly reflected in EDGAR proxy gridmaps. The emission inventory was set up in several steps.
1. Version HTAP_v0: for 2000-2005 country and sector-specific totals for CH4, SO2, NOx, CO, NMVOC, NH3, PM10, PM2.5, BC, OC, http://edgar.jrc.it/eolo, May ’10. This was a draft version, internally distributed, but not publicly released
2. Version HTAP_V1: for 2000-2005 country and sector-specific totals for CH4, SO2, NOx, CO, NMVOC, NH3, PM10, PM2.5, BC, OC, on http://edgar.jrc.it/eolo (username: edgar_HTAP,
5 Each grid cell is defined by its left corner coordinates.

31
passwd: htap), November 2010. This is the corrected V0 version without Savannah Burning (IPCC – 4E) and without pave and construction dust. This is a compilation of various inventories (UNFCCC, REAS, GAINS, EMEP, EPA) gridded and gapfilled with EDGAR4.1. The emission gridmaps (totals for each substance) were provided to AER and documented in the HTAP (2010) report, Ch 3 of Streets et al. (2010) and all these files (in total 6X10=60) are currently available via the CIERA webportal on http://ciera-air.org/services.
Remaining known issues are in EDGAR-HTAP_V1 are related to the use of inconsistent and incomplete datasets, gridding using EDGAR4.1 proxy data, and inconsistencies in time-series. The current choice of sectors is too much disaggregrated, which potentially may lead to confusion. The geospatial distribution on 0.1°x0.1° is not in line with the EPA data provided on 0.5°x0.5°.
4.2 Outlook
It is proposed to enhance the existing HTAP_V1 dataset towards a new version EDGAR-HTAP_V2 by:
‐ Extending the time period with 2006-2008, guaranteeing backward compatibility 2000-2005 (update). Note that the HTAP database is a compilation of official data (or at least authoritative where no official data are available). Official emissions are reported with a delay of at least 2 years, and often more.
‐ Updating the whole time series by (i) downloading the most recent UNFCCC and EMEP data, (ii) consulting IIASA for the latest estimates of GAINS for China and India, and consulting with Tsinghua University in China, (iii) consulting EPA for the most recent USA data, and (iv) consulting FRCGC of Japan for most recent East-Asian data. The REAS inventory seems frozen, but other, more recent datasets might be taken up when considered official and being more up-to-date.
‐ Redo gapfilling with EDGARv4.2.
‐ Completing with other chemical substances: CO2 & N2O (for quality check and GHG-AP interactions), Hg.

32
References CIESIN (2005), Gridded population of the world, version 3 (GPWv3), Center for International Earth
Science INformation Network (CIESIN), USA.
Dentener et al. (2011) Improvement of Modelling Capabilities and Data Capture on Hemispheric Transport of Air Pollution, contract No. AA 070402/2007/47597/MAR/C5, JRC Sc.Tech. Report
EC-JRC/PBL. Emission Database for Global Atmospheric Research (EDGAR), release version 4.1. http://edgar.jrc.ec.europa.eu, 2010
EMEP (2009) Emissions as reported by Parties, version N02 of 2009 for the years 2000-2007 have been kindly provided by CEIP, www.ceip.at/ceip (Robert Wankmueller, personal communication).
EPA, U.S. (2003), National Air Quality and Emissions Trends Report, 2003 Special Studies Edition, U.S. Environmental Protection Agency, Washington, DC.
EPA, U. S. (2009), National Emissions Inventory (NEI) Air Pollutant Emissions Trends Data, edited.
HTAPTF, Streets et al. (2010), HTAP report, Part A: Chapter 3: Emission Inventories and Projections
IIASA, GAINS WG (2008), GAINS - Greenhouse Gas and Air Pollution Interactions and Synergies- Emissions dataset, www.iiasa.ac.at/rains/gains (Zbigniew Klimont, personal communication)
IPCC (1996), Climate Change 1995: The Science of Climate Change - A Contribution of Working Group I to the Second Assessment Report, edited by J. T. Houghton, et al., Cambridge.
IPCC (2001), Climate Change, Synthesis Report. A Contribution of Working Groups I, II, and III to the Third Assessment Report of the Intergovernmental Panel on Climate Change, edited by R. T. Watson and C. W. Team, p. 398, Cambridge University Press, Cambridge and New York.
IPCC (2006), 2006 IPCC Guidelines for National Greenhouse Gas Inventories, IPCC National Greenhouse Gas Inventory Programme, Hayama, Japan.
Janssens-Maenhout, G. et al. (2011) EDGARv4 greenhouse gas and air pollution emission database: consistently covering the globe from 1970 till 2008. to be submitted to Env. Sc. Pol..
Klimont, Z., and D. G. Streets (2007), Emissions inventories and projections for assessing hemispheric or intercontinental transport, HTAP Interim Assessment Report, UN Geneva.
Klimont, Z., Cofala, J., Xing, J., Wei, W., Zhang, C., Wang, S., Kejun, J., Bhandari, P., Mathur, R., Purohit, P., Rafaj, P., Chambers, A., Amann, M., Hao, J. (2009), Projections of SO2, NOx and carbonaceous aerosol emissions in Asia, Tellus B Chem. & Phys. Meteorology, 61 (4), pp. 602-617
Kurokawa, J., Ohara, T., Uno, I, Hayasaki, M. Tanimoto, H. (2009), Influence of meteorological variability on interannual variations of springtime boundary layer ozone over Japan during 1981–2005, Atmospheric Chemistry and Physics, 9, 6287-6304.
Lamarque, J. F., et al. (2010), Historical (1850-2000) gridded anthropogenic and biomass burning emissions of reactive gases and aerosols: methodology and application, Atmospheric Chemistry and Physics, 10, 7017-7039.
Mareckova, K., Wankmueller, R., Anderl, A., Poupa, S., Wieser, M. (2009), Inventory Review 2009 : Emission Data reported under the LRTAP Convention and NEC Directive : (i) Stage 1 and 2 review ; (ii) Status of gridded data and LPS data, EMEP/EEA, Technical Report CEIP 1/2009
Moss, R. H., et al. (2010), Representative concentration pathways: a new approach to scenario development for the IPCC Fifth Assessment Report, Nature, 463, 747-756.
Ohara, T., et al. (2007), An Asian emission inventory of anthropogenic emission sources for the period 1980-2020, Atmospheric Chemistry and Physics, 7(16), 26, (for REAS dataset: J. Kurokawa, personal communication)

33
Olivier, J. G. J., (2002), On the Quality of Global Emission Inventories: Approaches, Methodologies, Input Data and Uncertainties, PhD thesis University Utrecht, ISBN 90-393-3103-0
van Aardenne et al. (2005), The EDGAR 3.2 Fast Track 2000 dataset (32FT2000), EDGAR Consortium.
van der Werf, G. R., et al. (2006), Interannual variability in global biomass burning emissions from 1997 to 2004, Atmospheric Chemistry and Physics, 6, 21.
Vukovich, J.,(2009) Conversion of the 2002 and 2005 National Emission Inventories (NEI) to Gridded Inventories for the Emission Database for Global Atmospheric Research (EDGAR), US EPA (OAR/OPAR) – EC/R Inc., Contract No. EP-D-07-001

34
Annex 1: Relationship between UNFCCC, EMEP, GAINS, EDGAR and HTAP emission categories. Table 10: Cross-correlation between the codings of EMEP, UNFCC, EDGAR and GAINS.

35
Annex 2: Country total emissions.
Table 11: Country-specific emissions totals (Tg species) for the year 2005 from the EDGAR-HTAP_V1 dataset.
Table 11a: legend and notes
Table 11b: 2005 EDGAR-HTAP_V1 inventory for EMEP domain

36
Table 11c: 2005 EDGAR-HTAP_V1 inventory for Asian domain REAS – GAINS
Table 11d: 2005 EDGAR-HTAP_V1 inventory bunkerfuel and the rest of the world (EDGAR-gapfilled)

37
Table 11d (continued): 2005 EDGAR-HTAP_V1 inventory for bunker fuel and the rest of the world (EDGAR-gapfilled)

38
Table 11d (continued): 2005 EDGAR-HTAP_V1 inventory for bunker fuel and the rest of the world (EDGAR-gapfilled)

39
Annex 3: Proxy datasets. All EDGAR-HTAP_V1 gridmaps (with exception of the US-EPA gridmaps for Northern America) have been consistently produced with a single proxy dataset: the spatial distribution proxies of EDGARv4.1 (2010). An overview is given in the Table 12. More details, preview of the map and link to data source are available at http://edgar.jrc.it/eolo (login: edgar_HTAP, passwd: htap. Go to “system info” and select “spatial datasets” Table 12: EDGARv4.1 proxy datasets with spatial distribution and sector allocation, as applied to the EDGAR-HTAP_V1 emission inventory.

40
Table 12 (continued): EDGARv4.1 proxy datasets with spatial distribution and sector allocation, as applied to the EDGAR-HTAP_V1 emission inventory.

41

1
How to obtain EU publications Our priced publications are available from EU Bookshop (http://bookshop.europa.eu), where you can place an order with the sales agent of your choice. The Publications Office has a worldwide network of sales agents. You can obtain their contact details by sending a fax to (352) 29 29-42758.

2
The mission of the JRC is to provide customer-driven scientific and technical support for the conception, development, implementation and monitoring of EU policies. As a service of the European Commission, the JRC functions as a reference centre of science and technology for the Union. Close to the policy-making process, it serves the common interest of the Member States, while being independent of special interests, whether private or national.
LB-N
A-25229-EN
-N
ISBN 978-92-79-23123-0ISSN 1831-9424 doi: 10.2788/14102