Edexcel B Geography Unit 1 Revision Booklet
45
Mrs E Barnard 2014 GCSE GEOGRAPHY REVISION – UNIT 1 DYNAMIC PLANET EDEXCEL B Exam : Tuesday 13 th May 2014 1 hour 15 minutes
-
Upload
ilayda-uludag -
Category
Documents
-
view
26 -
download
3
description
Revision for GCSE edexcel B geography, contains full syllabus.
Transcript of Edexcel B Geography Unit 1 Revision Booklet

Mrs E Barnard 2014
GCSE GEOGRAPHY
REVISION – UNIT 1
DYNAMIC PLANET
EDEXCEL B
Exam : Tuesday 13th
May 2014
1 hour 15 minutes

Mrs E Barnard 2014
• The exam will last for 1 hour and 15 minutes
• You need to answer ALL questions in Section A
• The River Processes and Pressures question in
Section B
• The Extreme Climates question in Section C
DO NOT ANSWER QUESTIONS ON COASTAL
CHANGE AND CONFLICT OR OCEANS ON THE
EDGE.
Exam structure

Mrs E Barnard 2014
UNIT 1 : DYNAMIC PLANET
Atmosphere The layers of gases/air around us.
Hydrosphere The layer of water.
Biosphere The very thin layer of living things on the crust.
Geosphere The rocks of the crust and deeper towards the core.
How are we damaging each of the spheres? Atmosphere releasing CO2 into.
Hydrosphere using too much water in some areas
Biosphere deforestation (chopping down the trees) animals extinct.
Geosphere using up fossil fuels
The layers of the earth…
The lithosphere (which is solid) is split into tectonic plates.
These move slowly (2-5cm/yr) on top of a layer called the asthenosphere (which is like porridge)
CONTINENTAL CRUST = land, low density, thick.
OCEANIC CRUST = under the oceans, thin, dense.
Meteorites give us a clue as to what the core is like.
How do we know that the inside of the earth is hot? lava from volcanoes
hot springs, geysers
Geothermal heat… Heat from the inside of the earth. Produced by the radioactive decay of uranium etc in the core
and mantle.
As heat rises from the core it creates convection currents in the liquid outer core and mantle.
These convection currents move the tectonic plates on top of them.
PLUMES = where heat moves to the surface e.g. hotspots like Hawaii.

Mrs E Barnard 2014
The magnetosphere…. The earth is surrounded by an invisible magnetic field –made by the outer core – protects the earth
from harmful radiation from space/the sun.
Pangea… The continents were once all joined together – Pangea. How do we know this? Identical fossils and rocks
have been found in western Africa and Eastern South America for example.
Today the lithosphere is split into 15 tectonic plates. Where 2 plates meet together = plate boundary.
Constructive plate boundary… Where two oceanic plates are moving apart from each other.
New oceanic crust is forming constantly in the gap created.
The magma is injected between the two plates. As it cools it
forms new oceanic crust.
The magma is runny. Shallow sided volcanoes form.
HAZARDS:
Small earthquakes are formed by friction as the plates tear apart.
Volcanoes that are not very explosive/dangerous.
Examples are Iceland – the Mid Atlantic Ridge
Destructive plate boundary… Where an oceanic plate meets a continental plate. They are
moving towards each other.
The denser oceanic plate is subducted beneath the less
dense continental plate.
HAZARDS:
very destructive earthquakes
tsunami
very explosive, destructive volcanoes which cool to be steep
sided.
Examples are Andes mountains, Peru, Chile.
Conservative plate boundary… Formed where two plates are sliding past each other.
HAZARDS:
destructive earthquakes
small earth tremors daily.
no volcanoes
Example is San Andreas Fault, California
Collision Zone A type of destructive boundary where two continental plates
move towards each other. As they meet they push upwards forming
mountain ranges e.g. Himalayas.
Convection currents from the
mantle bring magma towards
the surface. Magma is forced
between the plates, cools and
forms new oceanic crust.

Mrs E Barnard 2014
HAZARDS:
destructive earthquakes
landslides volcanoes are rare
Volcanic Explosivity Index (VEI) Measures the destructive power of a volcano on a scale from 1 to 8.
Volcanic Hazards: Pyroclastic flows – deadly clouds of hot ash and gas.
Landslides
Lahars – volcanic mudslides
Lava flows
Ash builds up on the roofs of houses buildings collapse.
Acid rain is created.
NAMED EXAMPLE: Sakurajima, Japan
Stratovolcano/ composite volcano (steep sided)
Destructive plate boundary
Can erupt 200 times a year.
ADVANTAGES OF THE VOLCANO DISADVANTAGES OF THE VOLCANO
40% of the land is fertile, volcanic soil
can grow rice and tea.
Hot springs are a tourist attraction.
Sheltered bay is good for the fishing
industry.
7000 people live at the base (are
vulnerable).
There are lots of urban areas around the
base.
The volcano hurls bombs of lava.
Pyroclastic flows and ash erupting.
Managing the threat:
Japan is a developed country so has money…..
MONITORING AND PREDICTION
Aircraft monitor the amount of gas being given off.
Tiltmeter detects swelling of magma in the rocks.
Boreholes measure the temperature of the water.
Hotsprings are monitored
Seismometers monitor earthquake activity.
PROTECTION
Concrete shelters protect people from bombs/ash.
Concrete lahar channels divert dangerous mudflows.
EVACUATION
Evacuation routes clearly sign posted.
Evacuation drills.
Why are people in developing countries at greater risk from tectonic
hazards than people in developed countries? More live in risky conditions – no where else for them to live.

Mrs E Barnard 2014
Can’t afford safe, well built houses they collapse easily
Don’t have insurance
Governments don’t have the money to provide aid.
Poor communications – no warning or evacuation.
NAMED EXAMPLE: MOUNT NYIRAGONGO,
DEMOCRATIC REPUBLIC OF CONGO, AFRICA
African rift valley
Constructive boundary
2002 hot and runny lava poured out. A river of lava 1000m wide flowed 20km into the city of
Goma.
14 villages destroyed
100 died – due to poisonous gas and trapped in the lava flow.
12 500 homes destroyed
Was predicted – 400 000 were evacuated
Refugees created (people forced to move due to natural hazards or war)
AID AND RELIEF EFFORT ( help given by organisations/countries to help those facing an
emergency).
United Nations sent 260 tonnes of food.
UK TV appeal
Governments around the world gave $35 million
Emergency measles vaccinations by the World Health Organisation.
most fled with nothing
it was months before they could start rebuilding.
EARTHQUAKES can’t be predicted.
Underground plates try to push past each other– builds up pressure – suddenly released along faults
(cracks in the crust). Energy is sent out in all directions.
Magnitude = power of the earthquake
Seismometer measures the power on the richter scale
NAMED EXAMPLE:Niigata, 2007 AND Kobe
1995, both japan, how different?
Both earthquakes were the same magnitude but…
Niigata, 2007, Japan Kobe, 1995, Japan
City of 90 000 – low population density
11 died
1000 injured
Epicentre was offshore (out to sea) so less
shaking of the land.
6pm. People were alert and remembered
their drills.
City of 1.1 million ( high population density)
5000 died
26 000 injured
Soft ground made the shaking worse
6am so people asleep and confused.

Mrs E Barnard 2014
Long term planning… There is a 70% chance of a huge earthquake hitting Tokyo. No way to predict it so….
Earthquake drills
Emergency services practice rescuing people
People keep emergency kits at home – water, torch, radio, food.
BUILDINGS…
Strong, double glazed windows – stop the glass from shattering. Shock absorbers
Strong steel frame Cross bracing Very deep foundation
Earthquakes in the developing world… Very high death tolls
NAMED EXAMPLE: Port – au- PRince,
Haiti 2010
Less developed city in a less developed country.
Epicentre very close to the capital Port – Au - Prince which has a population of 2.5 million.
No warning
7.0 on Richter scale.
Little earthquake education.
PRIMARY EFFECTS (Caused instantly by the earthquake)
316,000 people died
300,000 were injured
Many houses were poorly built and collapsed instantly. 1 million people were made homeless
The port, communication links and major roads were damaged beyond repair. Rubble from
collapsed buildings blocked road and rail links.
SECONDARY EFFECTS (in the days and weeks following the earthquake)
The water supply system was destroyed – a cholera outbreak killed over 8000 people
The port was destroyed making it hard to get aid to the area
Haiti’s important clothing factories were damaged. These provided 80% of Haiti’s exports and 1 in
5 jobs were lost.
1 year after the earthquake over 1 million people remained displaced, most in refugee camps.
Responses • US took control of Port-au-Prince airport
• 150 planes landed daily
• US and UN worked together
• UN World Food Programme increased food aid to survivors, e.g. 2 million meals delivered
on one day
• US military deployed (sent) in large numbers to help with aid effort and maintain law and
order.
• US carried out air drops
• Hospital ships deployed, e.g. USS Comfort.
• USS Carl Vinson moored near Port-au-Prince. Used as floating airport.

Mrs E Barnard 2014
NAMED EXAMPLE: SICHUAN, Central
china 2008
8.0 on the Richter scale
Collision zone where the Indian and Eurasian plates are colliding.
No warning
PRIMARY EFFECTS (Caused instantly by the earthquake)
70 000 died
400 000 injured
5 million made homeless
$75 billion damage
SECONDARY EFFECTS (in the days and weeks following the earthquake)
Lots of aftershocks buildings collapse
LOCAL RESPONSES:
Prime minister flew in
50 000 soldiers helped dig for survivors
Helicopters used to reach the isolated
$1.5 billion aid from the Chinese people
INTERNATIONAL RESPONSES:
Some countries sent money – UK $2 million
Finland sent 8000 tents
Indonesia sent medicines
Rescue teams from Russia and Hong Kong
Tsunami
Earthquakes that happen beneath the sea bed can generate a tsunami. Water is forced upwards where
the sea bed is displaced and tsunami waves spread out in all directions. The tsunami waves slow down as
they approach land but increase in height dramatically. A tsunami is a big wave up to 30m high that hits
land. They cause powerful flooding which pushes several kilometres inland destroying homes, bridges and
infrastructure. There are warning systems which set off alarms but they are only useful if the epicentre
is some distance from the coast.

Mrs E Barnard 2014
UNIT 2: CLIMATE AND CHANGE
WEATHER = short term, day to day changes in the atmosphere.
CLIMATE = the average weather conditions over 30 years.
How do we know climate was different in the past? Fossils of animals and plants that no longer live in the UK.
Landforms left by glaciers
Samples from ice sheets in Antarctica. Ice sheets are made up of layers of ice, a layer for each
year. Trapped in the ice sheets are air bubbles. Climatologists study the CO2 levels to
reconstruct past climates.
INTERGLACIALS = warm periods
GLACIALS = cold periods ice ages ice sheets 400-3000m thick extended across the northern
hemisphere.
How do we know climate has changed in the more recent past? Old photos, paintings
Diaries
Newspapers
Recorded dates of blossom and migration of birds.
Theories used to explain why climate has changed in the past (Natural
events).... 1. ERUPTION THEORY – very large and explosive volcanic eruptions change earth’s climate. Ash
and gas spread around the stratosphere and stop sunlight reaching the earth’s surface
cools the earth. Example is Mt Pinatubo, 1991, Philippines – reduced global sunlight by 10% and
cooled the earth 0.5 degrees for a year.
2. SUNSPOT THEORY – black areas on the sun’s surface. Some times there are more then they
disappear. Spots mean greater activity and more solar energy being sent towards the earth
warmer. 3. ORBITAL THEORY/MILANKOVITH CYCLES – Changes in the way the earth orbits the sun
from circular to ellipse alters the amount of sunlight the earth receives.
NAMED EXAMPLE: the little ice age
Greenland Vikings ran out of food and died as temperatures fell.
In England there were ‘frost fairs’ on the river Thames when it froze.
Crops failed
‘Great famine’
Farmers died of hunger

Mrs E Barnard 2014
Glaciers in the Alps grew and destroyed villages
They had to change their crops from wheat to potatoes
Ecosystems – where plants and animals interact with each other and their environment in order to
survive. Can be small e.g. pond or large e.g. Tropical Rainforest.
How were ecosystems affected by climate change in the past? The dinosaur extinction was possibly caused by a massive asteroid hitting Mexico and a huge
volcano in India combining dust, ash, gas into the stratosphere blocks the sun cools the
climate plants don’t grow dinosaurs have no food……..knock on effect through the food chain.
Megafauna extinction – big animals like the woolly mammoth. The climate was warming so they
had to find new areas to live where the climate suited them. This disrupted food chains. Humans
also hunted them to extinction.
How is our atmosphere being changed by human activity?
Greenhouse gases (CO2 from the burning of fossil fuels, deforestation, Methane from paddy
fields and cattle, Nitrous oxide from aircraft engines and fertilisers) trap heat from leaving the
atmosphere and re-radiate that heat back down to earth. The greater the concentration of
greenhouse gases, the more heat is trapped and the warmer earth becomes.
We need the NATURAL greenhouse effect – it makes the planet 16 degrees warmer. Without it
the earth would be too cold for us to survive.
The extra greenhouse gases produces by humans burning fossil fuels power stations,
transport, industry, homes.
Most greenhouse gases are produced by developed countries – the EU, USA, Japan.
The average person in the developing world The average person in the developed world
produces 1 tonne of CO2. produces 10-25 tonnes of CO2.

Mrs E Barnard 2014
We are worried about increasing emissions. Issues we need to think
about: how can we decrease emissions in the developed world.
how can we persuade developing countries e.g. China, India to slow their CO2 emissions.
how do we protect vulnerable people from the impacts of climate change?
GLOBAL WARMING = a warming of the earth’s temperatures caused by the ENHANCED
greenhouse effect (human’s have polluted the atmosphere so it is working more strongly).
Global temperatures increase.
sea levels rise THERMAL EXPANSION (water droplets expand as warm) and glaciers and ice
sheets melt.
What evidence is there of Global Warming happening? 19 out of 20 warmest years on record since 1980.
Sea ice in the Arctic shrank.
90% glaciers shrinking.
Scientists disagree – are human actions the main cause of global warming OR is it mostly natural??
Predicting future Global Warming is hard….as we don’t know: What the future population will be.
If we will continue to use fossil fuels or change to cleaner fuels e.g. solar, wind power…
If we will change our lifestyles recycle use public transport etc.
The UK Climate Ocean Influence
Temperate maritime climate, experiencing mild temperatures relative to latitude, with rainfall in
all months of the year.
Difference between seasons are relatively small
UK’s climate is strongly influenced by a warm ocean current called the North Atlantic Drift
Air Masses and seasons
Effect of tilt of earth’s axis is to produce seasons. In the UK seasons are also influenced by the
position of the polar front which is the boundary between cold polar air to the north and warm
tropical air to the south.
The position of the polar front determines whether a cold or warm air mass sits over the UK. The
air masses have a strong influence on precipitation and temperature, wind and cloud cover.
In winter the colder polar front sits over the UK and in summer it moves North allowing the
warmer tropical air to sit over the UK.
One reason it rains so much in the UK is because rain forms when cold and warm air meet a the
polar front which usually occurs over or close to the UK.
Average Conditions
Although the climate is similar across the whole of the UK, there are small differences:
Western and northern locations such as Glasgow are the wettest due to the wet air coming in
from the Atlantic Ocean.
Mrs E Barnard 2014
Southern and eastern location like Cambridge are the warmest and driest and tend to have more
sunshine hours.
Big Shifts
Most scientists expect the UK’s climate to change in the future as a result of global warming. Some big
changes could take place;
Polar front may shift north, so the UK experiences tropical air masses more often. This would
mean our climate would be warmer and drier in the summer, but wetter in the winter.
The North Atlantic drift could change position or weaken producing a much more variable climate.
How might the UK be affected by Global Warming?
1. Likely to be WARMER:
COSTS BENEFITS
Summer drought and water shortages,
especially in the south.
More illnesses e.g. sunstroke, skin cancer.
Roads melt, railway lines buckle.
Farmers change crops to those that need
less water and more sun.
Extinctions of some plants and animals as it
gets too hot.
Winter heating costs and the costs of
gritting the roads fall.
Tourism increases – good for the economy.
Fewer deaths in winter especially the
elderly from the cold.
More land can be farmed at higher
altitudes.
2. SEA LEVEL rise
Low lying coasts could flood
Greater erosion e.g. Holderness
Sea defences and flood barriers would cost £millions.
3. More EXTREME WEATHER
Heatwaves
Floods
Storms
Extreme weather is hard to predict and costly.
The Stern Review 2005 We should spend 2% our GDP now, reducing pollution OR the effects of global warming could decrease
our GDP by 20%. ‘Spend now or pay later’.
What can we do? Decrease fossil fuel use.
Switch to ‘green energy’ – wind, solar, tidal.
Recycle more
Use cars less and public transport more.
1997 Kyoto Protocol = international agreement to cut CO2 emissions.
Some countries e.g. UK have cut emissions, others e.g. China haven’t. We need ALL countries to sign up.

Mrs E Barnard 2014
NAMED EXAMPLE: Egypt – the possible
impacts of Global Warming
A developing country
Low greenhouse gas emissions – 2.6 tonnes per person per year (world average = 6.8)
Produce less than 1% all green house gases.
99% of Egypt’s people live in 5% land area as so much is desert.
Average rainfall = less than 10mm/yr
The River Nile is an important water supply.
With Global Warming…
If sea levels rise 50cm, 1/3 of the city of Alexandria would be under water.
10% Nile Delta would flood 7 million people would have to leave their homes. farming would
be hit. there would be less food famine.
Less and more unreliable rainfall water shortages.
Desertification
Heatwaves illness and death.
Malaria increase.
Water Wars??
86% of the Nile’s water starts it’s journey in Ethiopia.
Uganda, Sudan and Ethiopia are all building huge dams for Hydro Electric Power (HEP).
This could have a serious impact on the amount of water reaching Egypt.
This could lead to conflict and war.
Egypt has a debt of $30 billion. It may not be able to cope with the impacts of global warming.

Mrs E Barnard 2014
UNIT 3: BATTLE FOR THE BIOSPHERE
BIOME = WORLD SCALE ECOSYSTEM
The world has 9 major biomes – determined by climate:
Temperature – length of the growing season
Precipitation
Sunshine hours – precipitation
Humidity
Why does climate vary around the world?
LATITUDE:
At the equator the sun’s rays hit the earth at right angles, therefore
concentrating the insolation and making it very hot. At the poles the rays hit at a
greater angle, so the insolation is spread out over a greater area and is much less
concentrated.
At the equator the air is always rising = LOW pressure = clouds and rain =
rainforests.
At 30 degrees north and south of the equator the air is always sinking = HIGH
pressure = no clouds and no rain = deserts.
ALTITUDE: (height of the land) – as height increases so the climate gets increasingly cold and wet.
Temperature decreases 1 degree for every 100m of height.
THE SEA: keeps places near the coast cooler in summer and warmer in winter (as water heats up and
cools down more slowly than the land) this is called continentality.
PREVAILING WINDS: If the most common winds come from across the land, the climate = dry. If
across the sea, the climate – wet. From the poles = cold, from the equator = warm.
A climate graph…
The RED line graph = average temperature for each month.
The BLUE bar graph = average rainfall for each month.
TEMPERAURE RANGE = difference between min and max
temperatures.
Mrs E Barnard 2014
Goods and services GOODS = things of value to us
SERVICES = things that satisfy our needs
BIOSPHERE GOODS BIOSPHERE SERVICES
Fruit, nuts
Food crops
Meat, fish, wood
Biomass for energy
Drinking water, water for farming
Gene pool
Pollination for food webs
Climate regulation
Atmosphere gas balance (trees remove co2 and
give out oxygen)
Jobs
Recreation – tourism
Homes for humans and wildlife
Biodiversity
NAMED EXAMPLE: THE TROPICAL
RAINFORESTS
TRF indigenous people (lived their for many generations) - almost everything provided by the rainforest:
Wood for cooking and building
herbs for medicine
food – nuts, fruit, meat, fish
grow crops – shifting cultivation (sustainable process)
BUT…
TNC’s exploit the TRF
logging for timber/paper
farming – palm oil for example
cattle ranches
mining for oil
governments building dams for HEP
roads
This means…
The soil is eroded and washed away floods.
Wildlife loses habitats
Rivers become dirty and polluted
PLAYERS… Different people and organisations who use the biosphere in different ways.
NAMED EXAMPLE: The Guyana
Mountains Rainforest
The Guyanan government is short of money and in debt.
They wanted to develop the rainforest for timber and mining.
Environmentalists and local people opposed this
How is the biosphere being degraded by human actions?
Every year the ‘red list’ of endangered animals is produced.

Mrs E Barnard 2014
Increasingly, habitats are being damaged and destroyed this leads to increased threat of species
survival.
Immediate causes = logging, overfishing, pollution
Root causes = increasing populations, economic development e.g. China, India now = more money and
therefore consuming more food and fuel etc.
Certain species and places are particularly under threat.
There are 25 ‘hotspots’ where there is greatest concentration of biodiversity (number of plants and
animals).
How have ecosystems changed over time? MASS EXTINCTION = extinction of a large number of species in a short time.
Are we heading towards another mass extinction? We are threatening the ability of the biosphere to
provide goods and services due to:
Population growth
Using more food, oil, water, minerals
Human induced change (global warming)
Impacts of climate change on the biosphere: Habitats broken up
Habitats change due to increasing temperatures, changing rainfall, rising sea levels
Extreme weather = more common
Oceans = more acidic as more freshwater is added. Kills coral reefs.
Increased pests and diseases.
Species face extinction
Krill numbers falling
Glaciers melting
Emperor penguins decreased 50%
How can we conserve the biosphere? Should we save the hotspots or a representation of all of the biomes?
Should we restore devastated areas?
Threats to the biosphere…
OVERHARVESTING/OVERHUNT
ING/OVERFISHING
e.g. Krill
DEFORESTATION: Logging
increased flooding and increased soil
erosion e.g. Amazon Rainforest.
CHANGING LANDUSE
to farmland/urban –
changes the ecosystem
TOURISM AND RECREATION
disturbs wildlife.
INTRODUCING ALIEN
SPECIES POLLUTION
air/water
MINING
Oil e.g. Alaska
Mrs E Barnard 2014
Should we conserve high profile animals or keystone species (have a large effect on other living
things e.g. bees)
GLOBAL ACTIONS… (countries working together) (Pg 53)
RAMSAR conserving wetlands
CITES stop ivory trade/crocodile skins
NATIONAL ACTIONS… (a particular country)
National Parks England and Wales – protected areas e.g. The Peak District
Community Forests – new areas of trees near cities
Paying farmers to replace hedgerows
LOCAL ACTIONS… (local area)
Biodversity action plans protect natural vegetation in Great Britain.
SUSTAINABLE MANAGEMENT – meeting the needs of the present without compromising the needs
of future generations.
Tropical Rainforests – make sure it isn’t used faster than it is renewed.
Ways to do this…
Zoning
Educating local people
Ecotourism
Protected areas
Only cut large trees
NAMED EXAMPLE: KIlum, Cameroon
Republic: Sustainable Forest
Reserve
an area of selective logging
tree nurseries to replace trees cut down (afforestation)
ecotourism
protected areas
crops grown beneath the trees instead of cutting them down.
Direct and indirect degradation
Direct Threats
Deforestation is a problem for a biome such as the Tropical Rainforest. However the rate of
deforestation in Amazonia has slowed since 2004. This is good news and has happened because
Large area has been protected since 2006
Recession since 2008 has reduced the demand for resources
Government has cracked down on illegal logging and cattle ranching by seizing land and freezing
bank accounts
Brazilians themselves have become more ‘green’.

Mrs E Barnard 2014
Indirect Threats
Indirect threats are much harder to manage. The main indirect threat is global warming. Brazil only
emits about 1.5% of global carbon dioxide so it cannot tackle this problem on its own. Some effects are
Plants are flowering earlier
Bird migration patterns are changing
Arctic tundra is warming rapidly
Species cannot adapt quickly enough to climate change
Temp rise of 1 degrees = 10% of land species face extinction
Temp rise of 2 degrees = 15-40% of land species face extinction
Scientists believe that a rise of 3 degrees could happen by 2060.
Climate Stress
Amazon rainforest suffered two extreme droughts in 2005 and 2010. During the drought the Amazon
switched from absorbing carbon dioxide to emitting it. This can accelerate global warming even more,
making the problem worse.

Mrs E Barnard 2014
UNIT 4: WATER WORLD
THE HYDROLOGICAL CYCLE
The hydrological cycle is a CLOSED SYSTEM – A finite amount of water going round and round. None is
added or lost.
STORES: rocks (can be stored for 100’s yrs), soil, lakes, oceans (97% water stored BUT too salty to use)
glaciers.
The soil, lakes and rocks hold relatively small amounts of fresh water – but are in high demand as
sources of water..
TRANSFERS/FLOWS: Surface runoff, throughflow, groundwater flow, infiltration, precipitation.
Intercepts precipitation
½ is evapotranspiration without ever reaching the
ground = GREEN WATER
Drips from leaves and infiltrates the soil

Mrs E Barnard 2014
Water Crisis Demand increases as population increases.
Increased demand from agriculture – irrigating their crops uses huge amounts of water.
Supplies are increasingly unpredictable
Possibility of water wars – Middle East – fighting over water.
Economic development – China, India – increased demand for water
Rising living standards = use more water e.g. showers, washing machines etc.
Only ½ freshwater runoff (BLUE WATER) is used.
Most is inaccessible.
WATER STRESS = when demand is greater than supply or when it is not of good enough quality to use.
Turkmenistan and Uzbekistan are the most water stressed countries in the world they use huge
quantities for irrigating cotton crops.
SW USA, Central Asia = PHYSICAL WATER SCARCITY – Demand > availability
Sub Saharan Africa = ECONOMIC WATER SCARCITY – supply available but people can’t afford to
exploit them. Lack of money to build storage facilities or distribute water.
NAMED EXAMPLE: SAHEL
Belt of semi-arid land south of the Sahara, Africa.
Rains usually 1 or 2 months a year. Total 250-450mm/yr.
Since 1970 rainfall has been below average. Some years 25% less than average.
Sometimes rainfall is so heavy when it does fall that most is lost as surface runoff leading to
flooding.
Other years there is no rain at all rivers dry up water table falls farmers crops fail
animals die desertification decreased food supplies famine.
Global warming means… Less rain for some areas
Increased rate of glacier melt
More extreme weather events floods and storms and droughts.
Richer countries e.g. Kuwait, Saudi Arabia (profit from oil) can buy their way out of trouble e.g.
desalination turning sea water into fresh water (very expensive).
Decline in water availability and quality
Population growth Agricultural demand urbanisation
Industrial development
Climate change = rain less reliable in some places
Tourism – hotels, golf
courses = huge amounts
of water
Energy – reservoir
storage for HEP = +lost
through evaporation

Mrs E Barnard 2014
Developing countries rely on rainfall for their crops + unstable food insecurity and famine.
Water quality… People can suffer economic water stress if water isn’t safe. Pollution can be: domestic, industrial,
agricultural, transport related.
Developing countries…
The highest levels of pollution are found in rapidly developing countries like India and China – they
put economic growth before environmental protection.
Rapidly growing cities means slums streams = badly polluted as no sewage systems in place.
Chemicals added to crops = runoff….
Developed countries…
E.g. UK, Japan – have taken big steps to control pollution.
Tertiary and quaternary industries cause less pollution than primary and secondary.
NAMED EXAMPLE: – Japan – ‘60’s = heavily polluted rivers and lakes. 70’s
government introduced standards to improve water quality. Now much better.
Impacts of pollution… Diseases e.g. cholera
Eutrophication – fertilisers make algae grow really fast – takes all O2 out of water – all living
things in river/lake die.
Cancer (Erin Brokovitch)
Interfering in the hydrological cycle… We use water for: farming, drinking, washing, industry, habitats for plants and animals, power
generation (HEP), waste disposal.
How people intervene in the water cycle:
1. CLOUD SEEDING: making it rain
2. DEFORESTATION: Decreased interception increased flooding
3. URBANISATION: Increased impermeable surfaces
4. OVERABSTRACTION: taking too much water from rivers and lakes
5. BUILDING DAMS AND RESERVOIRS
6. GLOBAL WARMING: melting glaciers
Sources of water pollution
Salt runoff from roads
sewage Runoff from building sites
Industrial discharge
Chemicals applied to golf courses Crop spraying Fertilisers washed in
Cattle waste (slurry)
Disposal of hazardous waste

Mrs E Barnard 2014
OVERABSTRACTION: Too much water is being taken from the river/lake/water source.
NAMED EXAMPLE: Thames Valley, S. Eng.
Dramatic decrease in river flow
Tributaries dried up
Ecosystem damaged
Droughts and increased demand from more homes increased use of groundwater supplies falling
water table so the store of water is not used sustainably.
most water companies now have strict policies CAMS for managing water levels.
RESERVOIR BUILDING: Adds a new store to the hydrological cycle. But….brings
PROBLEMS:
loss of land – drowns villages, farmland
disease – stagnant water mosquitoes
vegetation drowned releases methane = greenhouse gas
BENEFITS:
Water supply
Recreation – fishing, sailing, walking, wildlife
DEFORESTATION Fewer trees = less evapotranspiration. Less green water recycled = less rain.
Soil left exposed to the sun and rain
Less nutrients in the soil
Raindrops wash out the finer soil, leaving coarse, heavy surface.
Less interception greater flood risk
Solutions to the water crisis… If we use water faster than it can be replenished this is not sustainable
Large scale water management projects: Big dams
BENEFITS DISADVANTAGES
Increased water supply
Recreational use
HEP – Industry
Habitat for water birds
Fishing
loss of farmland/villages
less navigation
people have to be relocated
disease – stagnant water
loss of cultural sites
interferes with fish migration

Mrs E Barnard 2014
NAMED EXAMPLE: china: south to
north water diversion project
To transfer water from the south to the dry north.
Complete 2050
Loss of ancient sites, displaced people
NAMED EXAMPLE: three gorges dam
To provide HEP (Hydro Electric Power) and prevent flooding
Impacted biodiversity
1.4 million people had to be relocated
Small scale solutions…
NGO’s (Non Governmental Organisations) e.g. WaterAid develop small scale solutions.
APPROPRIATE/INTERMEDIATE SOLUTIONS: Schemes that meet the needs of local people and the
environment in which they live. Within their technical ability – they can operate and maintain the scheme
themselves. They can continue to run it when the NGO has left e.g RAINWATER HARVESTING – using
guttering to collect rainwater and divert it into a tank. TUBE WELLS – to pump up water. LOW COST
PIT/COMPOSTING TOILETS.
NAMED EXAMPLE: The Hoover Dam,
Colorado river, usa
Opened in 1936 and cost $49 million.
The reservoir created provides water for 8 million people including the city of Las Vegas which is
an arid region and relies on the water for farming, homes and recreation.
To provide HEP (Hydro Electric Power) and prevent flooding so none reaches the sea.
Nearly all of the Colorado River’s water is used so virtually none reaches the sea
.Impacted biodiversity with bird and fish species declining.
1.4 million people had to be relocated
Due to drought reducing inputs, the reservoir (Lake Mead) currently is only around 40% full and it
is predicted that it could fall below useable levels as early as 2020.
Small scale solutions… CHEAP TO BUILD AND CHEAP TO
MAINTAIN (SUSTAINABLE!)
NGO’s (Non Governmental Organisations) e.g. WaterAid develop small scale solutions.
APPROPRIATE/INTERMEDIATE SOLUTIONS: Schemes that meet the needs of local people and the
environment in which they live. Within their technical ability – they can operate and maintain the scheme
themselves. They can continue to run it when the NGO has left e.g RAINWATER HARVESTING – using
guttering to collect rainwater and divert it into a tank. TUBE WELLS – to pump up water. LOW COST
PIT/COMPOSTING TOILETS.

Mrs E Barnard 2014
NAMED EXAMPLE: SAND DAMS, Kenya
Aim to transform millions of lives.
A sand dam is a reinforced-concrete wall built across seasonal river beds, 2-4m high and up to
90m across.
To support farmers in developing countries to gain access to clean water and grow enough food to
eat and sell.
people no longer have to walk miles or spend time collecting water so children can attend school and
adults can work.
Provides water for people, livestock and plants
they can run facilities themselves
moving out of poverty
In the past women had to walk long distances to get water. Now they have safe water for drinking,
cooking, washing and personal hygiene.
Problems of small scale schemes…
Need help form outside organisations and charities (NGOs such as
water aid) to initially fund the project. In general, Intermediate technology is more sustainable than large scale schemes.
NAMED EXAMPLE: DHAKA, BANGLADESH
Old Zhimkhana – slum on disused railway station. No safe water or toilets.
WaterAid constructed 6 tube wells and 2 new sanitation blocks
people are no longer continually ill
they can run facilities themselves
moving out of poverty
In the past women had to walk long distances to get water. Now they have safe water for drinking,
cooking, washing and personal hygiene.
Problems of small scale schemes… A huge number of people suffer from HIV/AIDS too ill to operate.
In general, Intermediate technology is more sustainable than large scale schemes.

Mrs E Barnard 2014
TOPIC 6: RIVER PROCESSES AND PRESSURES How do landforms change downstream?
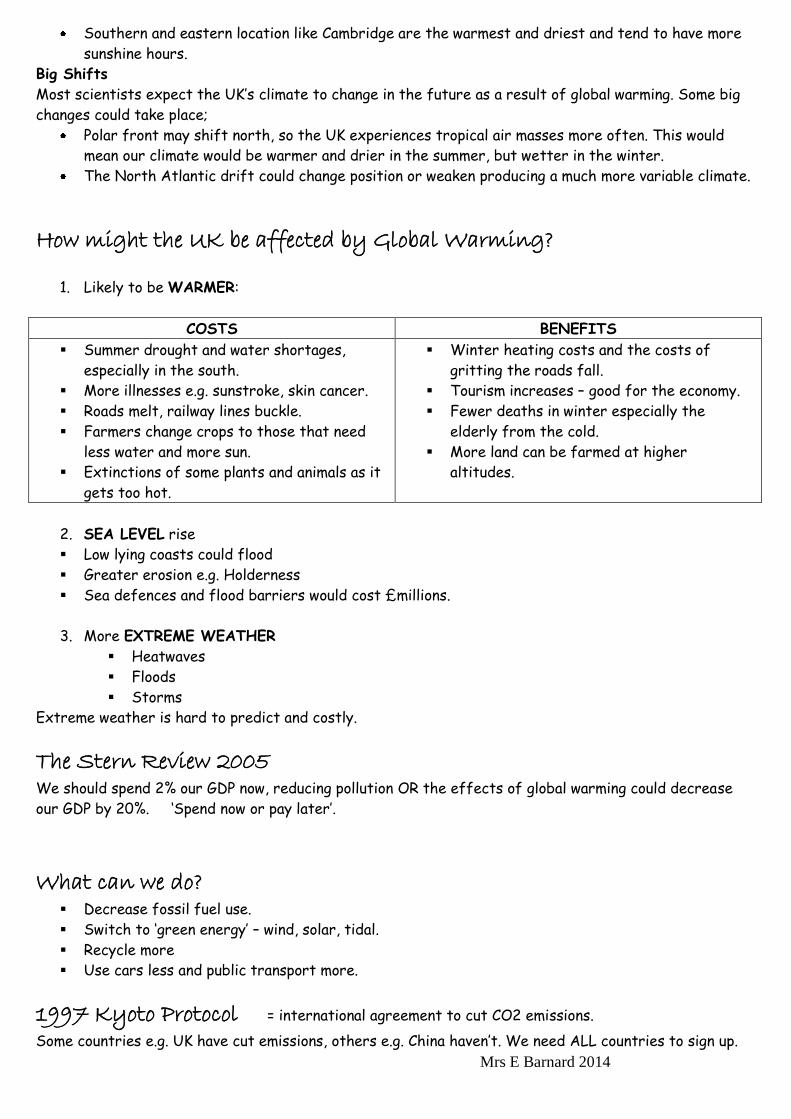
Can you name, describe and explain the formation of landforms in the
Upper course (v-shaped valleys, waterfalls and interlocking spurs)
Middle course (meanders)
Lower course (ox-bow lakes, flood plain, deltas)
How does the channel shape change downstream?
How do the channel shape and load (e.g. size and angularity) of a river change from lower
course to upper course?
Why does the load of a river change downstream? (Link to weathering, e.g., angular load
in the upper course due to weathering on upper slopes of valley)
Do you know what the long-profile of a river is?
How does weathering affect slope processes?
E.g., do you know how angular rock material can get into the river channel due to weathering on
upper slopes of a river valley?
What are the causes of flooding?
Do you know how?
Human (e.g., urbanisation, deforestation) and
Physical factors (soils/rock type, temperature, type and amount of rainfall)cause flooding
How will climate change increase the flood risk?
What could climate change mean? More intense rainfall, harder and drier ground
What are the effects of flooding?
You need to know:
Effects on people – death, crops& animals, insurance, disease, damage…
Effects on environment – landslides, soil erosion, loss of habitat, soil contaminated by
sewage
Case study/example – you need to know the causes and effects of flooding
Your case study is York
You need to know the causes (natural and human) of flooding
Effects of flooding (social – on people, economics – cost and environmental)
Response – what was done to try to reduce the impacts of flooding
Prediction and prevention of the effects of flooding
How can forecasting, building design and planning reduce the impact of flooding?
Forecasting - evacuation, mapping and computer simulation models

Mrs E Barnard 2014
Building design – ceramic tiles, raise height of electrical sockets, stainless steel/plastic
kitchens, replace wooden window frames with synthetic ones.
Planning – do not build on flood plains
Education – leaflets, adverts
Hydrographs
Can you describe the shape of a hydrograph?
Rising limb, ascending (falling limb), peak discharge, peak rainfall, lag time, base flow)
Do you know what will affect the shape of the hydrograph?
Flood management
Do you know the advantages and disadvantages of hard and soft engineering?
Hard engineering – Embankments, Channelisation, Dams, Flood relief channels
For example, the Colorado and 3 Gorges Dam, flood control in York
Soft engineering – Washlands, Afforestation, land-use zoning, flood warning
For example, planting 20 000 trees and shrubs and creating meanders on the River Skerne near
Darlington.
How do landforms change downstream?
Can you name, describe and explain the formation of landforms in the
Upper course (v-shaped valleys, waterfalls and interlocking spurs)
When a river in the upper course does
not have a lot of energy, they tend to
flow around the valley side slopes.
When you look at them head on they
look like they fit together.
Mrs E Barnard 2014
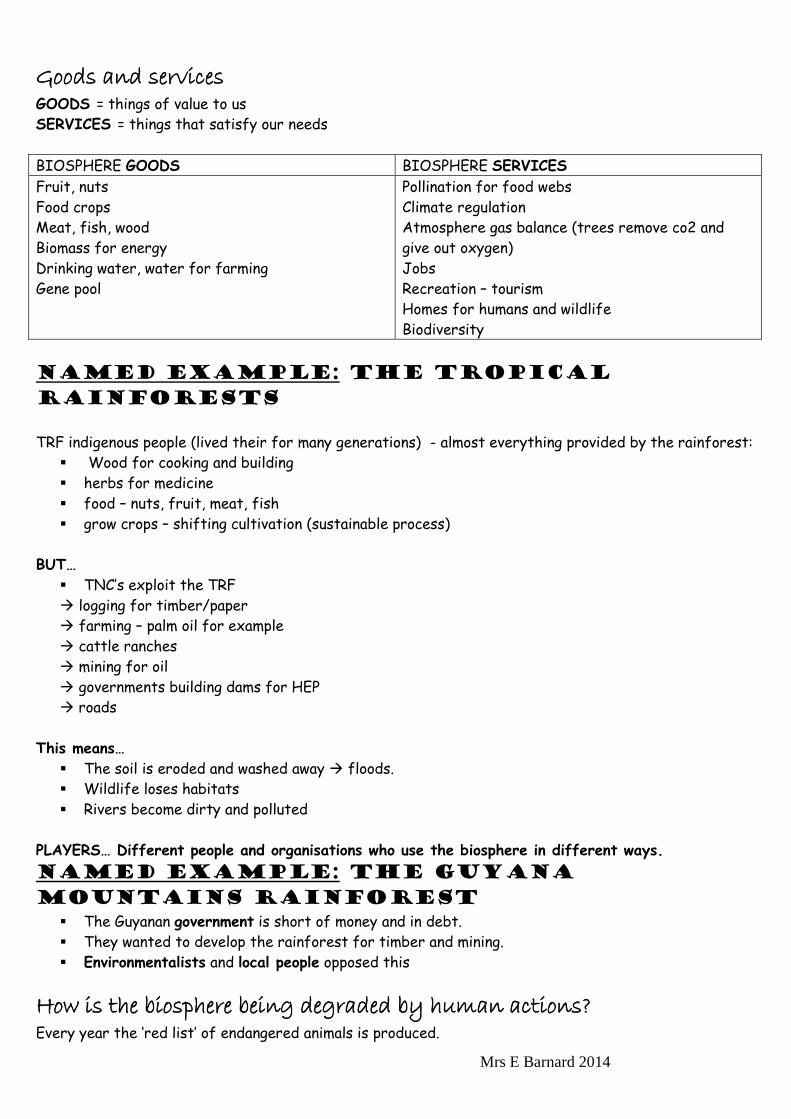
Middle course (meanders)
Lower course (ox-bow lakes, flood plain, deltas)
As the river flow downstream the
gradient decreases. The river has
less energy to erode downwards,
instead the river erodes laterally
(sideways).
The river has more energy on the
outside of the meander.
Hydraulic pressure and corrosion
undercut the river bank to form a
river cliff.
On the inside of the meander the
river has less energy to transport
its load. It therefore deposits
material forming a slip off
slope/river beach.

Mrs E Barnard 2014
Formation of levees
STAGE 1
Continual erosion
of the outer
banks of a
meander by
processes such as
hydraulic action
causes the neck
of the meander to
become narrower
and narrower.
STAGE 2
Eventually as the neck becomes
increasingly narrow, the two
outer bends meet and the river
cuts through the neck of the
meander. The water now takes
the shortest route rather than
flowing round the bend. The
fastest current is in the centre
and deposition is likely at the
sides. This deposition begins to
seal off the old meander from
the rivers new channel.
STAGE 3
Eventually deposition
completely seals off the old
meander and the old meander
bend is left isolated as an ox-
bow lake. Over time this
feature is likely to fill with
sediment and dry up (except
for periods of heavy rain). The
feature left behind when the
water dries up is known as a
meander scar.
Lateral erosion causes
the meanders to migrate
outwards = wide / flat
valley floor

Mrs E Barnard 2014
Flood plain
How does the channel shape change downstream?
How do the channel shape and load (e.g. size and angularity) of a river change from lower
course to upper course?
Why does the load of a river change downstream? (Link to weathering, e.g., angular load
in the upper course due to weathering on upper slopes of valley)
Do you know what the long-profile of a river is?
A flood plain is a wide flat area of land either side
of a river in its lower
course. It is caused by
both erosional and
depositional processes….
The largest sediment is
dropped at the side of
the banks. This is
repeated and it builds up
to form levees
When the river floods, it runs out of
energy and deposits the sediment
that it was carrying
You should be able to describe what
this shows. In the upper course the river
channel (upstream) is narrower, shallower
and has a smaller discharge. The load of
the river is larger and more angular as
materials falls into the river due to
weathering on the upper slopes of the
river valley
As the river moves downstream the
gradient decreases, as does the size of
the load as attrition reduces its size and
makes it smoother.
Average velocity also increases as the
river channel becomes wider and deeper.
There is less friction between the water
and the river banks and bed. The river
therefore flows faster (is more efficient)

Mrs E Barnard 2014
What are the causes of flooding?
Human factors
Deforestation – vegetation collects, stores and uses water from a drainage basin. The less
vegetation there is the more can reach the river channel
Urbanisation – In towns and cities rainwater will not infiltrate the hard, man-made impermeable
surfaces like concrete and tarmac so runs directly into the river channel.
How will climate change affect flood risk? – increasing global temperatures, partly due to
human activities such as burning fossil-fuels, can cause more melting of ice in glaciers and more
rainfall and frequent storms. Ground may be harder, so less infiltration.
Physical factors
soils/rock type – impermeable rocks such as clay and granite do not let water into the ground,
so rainwater runs across the surface into the channel.
type and amount of rainfall – intense rainfall will not allow rain to infiltrate into the soil, it
flows quickly across the surface and into the channel
A long period of steady rain will saturate the soil and, not allowing infiltration. Surface run-off
therefore occurs.
Snow melt – when temperatures rise above zero rapid snow melt causes flooding, especially if
underlying soil remains frozen, preventing infiltration.

Mrs E Barnard 2014
What are the effects of flooding?
You need to know the causes and effects of flooding in YORK
Causes of flooding Effects Response
Human Physical
Removal of Peat from
the moors has allowed
water to reach the
river more quickly
Growth of York and
surrounding villages
has covered land with
tarmac and concrete.
These impermeable
surfaces do not allow
infiltration and
increase surface run-
off.
Drainage basins
already
saturated by
heavy rainfall
The confluence
of the rivers
Ouse and Fosse
is in York
Over 300 homes
flooded
Business
suffered –
floods upto 1m
deep in
buildings- loss of
income not all
covered by
insurance
Damaged roads
need repairing
Natural Flood Plain upstream
(Clifton Ings) that stores 2.3
million cubic litres of water and
lowers flood water in centre by 15
cm.
Earth and concrete Embankments
supported by steel sheeting.
New ‘Aquabarriers’ can
temporarily holdback flood water
and can be moved
Banks around Ings raised and
sluice gates let water in and out.
Prediction and prevention of the effects of flooding
How can forecasting, building design and planning reduce the impact of flooding?
Forecasting - evacuation, mapping and computer simulation models
Effects on people
Death
Contamination of water
supply & loss of services
e.g., gas
Disease and
illness
Damage to
property
Crops and
animals lost Disruption to transport
Landslides
Loss of
belongings
Effects on environment
Soil contamination
by sewage
Vegetation
destroyed
Animals drowned
Insurance claims
Loss of wildlife and habitat
Soil erosion
Insurance claims

Mrs E Barnard 2014
If a river has a history of flooding it can monitored by the environment agency. If rivers rise to
dangerous levels they can warn people in areas of risk and if necessary evacuate people to a
safer place. Maps identify different levels of risk.
Computer simulation models are used to predict flooding.
Building design
ceramic tiles on ground floor – damage can be cleaned up easily
raise height of electrical sockets, to 1.5 metres above ground
stainless steel/plastic kitchens instead of wood/chip board
replace wooden window frames with synthetic ones
Boilers positioned upstairs
Planning
Do not build houses on flood plains
Landuse zoning – recreation areas (parks and playing fields) on floodplain
Education
Leaflets through post
Adverts on TV , newspapers and radio
Information on websites
Helpline telephone numbers
Training drills and exercises
Hydrographs
Can you describe the shape of a hydrograph?
Rising limb – water reaches the river by surface run-off
Peak discharge – maximum discharge (at a given tine) of a river
Falling limb – water still reaching the river by through-flow
Base flow- in times of drought rivers still flow. Water reaches river by groundwater flow
Do you know what will affect the shape
of the hydrograph?
Heavy rain, long period of rain saturated
soil) impermeable rock/soil, steep slopes,
urbanisation & snow melt will cause rapid
surface run-off and a steep rising limb –
FLASHY hydrograph – rapid rising limb,
steep falling limb, small lag time.
Permeable rocks, forested catchment,
gentle slopes, will reduce surface run off
and reduce flood risk. LOWER peak
discharge and longer lag time

Mrs E Barnard 2014
How can flood risk be reduced? – Hard Engineering
For example, the Colorado and 3 Gorges Dam, flood control in York
Hard engineering Description Advantages Disadvanatges
Dams control and
regulate flow of a
river.
E.g. 3 Gorges and
Hoover Dam
Generate HEP
Recreation –
sailing, fishing
Constant flow of
river, less flood
risk
Flood farmland and
forest
Get silted up
Less silt downsteam,
land becomes less
fertile
Expensive
Straightening a
meander allows water
to flow faster,
scours and deepens
the channel.
This was used in
river Mississippi
Takes flood risk
elsewhere
Expensive
In times of flood
rivers return to
original state
Reduced habitat value
Channelisation –
concrete the river
banks.
This happens in USA
(think if Terminator
and Grease!)
River flows faster
– scours and
depend river bed
so river holds
greater volume of
water
Ugly
No habitat value
Dredging still needed
expensive

Mrs E Barnard 2014
Soft engineering
For example, planting 20 000 trees and shrubs and creating meanders on the River Skerne near
Darlington.
Soft Engineering Description Advantages Disadvantages
Willow stakes stabilise
river bank
Uses
sustainable
materials
Encourages
habitat
diversity –
voles in river
banks
Looks
attractive
May not work in
heavy flooding
Cost – labour
intensive to
build
Riparian zoning – planting and natural landuse along river
reduces flood risk
High habitat
value
Is natural
Time taken for
vegetation to
grow
Not suitable if
valuable land
next to river

Mrs E Barnard 2014
UNIT 8: EXTREME ENVIRONMENTS
Living in the Australian Outback... Summertime temperatures +40 degrees
Rain rare
Soil thin and infertile
Isolated
After Antarctica, Australia is the world’s driest continent
NAMED EXAMPLE: Bourke, new south
wales, Australia
Barren
Sparsely populated
Desert/semi desert
Scattered cattle farms
A few dirt tracks
Why is most of Australia desert?
PACIFIC Great Dividing Range
The mountains that border the coast = a rain shadow effect.
The further west the winds blow the drier they become. Western Australia = the driest.
How do plants and animals survive?
PLANTS…
SUCCULENCE plants store water in fleshy leaves, stems and roots.
Water is captured and stored
They quickly absorb water through their long roots and store it for long periods.
Waxy stems and leaves make them waterproof.
Metabolism slows during times of drought. Growth stops.
Spikes/toxic/camouflage protect them against animals wanting to eat them.
DROUGHT TOLERANCE
During drought they shed their leaves
Become dormant (asleep)
Deep roots to get to underground water
DROUGHT AVOIDANCE

Mrs E Barnard 2014
Most of these survive one season, rapid life cycle and die after seeding.
Seeds last years and only germinate when soil moisture is high.
AMIMALS… THE BILBY – small mammal with a pouch.
Nocturnal shelters from the heat to avoid dehydration
Burrows for moister, cooler conditions
Obtains enough moisture from food bulbs, insects etc
THE PERENTE – Lizard
Digs burrows
Hibernates May-Aug to avoid cold
Low moisture needs
RED KANGAROO
Hops (fast, energy efficient travel)
Feeds at dawn and dusk – air is cooler
Sleeps during the heat of the day
Dew = water intake
Rain triggers hormones so breeding only occurs during rains
How do people cope? The problem is making a living. The soil is poor. There is little grazing. In the Outback the farms
are therefore very large.
Recent droughts = pressure on the landscape. The grass soon starts to die. With no roots to bind
the soil together it erodes.
Underground water stores are overused and the water tables are falling
Managing Water Supplies… Farmers have dams and reservoirs to store water for cattle and sheep to drink.
Boreholes used to tap underground water (aquifers beneath the ground are rocks that store
water).
Most people don’t farm, they work in the mines.
They need a lot of energy to run air conditioning needed to make life more bearable.
NAMED EXAMPLE: PRAIRIE HOTEL,
PARACHILNA
1 Metre below the ground – cooled by the surrounding rocks.
Solar panels for electricity lights and fans
Kitchen and bathroom water is recycled and used to water the gardens
THE ABORIGINES… Life expectancy of 52 instead of 78 for white Australians
Worst drug and alcohol abuse
Homelessness = a problem
Traditional lifestyle disappearing
FOOD:
FRUIT = Bush tomatoes, desrt limes, native peaches, bush bananas.
SEEDS: Wattle seeds, sandalwood nuts

Mrs E Barnard 2014
GRUBS: witchetty grubs
MEAT: Wild animals e.g. crocodile, kangaroo
BELIEFS AND LIFESTYLE – The land is sacred and to be protected.
Hunting and gathering
Create conditions for grubs
Dam rivers to catch fish
Use fire to drive animals out so they can be hunted
Craft based on hunting (boomerangs) or music (digeridoos)
Customs and stories never written down
THREATS TO ABORIGINAL CULTURE
Ayers rock is a sacred site for the Aborigines. It is also the most visited spot in Australia.
NAMED EXAMPLE: Uluru
World Heritage Site
Aboriginal paintings etc
The number of visitors increases rapidly. 60% are from overseas.
What problems do tourists bring?
Aboriginal culture exploited for entertainment
People come for the experience – climb the rock etc rather than to learn about the Aborigines.
Aborigines have no part in management of the tourist resort
Tour guides ignore ‘awkward’ aboriginal history e.g. children taken forcibly from their parents
until the ‘70s.
a new Aboriginal culture centre educates people about aboriginal peoples
charges an admission fee which then goes to the community
creates jobs
tourists do not climb Ayers rock (as it is sacred)
The threat of Climate Change…
Global temperatures are rising. If outback temperatures rise it would make it very difficult to live in.
more frequent droughts
more evaporation
more bushfires
It is estimated that rainfall will fall in Southern Australia, especially the southwest. The southern
desert boundary will move 100-200km.
Most of central Australia has less than 25 ‘rain days’ a year.
The threat of El Nino (the reversal of normal air currents across Australia which brings
drought to Australia every 5-7 years)
Every 5-7 years instead of winds bringing rain from the Pacific, El Nino reverses everything. The
winds blow WE and by the time the winds reach the east = dry = drought. Most severe droughts
are linked to El Nino.
The impacts of 2006/7 drought (short term):

Mrs E Barnard 2014
Severe water shortages Queensland
More dust storms and bush fires for New South Wales
Farmers New South Wales lose 80% income
Melbourne and Sydney = water restrictions
Crops failed in Western Australia
The impacts of climate change (long term): Farms abandoned and rural communities destroyed
Landscape change – native plants e.g. eucalyptus die
Rainfall decresed20-40% by 2070
In 2002 drought reduces exports $1 billion (Australian dollars)
14% bird species and 25% mammals could be extinct by 2100.
How LOCAL ACTIONS can help protect people against climate change
NAMED EXAMPLE: the sahel
One of the poorest regions of the world
50 years of rapid population growth, deforestation, overgrazing and drought barren land.
Soil is poor and water scarce
Trees usually protect the soil from wind. They are disappearing as they are cut for fuelwood.
Grassland is under pressure – grazing too many cattle. Farmers have to grow food for more people
so = +intensive squeeze all they can out of the soil.
Rainfall varies greatly year to year = major cause of poverty in the Sahel
If the rains don’t come, the grass dies and exposes the soil to be blown away by the wind.
When the rains do come, heavy rain erodes and washes away the soil.
NAMED EXAMPLE: siguin vousse,
Burkina faso, Africa, sahel
Badly affected by drought
Deforestation and over use of the land unable to grow enough food to feed themselves. No
trees to bind the soil together so when it rained the soil was washed away.
in 1979 Oxfam project prevent further soil erosion, preserve as much rainfall as possible.
farmers encouraged to build diguettes – a line of stones across the land. Slows rainwater and lets
it soak in. trap soil and decrease soil erosion.
The diguettes were a success. Almost everyone in the village had improved
crop yields.
Families now feed themselves
1 bag of groundnuts has become 2 bags
It’s an example of intermediate technology – little know how needed.
Materials found locally. Labour free. Cheap solution.
How GLOBAL ACTION can protect Africa’s dry lands from climate
change Africa is most vulnerable, even though only 4% CO2 is from there.
Many parts are becoming drier. Africa depends on rain for farming.
Food emergencies x3 in 20 years
Climate change could decrease African crop yields by 10%
In Africa 70% population are farmers

Mrs E Barnard 2014
Farming = 40% GDP
How should Africa deal with this? Global agreements to mitigate (decrease) climate change by decreasing emissions of CO2.
Charities e.g. Oxfam help Africa to adapt to climate change.
Adapting to drought…
Charities and Non Governmental Organisations (NGO’s) are working with communities in Africa.
NAMED EXAMPLE: Oxfam working in
zambia- the evangelical
fellowship of zambia (efz)
To help people adapt to drought
Trains them to use conservation farming traps moisture, improves soil quality, minimises soil
erosion and resists drought.
Crop yields increase x10
Multi-cropping plant several species instead of just one. – only requires moderate but constant
farm work. Suits HIV+ as otherwise too weak.
Conservation farming… Plough only where you plant instead of all of the land less soil erosion and moisture only
evaporates from the parts that have been dug.
Spread the planting over a year instead of all at once.
Several crops mixed together. All land used – none wasted between rows of crops. If one crop
fails there are others so no one starves.
Work spread over the year
Prices remain stable
The Kyoto Summit In 1997 to cut greenhouse gases by 5.2% by 2012
141 countries signed up. 181 by 2008.
GROUP 1 = signed and meeting targets e.g. UK, France
GROUP 2 = siged but not meeting – Canada, Denmark
GROUP 3 = Signed but not set targets – China, India and other LEDC’s. MEDC’s produce most emissions
and LEDC’s ought to be given time to develop targets.
GROUP 4 = didn’t sign e.g. USA (the world’s biggest polluter) and Australia (later signed when they had a
change of Prime Minister)

Mrs E Barnard 2014
Polar Climates.
What are the Physical characteristics of a polar climate?
How have fauna and flora adapted to life in the arctic?
http://www.bbc.co.uk/learningzone/clips/plant-adaptations-extreme-cold/5506.html
Can you name and
locate countries
with a polar climate?
Northern Canada
Alaska
Greenland
Siberia (Northern
Russia)
Temperature –
warmest and colder
temperature?
Temperature
range?
How long are
temperatures above
6oC (below this
plants cannot grow).
How do animals adapt to life in the Arctic?
The Caribou adapts by having ….
2 layers of fur which keep heat in
Large hooves do not sink into soggy ground
Snowy owls and snowshoe rabbits adapt by…
Having white feathers/fur to be camouflaged in
snow
Mrs E Barnard 2014
If temperatures increase other species will be much better suited – they will outcompete and
species will die out
How do people adapt to extreme climates?
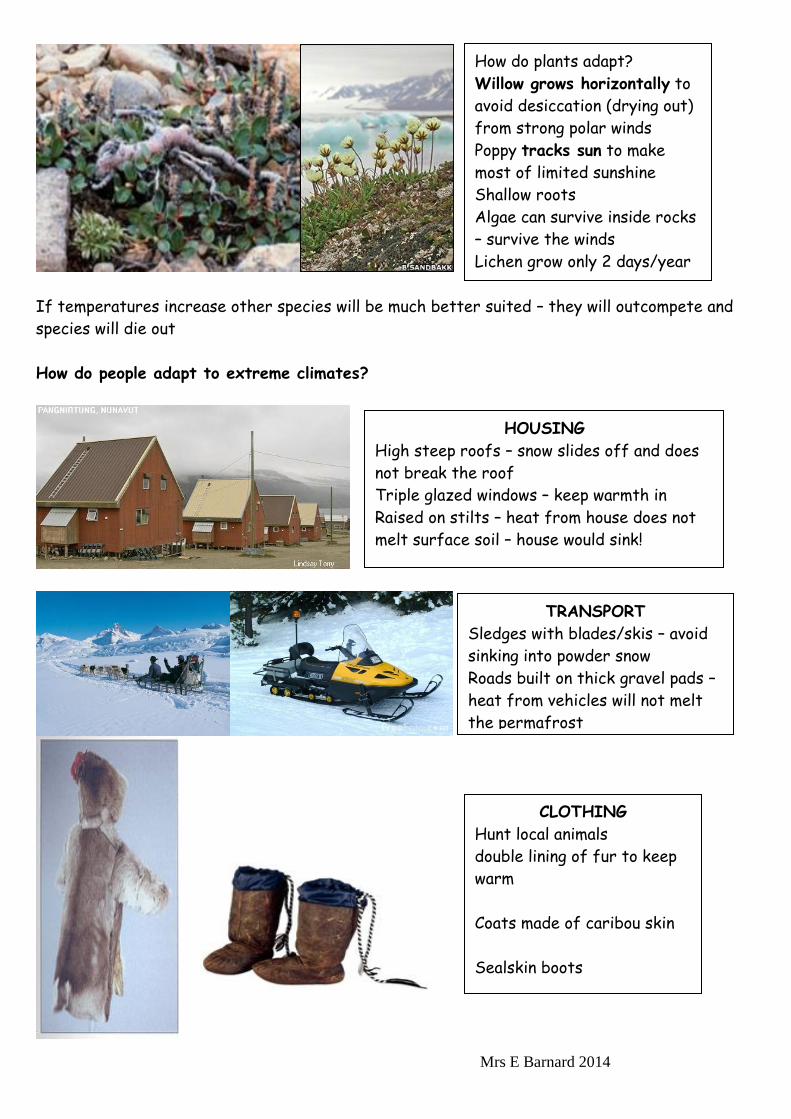
How do plants adapt?
Willow grows horizontally to
avoid desiccation (drying out)
from strong polar winds
Poppy tracks sun to make
most of limited sunshine
Shallow roots
Algae can survive inside rocks
– survive the winds
Lichen grow only 2 days/year
HOUSING
High steep roofs – snow slides off and does
not break the roof
Triple glazed windows – keep warmth in
Raised on stilts – heat from house does not
melt surface soil – house would sink!
TRANSPORT
Sledges with blades/skis – avoid
sinking into powder snow
Roads built on thick gravel pads –
heat from vehicles will not melt
the permafrost
CLOTHING
Hunt local animals
double lining of fur to keep
warm
Coats made of caribou skin
Sealskin boots

Mrs E Barnard 2014
The uniqueness and Value of culture of peoples living in the chosen climate
Threats to people living in the Arctic circle. For example, ALASKA
Impacts in Alaska
Pollution Alaska has suffered badly from extraction of oil in the North
Slope area.
In 1989 Oil Tanker Exxon Valdez ran aground on Alaskan Coast.
5000 sea otters, 1000’s of seals and eagles killed.
In 2006 broken pipeline spilled 200 000 gallons of oil in the North
Slope Region. Oil takes a long time to naturally biodegrade.
Land degradation Million KM2 permafrost damaged
Melting in urban areas such as Fairbanks – houses sinking, ,pipelines
breaking
Global warming causing landslides
Cultural Dilution In the past +20 Native languages spoken in Alaska
Now English adapted as the main language
Native names replaced
1970’s American schooling insisted on speaking in English
Threats caused by climate change
Changes in Ice cover Arctic sea ice is melting.
This threatens decline of polar bears who hunt and mate on the
sea ice. They cannot fatten up and die during the winter
The melting of ice and snow on land which has a high albedo
Iceland’ rotten shark
People in Iceland used to catch shark in
order to eat. Sharks contain poisonous
toxins in the blood which allow it to live
in freezing water. To make the meat
safe, Icelanders buried to meat for
half a year at a time so that the
poisonous fluids drain away and the
meat is safe to eat. The decomposed
meat has a very strong smell of
ammonia
Inupiat whaling ceremony
The Alaskan Inupiat are still allowed to
hunt and kill the bowhead whale. When
the whaling season starts the Inupiat
go out to hunt whales. Any whales
caught are brought back to the village
where the rest of the Community cutup
the whale as an important ceremony
The Inupiat believe this binds the
community together

Mrs E Barnard 2014
(reflects >95% of suns energy), means more heat absorbed by
the land which accelerates rate of melting
Dogs no longer safe to go out on sea ice to hunt fish
Land glacier retreat World’s glaciers shrinking in size – less tourists
Permafrost melting
Permafrost melting triggers flooding and landslides
Pipelines cracking – cost of repairing and damage caused by
leaking oil
Houses sinking into melting ground – buildings now need tohave
4m deep foundations
Species Migration Treeline could move further north, greater species diversity
Sustainable management of Polar regions
Energy – Iceland uses geothermal energy to heat water which can be pressurised to form steam
to drive turbines to generate electricity.
The hot water can be used to heat buildings, and warm greenhouses to grow fresh fruit and
vegetables all year round
Hot springs and Geysers are tourist attractions
Global actions to protect Arctic and Antarctic regions
2008 USA placed polar bears on endangered species list
Series of global protocols to reduce emissions of Greenhouse Gases. These might be too late to
save many arctic regions.
The Antarctic is protected by 1961 Antarctic Treaty. This restricts commercial exploitation
of the regions, tourist boats are limited, and the potential impacts on the environment have to
be thoroughly assessed.
Mrs E Barnard 2014
Restless Earth
1. Using examples, describe some of the hazards of living on a destructive plate margin (4)
Foundation
2. Using an example, outline the impact of a major earthquake on people and property in the
developing world (4) Higher
3. Describe 2 ways in which buildings in developing countries can be made more resistant to
earthquakes (2)
4. Explain how preparation and mitigation could reduce tectonic hazards (4)
5. Explain why some areas are more vulnerable than others (4)
6. Explain the role magma plays in shaping shield volcanoes (2)
7. How do tectonic plates move? (2)
Climate and change
1. Describe two human activities which are increasing the amount of greenhouse gases in the
atmosphere (4) Foundation
2. Describe two challenges the UK might face in the future due to global warming (4) higher
3. Explain one possible good and bad effect of global warming (4)
4. What is the enhanced greenhouse effect? (3)
5. Describe one natural cause of climate change in the past (2)
6. What are megafauna? (2)
Battle for the biosphere
1. Describe some of the goods and services the biosphere provides humans with (4) Foundation
2. Describe two services the biosphere provides and explain why they are important (4) Higher
3. Describe 2 ways the forests are important to human life (4)
4. Explain how one biome is being threatened by human interference (4)
5. Explain the value of one biome you have studied (4)
6. Using examples, explain some ways of conserving threatened species (4)
7. Explain how one biome is being threatened by human interference (2)
Water world
1. Describe how deforestation could affect water-cycle processes (4) Foundation
2. Explain how human activity could change the amount of infiltration (3) Higher
3. Name the two largest water stores on earth (2)
4. Explain why Australia’s water is considered unreliable (4)
5. Describe two ways in which climate change could impact on water supplies (4)
6. Explain why the biosphere and lithosphere are important to the hydrological cycle (4)
7. Using a named example, describe how water schemes in LEDC’s improve quality of life. (4)
8. Describe the causes of river pollution and explain how people dealt with it (5)
River processes and pressures
1. Explain the processes that lead to the formation of a waterfall. You may want to use a diagram (6
marks).
2. Explain how mass movement and weathering affect the shape of river valleys (6 marks).
3. Explain the processes that lead to the formation of an ox-bow lake. You may use a diagram (6 marks).
4. Describe the difference between velocity and discharge (2 marks).
5. Explain how river channel shape and characteristics change along a river profile (6 marks).
6. Describe what is meant by ‘lag time’ on a hydrograph (1 mark).
7. Using examples explain how human activity can increase flood risk (6 marks).
8. Using an example, explain the factors that contributed to a flood event on a named river (8 marks).
9. Using named examples, examine the impacts of flooding on people and the environment (8 marks).
10. Describe what is meant by hard engineering techniques (2 marks).
11. Explain the costs and benefits of using hard engineering to reduce flood risk (6 marks).
12. What is meant by soft engineering solutions (2 marks).

Mrs E Barnard 2014
13. Using examples from named rivers, explain why soft engineering solutions are increasingly used to
manage flooding (8 marks).
Extreme Environments
1. Explain how polar flora and fauna have adapted to the extreme climate (4 marks).
2. Using named examples, explain how people have adapted to life in extreme polar environments (6
marks)
3. Describe the climate of a hot arid area you have studied (4 marks).
4. Using examples from hot and arid areas, explain how flora and fauna have adapted to the extreme
climate (6 marks).
5. Using examples from hot arid areas, explain how people have adapted to extreme environments (6
marks).
6. Using examples from polar and hot arid areas, explain why traditional cultures are unique and valuable
(8 marks).
7. Using examples, examine the threats facing culture and the environment in extreme environments (8
marks).
8. Using named examples, examine how climate change threatens people who live in extreme
environments (8 marks).
9.Using a named example, explain how intermediate technology can help people to adapt to the changing
climate (4 marks).
10. Using named examples, explain why local and global actions against climate change are needed in
extreme environments (8 marks).