Edelweiss Investment Research · Apart from these, other players are Waterbase, BMR Group, Godrej...
40
1 GWM Edelweiss Investment Research Long Term Recommendation: Avanti Feeds Ltd. All set to launch into the next Orbit. Avanti Feeds (Avanti) is a leading manufacturer of high quality shrimps feed and processor & exporter of shrimps. The company’s products are synonymous with quality and consistency, which has helped it establish its credentials among farmers across India. Key growth drivers envisaged to propel the company’s growth are: i) multiple sector tailwinds; ii) robust growth in the shrimp feeds space with increasing area under cultivation; iii) healthy capacity augmentation with aggressive utilization goals; iv) sustenance of leadership in the feeds space with continued steady market share gains; and v) technical & marketing tie up with Thai Union to bolster value-added offerings. Hence, we estimate Avanti to clock PAT CAGR of 26% over FY18-20 with healthy RoCE of 56%. Initiate coverage with ‘BUY’ and target price of INR3,306. Royalty among shrimp feed produces Avanti has been in the shrimp feeds business for more than a decade with 43% market share, which is steadily moving towards 50%. The company has established its credentials among farmers across India by virtue of its products’ quality and consistency. Avanti has capitalized on the boom that came in after the introduction of L. vannamei in 2009 and has grown its feed business 2x every year. The company is running at all most full utilization and has recently added 1,75,000MT capacity, taking its total capacity to 6,00,000MT. Augmenting capacity to become largest shrimp processer in India Since 2009, the company has increased capacity 15x and maintained utilization level above 70% since 2013. Avanti had a processing capacity of 7,000MT and in Q3FY18 it has started a new 15,000MT facility capable of making high value-added partially or completely cooked products. Thus, it now boasts of one of the largest processing capacities in India and is slated to be the largest shrimp exporter in India by FY20. The facitiy has come on stream in Q3FY18 and has already clocked 1.5x (7,749MT) of its 2017 output (5,155MT) with one quarter still to go. We estimate the company to utilise 100% of its capacity within the next two years. Tailwinds galore: Industry set to expand 20% in coming years After Green and White Revolutions in India, it’s time for the Blue Revolution to exploit the huge potential in the fisheries sector. The government too has sharpened focus on development of this lucrative industry, in Budget 2019 allocated a dedicated fund of INR10,000cr to develop fisheries, aquaculture and animal husbandry. Moreover, MPEDA has set an aggressive target of 10,00,000 MT of shrimp output by 2020 from current 6,00,000 MT. And, industry leaders, in conjunction with MPEDA and experts, have developed policies, technology and roadmaps to achieve an export target of USD10bn by FY22. Propelled by these catalysts, we estimate the industry to clock 20% plus growth in coming years. Outlook and valuations: Attractive prospects & limited downside; initiate with ‘BUY’ Key drivers envisaged to spur Avanti are: 1) robust growth in shrimp feeds space with increasing area under cultivation; 2) rising shrimp processing capability with aggressive capacity utilization goals; 3) maintenance of leadership in the feeds space with sustained share gains; and 4) target to become India’s largest shrimp exporter. We initiate coverage on the stock with ‘BUY’ recommendation, valuing it at 20x FY20E P/E and arrive at a target price of INR3,306. Year to March FY16 FY17 FY18E FY19E FY20E Revenues (INR Cr) 2018 2733 3570 4965 6318 Rev growth (%) 13.3 35.4 30.6 39.1 27.3 EBITDA (INR Cr) 230 332 736 933 1202 Net Profit (INR Cr) 155 226 497 625 814 P/E (x) 71.0 51.0 22.9 18.8 14.5 EV/EBITDA (x) 47.0 32.7 14.3 11.0 8.1 RoACE (%) 57.3 52.7 72.9 61.9 56.3 RoAE (%) 45.8 40.3 56.3 44.8 40.5 CMP: INR 2,396 Rating: BUY Target Price: INR 3,306 Upside: 38% Nitin Awasthi Research Analyst [email protected] Praveen Sahay Research Analyst [email protected] Bloomberg: AVNT:IN 52-week range (INR): 2,940.00 / 842.00 Share in issue (cr): 5 M cap (INR cr): 10,881 Avg. Daily Vol. BSE/NSE :(‘000): 216 Promoter Holding (%) 43.78 Date: 24 th April 2018
Transcript of Edelweiss Investment Research · Apart from these, other players are Waterbase, BMR Group, Godrej...

1 GWM
Edelweiss Investment Research
Long Term Recommendation: Avanti Feeds Ltd.
All set to launch into the next Orbit.
Avanti Feeds (Avanti) is a leading manufacturer of high quality shrimps feed and processor &
exporter of shrimps. The company’s products are synonymous with quality and consistency,
which has helped it establish its credentials among farmers across India. Key growth drivers
envisaged to propel the company’s growth are: i) multiple sector tailwinds; ii) robust growth
in the shrimp feeds space with increasing area under cultivation; iii) healthy capacity
augmentation with aggressive utilization goals; iv) sustenance of leadership in the feeds
space with continued steady market share gains; and v) technical & marketing tie up with
Thai Union to bolster value-added offerings. Hence, we estimate Avanti to clock PAT CAGR of
26% over FY18-20 with healthy RoCE of 56%. Initiate coverage with ‘BUY’ and target price of
INR3,306.
Royalty among shrimp feed produces
Avanti has been in the shrimp feeds business for more than a decade with 43% market share,
which is steadily moving towards 50%. The company has established its credentials among
farmers across India by virtue of its products’ quality and consistency. Avanti has capitalized
on the boom that came in after the introduction of L. vannamei in 2009 and has grown its
feed business 2x every year. The company is running at all most full utilization and has recently
added 1,75,000MT capacity, taking its total capacity to 6,00,000MT.
Augmenting capacity to become largest shrimp processer in India
Since 2009, the company has increased capacity 15x and maintained utilization level above
70% since 2013. Avanti had a processing capacity of 7,000MT and in Q3FY18 it has started a
new 15,000MT facility capable of making high value-added partially or completely cooked
products. Thus, it now boasts of one of the largest processing capacities in India and is slated
to be the largest shrimp exporter in India by FY20. The facitiy has come on stream in Q3FY18
and has already clocked 1.5x (7,749MT) of its 2017 output (5,155MT) with one quarter still to
go. We estimate the company to utilise 100% of its capacity within the next two years.
Tailwinds galore: Industry set to expand 20% in coming years
After Green and White Revolutions in India, it’s time for the Blue Revolution to exploit the huge
potential in the fisheries sector. The government too has sharpened focus on development of
this lucrative industry, in Budget 2019 allocated a dedicated fund of INR10,000cr to develop
fisheries, aquaculture and animal husbandry. Moreover, MPEDA has set an aggressive target
of 10,00,000 MT of shrimp output by 2020 from current 6,00,000 MT. And, industry leaders, in
conjunction with MPEDA and experts, have developed policies, technology and roadmaps
to achieve an export target of USD10bn by FY22. Propelled by these catalysts, we estimate
the industry to clock 20% plus growth in coming years.
Outlook and valuations: Attractive prospects & limited downside; initiate with ‘BUY’
Key drivers envisaged to spur Avanti are: 1) robust growth in shrimp feeds space with
increasing area under cultivation; 2) rising shrimp processing capability with aggressive
capacity utilization goals; 3) maintenance of leadership in the feeds space with sustained
share gains; and 4) target to become India’s largest shrimp exporter. We initiate coverage on
the stock with ‘BUY’ recommendation, valuing it at 20x FY20E P/E and arrive at a target price
of INR3,306.
Year to March FY16 FY17 FY18E FY19E FY20E
Revenues (INR Cr) 2018 2733 3570 4965 6318
Rev growth (%) 13.3 35.4 30.6 39.1 27.3
EBITDA (INR Cr) 230 332 736 933 1202
Net Profit (INR Cr) 155 226 497 625 814
P/E (x) 71.0 51.0 22.9 18.8 14.5
EV/EBITDA (x) 47.0 32.7 14.3 11.0 8.1
RoACE (%) 57.3 52.7 72.9 61.9 56.3
RoAE (%) 45.8 40.3 56.3 44.8 40.5
CMP: INR 2,396
Rating: BUY
Target Price: INR 3,306
Upside: 38%
Nitin Awasthi
Research Analyst
Praveen Sahay
Research Analyst
Bloomberg: AVNT:IN
52-week
range (INR): 2,940.00 / 842.00
Share in issue
(cr): 5
M cap (INR cr): 10,881
Avg. Daily Vol.
BSE/NSE :(‘000): 216
Promoter
Holding (%) 43.78
Date: 24th April 2018

Avanti Feeds Ltd.
2 GWM
Avanti Feeds is the undisputed leader in the shrimp industry with 43% market share and has one of the largest shrimp processingcapacities in the country. The company is expected to grow much faster than the industry. Government focus on the sector will onlypropel its growth going forward
Market leadership in
shrimp feeds
Created one of the largest
shrimp processing facility in
the country
Strong Marco and Micro
Tailwinds.
FY16 FY17 FY18E FY19E FY20E
Revenue 2,018 2,733 3,570 4,965 6,318
EBITDA 230 332 736 933 1,202
EBITDA margins 11.4 12.1 20.6 18.8 19.0
PAT 153 213 474 578 750
At CMP, FY20E P/E is
14.5X
At Target Price,
FY20E P/E is 20x
Upside of 38%
FY16 FY17 FY18E FY19E FY20E
ROAE (%) 45.8 40.3 56.3 44.8 40.5
ROACE (%) 57.3 52.7 72.9 61.9 56.3
P/E Multiple FY20E EPSCMP / Target
14.5x (CMP) 165 2,396
20x (Target) 165 3,306
Avanti Feeds Ltd.
3 GWM
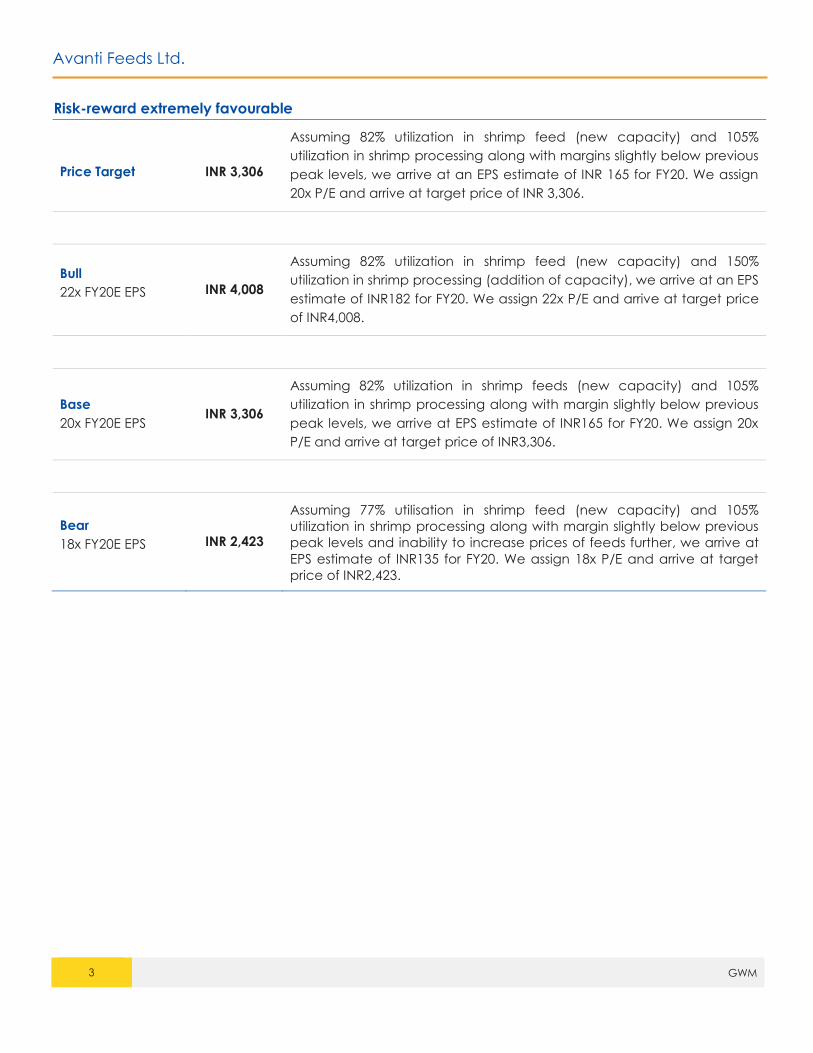
Risk-reward extremely favourable
Price Target INR 3,306
Assuming 82% utilization in shrimp feed (new capacity) and 105%
utilization in shrimp processing along with margins slightly below previous
peak levels, we arrive at an EPS estimate of INR 165 for FY20. We assign
20x P/E and arrive at target price of INR 3,306.
Bull
22x FY20E EPS INR 4,008
Assuming 82% utilization in shrimp feed (new capacity) and 150%
utilization in shrimp processing (addition of capacity), we arrive at an EPS
estimate of INR182 for FY20. We assign 22x P/E and arrive at target price
of INR4,008.
Base
20x FY20E EPS INR 3,306
Assuming 82% utilization in shrimp feeds (new capacity) and 105%
utilization in shrimp processing along with margin slightly below previous
peak levels, we arrive at EPS estimate of INR165 for FY20. We assign 20x
P/E and arrive at target price of INR3,306.
Bear
18x FY20E EPS INR 2,423
Assuming 77% utilisation in shrimp feed (new capacity) and 105%
utilization in shrimp processing along with margin slightly below previous
peak levels and inability to increase prices of feeds further, we arrive at
EPS estimate of INR135 for FY20. We assign 18x P/E and arrive at target
price of INR2,423.
Avanti Feeds Ltd.
4 GWM
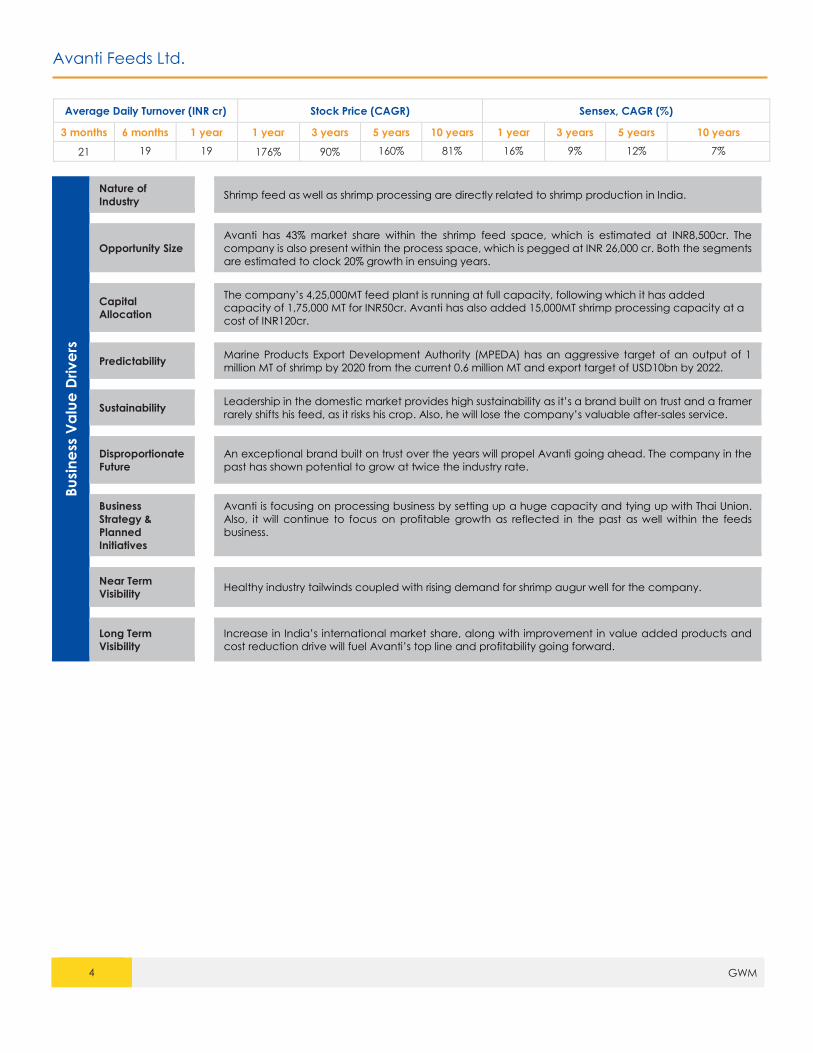
Average Daily Turnover (INR cr) Stock Price (CAGR) Sensex, CAGR (%)
3 months 6 months 1 year 1 year 3 years 5 years 10 years 1 year 3 years 5 years 10 years
21 19 19 176% 90% 160% 81% 16% 9% 12% 7%
Bu
sin
ess
Va
lue
Driv
ers
Nature of
Industry Shrimp feed as well as shrimp processing are directly related to shrimp production in India.
Opportunity Size Avanti has 43% market share within the shrimp feed space, which is estimated at INR8,500cr. The
company is also present within the process space, which is pegged at INR 26,000 cr. Both the segments
are estimated to clock 20% growth in ensuing years.
Capital
Allocation
The company’s 4,25,000MT feed plant is running at full capacity, following which it has added
capacity of 1,75,000 MT for INR50cr. Avanti has also added 15,000MT shrimp processing capacity at a
cost of INR120cr.
Predictability Marine Products Export Development Authority (MPEDA) has an aggressive target of an output of 1
million MT of shrimp by 2020 from the current 0.6 million MT and export target of USD10bn by 2022.
Sustainability Leadership in the domestic market provides high sustainability as it’s a brand built on trust and a framer
rarely shifts his feed, as it risks his crop. Also, he will lose the company’s valuable after-sales service.
Disproportionate
Future An exceptional brand built on trust over the years will propel Avanti going ahead. The company in the
past has shown potential to grow at twice the industry rate.
Business
Strategy &
Planned
Initiatives
Avanti is focusing on processing business by setting up a huge capacity and tying up with Thai Union.
Also, it will continue to focus on profitable growth as reflected in the past as well within the feeds
business.
Near Term
Visibility Healthy industry tailwinds coupled with rising demand for shrimp augur well for the company.
Long Term
Visibility Increase in India’s international market share, along with improvement in value added products and
cost reduction drive will fuel Avanti’s top line and profitability going forward.

Avanti Feeds Ltd.
5 GWM
Focus Charts – Story in a nutshell
Highest ROCE in the industry Largest market share within the feeds business
Largest capacity within feeds One of the Largest capacity with Processing
Growth of 25% CAGR within shrimp feeds Growth of 91% CAGR within shrimp processing
Source: Company, Edelweiss Investment Research
20%23%
35%
25%
50%
0%
10%
20%
30%
40%
50%
60%
Farming Processing Value
Addition
Feeds Avanti
ROCE of various segments
43%
67%
Marketshare
Avanti Feeds Rest
600
300
140 125 110 90 70
Av
an
ti F
ee
ds
Gro
we
ll Fe
ed
s
BM
R G
rou
p
De
vi Se
afo
od
s
Wa
terb
ase
Ca
rgill
Go
dre
j A
gro
ve
t
Feed Capacity of Various Players ‘000 MT
19 20
15
28
17
4
8
23D
ev
i Se
afo
od
s
BM
R g
rou
p
Ap
ex F
roze
n F
oo
ds
Ne
kka
nti S
ea
foo
ds
Sa
nd
hya
Ma
rin
es
Wa
terb
ase
IFB
Ag
ro
Av
an
ti f
ee
ds
Shrimp Processing Capacity ‘000 MT
2346
2880
3626
4614
FY17 FY18E FY19E FY20E
Shrimp Feeds
246
689
1337
1702
FY17 FY18E FY19E FY20E
Shrimps Processing

Avanti Feeds Ltd.
6 GWM
1) Royalty among shrimp feed producers
Avanti is a dominant player in the shrimp feed business with 43% marketshare. The company has
been able to sell its products on cash in an industry that works on 3 months’ credit. It is running at
all most full utilization and has recently added 1,75,000MT capacity, taking its total capacity to
6,00,000MT. The shrimp feed industry is highly organized with organized players accounting for 80%
as it caters to the export market. There has been higher usage of shrimp feed given that a large
part of the shrimp export market is catered to by aquaculture farms.
Shrimp feed is the most organised feed segment with high level of consolidation.
Source: Company, Edelweiss Investment Research.
a) Shrimp feed is the most lucrative business in the entire shrimp chain, barring value-added
products.
Source: Company, Edelweiss Investment Research.
Avanti has commendably doubled its RoCE to above 50% (5 years Average) by running at full
utilization in an industry which sturggles to clock even 50% utilization.
Organised,
80%
Unorganise…
Shrimp Feed Industry
Avanti
Feeds,
43%
Rest, 67%
Marketshare
20%23%
35%
25%
50%
Farming Processing Value Addition Feeds Avanti
ROCE of various segments

Avanti Feeds Ltd.
7 GWM
b) Largest player
The industry is dominated by two giants—Avanti and CP Aqua Feeds, a Thailand-based company.
Apart from these, other players are Waterbase, BMR Group, Godrej Agrovet, Cargill, Growell
Feeds and Devi Seafoods. The total shrimp feed industry was pegged at ~1.2MMT in FY17 with
capacity at about 2.2 MMT.
Source: Company, Edelweiss Investment Research.
c) Lowest FCR
Quality and consistency are key to success of feed manufacture. The base of judging a feed is its
Feed Conversation Ratio (FCR), normal feed has an FCR lower than 1.5x. FCR means how much
of the feed leads to a gram increase in the weight of shrimp; FCR is of prime importance for judging
feed quality; more effective feeds will have a lower FCR. While normal feed has an FCR of less
than 1.5x, Avanti’s is the lowest at 1.2x.
Source: Company, Edelweiss Investment Research.
d) Trusted product
A farmer needs to trust the feed company as wrong or inconsistent feed could lead to death of
shrimp and loss of the entire crop & investment made by the farmer. Once a farmer trusts a feed,
he does not normally shift to another alternative.
Avanti has gained farmers’ trust by engaging with them over time and assisting them in their
farming. The company has set up 12 labs across India, where famers can check their soil and
water samples. It has also set up a special team, Technical Assistance After Sales Service (TASS),
which comprises fisheries graduates. TASS teams visit farmers frequently and extend them
technical assistance; the team’s ultimate objective is best results for farmers. Currently, Avanti has
identified another loophole, which is bad quality seeds. To counter this problem, the company is
setting up a hatchery to provide good quality seeds to farmers.
The company’s products are perceived as premium because of which it has been able to do
cash business in a segment that traditionally works on 3 months’ credit.
600
300
140 125 110 90 70
Avanti Feeds Growell Feeds BMR Group Devi Seafoods Waterbase Cargill Godrej Agrovet
Feed Capacity of Various Players ‘000 MT
1.5
1.2
Normal Feeds
Avanti Feeds
Lowest FCR in the Industry.

Avanti Feeds Ltd.
8 GWM
Source: Company, Edelweiss Investment Research.
e) Growing 2x industry
Avanti was able to capitalize on the boom that came in after the introduction of L. vannamei in
2009. The company has grown its feed business 2x every year since introduction of L. vannamei,
except for 2016 when it grew at 15%, in line with the industry, in spite of disease breaking out within
parts of its territory and also shortage of water because of insufficient rainfall.
Source: Company, Edelweiss Investment Research.
f) Adding capacity with improving utilization
Since 2009, the company has increased capacity 15x and maintained utilization level above 70%
since 2013. Avanti’s current utilization stands at 100%. Its shrimp feed production plants are located
at Kovvur, Vemuluru & Bandapuram in West Godavari district of Andhra Pradesh and at Valsad,
Balda village in Gujarat.
Source: Company, Edelweiss Investment Research.
0
20
40
60
80
100
120
FY13 FY14 FY15 FY16 FY17
Debtor Days
Waterbase Avanti
0%
50%
100%
150%
200%
2010 2011 2012 2013 2014 2015 2016 2017
Growth in Shrimp Production vs Feed Sales Growth
Shrimp Production Avanti Feed Sales
insufficient
rainfall and
diseases
breakout
0%
20%
40%
60%
80%
100%
120%
0
50000
100000
150000
200000
250000
300000
350000
400000
450000
FY09 FY10 FY11 FY12 FY13 FY14 FY15 FY16 FY17 9MFY18
Capacity (MT) vs Utlization (%)
Capacity Sales Utilization

Avanti Feeds Ltd.
9 GWM
g) Estimated sales
We estimate 25% CAGR in feed sales in coming years with sales touching INR4,614cr in 2020.
Source: Edelweiss Investment Research.
2346
2880
3626
4614
FY17 FY18E FY19E FY20E
Estimated Sales Growth (INR cr)
Avanti Feeds Ltd.
10 GWM
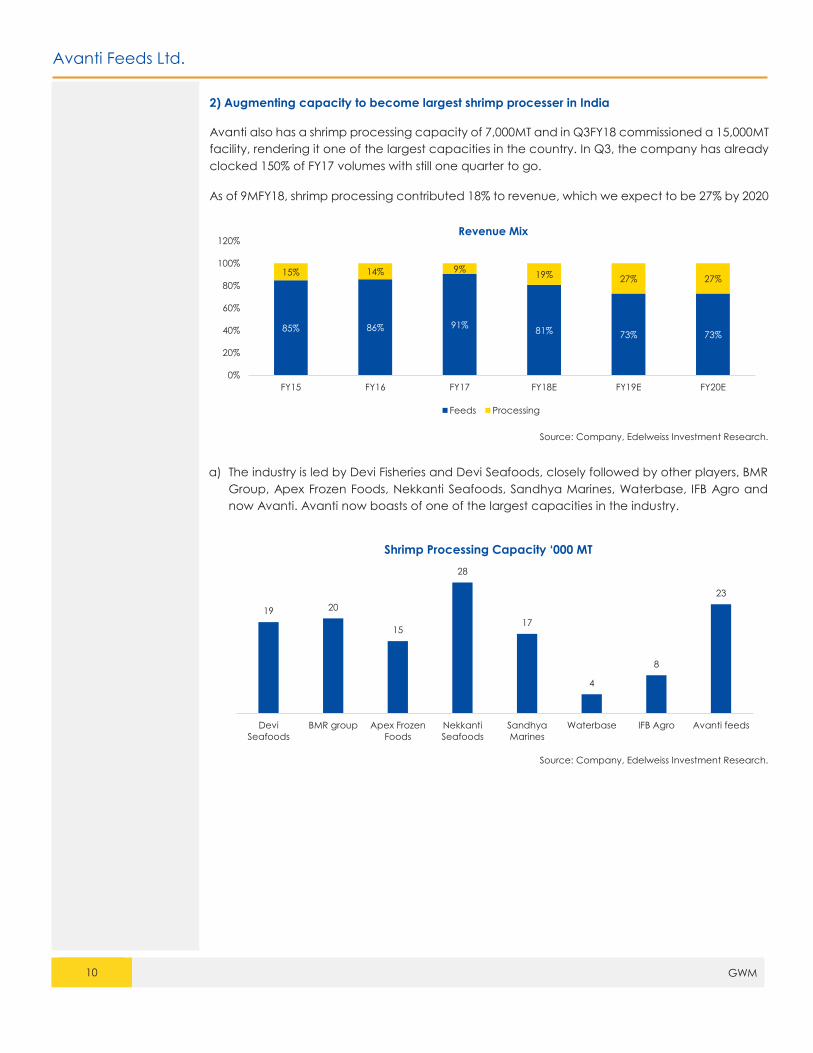
2) Augmenting capacity to become largest shrimp processer in India
Avanti also has a shrimp processing capacity of 7,000MT and in Q3FY18 commissioned a 15,000MT
facility, rendering it one of the largest capacities in the country. In Q3, the company has already
clocked 150% of FY17 volumes with still one quarter to go.
As of 9MFY18, shrimp processing contributed 18% to revenue, which we expect to be 27% by 2020
Source: Company, Edelweiss Investment Research.
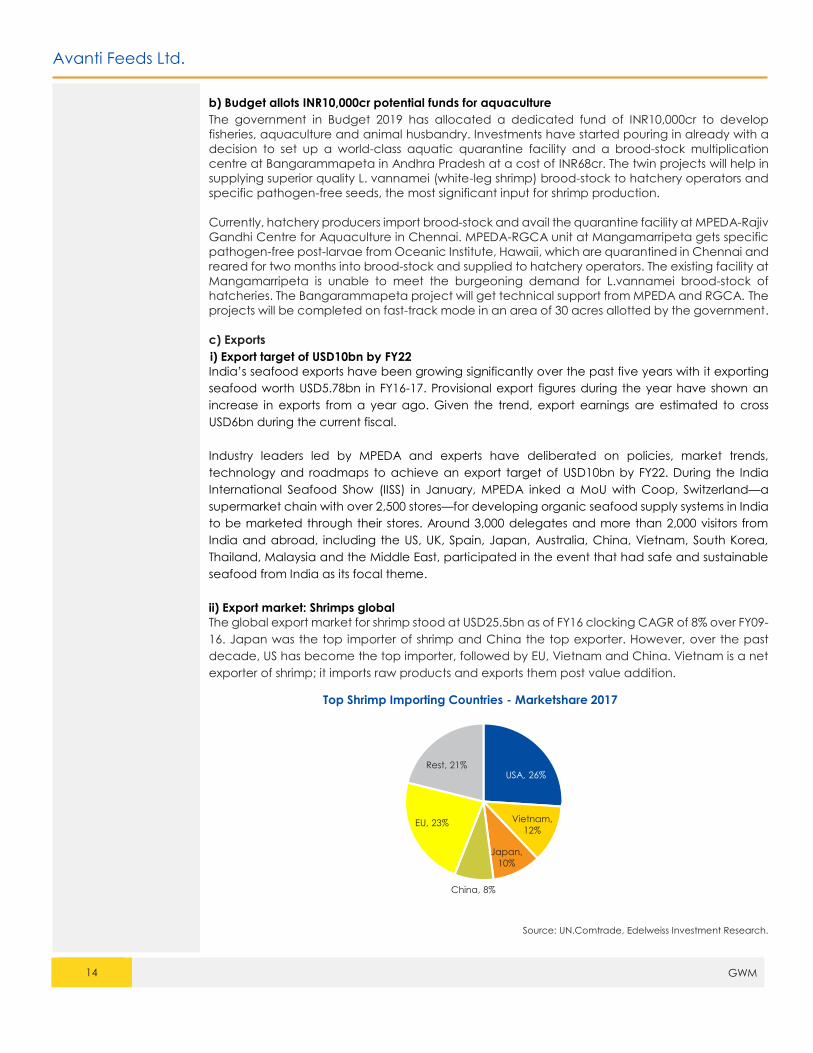
a) The industry is led by Devi Fisheries and Devi Seafoods, closely followed by other players, BMR
Group, Apex Frozen Foods, Nekkanti Seafoods, Sandhya Marines, Waterbase, IFB Agro and
now Avanti. Avanti now boasts of one of the largest capacities in the industry.
Source: Company, Edelweiss Investment Research.
85% 86% 91%81% 73% 73%
15% 14% 9%19% 27% 27%
0%
20%
40%
60%
80%
100%
120%
FY15 FY16 FY17 FY18E FY19E FY20E
Revenue Mix
Feeds Processing
19 20
15
28
17
4
8
23
Devi
Seafoods
BMR group Apex Frozen
Foods
Nekkanti
Seafoods
Sandhya
Marines
Waterbase IFB Agro Avanti feeds
Shrimp Processing Capacity ‘000 MT

Avanti Feeds Ltd.
11 GWM
b) Avanti has been in the shrimp processing business for more than a decade and has been
growing steadily. We expect the company’s output to rise significantly riding aggerisve
investments.
Source: Company, Edelweiss Investment Research.
c) Pact with Thai Union: Match made in heaven
Avanti has demergered its processing business into a subsidary Avanti Frozen Foods (AFFPL) in
order to improve business efficacy and establish global brand equity of its shrimp processing
business. Thai Union has taken 40% stake in the company. Thai Union is the largest seafood
company in the world, which operates across the globe and has created dozens of successful
brands. It has the requisite technical expertise to manufacture high value-added products and
the tie up with Avanti gives the latter access to Thai Union’s expertise.
Source: Company, Edelweiss Investment Research.
0
5000
10000
15000
20000
25000
FY09 FY10 FY11 FY12 FY13 FY14 FY15 FY16 FY17 FY18E FY19E FY20E
Shrimps processed (MT)
Thai Union Plc ,
40%Avanti Feeds,
60%
Avanti Frozen Foods Private Limited

Avanti Feeds Ltd.
12 GWM
d) Investment in the future
Avanti has invested INR120cr in a separate facility of 15,000 MT which is capable of making high
value-added partially or completely cooked products.
Source: Company, Edelweiss Investment Research.

Avanti Feeds Ltd.
13 GWM
e) Stepping on the growth pedal in processing business
The facitiy has come on stream in Q3FY18 and has started contributing immediately to the topline.
Avanti’s aggrestion is reflected in its production numbers, it has already clocked 1.5x (7,749MT) of
its 2017 output (5,155MT) with one quarter still to go. We estimate the company to utilise 100% of
its capacity within the next two years.
Aggersion in utilization
Source: Company, Edelweiss Investment Research.
f) Estimated sales
We estimate shrimp processing sales to clock 91% CAGR to grow to INR1,702cr in FY20.
Source: Company, Edelweiss Investment Research.
3) Tailwinds galore: Industry set to expand 20% in coming years
a) Shrimp production target of 1 million MT by 2020
In 2003, pilot research and small scale production of L. vannamei, a.k.a Pacific White Leg Shrimp,
was initiated. After six years of research, large scale production of L vannamei was permitted in
2009 and since then it has skyrocketed and clocked 190% CAGR to 0.4 million tonne in FY15 . Total
current production is pegged at 0.6 million. MPEDA is targeting 30% CAGR over the next 2 years,
taking the total production to 1 million tons by 2020.
0%
20%
40%
60%
80%
100%
120%
0
1000
2000
3000
4000
5000
6000
7000
8000
9000
FY15 FY16 FY17 9MFY18
MT
Shrimps processed Capacity Utilization
246
689
1337
1702
0
500
1000
1500
2000
FY17 FY18E FY19E FY20E
Shrimps Processing (INR cr)
1.5x production achieved with one Qtr still to
go. Currently at 100% utilization levels.
Avanti Feeds Ltd.
14 GWM
b) Budget allots INR10,000cr potential funds for aquaculture
The government in Budget 2019 has allocated a dedicated fund of INR10,000cr to develop
fisheries, aquaculture and animal husbandry. Investments have started pouring in already with a
decision to set up a world-class aquatic quarantine facility and a brood-stock multiplication
centre at Bangarammapeta in Andhra Pradesh at a cost of INR68cr. The twin projects will help in
supplying superior quality L. vannamei (white-leg shrimp) brood-stock to hatchery operators and
specific pathogen-free seeds, the most significant input for shrimp production.
Currently, hatchery producers import brood-stock and avail the quarantine facility at MPEDA-Rajiv
Gandhi Centre for Aquaculture in Chennai. MPEDA-RGCA unit at Mangamarripeta gets specific
pathogen-free post-larvae from Oceanic Institute, Hawaii, which are quarantined in Chennai and
reared for two months into brood-stock and supplied to hatchery operators. The existing facility at
Mangamarripeta is unable to meet the burgeoning demand for L.vannamei brood-stock of
hatcheries. The Bangarammapeta project will get technical support from MPEDA and RGCA. The
projects will be completed on fast-track mode in an area of 30 acres allotted by the government.
c) Exports
i) Export target of USD10bn by FY22
India’s seafood exports have been growing significantly over the past five years with it exporting
seafood worth USD5.78bn in FY16-17. Provisional export figures during the year have shown an
increase in exports from a year ago. Given the trend, export earnings are estimated to cross
USD6bn during the current fiscal.
Industry leaders led by MPEDA and experts have deliberated on policies, market trends,
technology and roadmaps to achieve an export target of USD10bn by FY22. During the India
International Seafood Show (IISS) in January, MPEDA inked a MoU with Coop, Switzerland—a
supermarket chain with over 2,500 stores—for developing organic seafood supply systems in India
to be marketed through their stores. Around 3,000 delegates and more than 2,000 visitors from
India and abroad, including the US, UK, Spain, Japan, Australia, China, Vietnam, South Korea,
Thailand, Malaysia and the Middle East, participated in the event that had safe and sustainable
seafood from India as its focal theme.
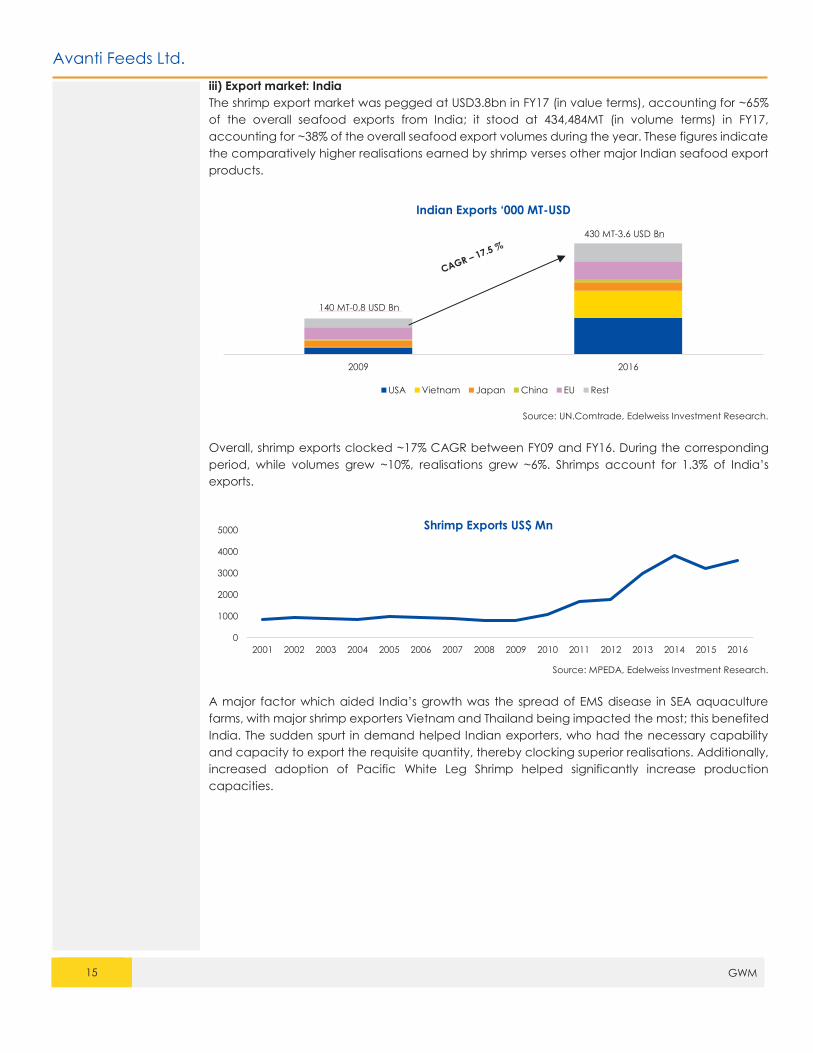
ii) Export market: Shrimps global
The global export market for shrimp stood at USD25.5bn as of FY16 clocking CAGR of 8% over FY09-
16. Japan was the top importer of shrimp and China the top exporter. However, over the past
decade, US has become the top importer, followed by EU, Vietnam and China. Vietnam is a net
exporter of shrimp; it imports raw products and exports them post value addition.
Source: UN.Comtrade, Edelweiss Investment Research.
USA, 26%
Vietnam,
12%
Japan,
10%
China, 8%
EU, 23%
Rest, 21%
Top Shrimp Importing Countries - Marketshare 2017
Avanti Feeds Ltd.
15 GWM
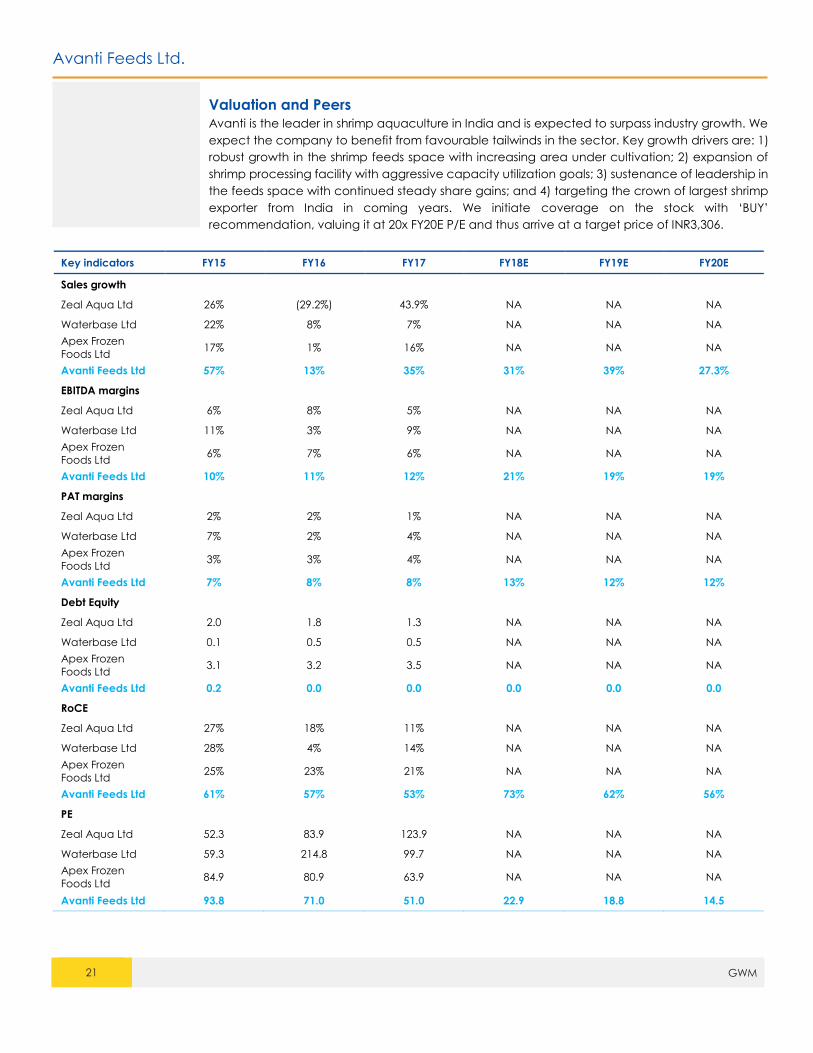
iii) Export market: India
The shrimp export market was pegged at USD3.8bn in FY17 (in value terms), accounting for ~65%
of the overall seafood exports from India; it stood at 434,484MT (in volume terms) in FY17,
accounting for ~38% of the overall seafood export volumes during the year. These figures indicate
the comparatively higher realisations earned by shrimp verses other major Indian seafood export
products.
Source: UN.Comtrade, Edelweiss Investment Research.
Overall, shrimp exports clocked ~17% CAGR between FY09 and FY16. During the corresponding
period, while volumes grew ~10%, realisations grew ~6%. Shrimps account for 1.3% of India’s
exports.
Source: MPEDA, Edelweiss Investment Research.
A major factor which aided India’s growth was the spread of EMS disease in SEA aquaculture
farms, with major shrimp exporters Vietnam and Thailand being impacted the most; this benefited
India. The sudden spurt in demand helped Indian exporters, who had the necessary capability
and capacity to export the requisite quantity, thereby clocking superior realisations. Additionally,
increased adoption of Pacific White Leg Shrimp helped significantly increase production
capacities.
2009 2016
Indian Exports ‘000 MT-USD
USA Vietnam Japan China EU Rest
140 MT-0.8 USD Bn
430 MT-3.6 USD Bn
0
1000
2000
3000
4000
5000
2001 2002 2003 2004 2005 2006 2007 2008 2009 2010 2011 2012 2013 2014 2015 2016
Shrimp Exports US$ Mn

Avanti Feeds Ltd.
16 GWM
iv) Export market: US
Shrimp is the most-consumed seafood in the US. According to the National Fisheries Institute, the
average American ate 4.2 pounds of shrimp, up from 2.2 pounds in 1990.
Source: FAO, Edelweiss Investment Research.
India’s share in US shrimps has jumped to 32% from 4% in the past decade, making it the largest
shrimp supplier to the US. 2018 is off to a roaring start with the National Marine Fisheries Services’
January 2018 data showing 21% spurt in volume and 22% increase in value compared to the first
month of 2017. As much as 61,593 metric tons worth USD592.8mn was imported by US in January
2018. India led US’ shrimp sources in January, sending 20,145t worth USD201.0mn, a whopping 49%
increase in volume and 53% boost in value, according to NMFS. This implies that India accounted
for a third of the entire market during the month.
In spite of the mammoth rise of exports to the US, India’s dependence on US has not increased
substantially.
Source: UN.Comtrade, Edelweiss Investment Research.
4% 3% 4%5%
8%
12%
18% 19%
23%25%
32%
0%
5%
10%
15%
20%
25%
30%
35%
0
50
100
150
200
250
2007 2008 2009 2010 2011 2012 2013 2014 2015 2016 2017
US Shrimp Import from India (000' MT)
Volume ('000 Tn.) as % of Total
22%29%
34%30%
33% 33% 31% 31%
2009 2010 2011 2012 2013 2014 2015 2016
US exports as a % of Total Indian Aquaculture Exports

Avanti Feeds Ltd.
17 GWM
v) Export Market- Japan
Japan is the second - largest fish and seafood importer in the world and the top market in Asia. In
the early days of shrimp exports, India was heavily dependent on Japan for its exports. Vietnam is
the largest supplier of shrimp to Japan. Although Japan has fallen in the ranks of top importers of
shrimp, India’s export to the country have been steady and Japan’s dependence on India has
risen to almost a third of there demand.
Source: UN.Comtrade, Edelweiss Investment Research.
While earlier India was dependent on Japan for more than half of its exports, currently the
dependence is down to less than one tenth of the country’s exports.
Source: UN.Comtrade, Edelweiss Investment Research.
16%18% 17%
20%
23%25%
26% 27%
0%
5%
10%
15%
20%
25%
30%
0.0
5.0
10.0
15.0
20.0
25.0
30.0
35.0
40.0
2010 2011 2012 2013 2014 2015 2016 2017*
Japan Shrimp Import from India ('000 MT)
Volume ('000 M.T) as % of Total Japan imports
21%
23%
19%
14%
11%9% 10%
9%
2009 2010 2011 2012 2013 2014 2015 2016
Japan exports as a % of Total Indian Aquaculture Exports

Avanti Feeds Ltd.
18 GWM
vi) Export market: EU
EU is the second-largest shrimp importer in the world. It was the largest market for sometime, before
being overtaken by US. India was dependent on EU for its exports, but that is not the case
anymore. Vietnam is the largest supplier of shrimp to EU by making full use of the Vietnam-EU Free
Trade Agreement. Although India is not the top exporter to EU, it has been able to steadily increase
volumes as well as share in the market.
Source: UN.Comtrade, Edelweiss Investment Research.
While earlier India was dependent on EU for one third of its trade, currently the dependence is
down to less than half of that.
Source: UN.Comtrade, Edelweiss Investment Research.
10% 10%12%
15% 16% 15%
0%
5%
10%
15%
20%
0
20
40
60
80
100
2010 2011 2012 2014 2015 2016
EU Shrimp Import from India ('000 MT)
Volume ('000 M.T) as % of Total EU imports
33%
25%23% 23%
18% 19% 18%
15%
2009 2010 2011 2012 2013 2014 2015 2016
UK, Netherlands, Belgium, France, Italy, Spain, Portugal and Germany
exports as a % of Total Indian Aquaculture Exports

Avanti Feeds Ltd.
19 GWM
vii) Export market: Vietnam
Vietnam is not as gifted as India with the requirements of shrimp farming, but it is very gifted with
bilateral trade agreements. Although Vietnam is India’s biggest competitor, it is completely
dependent on India for supply of shrimp, about three fourth requirement is met by India. Though
Vietnam was ahead on the learning curve and had mastered value-added products, India is
catching up fast.
Source: UN.Comtrade, Edelweiss Investment Research.
Although India is not the top exporter to EU and Japan, it is the top exporter to its top exporter.
Source: UN.Comtrade, Edelweiss Investment Research.
8%3% 6% 9%
66%74%
0%
20%
40%
60%
80%
0
10
20
30
40
2007 2008 2009 2010 2013 2015
Vietnam Shrimp Import from India ('000 MT)
Volume ('000 Tn.) as % of Total Vietnam imports
1% 1%
6% 6%
14%15% 16%
21%
2009 2010 2011 2012 2013 2014 2015 2016
Vietnam exports as a % of Total Indian Aquaculture Exports

Avanti Feeds Ltd.
20 GWM
vii) Export market: China – Reshaping global shrimp trade
China was once a large exporter of shrimps and has now become a net importer and is set to
take the centre stage in global shrimp trade.
Source: UN.Comtrade, Edelweiss Investment Research.
China has overtaken Japan as the world’s leading seafood consumer, according to a National
Geographic Study. Chinese middle class is a small percentage of ~32% on an average, but the
number is very large at about 400mn due to the sheer size of the overall Chinese population. In
rural areas too, shrimp has become a common site; as farmers are becoming wealthier, shrimp is
now being consumed regularly even in the countryside. There has been a change in eating habits
too, Chinese traditionally bought only live or fresh head-on shrimp, but now accept HOSO frozen
shrimp.
Shrimp exporting companies in China, like the Guangdong Evergreen Group, have started
focusing on the domestic market rather than exports. Domestic wild seafood is no longer enough
to meet the rising demand.
India already has entered this next emerging market.
Source: UN.Comtrade, Edelweiss Investment Research.
0
50000
100000
150000
200000
250000
2009 2010 2011 2012 2013 2014 2015 2016
China Export vs Import MT
Import Export
3% 2% 3%4%
5%
4%
6%
5%
0%
2%
4%
6%
8%
0
5000
10000
15000
2009 2010 2011 2012 2013 2014 2015 2016
China Shrimp Import from India (‘000 M.T)
('000 M.T) as % of Total China imports
Avanti Feeds Ltd.
21 GWM
Valuation and Peers
Avanti is the leader in shrimp aquaculture in India and is expected to surpass industry growth. We
expect the company to benefit from favourable tailwinds in the sector. Key growth drivers are: 1)
robust growth in the shrimp feeds space with increasing area under cultivation; 2) expansion of
shrimp processing facility with aggressive capacity utilization goals; 3) sustenance of leadership in
the feeds space with continued steady share gains; and 4) targeting the crown of largest shrimp
exporter from India in coming years. We initiate coverage on the stock with ‘BUY’
recommendation, valuing it at 20x FY20E P/E and thus arrive at a target price of INR3,306.
Key indicators FY15 FY16 FY17 FY18E FY19E FY20E
Sales growth
Zeal Aqua Ltd 26% (29.2%) 43.9% NA NA NA
Waterbase Ltd 22% 8% 7% NA NA NA
Apex Frozen
Foods Ltd 17% 1% 16% NA NA NA
Avanti Feeds Ltd 57% 13% 35% 31% 39% 27.3%
EBITDA margins
Zeal Aqua Ltd 6% 8% 5% NA NA NA
Waterbase Ltd 11% 3% 9% NA NA NA
Apex Frozen
Foods Ltd 6% 7% 6% NA NA NA
Avanti Feeds Ltd 10% 11% 12% 21% 19% 19%
PAT margins
Zeal Aqua Ltd 2% 2% 1% NA NA NA
Waterbase Ltd 7% 2% 4% NA NA NA
Apex Frozen
Foods Ltd 3% 3% 4% NA NA NA
Avanti Feeds Ltd 7% 8% 8% 13% 12% 12%
Debt Equity
Zeal Aqua Ltd 2.0 1.8 1.3 NA NA NA
Waterbase Ltd 0.1 0.5 0.5 NA NA NA
Apex Frozen
Foods Ltd 3.1 3.2 3.5 NA NA NA
Avanti Feeds Ltd 0.2 0.0 0.0 0.0 0.0 0.0
RoCE
Zeal Aqua Ltd 27% 18% 11% NA NA NA
Waterbase Ltd 28% 4% 14% NA NA NA
Apex Frozen
Foods Ltd 25% 23% 21% NA NA NA
Avanti Feeds Ltd 61% 57% 53% 73% 62% 56%
PE
Zeal Aqua Ltd 52.3 83.9 123.9 NA NA NA
Waterbase Ltd 59.3 214.8 99.7 NA NA NA
Apex Frozen
Foods Ltd 84.9 80.9 63.9 NA NA NA
Avanti Feeds Ltd 93.8 71.0 51.0 22.9 18.8 14.5

Avanti Feeds Ltd.
22 GWM
Major Milestones
1993Avanti Feeds Limited was founded by Mr. Alluri Venkateswara Rao & Mr. Alluri Indra Kumar
2002Mr.Alluri Indra Kumar took over as Managing Director
2008Thai Union PCL invested in a 14.99 %
2009Invested in 50:50 SPV, Avanti Thai Aqua Feeds Pvt Ltd in Gujarat
2014Feed capacity increased to 1,90,000 Mt
2012Amalgamation of Avanti Thai Aqua Feeds with the company Feed capacity increased to 1,10,000 Mt from 52,000 Mt and Shrimp Processing to 7,000 Mt from 2,720 Mt
2016Feed capacity increased to 3,65,000 Mt
2015Feed capacity increased to 3,15,000 Mt
2017Feed capacity increased to 4,25,000 MtSetup subsidiary Avanti Frozen Foods Private Limited
2018Feed capacity increased to 6,00,000 Mt and shrimp processing to 22,000 Mt

Avanti Feeds Ltd.
23 GWM
Business Overview: Well diversified business
Company description
Avanti is a leader in India’s shrimp industry with 43% marketshare in shrimp feed manufacturing. The company is also
present in shrimp processing. Though a minuscule part of the business uptil now, it has expanded its shrimp processing plant
to 23,000MT, making it one of the largest in the country.
Business Model
The company has 2 segments
1) Shrimp feed
2)Shrimp processing
Strategic Positioning Avanti is the largest player in the shrimp feed segment with 43% market share. The company has aggervise plans
for the shrimp processing business and is envisaged to become leading exporter of shrimps in coming years.
Competitive Edge
Trusted Brand,
Technologically superiar product (feeds),
Strong tie-up with Thai Union,
Presence across India.
Financial Structure Completion of capex will result in high free cashflows of about 900 Cr.
As the company moves into value-added products, margins and return ratios will imporve.
Key Competitors
Feeds - C.P.Feeds, Waterbase, BMR Group, Godrej Agrovet, Cargill, Growell Feeds and Devi Seafoods.
Shrimp Processing - Devi Fisheries, Devi Seafoods, BMR Group, Apex Frozen Foods, Nekkanti Seafoods,
Sandhya Marines, Waterbase and IFB Agro.
Industry Revenue
Drivers Continued demand for shrimps globally.
Shareholder Value
Proposition
Avanti is likely to clock 26% earnings CAGR over FY18 -20E, results an EPS of INR 165 in FY20E. A 20x valuation
can give price target of INR 3306 for the company which gives an upside of 38%
Avanti Feeds Ltd.
24 GWM
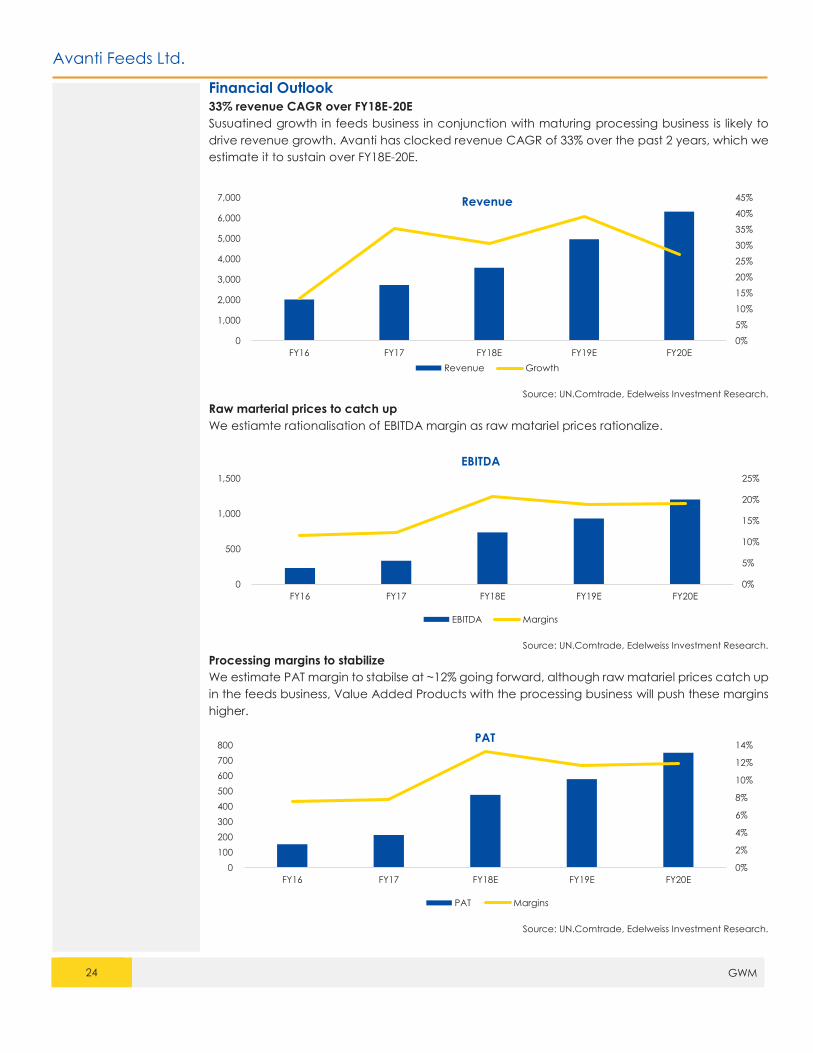
Financial Outlook
33% revenue CAGR over FY18E-20E
Susuatined growth in feeds business in conjunction with maturing processing business is likely to
drive revenue growth. Avanti has clocked revenue CAGR of 33% over the past 2 years, which we
estimate it to sustain over FY18E-20E.
Source: UN.Comtrade, Edelweiss Investment Research.
Raw marterial prices to catch up
We estiamte rationalisation of EBITDA margin as raw matariel prices rationalize.
Source: UN.Comtrade, Edelweiss Investment Research.
Processing margins to stabilize
We estimate PAT margin to stabilse at ~12% going forward, although raw matariel prices catch up
in the feeds business, Value Added Products with the processing business will push these margins
higher.
Source: UN.Comtrade, Edelweiss Investment Research.
0%
5%
10%
15%
20%
25%
30%
35%
40%
45%
0
1,000
2,000
3,000
4,000
5,000
6,000
7,000
FY16 FY17 FY18E FY19E FY20E
Revenue Growth
Revenue
0%
5%
10%
15%
20%
25%
0
500
1,000
1,500
FY16 FY17 FY18E FY19E FY20E
EBITDA
EBITDA Margins
0%
2%
4%
6%
8%
10%
12%
14%
0
100
200
300
400
500
600
700
800
FY16 FY17 FY18E FY19E FY20E
PAT
PAT Margins

Avanti Feeds Ltd.
25 GWM
Key Management
Name Designation Profile
Mr. Alluri Indra
Kumar
Chairman & Managing
Director
Mr. Kumar was inducted as Executive Director with the responsibility
to look after shrimp feed manufacturing, processing and exporting of
shrimp in 1993. In 2002, he took over as Managing Director. Mr. Kumar,
with his varied experience, has been instrumental in the development
of shrimp culture and processing by bringing in latest technology in
feed manufacture and also development of value- added shrimp
products for exports. He enhanced Avanti's technical and marketing
capabilities by bringing on board Thai Union. He is a B.E. in Chemical
Engineering from the University of Bangalore.
Mr.
C.Ramachandra
Rao
Joint Managing Director,
CFO & CS
Mr. Rao is a qualified Chartered Accountant, Company Secretary &
Law Graduate and has experience of over 25 years in government
and public sector undertakings. He has been instrumental in the
growth of Avanti.
Key Risks
Break out of diesease: The government of India has taken various steps to prevent spread of disease (like in Thailand),
because of which there has never been a wide spread disease in India. Some major steps are: only authorised hatcheries
allowed to import broodstock, broodstock can only be bought from an approved seller, once brought into the country
the broodstock is quarantined in Chennai and checked for diesease, if infected it is destroyed. Apart from these measures,
there has been countinuous education of farmers to prevent diseases.
Dependency on rainfall: Due to India’s vast coastline, chances of entire area under cultivation being affected by lack of
rainfall remains low.
Threat of unfriendly trade polices: Currently, the anti-dumping in US on Indian shrimps is 2.34%, which is low compared to
25.76% on shrimps from Vietnam.
Avanti Feeds Ltd.
26 GWM
Financials
Income statement (INR crs)
Year to March FY10FY11 FY16 FY17 FY18E FY19E FY20E
Income from operations 2,018 2,733 3,570 4,965 6,318
Direct costs 1,555 2,105 2,502 3,575 4,541
Employee costs 58 73 118 159 196
Other expenses 233 296 332 457 575
Total operating expenses 1,788 2,401 2,834 4,032 5,115
EBITDA 230 332 736 933 1,202
Depreciation and amortisation 10 14 20 25 27
EBIT 220 318 716 908 1,176
Interest expenses 3 5 4 4 4
Other income 21 22 40 57 81
Profit before tax 238 335 752 961 1,253
Provision for tax 79 108 256 336 438
Core profit 159 227 497 625 814
Extraordinary items -4 -1 0 0 0
Profit after tax 155 226 497 625 814
Minority Interest -1 -12 -22 -47 -64
Share from associates 0 0 0 0 0
Adjusted net profit 153 213 474 578 750
Equity shares outstanding (Cr) 5 5 5 5 5
EPS (INR) basic 34 47 105 127 165
Diluted shares (Cr) 5 5 5 5 5
EPS (INR) fully diluted 34 47 105 127 165
Div idend per share 6 7 16 19 25
Div idend payout (%) 16 15 15 15 15
Common size metrics- as % of net revenues
Year to March FY10FY11 FY16 FY17 FY18E FY19E FY20E
Operating expenses 88.6 87.9 79.4 81.2 81.0
Depreciation 0.5 0.5 0.6 0.5 0.4
Interest expenditure 0.2 0.2 0.1 0.1 0.1
EBITDA margins 11.4 12.1 20.6 18.8 19.0
Net profit margins 7.6 7.8 13.3 11.6 11.9
Growth metrics (%)
Year to March FY10FY11 FY16 FY17 FY18E FY19E FY20E
Revenues 13.3 35.4 30.6 39.1 27.3
EBITDA 26.3 44.1 121.7 26.7 28.9
PBT 32.4 40.7 124.5 27.7 30.4
Net profit 36.4 42.6 119.0 25.8 30.4
EPS 32.2 39.2 122.3 21.8 29.8
Ratios
Year to March FY10FY11 FY16 FY17 FY18E FY19E FY20E
ROAE (%) 45.8 40.3 56.3 44.8 40.5
ROACE (%) 57.3 52.7 72.9 61.9 56.3
Debtors (days) 6 3.1 5.9 15.2 15.2
Current ratio 2.3 1.6 2.8 3.4 4.0
Debt/Equity 0.0 0.0 0.0 0.0 0.0
Inventory (days) 52 47.5 50.3 51.7 51.7
Payable (days) 31 37.2 33.3 34.2 34.1
Cash conversion cycle (days) 27 13.5 23.0 32.7 32.7
Debt/EBITDA 0.0 0.1 0.0 0.0 0.0
Adjusted debt/Equity (0.1) (0.0) (0.3) (0.4) (0.5)
Valuation parameters
Year to March FY10FY11 FY16 FY17 FY18E FY19E FY20E
Diluted EPS (INR) 33.8 47.0 104.5 127.3 165.3
Y-o-Y growth (%) 32.2 39.2 122.3 21.8 29.8
CEPS (INR) 36.9 50.2 108.8 132.7 171.2
Diluted P/E (x) 71.0 51.0 22.9 18.8 14.5
Price/BV(x) 25.7 17.0 10.4 7.1 5.0
EV/Sales (x) 5.4 4.0 3.0 2.1 1.5
EV/EBITDA (x) 47.0 32.7 14.3 11.0 8.1
Diluted shares O/S 4.5 4.5 4.5 4.5 4.5
Basic EPS 33.8 47.0 104.5 127.3 165.3
Basic PE (x) 71.0 51.0 22.9 18.8 14.5
Div idend yield (%) 0.2 0.3 0.7 0.8 1.0
Balance sheet (INR cr)
As on 31st March FY10FY11 FY16 FY17 FY18E FY19E FY20E
Equity share capital 9 9 9 9 9
Preference Share Capital 0 0 0 0 0
Reserves & surplus 414 631 1,035 1,526 2,164
Shareholders funds 423 640 1,044 1,535 2,173
Secured loans 7 18 19 21 23
Unsecured loans 3 2 2 2 2
Borrowings 11 19 21 23 25
Minority interest 0 99 121 168 232
Sources of funds 434 759 1,186 1,726 2,430
Gross block 161 228 336 366 396
Depreciation 57 68 112 136 145
Net block 104 160 224 229 251
Capital work in progress 42 78 0 0 0
Total fixed assets 146 239 224 229 251
Unrealised profit 0 0 0 0 0
Investments 33 358 358 358 358
Inventories 286 356 492 704 894
Sundry debtors 35 24 58 206 263
Cash and equivalents 73 45 354 657 1,207
Loans and advances 18 20 36 50 63
Other current assets 0 0 0 0 0
Total current assets 411 445 939 1,617 2,428
Sundry creditors and others 171 278 325 465 590
Provisions 10 5 9 12 16
Total CL & provisions 180 283 334 477 606
Net current assets 230 162 605 1,139 1,822
Net Deferred tax -5 -10 -10 -10 -10
Misc expenditure 29 10 10 10 10
Uses of funds 434 759 1,186 1,726 2,430
Book value per share (INR) 93 141 230 338 479
Cash flow statement
Year to March FY10FY11 FY16 FY17 FY18E FY19E FY20E
Net profit 163 228 497 625 814
Add: Depreciation 10 14 20 25 27
Add: Misc expenses written off/Other -30 19 0 0 0
Add: Deferred tax -1 5 0 0 0
Add: Others -1 -12 -22 -47 -64
Gross cash flow 141 253 495 603 777
Less: Changes in W. C. 34 -41 135 231 132
Operating cash flow 107 294 360 372 645
Less: Capex 66 107 5 30 48
Free cash flow 40 187 355 341 597

27 GWM
Annexure
Global seafood industry
Seafood products can be divided into two categories—capture fisheries which relies on old
school fishing techniques and aquaculture a newer, more sustainable, eco-friendly and effective
way in which species are cultivated in aquaculture farms be it marine, fresh or brackish water.
Source: OECD-FAO Agricultural Outlook 2017-26
We seem to have reached the peak in terms of exploitation of natural resources. Aquaculture is
expected to surpass total capture fisheries’ production in 2021, a year when capture production
is assumed to be lower as a consequence of El Niño, and then continue to increase in absolute
terms. Global aquaculture production is anticipated to exceed the 100-MT mark for the first time
in 2025 and touch 102MT in 2026.
Source: OECD-FAO Agricultural Outlook 2017-26
In the previous decade, China accounted for 21MT of additional fish consumption of global
growth in consumption of 31MT. This growth was driven by increase in per capita food
consumption of fish from 30 kg in 2007 to 42 kg in 2016, a level two-thirds higher than the OECD
average of 25 kg. Over the next decade, China’s per capita consumption of fish is projected to
increase further to 50 kg. This growth will be driven by strong increase in per capita consumption
(of 12 kg) in the world’s most populous country. By contrast, per capita consumption of fish in India
is currently below 10 kg, which is expected to remain stable over the outlook period. Hence, over
the medium term, it seems unlikely that other countries will drive global demand for fish to the
same degree as China has done in recent years.
Aquaculture production
Production of selected freshwater species, including catfish/pangas, tilapia, and carp is expected
to grow the fastest over the next decade by more than 35%; salmon/trout and shrimp will grow by
~27% and 28%, respectively, and molluscs by ~24%.
-
20,000
40,000
60,000
80,000
1,00,000
1,20,000
2009 2010 2011 2012 2013 2014 2015 2016 2017 2018 2019 2020 2021 2022 2023 2024 2025 2026
Total Seafood Production ('000 MT)
Capture Aquaculture
28 GWM
Indian seafood industry
Fishing in India is a major industry in coastal states, employing over 14mn . According to the Food
and Agriculture Organization (FAO) of the United Nations, fish production has increased more
than 10x since 1947 and doubled between 1990 and 2010.
India has 8,129km of marine coastline, 3,827 fishing villages and 1,914 traditional fish landing
centers. Its fresh water resources consist of 195,210km of rivers & canals, 2.9mn hectares of minor
& major reservoirs, 2.4mn hectares of ponds & lakes, and ~0.8mn hectares of flood
plain wetlands & water bodies.
Fishing in India employs about 14.5mn million people. To harvest the economic benefits from
fishing, India has an exclusive economic zone, stretching 200 nautical miles (370 km) into
the Indian Ocean, encompassing more than 2mn sq km. In addition to this marine zone, it has
~14,000km² of brackish water available for aquaculture, ~16,000km² of freshwater lakes, ponds &
swamps and nearly 64,000km of rivers & streams.
Fish production rose from 800,000tons in FY50 to 4.1mn tons in the early 1990s. From 1990 through
2010, India’s fish industry accelerated, reaching a total marine and freshwater fish production of
~8mn MT.
In 2006, the government initiated a dedicated organization focused on fisheries under its Ministry
of Agriculture. Special efforts have been made to promote extensive and intensive inland fish
farming, modernize coastal fisheries and encourage deep-sea fishing through joint ventures.
These efforts led to a more than 4x increase in coastal fish production from 520,000tons in FY50 to
3.35mn MT in FY13. The increase in inland fish production was even more dramatic, increasing
almost 8x from 218,000 tons in FY50 to 6.10mn tons in FY13. Between 1990 and 2007, fish production
in India has grown at a higher rate than food grains, milk, eggs and other food items.
Fisheries research and training institutions are supported by central and state governments. The
principal fisheries research institutions which operate under the Indian Council of Agricultural
Research are the Fishery Survey of India, Central Marine Fisheries Research Institute at Kochi,
the Central Institute of Fisheries Education at Mumbai, the Central Inland Fisheries Institute
at Barrackpore in West Bengal, Central Fisheries Corporation at Kolkata, the Central Institute of
Coastal Engineering for Fisheries at Bangalore and the Central Institute of Fisheries
Technology at Kochi in Kerala. The Government of India established the National Fisheries
Development Board in 2006 with its headquarters in Hyderabad. The Central Institute of Fisheries
Nautical and Engineering Training with facilities in Chennai, Kochi and Vishakapatnam trains
operators of deep-sea fishing vessels and technicians for shore establishments. Fisheries Institute of
Technology and Training (FITT) was established in Chennai in collaboration Tata Group to improve
the socioeconomic condition of fishermen. The Integrated Fisheries Project was established to
research on processing, popularizing and marketing of unusual fish. At present there are 19
fisheries colleges run by state governments.
Despite rapid growth in total fish production, a fish farmers’ average annual production in India is
only 2 tonnes per person compared to 172 tonnes in Norway, 72 tonnes in Chile and 6 tonnes
in China. India's water and natural resources offer a 10x growth potential in aquaculture from 2010
harvest levels of 3.9mn MT of fish, if India adopts fishing knowledge, regulatory reforms
and sustainability policies.

29 GWM
Export Market – Marine Products
The value of fish and processed fish exports where 14,427 Million in 1992 and have increased at
15% CAGR over the last 24 years to come to 396,936 Million in 2017.
Source: MPEDA, Edelweiss Investment Research.
Marine exports now contributes 2% to the total exports of the country. Marine Exports as an
agriculture commodity far exceeds other major agri-commodities such as rice, cotton, sugar and
meat.
Shrimps form 40% of the volume in the total marine exports and about 65% of the value. This means
Shrimps itself accounts for 1.3% of the country’s exports.
Shrimp Aquaculture in India:
Source: MPEDA, Edelweiss Investment Research.
0
50,000
1,00,000
1,50,000
2,00,000
2,50,000
3,00,000
3,50,000
4,00,000
4,50,000
19
92
19
93
19
94
19
95
19
96
19
97
19
98
19
99
20
00
20
01
20
02
20
03
20
04
20
05
20
06
20
07
20
08
20
09
20
10
20
11
20
12
20
13
20
14
20
15
20
16
20
17
Indian Marine Exports - Mn
135 12377 73 81
148
251
353
406
89 104141
220
274
331
435
498
0
100
200
300
400
500
600
2008-09 2009-10 2010-11 2011-12 2012-13 2013-14 2014-15 2015-16
India Shrimp Export Production ('000 MT)
Tiger Shrimp L Vannamei Scampi Total

30 GWM
Shrimp is synonymous with prawn, covering stalk-eyed swimming crustaceans with long narrow
muscular tails (abdomens), long whiskers (antennae) and slender legs. Any small crustacean
which resembles a shrimp tends to be called one. They swim forward by paddling with swimmerets
on the underside of their abdomens. Shrimp are widespread and abundant. There are thousands
of species adapted to a wide range of habitats. They can be found feeding near the seafloor on
most coasts and estuaries, as well as in rivers and lakes. The consumption of shrimp is associated
with numerous health benefits as they are high in calcium, iodine, vitamin D, vitamin B3, zinc,
protein and omega-3s but low in saturated fat. In addition, they offer numerous health benefits
such as improved bone and brain health, weight management, lowered risk of cardiovascular
disease, relieved eye fatigue, lowered blood pressure and enhanced overall health.
After Green and White Revolution in India, it is time for Blue Revolution to exploit the huge potential
in fisheries sector. Shrimps are called "Pinkish Gold" of the sea because of their universal appeal,
unique taste, high unit value and increasing demand in the global market. Although there are
thousands of species, commercial production was restricted to a few until early 2000. The
development of brackish water aquaculture was mostly confined to a two species—Penaeus
Monodon, also known as Black Tiger shrimp, the scientific farming of which began only in early
1990s and Macrobrachium rosenbergii also known as scampi. Majority of the shrimps produced
were for exports, which fetched high realizations. However, due to the breakout of white spot
syndrome virus (WSSV) the production of Black Tiger shrimp remained stagnant.
In 2003, pilot research and small scale production of L. vannamei, also known as Pacific white leg
shrimp, was initiated. After six years of research, large scale production of L vannamei was
permitted in 2009 and since then its skyrocketed and grew at a CAGR of 190% to reach 0.4 million
tonne in 2015. The export of Pacific white leg shrimp has fetched hefty export realisations. Its
production is comparatively easier, as they can be reared at high stocking densities up to 150/
square meters and are tolerant to a wide range of salinities.

31 GWM
Shrimp Business Process:
1 2
3
4 5

32 GWM
1) Shrimp Hatcheries Industry:
SPF Broodstock
The Broodstock is purchased from
approved vendor in Florida or Hawaii.
Specific pathogen-free (SPF) broodstock is
used to control diseases and maintain
quality across the value chain.
Quarantined
Once brought into the country the
broodstock is quarantined by the Coastal
Aquaculture Authorithy of India. After
being checked for disease it is relased to
licensed Hatcheries.
Maturation
Males start reaching maturity at a weight
of 20g, while females usually grow faster
and bigger and reach this stage from 28g.
The matured male and female brood
stocks are reared for about 20-25 days in
holding tanks to recover from transport
stress & to adopt climate change.
Spawning
The first batch of eggs is discarded. The
female can spawn upto seven times.
Hatching
The females start laying eggs in the
spawning tank around 6 A.M. in the
morning. The eggs will begin to hatch
around 12 P.M. and the entire eggs are
hatched out by 4 P.M. the same day. The
next day all the hatched out young ones
i.e. Nauplii will be transferred to the Larval
Rearing Tanks.
MoltingThe un-segmented body of Nauplius
undergoes six molting’s within 50 hours
and turns into a protozoea. After 4–6 days,
the protozoea finally turn into a mysis. The
mysis remain drifting in the water column
until they transform into post larvae within
10–12 days. The animals grow very fast in
terms of size and are able to swim freely
at a body size of 0.8–1 cm in body length.

33 GWM
2) Shrimp Farming Industry:
Baby shrimp are fed for approximately 20 days before being transferred to open ponds, where
they are reared for 120 to 180 days depending on the size required, before developing into fully
grown shrimp ready for harvest. In 2017 the production of shrimp was about 600 KT.
Types Of Shrimp farmed in India
Penanaeus Monodon ( Black Tiger ) – Black Tiger Shrimp are known for ‘tiger stripes’on their shells
and tails. Shell color can range from brown, black, and grey. Tiger shrimp are most popular for
having a bold, sweet taste. The meat is firm which is described as snappy, meaty texture. Black
Tiger are normally priced higher than White shrimp and grow to a larger size. Black Tiger is available
in abundance in the eastern cost of India. However SPF seeds are not available for this species
making the survival rate lower and also due to the inherit characteristic they can’t be stock in high
density.
Litopenaeus vannamei ( Pacific white shrimp ) - Whiteleg shrimp are native to the eastern Pacific
Ocean, from the Mexican state of Sonora as far south as northern Peru.It is restricted to areas
where the water temperature remains above 20 °C (68 °F) throughout the year. They have a frim
but softer texture with a more delicate flavor. The introduction of L. vannamei during fiscal 2010
triggered massive expansion in farmed shrimp culture in India due to the suitable climatic and
other infrastructural conditions. The average yields rose up to six to eight MT from one to two MT
seen in the regime of black tiger culture. Responding to the increased white shrimp production,
corresponding expansion in processing capacity also took place by way of new players entering
the field while the existing players expanded their processing capacities. Farm yields and
economic viability substantially increased on account of lower susceptibility to disease outbreak
due to favourable climatic conditions, widespread farming area and compliance to best
aquaculture practices. Significant expansion in culture area across all the coastal states also led
to flourishing of feed manufacturing and processing capacities and other supply chain
infrastructure.

34 GWM
Benefits of white shrimp
Fast growth and easy to cultivate. Owing to their less aggressive nature, white leg shrimps can
be cultivated in high densities such as 150 per square meter (“sq. m.”) as compared to 25 to
40 per sq. m. for black tiger shrimps. White leg shrimps are also tolerant to wide range of
salinities of 0.5 parts per thousand (“ppt”) to 45 ppt, compared to black tiger shrimps which
can tolerate salinity levels of 15 ppt to 20 ppt. Such advantages have led to a greater
adoption of the white leg shrimps cultivation and consequently growth of the overall shrimps
industry.
High survival rate. White leg shrimps show approximately 50% to 60% survival rates in hatchery,
which are much higher, compared to black tiger shrimps and are more tolerant to low
temperatures up to 15 degree centigrade. In comparison with black tiger shrimps, white leg
shrimps are also more robust and resistant to diseases on account of several selective
breeding programs which genetically improve their resistance to diseases.
Economical to rear. White leg shrimps have higher yields and require feed with 20% to 35%
protein content compared with tiger shrimps that require 38% to 40% protein content.
Year-round cropping pattern. Most states in India that produce white leg shrimp follow a year-
round cropping pattern, as these shrimp are not highly dependent on weather conditions.
On the other hand, for tiger shrimp, two crops are practiced in scientific farms, namely, the
dominant summer crop followed by a monsoon crop. In traditional farms, stocking (a
practice of collecting and raising seafood) is done when salinity picks up after the end of the
monsoon.
Cropping Pattern
State Species Crop Stocking Period Harvesting Period
Kerala
P monodon 1st January - March April -June
P monodon 2nd October-Dec. March-April
L vannamei - Jan – Dec. Jan – Dec.
Karanataka
P monodon 1st January-Feb May-June
P monodon 2nd August-Sept Nov-Dec.
L vannamei - Jan - Dec Jan - Dec
Maharashtra
P monodon 1st Feb-March June/July-Aug
P monodon 2nd Aug-Sept. January-Feb.
L vannamei 1st Jan – Dec. Jan - Dec
Gujarat P monodon - Feb-March June-Aug
L vannamei - Jan – Dec. Jan – Dec.
West Bengal
P monodon 1st Jan – July (Traditional) April- Nov
P.monodon 1st Feb-April May-July
P.monodon 2nd June-Aug Sept-Nov
L vannamei - April - July July - Oct
Odisha
P monodon 1st Feb – April July – Sept
P monodon 2nd July – Aug Oct – Nov
L vannamei - April - July July - Oct
Andhra
Pradesh
P monodon 1st Jan – March May – June
P monodon 2nd July – August Sept – Nov
L vannamei - Jan – Dec. Jan – Dec.
Tamil Nadu
P monodon 1st March-April June – July
P monodon 2nd July-Aug Oct-Nov
L vannamei - Jan – Dec. Jan – Dec.
Source: MPEDA, Edelweiss Investment Research.
35 GWM
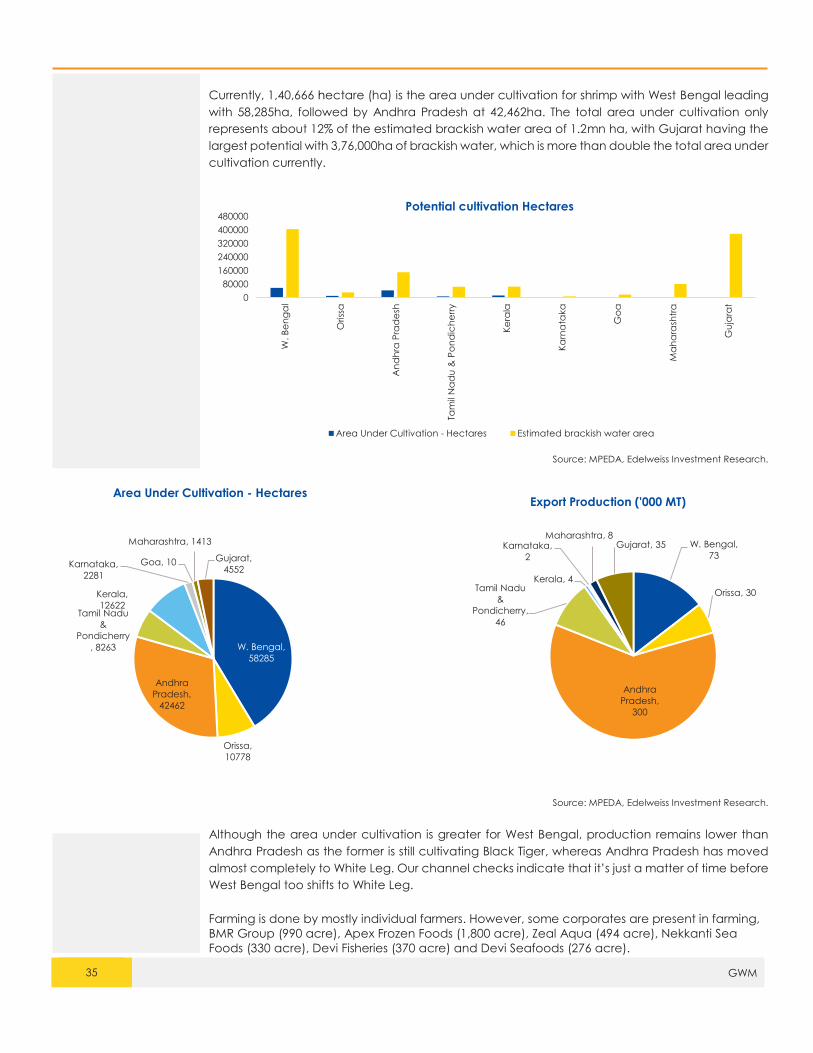
Currently, 1,40,666 hectare (ha) is the area under cultivation for shrimp with West Bengal leading
with 58,285ha, followed by Andhra Pradesh at 42,462ha. The total area under cultivation only
represents about 12% of the estimated brackish water area of 1.2mn ha, with Gujarat having the
largest potential with 3,76,000ha of brackish water, which is more than double the total area under
cultivation currently.
Source: MPEDA, Edelweiss Investment Research.
Source: MPEDA, Edelweiss Investment Research.
Although the area under cultivation is greater for West Bengal, production remains lower than
Andhra Pradesh as the former is still cultivating Black Tiger, whereas Andhra Pradesh has moved
almost completely to White Leg. Our channel checks indicate that it’s just a matter of time before
West Bengal too shifts to White Leg.
Farming is done by mostly individual farmers. However, some corporates are present in farming,
BMR Group (990 acre), Apex Frozen Foods (1,800 acre), Zeal Aqua (494 acre), Nekkanti Sea
Foods (330 acre), Devi Fisheries (370 acre) and Devi Seafoods (276 acre).
0
80000
160000
240000
320000
400000
480000
W. B
en
ga
l
Oriss
a
An
dh
ra P
rad
esh
Tam
il N
ad
u &
Po
nd
ich
err
y
Ke
rala
Ka
rna
taka
Go
a
Ma
ha
rash
tra
Gu
jara
t
Potential cultivation Hectares
Area Under Cultivation - Hectares Estimated brackish water area
W. Bengal,
58285
Orissa,
10778
Andhra
Pradesh,
42462
Tamil Nadu
&
Pondicherry
, 8263
Kerala,
12622
Karnataka,
2281
Goa, 10
Maharashtra, 1413
Gujarat,
4552
Area Under Cultivation - Hectares
W. Bengal,
73
Orissa, 30
Andhra
Pradesh,
300
Tamil Nadu
&
Pondicherry,
46
Kerala, 4
Karnataka,
2
Maharashtra, 8Gujarat, 35
Export Production ('000 MT)

36 GWM
3) Shrimp Feed Industry
The shrimp feed industry is highly organized as the shrimp industry caters to the export market, with
organized players accounting for 80% of the shrimp feed industry. There has been a higher usage
of shrimp feed given that a large part of the shrimp export market is catered to by aquaculture
farms. While barrier to entry are low in this business, quality and consistence are key to success of
the feed manufacture. The base of judging a feed is its FCR-Feed Conversation Ratio, good feeds
have an FCR lower than 1.3x . FCR means how much of the feed leads to a gram increase in the
weight of the shrimp.
The total market size of the shrimp feed industry was estimated at about 1.2 million MT in fiscal 2017
with capacity at about 2.2 Million MT. The industry is expected to grow at 15%-20% annually for the
next 3 years based on industry experts.
The industry is dominated by two giants Avanti feeds (6,00,000 MT) and CP Aqua feeds an Thailand
based company. Apart from these other players are Waterbase(1,10,000 MT), BMR group(1,40,000
MT), Godrej Agrovet(70,000 MT), Cargill(90,000 MT), Growell feeds(3,00,000 MT) and Devi
Seafoods(1,25,000 MT).
37 GWM
4) Shrimp Processing Industry
India has 536 processing facilities with a combined installed capacity of approximately 26,000 MT
per day (Source: MPEDA statistics). Shrimp processing facilities are largely concentrated in South
India and in particular Andhra Pradesh. Every shrimp processing plant in India is Hazard Analysis
and Critical Control Points ("HACCP") compliant, and all business involved in the shrimp supply
chain from producers to retailers are similarly required to be HACCP-compliant. Additionally, India
has one of the highest number of EU-approved processing plants, with more than two-thirds of
plants being approved.
Post-harvest, fully grown shrimp are transferred to these processing plants for primary processing,
which involves the slicing of shrimp heads and heavy duty washing. Thereafter, these are subject
to a sorting process based on commercially accepted sizes and weights before having their skins
peeled off and being soaked in phosphate chemicals. The phosphate soaking process helps to
maintain the quality and taste of the shrimp, and this process is a prerequisite for almost all export
markets. The raw shrimp is then frozen before packaging. Based on the final desired product,
shrimp can go through a number of processes, including freezing, freeze-drying, chilling, canning,
etc. Different levels of processing include basic processing such as easy-peel type shrimp where
the shell is left on, or where the shell has been removed (head-less, tail-on, tail-off, deveined, etc.).
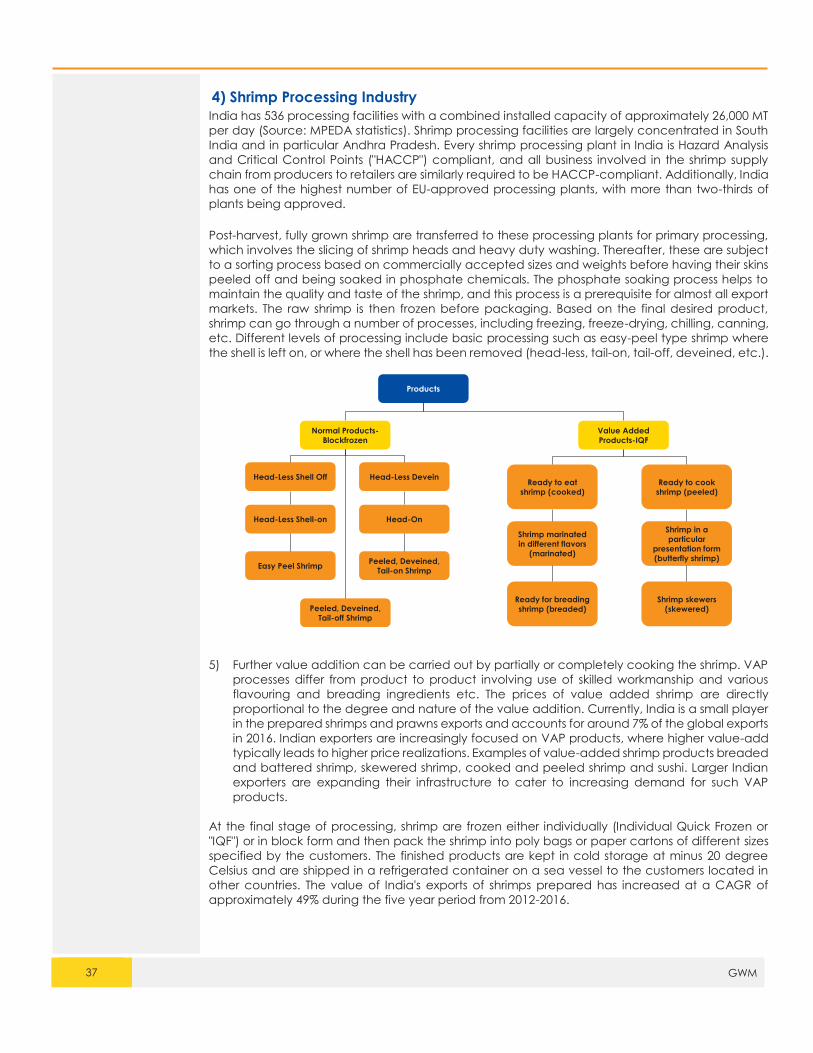
5) Further value addition can be carried out by partially or completely cooking the shrimp. VAP
processes differ from product to product involving use of skilled workmanship and various
flavouring and breading ingredients etc. The prices of value added shrimp are directly
proportional to the degree and nature of the value addition. Currently, India is a small player
in the prepared shrimps and prawns exports and accounts for around 7% of the global exports
in 2016. Indian exporters are increasingly focused on VAP products, where higher value-add
typically leads to higher price realizations. Examples of value-added shrimp products breaded
and battered shrimp, skewered shrimp, cooked and peeled shrimp and sushi. Larger Indian
exporters are expanding their infrastructure to cater to increasing demand for such VAP
products.
At the final stage of processing, shrimp are frozen either individually (Individual Quick Frozen or
"IQF") or in block form and then pack the shrimp into poly bags or paper cartons of different sizes
specified by the customers. The finished products are kept in cold storage at minus 20 degree
Celsius and are shipped in a refrigerated container on a sea vessel to the customers located in
other countries. The value of India's exports of shrimps prepared has increased at a CAGR of
approximately 49% during the five year period from 2012-2016.
Products
Normal Products-Blockfrozen
Head-Less Shell Off
Head-Less Shell-on Head-On
Easy Peel ShrimpPeeled, Deveined,
Tail-on Shrimp
Peeled, Deveined, Tail-off Shrimp
Value Added Products-IQF
Ready to eat shrimp (cooked)
Ready to cook shrimp (peeled)
Shrimp marinated in different flavors
(marinated)
Shrimp in a particular
presentation form (butterfly shrimp)
Ready for breading shrimp (breaded)
Shrimp skewers (skewered)
Head-Less Devein
38 GWM
Edelweiss Broking Limited, 1st Floor, Tower 3, Wing B, Kohinoor City Mall, Kohinoor City, Kirol Road, Kurla(W)
Board: (91-22) 4272 2200
Vinay Khattar
Head Research
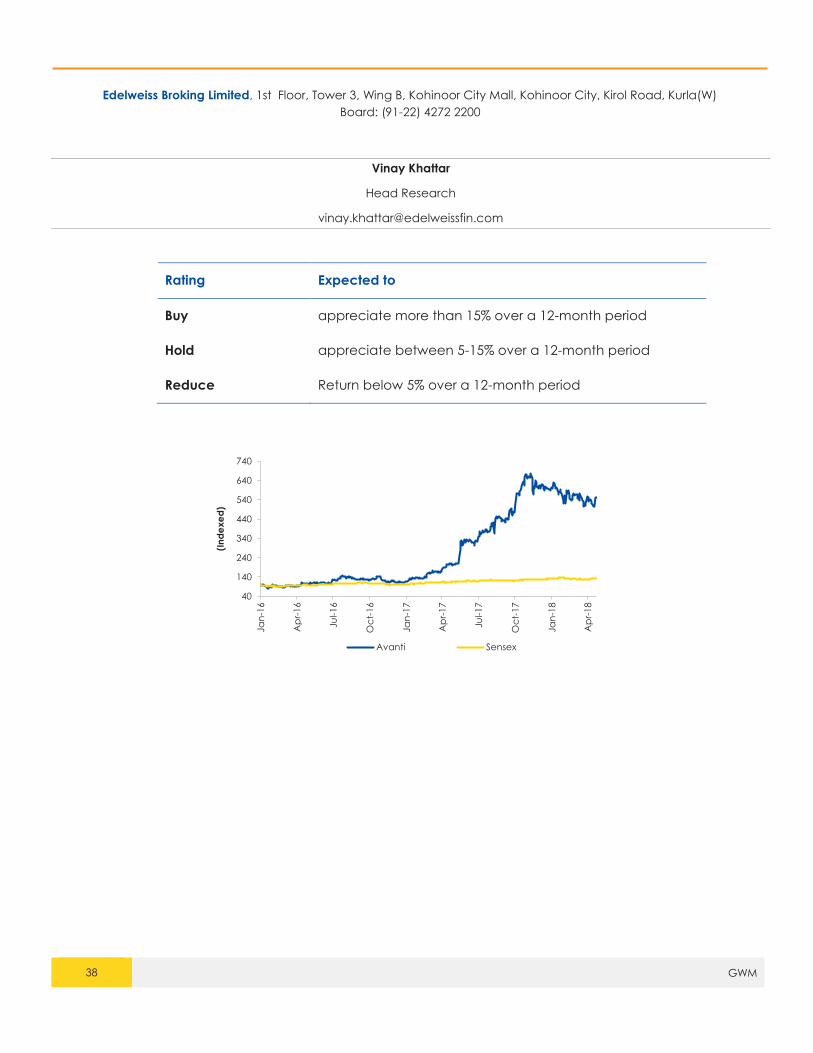
Rating Expected to
Buy appreciate more than 15% over a 12-month period
Hold appreciate between 5-15% over a 12-month period
Reduce Return below 5% over a 12-month period
40
140
240
340
440
540
640
740
Ja
n-1
6
Ap
r-16
Ju
l-16
Oc
t-16
Ja
n-1
7
Ap
r-17
Ju
l-17
Oc
t-17
Ja
n-1
8
Ap
r-18
(In
de
xe
d)
Avanti Sensex

Disclaimer
39 GWM
Edelweiss Broking Limited (“EBL” or “Research Entity”) is regulated by the Securities and Exchange Board of India (“SEBI”) and is licensed to carry on the business of broking, depository
services and related activities. The business of EBL and its Associates (list available on www.edelweissfin.com) are organized around five broad business groups – Credit including Housing
and SME Finance, Commodities, Financial Markets, Asset Management and Life Insurance.
Broking services offered by Edelweiss Broking Limited under SEBI Registration No.: INZ000005231; Name of the Compliance Officer: Mr. Brijmohan Bohra, Email ID:
[email protected] Corporate Office: Edelweiss House, Off CST Road, Kalina, Mumbai - 400098; Tel. 18001023335/022-42722200/022-40094279
This Report has been prepared by Edelweiss Broking Limited in the capacity of a Research Analyst having SEBI Registration No.INH000000172 and distributed as per SEBI (Research Analysts)
Regulations 2014. This report does not constitute an offer or solicitation for the purchase or sale of any financial instrument or as an official confirmation of any transaction. The information
contained herein is from publicly available data or other sources believed to be reliable. This report is provided for assistance only and is not intended to be and must not alone be taken
as the basis for an investment decision. The user assumes the entire risk of any use made of this information. Each recipient of this report should make such investigation as it deems necessary
to arrive at an independent evaluation of an investment in the securities of companies referred to in this document (including the merits and risks involved), and should consult his own
advisors to determine the merits and risks of such investment. The investment discussed or views expressed may not be suitable for all investors.
This information is strictly confidential and is being furnished to you solely for your information. This information should not be reproduced or redistributed or passed on directly or indirectly
in any form to any other person or published, copied, in whole or in part, for any purpose. This report is not directed or intended for distribution to, or use by, any person or entity who is a
citizen or resident of or located in any locality, state, country or other jurisdiction, where such distribution, publication, availability or use would be contrary to law, regulation or which would
subject EBL and associates / group companies to any registration or licensing requirements within such jurisdiction. The distribution of this report in certain jurisdictions may be restricted by
law, and persons in whose possession this report comes, should observe, any such restrictions. The information given in this report is as of the date of this report and there can be no
assurance that future results or events will be consistent with this information. This information is subject to change without any prior notice. EBL reserves the right to make modifications and
alterations to this statement as may be required from time to time. EBL or any of its associates / group companies shall not be in any way responsible for any loss or damage that may arise
to any person from any inadvertent error in the information contained in this report. EBL is committed to providing independent and transparent recommendation to its clients. Neither EBL
nor any of its associates, group companies, directors, employees, agents or representatives shall be liable for any damages whether direct, indirect, special or consequential including loss
of revenue or lost profits that may arise from or in connection with the use of the information. Our proprietary trading and investment businesses may make investment decisions that are
inconsistent with the recommendations expressed herein. Past performance is not necessarily a guide to future performance .The disclosures of interest statements incorporated in this
report are provided solely to enhance the transparency and should not be treated as endorsement of the views expressed in the report. The information provided in these reports remains,
unless otherwise stated, the copyright of EBL. All layout, design, original artwork, concepts and other Intellectual Properties, remains the property and copyright of EBL and may not be
used in any form or for any purpose whatsoever by any party without the express written permission of the copyright holders.
EBL shall not be liable for any delay or any other interruption which may occur in presenting the data due to any reason including network (Internet) reasons or snags in the system, break
down of the system or any other equipment, server breakdown, maintenance shutdown, breakdown of communication services or inability of the EBL to present the data. In no event shall
EBL be liable for any damages, including without limitation direct or indirect, special, incidental, or consequential damages, losses or expenses arising in connection with the data presented
by the EBL through this report.
We offer our research services to clients as well as our prospects. Though this report is disseminated to all the customers simultaneously, not all customers may receive this report at the
same time. We will not treat recipients as customers by virtue of their receiving this report.
EBL and its associates, officer, directors, and employees, research analyst (including relatives) worldwide may: (a) from time to time, have long or short positions in, and buy or sell the
securities thereof, of company(ies), mentioned herein or (b) be engaged in any other transaction involving such securities and earn brokerage or other compensation or act as a market
maker in the financial instruments of the subject company/company(ies) discussed herein or act as advisor or lender/borrower to such company(ies) or have other potential/material
conflict of interest with respect to any recommendation and related information and opinions at the time of publication of research report or at the time of public appearance. EBL may
have proprietary long/short position in the above mentioned scrip(s) and therefore should be considered as interested. The views provided herein are general in nature and do not consider
risk appetite or investment objective of any particular investor; readers are requested to take independent professional advice before investing. This should not be construed as invitation
or solicitation to do business with EBL.
EBL or its associates may have received compensation from the subject company in the past 12 months. EBL or its associates may have managed or co-managed public offering of
securities for the subject company in the past 12 months. EBL or its associates may have received compensation for investment banking or merchant banking or brokerage services from
the subject company in the past 12 months. EBL or its associates may have received any compensation for products or services other than investment banking or merchant banking or
brokerage services from the subject company in the past 12 months. EBL or its associates have not received any compensation or other benefits from the Subject Company or third party
in connection with the research report. Research analyst or his/her relative or EBL’s associates may have financial interest in the subject company. EBL, its associates, research analyst and
his/her relative may have other potential/material conflict of interest with respect to any recommendation and related information and opinions at the time of publication of research
report or at the time of public appearance.
Participants in foreign exchange transactions may incur risks arising from several factors, including the following: ( i) exchange rates can be volatile and are subject to large fluctuations; (
ii) the value of currencies may be affected by numerous market factors, including world and national economic, political and regulatory events, events in equity and debt markets and
changes in interest rates; and (iii) currencies may be subject to devaluation or government imposed exchange controls which could affect the value of the currency. Investors in securities
such as ADRs and Currency Derivatives, whose values are affected by the currency of an underlying security, effectively assume currency risk.
Research analyst has served as an officer, director or employee of subject Company: No
EBL has financial interest in the subject companies: No
EBL’s Associates may have actual / beneficial ownership of 1% or more securities of the subject company at the end of the month immediately preceding the date of publication of
research report.
Research analyst or his/her relative has actual/beneficial ownership of 1% or more securities of the subject company at the end of the month immediately preceding the date of publication
of research report: No
EBL has actual/beneficial ownership of 1% or more securities of the subject company at the end of the month immediately preceding the date of publication of research report: No
Subject company may have been client during twelve months preceding the date of distribution of the research report.
There were no instances of non-compliance by EBL on any matter related to the capital markets, resulting in significant and material disciplinary action during the last three years.
A graph of daily closing prices of the securities is also available at www.nseindia.com
Analyst Certification:
The analyst for this report certifies that all of the views expressed in this report accurately reflect his or her personal views about the subject company or companies and its or their securities,
and no part of his or her compensation was, is or will be, directly or indirectly related to specific recommendations or views expressed in this report.
Additional Disclaimer for U.S. Persons
Edelweiss is not a registered broker – dealer under the U.S. Securities Exchange Act of 1934, as amended (the“1934 act”) and under applicable state laws in the United States. In addition
Edelweiss is not a registered investment adviser under the U.S. Investment Advisers Act of 1940, as amended (the "Advisers Act" and together with the 1934 Act, the "Acts), and under

Disclaimer
40 GWM
applicable state laws in the United States. Accordingly, in the absence of specific exemption under the Acts, any brokerage and investment services provided by Edelweiss, including the
products and services described herein are not available to or intended for U.S. persons.
This report does not constitute an offer or invitation to purchase or subscribe for any securities or solicitation of any investments or investment services and/or shall not be considered as an
advertisement tool. "U.S. Persons" are generally defined as a natural person, residing in the United States or any entity organized or incorporated under the laws of the United States. US
Citizens living abroad may also be deemed "US Persons" under certain rules.
Transactions in securities discussed in this research report should be effected through Edelweiss Financial Services Inc.
Additional Disclaimer for U.K. Persons
The contents of this research report have not been approved by an authorised person within the meaning of the Financial Services and Markets Act 2000 ("FSMA").
In the United Kingdom, this research report is being distributed only to and is directed only at (a) persons who have professional experience in matters relating to investments falling within
Article 19(5) of the FSMA (Financial Promotion) Order 2005 (the “Order”); (b) persons falling within Article 49(2)(a) to (d) of the Order (including high net worth companies and
unincorporated associations); and (c) any other persons to whom it may otherwise lawfully be communicated (all such persons together being referred to as “relevant persons”).
This research report must not be acted on or relied on by persons who are not relevant persons. Any investment or investment activity to which this research report relates is available only
to relevant persons and will be engaged in only with relevant persons. Any person who is not a relevant person should not act or rely on this research report or any of its contents. This
research report must not be distributed, published, reproduced or disclosed (in whole or in part) by recipients to any other person.
Additional Disclaimer for Canadian Persons
Edelweiss is not a registered adviser or dealer under applicable Canadian securities laws nor has it obtained an exemption from the adviser and/or dealer registration requirements under
such law. Accordingly, any brokerage and investment services provided by Edelweiss, including the products and services described herein, are not available to or intended for Canadian
persons.
This research report and its respective contents do not constitute an offer or invitation to purchase or subscribe for any securities or solicitation of any investments or investment services.
Disclosures under the provisions of SEBI (Research Analysts) Regulations 2014 (Regulations)
Edelweiss Broking Limited ("EBL" or "Research Entity") is regulated by the Securities and Exchange Board of India ("SEBI") and is licensed to carry on the business of broking, depository services
and related activities. The business of EBL and its associates are organized around five broad business groups – Credit including Housing and SME Finance, Commodities, Financial Markets,
Asset Management and Life Insurance. There were no instances of non-compliance by EBL on any matter related to the capital markets, resulting in significant and material disciplinary
action during the last three years. This research report has been prepared and distributed by Edelweiss Broking Limited ("Edelweiss") in the capacity of a Research Analyst as per Regulation
22(1) of SEBI (Research Analysts) Regulations 2014 having SEBI Registration No.INH000000172.