ED 367 716 TM 021 255 AUTHOR TITLE - files.eric.ed.gov · An empirical approach is adopted in this...
34
DOCUMENT RESUME ED 367 716 TM 021 255 AUTHOR Wang, Jianjun; Stayer, John R. TITLE An Empirical Approach toward the Prediction of Students' Science Achievement in the United States and the Peoples' Republic of China. PUB DATE Apr 94 NOTE 34p.; Paper presented at the Annual Meeting of the American Educational Research Association (New Orleans, LA, April 4-8, 1994). PUB TYPE Reports Evaluative/Feasibility (142) Speeches/Conference Papers (150) EDRS PRICE MF01/PCO2 Plus Postage. DESCRIPTORS *Academic Achievement; Background; Comparative Analysis; Context Effect; Cross Cultural Studies; Culture; Factor Analysis; ForeiRn Countries; High Schools; High School Students; Liternational Studies; Models; Multivariate Analysis; *Prediction; *Sciences; Sex Differences; Social Influences; Student Attitudes IDENTIFIERS *China; Effort; Empirical Research; Science Achievement; Second International Science Study; Statistical Analysis System; *United States ABSTRACT An empirical approach is adopted in this paper to explore a possible model for prediction of students' science achievement in China and the United States. Construction of the model is based on the ninth-grade data base from Phase 2 of the Second International Education Association Science Study (SISS) in the United States and the SISS Extension Study (SES) in Hubei province in China. The common independent variables of science achievement are classified into gender, attitude, home background, classroom experience, and personal effort, according to the distinction between visible and latent characteristics and scree plots from principal-components analysis. Latent factors are represented by the first principal components in each of the four latent catnories of student attitudes, home backgrounds, classroom experience, and personal effort. Predictors of the model are constructed by polynomials of the visible and latent factors and their interactions in a multivariate Taylor series. Significant predictors at the k.ipha=0.05 level aro selected through a backward elimination procedure in the Statistical Analysis System. The structure of the four latent factors and the model complexity have been compared between the two countries in terms of their educational, political, social, and cultural contexts. Eight tables and two figures are included. (Contains 45 references.) (Author/SLD) *********************************************************************** Reproductions supplied by EDRS are the best that can be made from the original document. ***********************************************************************
Transcript of ED 367 716 TM 021 255 AUTHOR TITLE - files.eric.ed.gov · An empirical approach is adopted in this...
DOCUMENT RESUME
ED 367 716 TM 021 255
AUTHOR Wang, Jianjun; Stayer, John R.TITLE An Empirical Approach toward the Prediction of
Students' Science Achievement in the United Statesand the Peoples' Republic of China.
PUB DATE Apr 94NOTE 34p.; Paper presented at the Annual Meeting of the
American Educational Research Association (NewOrleans, LA, April 4-8, 1994).
PUB TYPE Reports Evaluative/Feasibility (142)Speeches/Conference Papers (150)
EDRS PRICE MF01/PCO2 Plus Postage.DESCRIPTORS *Academic Achievement; Background; Comparative
Analysis; Context Effect; Cross Cultural Studies;Culture; Factor Analysis; ForeiRn Countries; HighSchools; High School Students; Liternational Studies;Models; Multivariate Analysis; *Prediction;*Sciences; Sex Differences; Social Influences;Student Attitudes
IDENTIFIERS *China; Effort; Empirical Research; ScienceAchievement; Second International Science Study;Statistical Analysis System; *United States
ABSTRACT
An empirical approach is adopted in this paper toexplore a possible model for prediction of students' scienceachievement in China and the United States. Construction of the modelis based on the ninth-grade data base from Phase 2 of the SecondInternational Education Association Science Study (SISS) in theUnited States and the SISS Extension Study (SES) in Hubei province inChina. The common independent variables of science achievement areclassified into gender, attitude, home background, classroomexperience, and personal effort, according to the distinction betweenvisible and latent characteristics and scree plots fromprincipal-components analysis. Latent factors are represented by thefirst principal components in each of the four latent catnories ofstudent attitudes, home backgrounds, classroom experience, andpersonal effort. Predictors of the model are constructed bypolynomials of the visible and latent factors and their interactionsin a multivariate Taylor series. Significant predictors at thek.ipha=0.05 level aro selected through a backward eliminationprocedure in the Statistical Analysis System. The structure of thefour latent factors and the model complexity have been comparedbetween the two countries in terms of their educational, political,social, and cultural contexts. Eight tables and two figures areincluded. (Contains 45 references.) (Author/SLD)
***********************************************************************
Reproductions supplied by EDRS are the best that can be madefrom the original document.
***********************************************************************

An Empirical Approach toward the Prediction of Students' Science Achievement inthe United States and the Peoples' Republic of China
U.S DEPARTMENT OF EDUCATION(Deice of Edhcahonai Research ana improvement
EDUCATIONAL RESOURCES INFORMATIONCENTER ;ERIC,
dOCument has been reproduced as
received from the perSOn Or organitationoriginating it
r minor changes hare been made to improve
reprOduCtoOn Quality
Points of vier. Of opinions stated frS dope
ment do not necessarily represent ollrcialOERI OOSot.On or oohcy
Jianjun WangDepartment of Teacher Education
School of EducationCalifornia State University, Bakersfield
Bakersfield, CA 93311-1099
John R. StayerCenter for Science Education
College of EducationKansas State University
Manhattan, KS 66506
PERMISSION TO REPRODUCE THISMATERIAL HAS BEEN GRANTED BY
J #9/trz'
TO THE EDUCATIONAL RESOURCESINFORMATION CENTER IERIC).-
Running Head: Empirical Model
Paper presented at the 75th Annual Meeting of American Educational Research Association, April4-9, 1994, New Orleans, Louisiana.
2BEST

Empirical Model2
Abstract
An empirical approach is adopted in this paper to explore a possible model for prediction of
students science achievement in China and the United States. Construction of the model is based
on the ninth grade data base from the Phase II of the Second IEA Science Study (SISS) in the
United States and the SISS Extension Study (SES) in Hubei province of China. The common
independent variables of the students' science achievement are classified into five categories,
students' gender, attitude, home background, classroom experience, and personal effort, according
to the distinction between visible and latent characteristics, and scree plots from principal
component analyses. Latent factors are represented by the first principal components in each of
the four latent categories, students' attitudes, home background, classroom experience, and
personal effort. Predictors of the model are constructed by polynomials of the visible and latent
factors and their interactions in a multivariate Taylor series. Significant predictors at cc = .05
level are selected through a backward elimination procedure in Statistical Analysis System (SAS).
The structure of the four latent factors and the model complexity have been compared between the
two countries in terms of their educational, political, social and cultural contexts.
Empirical Model3
An Empirical Approach toward the Prediction of Students Science Achievement inthe United States and the Peoples' Republic of China
The development of prediction models for assessing students' science achievement is a
fundamental question in science education (Dryden, 1987). Yet, no prediction model is uniformly
supported by theories. The structure of the model may also vary across countries, depending
on their cultures, social systems and schools. The purpose of this comparative research is to
explore a possible empirical model for prediction of students' science achievement in China and the
United States.
Rationale
The United States of America (USA) and the People's Republic of China (PRC) are two
leaders in the world community. Almost equal in land area, China has nurtured the largest
population in the world, and the United States has developed the most advanced industrial and
technological civilization. While the economy of the United States has been the largest for more
than a hundred years, it has been predicted that China may replace the position of the United
States by the turn of this century (Mitchell, 1994). Currently, few countries play roles similar to
the United States and China. As a result, China and the United States were chosen in this study
to conduct an international comparison.
In spite of various international differences, national development in both the U.S. and
China is essentially based on the effectiveness of their education, especially in the area of
mathematics, science and technology. Purves (1987) pointed out: "To look at the effectiveness of
any system, one needs to get beyond it" (p.27). Under the assumption that coimtries can learn
from each other, this comparative study between China and the United States may provide
valuable information for improving the prediction of Chinese and American students' science
achievement.
4
Empirical Model4
Most prediction models in education postulate a linear relationship between student science
achievement and related personal, school, or social predictors (Sockloff, 1976). At least two major
reasons exit for using a linear model. First, a linear model is simple. Since no other models have
been consistently supported by theories in science education, it is tempting to choose the simplest
one, a linear model, in a preliminary exploration. Second, a large number of alternatives to a
linear model exist. Each alternative is based on a non-linear function, and it is impossible to
verify all the potential nonlinear functions in a comparative study.
Nevertheless, a linear model is not a panacea. Several researchers have reported nonlinear
relations between measures of achievement and direct and/or proxy measures of classroom
practices (e.g., Brophy & Evertson, 1974; Loucks, 1975; Rim & Co ller, 1978; Soar, 1966, 1968,
1971, 1973; Soar & Soar, 1972). Flanders (1970) indicates that "the main credit for identifying
and conceptualizing nonlinear (or curvilinear) relationships belongs to Soar" (p. 403). Soar and
Soar (1976) claim:
Although linear relationships have most often been used in studies of teaching effectivenessto identify relationships between classroom behavior and pupil gain, it seems clear thatthey are limited in the extent to which they can help us answer the question of what goodteaching is. They are simplistic in implying that if some of a behavior is good, more isbetter and once the question is raised, it becomes difficult to imagine very many behaviorsfor which increasing amounts would be unqualifiedly good. (1).265)Nonlinear relations were found between measures of achievement gain and measures ofteacher behavior which appeared to represent teacher limitation of pupil freedom in thedevelopment of subject matter and thought. (p.263)
Best and Kahn (1993) point out:
Only within the last century has tne methodology of science been applied to the study ofvarious areas of human behavior. (p.7)By attempting to apply the rigorous, systematic observation and analysis used in thephysical and biological sciences to areas of social behavior, the social sciences have grownand have advanced humanity's knowledge of itself. (p.7)
In physical and biological sciences, whenever a problem has no theoretical solution in sight,
experiments are conducted and theoretical explanations are pursued based on the empirical
5

Empirical Model5
results. A similar situation exists in the prediction of student science achievement. Accordingly,
an empirical approach is taken in this study to compare the international differences in the model
of prediction.
Mathematically, under the condition of the Taylor Theorem (Ayres, 1964), functions of
prediction models, linear or nonlinear, can be expressed as a Taylor polynomial series. For
example, a linear function:
a*x+b=b+a*x+0*x2+0*x3+0*x4+
and nonlinear functions:
and
ex=i +x+-21-+11_"- +21 31 41
ex=1 +X+fIL-+:1-.+ +21 31 41
COS(X)=1 -X2 4.X4 x621 41 61
In(1 +x)=x--X2 +X3 __X4
2 3 4
arosin(x)-x+ +1 *.T3 1 *3*X32 *3 2*4*5
3 X5arctan(x) =x X
+-1- -X7 +
Hence, the exploration of empirical models is simplified to the identification of a set of polynomial
coefficients. It has been proved in calculus that within a region of convergence, a truncated Taylor
series provides a good approximation of the original function (Ayres, 1964).
6
Empirical Model6
The validity of an empirical approach depends on two conditions. First, one needs well-
designed data sets which include the necessary information about the research variables. Second,
the data must contain a large w.unber of observations to estimate the coefficients of high degrees of
polynomials and interactions. These two conditions served as a benchmark in the selection of the
empirical data base.
Data Selection
Walberg (1983) has pointed out: " The best and perhaps only test data that permit reliable
international comparisons of science achievement were obtained by the International Association
for the Evaluation of Educational Achievement " (p.6). The International Association for the
Evaluation of Educational Achievement (IEA) is an international research organization. Members
of IEA are major educational research institutions from each participating country. The broad
purpose of the IEA research is to study the relationship between relevant input factors in social,
economic, and pedagogical realm and output as measured by performance on international tests
measuring both cognitive and non-cognitive outcomes (Postlethwaite, 1974). According to Husen
(1987), "The association has been one of the most influential research efforts in the history of
educational research, and it certainly has done the best known international research on
education" (p.29).
The most recent IEA data in science education were collected through the Second IEA
Science Study (SISS), an international project designed to provide an overview of science education
across the world (Keeves & Rosier, 1981). The project started in 1981 and involved twenty-three
countries. The survey was conducted at three population levels: 5th grade; ath grade; and 12th
grade (Jacobson & Doran, 1988). The development of the international instruments for each
population was a collaborative effort involving all participating countries to ensure the fairness of
cross-national comparisons.
Both China and the United States participated in the SISS project. The results are
7

Empirical Model7
presented in a three-volume IEA publication (Rosier & Keeves, 1991; Postlethwaite & Wiley, 1992;
and Keeves, 1992). Unfortunately, as a reviewer stated (Gottfried, 1993), "these volumes do
not follow a format that helps the reader make sense of the study" (p.328).
In the United States, SISS was conducted in two phases. In preparing the three-volume
publication, the U.S. SISS advisory panel directed that only the data from the Phase II SISS
survey in 1986 be used as the student data in the IEA international comparisons (Postlethwaite
& Wiley, 1992). However, this direction has not been followed through the data analysis process.
The following paragraph is quoted from the second volume of the IEA publication:
This "direction" was followed but it created two problems: the first was that multivariateanalyses for the United States became virtually impossible because many variables werenot administered in the second round of testing, since no rotated tests were employed atPopulations 1 and 2, and several items were dropped from the biology, chemistry, andphysics tests. Hence, the "direction" could not be followed for all data analyses as it wouldhave eliminated comparisons involving the United States. In the cases where these datawere used, the purpose was not to estimate population means or proportions, but to explorevariability and assess relationships of particular student and school characteristics toachievement. (Postlethwaite and Wiley, 1992; p.'7)
On the other hand, SISS in China was named the "SISS Pilot Study" because the survey
was conducted only at the 9th grade level in three large cities, Beijing, Tianjin and Taiyuan
(Rosier & Keeves, 1991). The primary objective of the SISS Pilot Study was to help Chinese
researchers to understand the IEA methodology. The survey results, however, do not reflect the
nature of Chinese science education since the population in rural regions has been excluded in the
sample design.
In 1988, the China IEA Center modified the IEA instruments and launched a SISS
Extension Study (SES) at the 9th grade level in seven provinces. Coincidentally, the same IEA
instruments had been revised in the U.S. in 1986 for the Phase II SISS survey. Common
instruments of the Phase II SISS and SES which included almost all Phase II SISS student
variables (Humrich, 1988) are listed in Table 1. According to a representative of the National

Empirical Model8
Science Foundation, the data collected from the revised instruments have the quality for the IEA
international assessment (Postlethwaite and Wiley, 1992).
Table 1 inserted around here
It should be noted that SES was originally designed for an inter-province comparison or a
province-other country comparison. Each of the seven provinces in China was treated as an
independent system. Hence, there is no legitimate method for integrating the survey over the
seven provinces. To use the SES data for an international comparison, one of the provinces must
be identified to represent the Chinese situation.
In China, the eastern and southern areas are more developed than the northern and
western areas. On balance, a central province is more representative of the entire country than a
boundary province. Among the SES seven provinces, Hubei province is the only one located in the
central region of China. Thus, the data from Hubei province is chosen in this research to
represent the Chinese situation in 1988.
In summary, as suggested by the United States SISS advisory panel, the Phase II SISS is
better than the Phase I SISS. On the other hand, compared to the SISS Pilot Study, the SES has
at least two advantages: (1) The SES data were collected in both urban and rural regions; (2) The
population in each province is larger than the population of the SISS Pilot Study. Hence, the
China SES and the U.S. Phase H SISS data provide the best opportunity to compare school science
education between the two countries.
The research presented in this paper is based on the SES and Phase II SISS data sets.
Although at least thirteen dissertations (Chandavarkar, 1988; Chang, 1988; Clive, 1983; Dryden,
9

Empirical Model9
1987; Ekeocha, 1986; Ferko, 1989; Humrich, 1988; Kanis, 1988; Micik, 1986; Miller, 1985; Baker,
1989; Bayer, 1990; O'Rafferty, 1991) have examined on the U.S. SISS project, none of the studies
explored an empirical polynomial model for prediction of students science achievement. On the
other hand, the SISS Extension Study (SES) was a national project conducted by the China lEA
Center, and the data have not yet been forwarded to the IEA International Headquarters. The
first author was a member of the Chinese IEA team and participated in the first two stages of the
SES survey, population investigation and data collection. The present research is the first report
in which the SES data base is employed in the construction of an empirical model. Because the
SES and Phase II SISS data sets contain a large number of observations and appropriate research
variables, they fulfill the two conditions, large and informative data, necessary for the construction
of potentially valid empirical models of prediction.
Two limitations are embedded in this study. First, this empirical study is based on the
common instruments of SES and Phase II SISS at the ninth grade level. The two-country
comparison is not concurrent because the U.S. data were collected in 1986 while the Chinese data
were collected in 1988. Inaccuracy may also result from the fact that the Chinese information is
represented by the SES data in Hubei province. The construction of empirical models has been
confined within the common variables of the SES and Phase II SISS projects, and other variables
not present in the two data bases can not be taken into the consideration.
Second, results of this empirical study should be considered as preliminary, open to
multiple interpretations, and perhaps difficult to interpret . Differences or difficulty of interpre-
tation may be due to the instability of the results, mis-codings in the data, and confounding
variables which were not considered in SES and Phase II SISS, or are even unknown in nowadays.
Thus, the exploratory results presented herein need further empirical reconfirmation. Only those
that are consistently reconfirmed by follow-up empirical studies form the foundation of sound
interpretation and theoretical explanation. While the exploratory interpretations made in
I 0

Empirical Model10
this paper represent the authors best knowledge, and may provide information to improve future
empirical studies, readers are urged to exercise caution due to possible statistical artifacts and post
hoc fallacies.
Research Questions
To fully utilize the information collected in SES and Phase II SISS, all common variables of
the two projects are employed in this study to construct empirical models for prediction of the
students' science achievement. Presented in Table 1, these variables are related to six aspects,
gender, attitude, home background, classroom experience, personal effort, and science achievement.
To date, no theoretical solutions have been reported regarding the integrated effects of the first
five aspects, linear or nonlinear, on students' achievement. In an empirical exploration, neither
linear nor nonlinear relations should be imposed as a pre-condition on the model of prediction.
Instead, the first five aspects are treated as five factors, and a unified Taylor series (Ayres, 1964),
including linear and nonlinear models as special cases, is adopted as a mathematical function in
the model construction. The questions that guide this research are:
1. What are the linear or nonlinear factors and their interactions which have significant effects on
the students' science achievement?
2. Do differences exit between the United States and China in terms of the factor structures and
interpretations?
3. Do differences in complexity exist between the Chinese and American models, and can the
differences be explained based on differing educational, political, social and cultural context in
each country?
Methods
The factors affecting students' science achievement can be characterized as visible, such as
ii

Empirical Model11
gender, or latent, such as students' attitude, classroom experience, home background and personal
effort. Latent factors which are not directly measurable may be interpreted through students'
responses to certain related questions. These questions are called indicators of the latent factors
(Joreskog & Sorbom, 1984). Statistically, the first principal component, which accounts the largest
proportion of the indicator information, is recommended to represent a latent facto: 1982).
The total number of appropriate latent factors is called the dimension of latent pr,:ie,,,e-;ion
The indicators of students' attitude, classroom experience, home background, a; 1 sonal eaort
are listed in Table 2. Thus, the dimension of the latent prediction space identit ed by the total
number of latent factors is 4 in this study. These latent dimensions are yet to be reconfirmed
through the examination of multicolinearity using the SES and Phase II SISS data sets.
Table 2 inserted around here
In general, when a factor is nearly a linear combination of other factors, the affected
estimates are unstable and have high standard errors. This situation is known in statistics as
multicolinearity (SAS, 1982; p. 54). Jagodzinski, Weede and Tiefenbach (1981) pointed out: "Even
in second-order polynomial regression there are some problems; often there is extreme
multicolinearity between simple and squared terms" (p. 447). Liu (1981) studied multicolinearity
in her dissertation. She suggests principal component regression as a means of ameliorating the
adverse effect of linear dependencies in a polynomial regression model. The potential
multicolinearity of latent factors is examined in this study by scree plots from the principal
component analysis in SAS. If none of the factors is a linear combination of others, the latent
dimension identified by the indicators of the four factors should be no less than 4. Otherwise, the
data matrix of the latent factors is singular, and multicolinearity occurs (Graybill, 1976).
12

Empirical Model19
Without pre-conditions of linear or nonlinear models, the effects of the five factors, visible
or latent, on students science achievement are investigated using a multivariate Taylor series.
A multivariate Taylor series is illustrated through the following bivariate Taylor series (e.g.,
Franklin, 1944):
f(x.30 = Auo Aiox AoiY A20x2 4' Ai ixY Ao2Y2
where x and y are factors of the dependent variable f(x,y), and A00, Am, Ao ..., A, ... are Taylor
coefficients. It is apparent in the multivariate Taylor model that predictors of the dependent
variable f(x y) are polynomials (x, y, x2, y2, ...) and interactions (xy, ...) of the two factors, x
and y. The Taylor coefficients (A00, Am, Apq, ...) are estimated through least square
regression. A linear model corresponds to the case when the values of Am's (p+q>1) equal zero,
while a nonlinear model of prediction contains the effects of higher degrees of polynomials or
interactions. Hence, a multivariate Taylor model includes linear and nonlinear models as special
cases, and the highest degree of the polynomials or interactions indicates the appropriateness of
linear and nonlinear models.
Graybill (1976) further states: "We assume that the degree of the polynomial 1_L(x) is less
than or equal to K, and the problem is to determine the exact degree" (p. 303). Based on the
common variables of SES and Phase II SISS, predictors of students' science achievement are
polynomials of the five factors, gender, attitude, classroom experience, home background, and
personal effort, and their interactions. To obtain a good approximation, higher order polynomials
and interactions are included in the exploratory model until the degree of (K+1) is reached, at
which the higher order predictors are no longer significant at a = .05 level. K, then, is the highest
degree of polynomial in the prediction model. Significant predictors of the model are selected
from all possible polynomials and interactions which have degrees less than or equal to K.
To facilitate construction of models, three adjustments have been made on the SES and
13

Empirical Model13
Phase II SISS data bases. First, the attitude scales (ATT05-36) are recoded as: agree = 1,
uncertain = 0, and disagree = -1, and are treated as an interval scale. Second, parents' education
(P_ED) is defined as: P_ED = max (FPOSTED, MPOSTED), the highest level of father's and
mother's education. The variable of parents' education is used to replace FPOSTED and
MPOSTED as an indicator of students' home background. Third, the visible factor, SEX, is recoded
as: female =0 and male =1. The advantages of this recoding are: (1) SEX can be used as a dummy
variable for regression; and (2) the polynomial model is simplified because (SEX)n=(SEX) for any
integer n.
Table 3 insertsd around here
Deletion of missing values is summarized in Table 3. The designed sample sizes of SES
and Phase II SISS are proportional to the students' populations. The achieved samples are created
by deleting cases which have missing values for the common variables in Table 1. In both the U.S.
and Chinese data sets, the percentage of missing values is less than 20%, and the achieved sample
in each country contains more than 2000 students. Thus, in this exploratory study, the missing
values are deleted from the SES and Phase II SISS data sets.
Results
Dimension of Latent Prediction Space
Dimension of the latent prediction space is empirically identified by scree plots through the
mil Jai component analysis in Statistics Analysis System (SAS). Information on indicators is
rcp_ esentod by a set of orthogonal principal components. By default, SAS treats the principal
14
Empirical Model14
components which have eigenvalues greater than 1 as information and the remaining components
as noise. A disadvantage of this default option is that the eigenvalues of some principal
components may be so close to 1 that it is not appropriate to set the threshold among them. In a
s ree plot, eigenvalues are plotted for each principal component. Hence, a clear-cut threshold can
be selected to differentiate principal components between information and noise. The dimension of
the latent space is determined by the total number of orthogonal principal components identified to
represent information of the indicators.
Scree plots for the Phase II SISS and SES surveys are presented in Figures 1 and 2
respectively. Inspection of both figures shows that the fourth, fifth and sixth principal components
have eigenvalues around 1, and the differences of eigenvalues between the fourth and fifth
principal components is larger than the difference between the fifth and sixth principal
components. Hence, the dimension of the latent prediction space is four based on the Chinese and
U.S. data sets. This result reconfn-ms the fact that four latent factors exist among the common
variables of SES and Phase II SISS.
Figure 1 inserted around here
Figure 2 inserted around here
Structure of the Four Latent Factors
The indicators are categorized into four groups in Table 2 based on the contents of these
items. The first principal component is calculated for each group of indicators, and the structure of
15

Empirical Model15
the latent factors is expressed by factor loadings of the indicators on their corresponding first
prircipal component. The factor loadings calculated from the U.S. and Chinese data sets are listed
in Table 4.
Table 4 inserted around here
Significant Predictors of the Empirical Model
Predictors of the empirical model are the polynomials and interactions of the visible and
latent factors, gender, attitude, classroom experience, home background and personal effort. The
criterion of selecting significant predictors has been set at a = .05 level. Only those predictors
which have regression coefficients significantly differing from zero are retained in the model. The
coefficients of regression are estimated through the backward elimination procedure in SAS. The
empirical model based on the American data contains significant predictors up to and including the
fifth degree of polynomial. On the other hand, no significant predictors beyond the fourth degree
of polynomial are found significant in the Chinese model. Hence, the highest degree of predictor is
4 for the Chinese model, and 5 for the U.S. model. The significant predictors of polynomials and
interactions are listed in Tables 5 and 6, respectively.
Table 5 inserted around here
Table 6 inserted around here
16

Empirical Model16
Summary_
Indicators of latent factors in the common instruments of SES and Phase II SISS are
classified into four groups, attitude, classroom experience, home background and personal effort.
The four dimensions of latent prediction space are confirmed by the scree plots from the principal
component annlysis. The latent factors are represented by the first principal components in each
of the four latent dimensions. Predictors of the model are constructed by polynomials of the visible
(gender) and latent factors and their interactions in the multivariate Taylor series. Significant
predictors at a = .05 level are selected through a backward elimination procedure in Statistical
Analysis System (SAS). The Chinese and American predictors in Tables 5 and 6 are summarized
in equations (1) and (2):
Y = Poc 131c*C 132c*E + 133S + 13.1c*(E2) 05,*(H2) + 1 *(5*H*C) + 137,*(H*A*E) +ps,*(H*E.C) i39,*(C2.A) p(A3.$) plies(C3.$)
Y = Pou PlusA 132.*E + [33*/-1 + 134u*S + P5u*(C2) + 13Gus(H2) + 37,*(E8) + [38*(E4) +
Pou*(E5) + 1310.*(H'E) + Pn.*(S *Az) + P12.*(S*C2) + 1313.*(S`H*A) 1314t1*(S*FitE) +
1315,*(I-I2*A) + Pm."(A2*C) + 3 ous(C2*E) + i318u*(E3*C) + P*(5"1-12$A) +f3211.(sFr*A2)
(1)
(2)
where y represents the students science achievement, and S, H, E, A, C, 13ic and 13). are defined in
the footnotes of Tables 5 and 6.
The number of significant predictors constructed by the five visible or latent factors is
listed in Table 7.
Table 7 inserted around here
17

Empirical Model17
Discussion
The focus of this comparative research is the identification of significant predictors of
students' science achievement based on the common variables of SES and Phase II SISS. Since no
theoretical solution to this problem is in sight, an empirical approach was adopted to construct
exploratory models. The results of the American and Chinese models can be classified into
consistent and inconsistent categories. The consistent part is discussed in this section, and the
inconsistent part, which needs further investigations, is highlighted at the end of this discussion.
The significant items of the empirical Taylor series at a = .05 level are called the predictors
of students' science achievement constructed by the polynomials and interactions of the students'
visible factor, gender, and latent factors, attitude, home background, personal effort, and classroom
experience. The structure of the four latent factors is presented by factor loadings in Table 4. It is
interesting to note in this table that the corresponding factor loadings between the U.S. and China
have the same positive or negative signs. Thus, the structural differences between the Chinese
and American predictors are in their magnitudes rather than directions. The similarities and
differences of the empirical models are discussed in this section in terms of the educational,
political, social, and cultural contexts in each country.
Latent Factor Structures
The structures of the latent factors are expressed by factor loadings in Table 4. The first
common point to note is that the factors of home background and personal efforts have two
indicators, and are represented by their first principal component. In a two-indicator principal
component analysis, the axis of the first principal component is set at a direction of 450 to each
indicator axis. Accordingly, the factor loading of either indicator is: sin(45°) = cos(45°) = 0.707, i.e.,
18
Empirical Model18
the two indicators are weighted equally in the construction of their latent factor. Hence, the
identical factor loadings of the two factors in both China and the U.S. are caused by the principal
component definition in the two-indicator cases rather than the actual situations of the two
countries.
The other two latent factors, students attitude and classroom experience, have more than
two indicators. Their factor loadings reflect the relative contributions of each indicator to the
corresponding latent factor. Thus, the interpretation of the factor loadings in this section focuses
only on the factors of student& attitude and classroom experience.
In the U.S. model, indicators which have the largest contributions to the students' attitudes
are the students' interest in science (Table 4: P_ATT34) and their feelings of enjoying school
science experience (Table 4: P_ATT35). This result is also supported by the Chinese data (Table
4). In addition, attitudes of the Chinese students are strongly represented by their school pressure
(Table 4: P_ATT06). In both countries, teachers' demonstrations and students' experiments are
important science activities (Table 4: P2DES08 and P2DES18). But, the effects of these activities
in China are not as strong as in the United States in determining the factor of classroom
experience. A more important contribution in China comes from students' tests (Table 4:
P2DES14).
Schools in China are classified as key schools and general schools. A major criterion of the
classification is the number of students in each school who have passed the National College
Entrance Examination. No matter what kind of pressure exists on a school, if many students in
that school can pass the examination, the school will be promoted as a key school. This is
consistent with what Deng, Xiao-ping said, "It does not matter whether a cat is white or black as
long as it catches rats".
In a centralized educational and political system, examination of students is a feasible
19

Empirical Model19
method of avoiding corruption in students' admission to higher education. The Chinese
government takes great care to eliminate cheating on the National College Entrance Examination.
As a result, students must pass the examination in order to pursue formal higher education
regardless of parents power and influence. According to the wisdom of Chinese educators, the best
way to cope with the examination is to give students difficult tests in secondary education. Hence,
the pressure of students' tests as the highest factor loading on Chinese classroom experience is
readily explained.
In both the U.S. and China, teachers' demonstrations and students' experiments are
important laboratory activities in science education. Nevertheless, in China it is impossible to
provide a sufficient amount of laboratory equipment to simultaneously measure the experimental
skills of millions of high school graduates in the National College Entrance Examination. Thus,
this important examination is a paper-pencil test, and does not require experimental skills to
achieve good scores. Moreover, China is a developing country and many schools, especially in rural
areas, do not have well equipped teachin4 laboratories. Compared to the U.S. model, the lack of
equipment and the pressure of school examination appear to be major reasons for the smaller
loading of the laboratory activities on the Chinese classroom experience.
Relative Complexity of the Models
The predictors of students' science achievement are constructed by polynomials and
interactions of gender, attitude, home background, personal effort and classroom experience. The
model complexity is shown in Table 8 in terms of the numbers and highest degrees of these
predictors. Inspection of Table 8 shows that the American model contains more significant
predictor, and has higher degrees of polynomials or interactions. Hence, the American model is
more complicated than the Chinese model. The interpretation of differences in complexity in this
paper is based on the differing social and cultural contexts in each country.
20

Empirical Model20
Table 8 inserted around here
The United States is a country populated by people from all over the world. The
compulsory education enforced in the U.S. requires school-age children from various cultural
backgrounds to complete their education at no less than the ninth grade level. Although
education is compulsory, not all U.S. students perceive an equal opportunity to learn. Coleman,
Campbell, Hobson, McPartland, Mood, Weinfeld and York (1966) found that many minority
students felt that somebody blocked them from success, even though they had the ability to learn_
Also, the authority to determine the school curricula is the responsibility of individual school
districts or communities. In summary, a heterogeneous student population and diversified
curricula are two variables which increase the complexity of predicting students science
achievement in the United States.
On the other hand, China has been a unified country since 221 B.C.. About ninety-four
percent of Chinese populacion is Han nationality. "China" in Chinese means "the middle
kingdom". It has been said that the Chinese people were the descendants of a dragon and their
Emperor was the son of the God. The national minorities in remote areas were ruled by courtiers
of the Emperor, and have been assimilated as members of the Chinese family after age-long
cultural communications. The feudal system was not abandoned until the beginning of this
century. The cultural foundation of Chinese feudalism is Confucian philosophy. Confucius
stressed that those who study mentally should govern the people who work physically, and those
who work physically should serve the people who study mentally. Under this cultural background,
education is a vehicle to promote the social status of a family.
Improvement of education is also closely tied to the development of the Chinese economy.
Because the feudal social system impeded Chinese economic development for more than 2000
21

Empirical Model21
years, China remains a third world country in many aspects. For example, compulsory education
has not yet been fully enforced in China. In 1988, less than half of the children finished their
middle school education. Those who studied at the ninth grade were selected through the regional
Middle School Entrance Examinations. Thus, the Chinese model of prediction is based on the
information from a more homogeneous cohort of selected middle school students.
Moreover, authority to determine Chinese school curriculum belongs to the central
government. The natkmal curriculum has an effect of standardizing the school science education
over the country. Hence, it is understandable that the Chinese model is less complicated given the
unified culture, selected students, and standardized curriculum.
Inconsistent results between the two countries may result from empirical errors, essential
international differences and confounding factors which have not been included in construction of
the model. It is interesting to note in Table 7 that the numbers of significant predictors are
different in the Chinese and U.S. models. Because the predictors are constructed by the five
different factors and are measured on different scales, the larger regression coefficients do not
necessarily imply greater contributions to the students' science achievement. The contribution of
each factor depends on the regression coefficients and the scales of the predictors constructed by
the polynomials and interactions. Further questions identified by this research and subject to
future empirical investigations are:
1. Can the empirical models be further simplified to improve the comparative interpretation?
2. Will specific structures of the significant predictors re-appear in future IEA surveys?
3. Do the factor loadings and model complexity in the two countries have additional physical
meaning?
Graybill (1976) points out:
One of the difficulties with the all regression procedures, in addition to the high amount ofcomputation that is required if K is large, is the interpretation of the results. If one
22
Empirical Model22
computes all possible multiple correlation coefficients, it is an immense task to interpretthem. (p.449)
Although not all the empirical results are readily interpretable, the tentative
interpretations made in this paper may facilitate the development of better empirical models in
future. It is the authors belief that the prediction of students' science achievement in the United
States and the Peoples' Republic of China can be improved through continuing efforts on the
construction and interpretation of empirical models in each country.
23
Empirical Model23
References
Ayres, F. (1964). Theory_ an_d_p_roblems of differential and inteiTal_calculus. NY: SchaumPublishing.
Baker, R (1989). Science achievement of non-science students. Doctoral Dissertation. NY:Teachers College, Columbia University.
Best, J. W. & Kahn, J. V. (1993). Research in Education. Boston: Allyn and Bacon.
Bayer, S. L. (1990). Factors in the school environment associated with student achievement inscience. Doctoral Dissertation. NY: Teachers College, Columbia University.
Brophy, J. E. & Evertson, C. M. (1974). Process-product correlations in the Texas TeacherEffectiveness Study: Final Report. Austin, Texas: University of Texas.
Chandavarkar, M. S. (1988). The teaching and learning of physics in the United States. DoctoralDissertation. NY: Teachers College, Columbia University.
Chang, E. Y. (1988). Science education in the 1970s and 1980s: what changes have taken place?Doctoral Dissertation. NY: Teachers College, Columbia University.
Clive, T. (1983). The trial testing of items and instruments for the Second International ScienceStudy: an analysis of results to verify the cumulative hierarchical nature of Bloom'staxonomy of educational objectives (cognitive domain). Doctoral Dissertation. NY:Teachers College, Columbia University.
Coleman, J. S., Campbell, E. Q., Hobson, C. j., McPartland, J., Mood, A. A., Weinfeld, F. S., &York, R- L. (1966). Equality of educational opportunity (Report from the Office ofEducation). Washington, DC: U.S. Government Printing Office.
Comber, L. & Keeves, J. (1973). Science education in nineteen countries. NY: John Wiley & Sons.
Dryden, M. (1987). Modeling classroom environment: an analysis of achievement at the ninthvade level. Doctoral dissertation, State University of New York, at Buffalo.
Ekeocha, E. (1986). Correlates of science achievement: a U.S. study of fifth Rrade students.Doctoral dissertation, State University of New York, at Buffalo.
Ferko, A. (1989). An analysis of achievement test scores and some associated findings of theSecond IEA Science Study. Doctoral Dissertation. NY: Teachers College, ColumbiaUniversity.
Franklin, P. (1944). Methods of advanced calculus. NY: McGraw-Hill Book.
Gottfried, S. (1993, August). The IEA study of science, vols. 1, 2, and 3. Comparative EducationReview, 37 (3), 327-329.
Graybill, F. A. (1976). Theory and application of the linear model. Pacific Grove, CA: Wadsworth& Brooks/Cole Advanced Books & Software.

Empirical Model24
Humrich, E. (1988). Sex and science achievement. Doctoral Dissertation. NY: Teachers College,Columbia University.
Husen, T. (1987). Policy impact of IEA research. Comparative Education Review, 31 (1), 29-46.
Jacobson, W. & Doran, R. (1988). Science achievement in the United States and sixteen countries:a report to the public. NY: Teachers College, Columbia University.
Jagodzinski, W., Weede, E. & Tiefenbach, H. (1981). Testing curvilinear propositions bypolynomial regression with particular reference to the interpretation of standardizedsolutions. Quality and Quantity, 15 (5), 447-463.
Joreskog, K. & Sorbom, D. (1984). LISREL VI. Mooresville, Indiana: Scientific Software.
Kanis, I. (1988). An analysis of the science process practical examination administered to gradefive and grade nine students in the United States of America. Doctoral Dissertation. NY:Teachers College, Columbia University.
Keeves, J. & Rosier, M. (1981). Guidelines for the Second IEA Science Study (IEA/SISS/4).Australia Council for Educational Research. Hawthorn, Victoria 3122, Australia.
Keeyes, J. (1992). The IEA Study of Science III: changes in science education and achievement:1970 to 1984. NY: Pergamon Press.
Liu, Hsiao-Ling (19E1). Biased estimation in polynomial regression. Doctoral Dissertation. TheUniversity of Alabama.
Loucks, S. F. (1975). A ctlady of the relationship, between teacher level use of the innovation ofindividualized irkiteuction and student achievement. Doctoral Dissertation. AustimUniversity of Texas.
Micik, J. (1986). Science achievement in an American school: a case study. Doctoral Dissertation.NY: Teachers College, Columbia University.
Miller, J. K. (1988). An analysis of sr..V.:nce curricula in the United States. Doctoral Dissertation.NY: Teachers College, Columbia University.
Mitchell, C. (1994, January 18). Business report: on international business. The AtlantaConstitution, pp. 2.
O'Rafferty, M. H. (1991). A descriptive analycis ofserformance of grade 9 pupils in the UnitedStates on practical science tasks. Doctoral dissertation, State University of New York, atBuffalo.
Purves, A. (1987). The evolution of the lEA: a memoir. Comparative Education Review, 31 (1),27.
Postlethwaite, T. N. & Wiley, D. E. (1992). The IEA Study of Science II: science achievement intwenty-three countries. NY: Pergamon Press.
Postlethwaite, T. N. (1974). Introduction. Comparative Education Review, 18 (2), 157-163.
9 5

Empirical Model25
Rim, D. & Co ller, A. R. (1978). In search of nonlinear process-product functions in existingschooling effects data: a reanalysis of the first grade reading and mathematics data fromthe Stallings and Kaskowitz Follow Through Study. ERIC: ED179289.
Rosier, M. & Keeves, J. (1991). The IEA Study of Science I: science education and curricula intwenty-three countries. NY: Pergamon Press.
SAS (1982). SAS user's guide: statistics. Cary, NC: SAS Institute.
Soar, R. S. (1966). An integrative approach to classroom learning. Philadelphia, PA: TempleUniversity.
Soar, R. S. (1968). Optimum teacher-pupil interaction for pupil growth. Educational LeadershipResearch Supplement I, 275-280.
Soar, R S. (1971). Follow-Through classr:Jom process measurements. Gainesville, FL: Institute forDelivlopment of Human Resources, University of Florida.
Soar, R. S. (1973). Follow-Through classroom process measurement and pupil growth (1970-71):final report. Gainesville, FL: College of Education, University of Florida.
Soar, R S. & Soar, R M. (1972). An empirkal analysis of selected follow through programs: anexample of process approach to evaluation. In I. J. Gorden (Ed.), Early ChildhoodEducation. Chicago: National Society for the Study of Education.
Soar, R S. & Soar, R M. (1976) An attempt to identify measures of teacher effectiveness from fourstudies. Journal of Teacher Education, 27, 261-267.
Sockloff, A. (1976). The analysis of nonlinearity via linear regression with polynomial and productvariables: an examination. Review of Educational Research, 46 (2), 267-291.
Walberg, Fl. J. (1983). Scientific literacy and economic productivity in international perspective.Scientific Literacy. Issued as Volume 112, Number 2 of the proceedings of the AmericanAcademy of Arts and Science.
Walker, D. (1976). The IEA six subject survey: an empirical study of education in twenty-onecountries. NY: John Wiley & Sons.
6

Table 1
Common Instruments of SES and Phase 11 SISS
Variable Instrument
SEX What is your sex? (A) male; (B) female.
FPOSTED What is the highest level of school your father completed?
MPOSTED What is the highest level of school your mother completed?
HOMEBOOK How many books are there in your home?
HMWKALL About how many hours a week do you usually spend on homework or other schoolwork out of ciass for all subjects?
HM WKSC I
P_ATTO5
P_ATTO6
P_ATT34
P_ATT35
P_ATT36
P2DES01
P2DES02
P2DESO8
P2DES14
P2DES18
SMT
About how many hours a week do you usually spend on homework or other schoolwork out of class for science subjeds?
Science is very important for a country's development. Agree; Disagree; Uncertain.
School is not very enjoyable.
Science is an enjoyable school subject.
The science taught at school is interesting.
Science is a difficult subject.
We use a textbook for our science lessons
We use books other than textbook for learning science.
We watch the teacher do experiments during our science
We have tests on what we learned in science.
We do experiments as part of the science lessons
SCiG1(09 test soore
Agree; Disagree; Uncertain.
Agree; Disagree; Uncertain.
Agree; Disagree; Uncertain.
Agree; Disagree; Uncertain.
Often; Sometimes; Never.
Often; Sometimes; Never.
lessons.
Often; Sometimes; Never.
Often; Sometimes; Never.
Often; Sometimes; Never.
r, 7
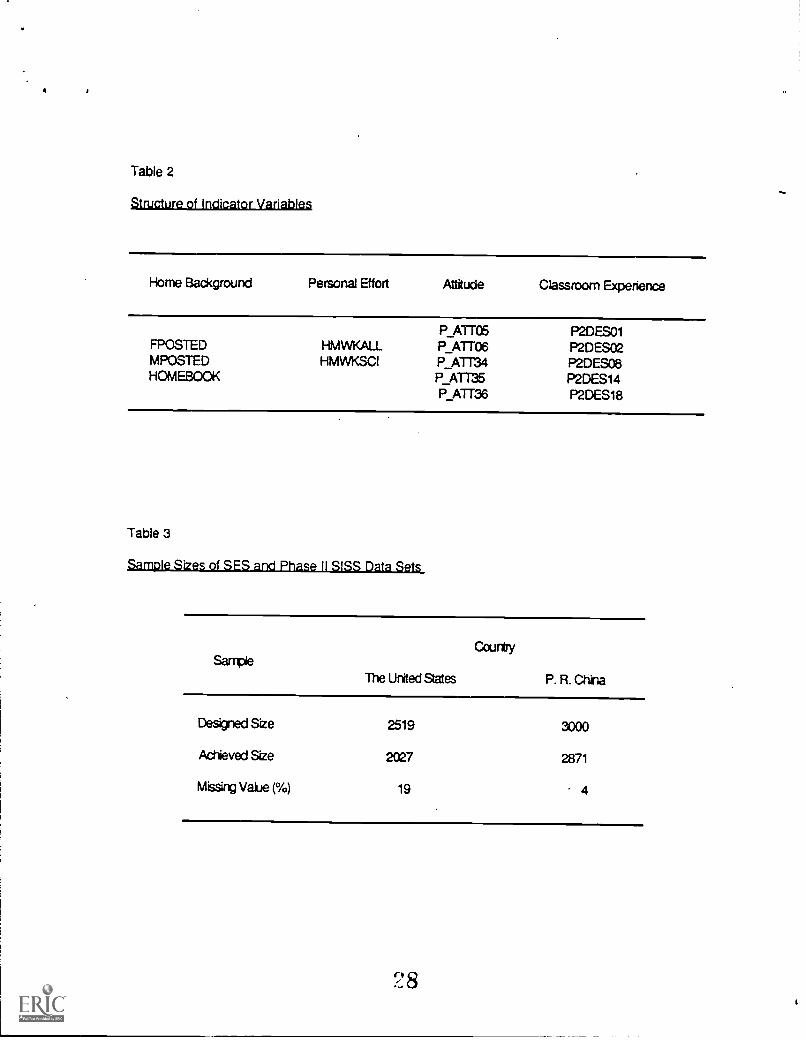
Table 2
Structure of Indicator Variables
Home Background Personal Effort Attitude Classroom Btperience
P ATMS P2DES01FPOSTED HMWKALL P ATTO6 F2DES02MPOSTED HMWKSCI P AT1-34 P2DES08HOMEBOOK P ATI-35 P2DES14
P ATT36 P2DES18
Table 3
Sample Ses of SES and Phase II S1SS Data Sets
SarrpieThe United States
Courtly
Designed Size
Aclieved Size
Missing Value (%)
2519
2027
19
P. R. Chna
3000
2871
4
2 8
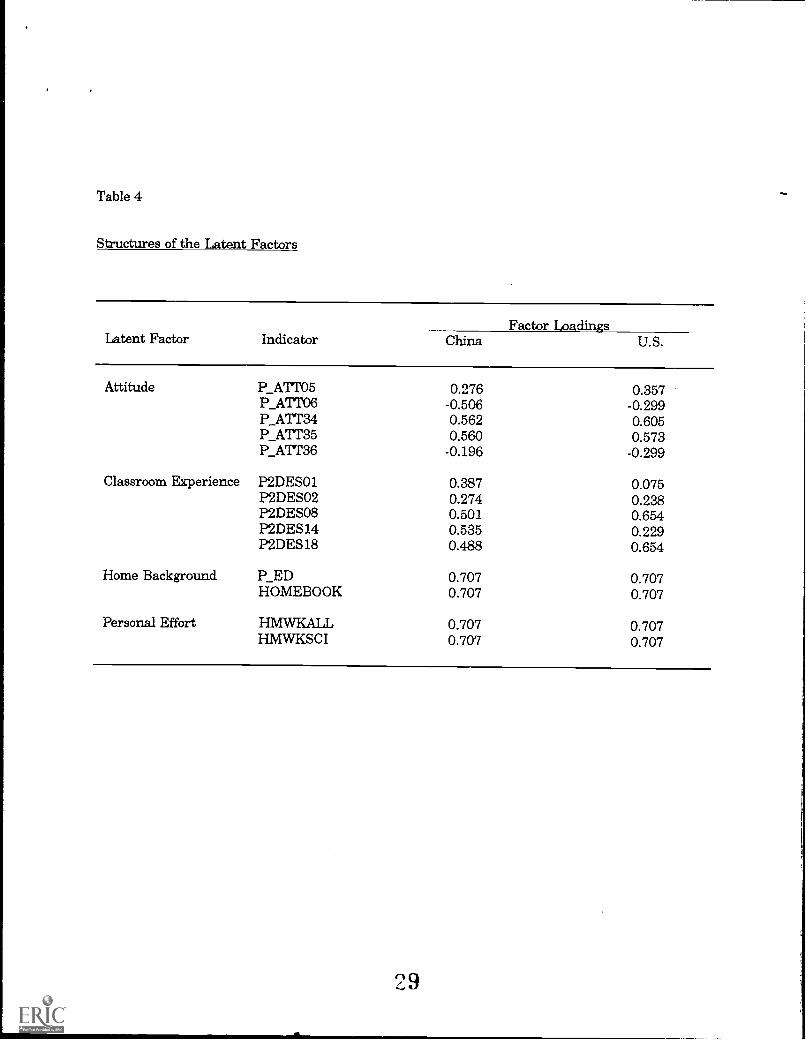
Table 4
Structures of the Latent Factors
Factor LoadingsLatent Factor Indicator China U.S.
Attitude P_A1I'05 0.276 0.357P_ATT06 -0.506 -0.299P_ATT34 0.562 0.605P_ATr35 0.560 0.573P_ATP36 -0.196 -0.299
Classroom Experience P2DES01 0.387 0.075P2DES02 0.274 0.238P2DES08 0.501 0.654P2DES14 0.535 0.229P2DES18 0.488 0.654
Home Background P_ED 0.707 0.707HOMEBOOK 0.707 0.707
Personal Effort HMWKALL 0.707 0.707HMWKSCI 0.707 0.707
29

Table 5
Significant Polynomial Predictors of Students Science Achievementm
PolynomialPredictors(21
U.S. ChinaParameter Estimate
(PI)P-Value Parameter Estimate
(Pi)P-Value
Intercept (00) 56.183 0.0001 52.707 0.0001
A -2.279 0.0001-0.670 0.0069
2.861 0.0001 1.970 0.00011.940 0.00016.026 0.0001 8.248 0.0001
c2 -1.011 0.0001E2 -0.416 0.0032H2 -1.909 0.0001 0.428 0.0040
E3 -0.084 0.0003
-0.124 0.0012
E° 0.040 0.0094
Notes:
DI The polynomial predictors in Table 5 and the interaction predictors in Table 6 are selected together through a backwardelimination procedure in SAS, and the significant level has been set at a = .05.
[21 The factor names are abbreviated as: A = Attitude; C = Classroom Exper,-nce; B = Effort; H = Home Background;S = Sex; and 130 corresponds to a zero degree of polynomials.
30

Table 6
Significant Interaction Predictors of Students' Science Achievement111
InteractionPredictors121
U.S. ChinaParameter Estimate
(i3Ju,)
P-Value Parameter Estimate P-Value
H'E 1.266 0.0019
S*A2 -0.751 0.0073S*C2 0.930 0.0082S*H*A -1.126 0.0021S" 1-1*C 0.454 0.0409S*H"E -1.449 0.0073H*A*E -0.256 0.0393H*E*C 0.254 0.0495H2"A 0.664 0.0079A2"C -0.198 0.0416C2*A 0.143 0.0198C2`E -0.541 0.0131
A3*S -0.056 0.0010C3"S -0.127 0.0017E3*C -0.317 0.0227S*H2'A -0.814 0.0108
S*H2*A2 0.457 0.0034
Notes:
[1] The interaction predictors in Table 6 and the polynomial predictors in Table 5 are selected together through a backwardelimination procedure in SAS, and the significant level has been set at a = .05.
[2] The factor names are abbreviated as: A = Attitude; C = Classroom Experience; B = Effort; H = Home Background;S = Sex; and Po corresponds to a zero degree of polynomials.
31

Table 7
The Number of Significant Predictors Constructed by the Factors of Students ScienceAchievement
Factors of Students' Science AchievementCountry Gender Attitude Classroom Experience Personal Effort Home Background
U.S. 7 7 5 8 8China 4 3 5 4 4
Table 8
Comparison of Model Complexity
Highest Degrees The Total Number of Significant PredictorsCountry of the Predictors Polynomials Interactions
U.S. 5 9 11China 4 5 6
32

, figure 1
Scree Plot of Eigenvalues for U.S. Data_
1
2
3
4
0
7 8
9 10
11
12
4 6 8 10 12Number of Principal Components
13
14
14 16

figure
Scree Plot of Elgenvalues for China Data
2.5+
1
2.0+
91.5+
a
1.0-
0.54'
0.0 -
2
3
4
5
6
7
8
13
14
0 2 4 6 8 10 12 14 16Number of Principal Components