ED 341 651 SP 033 532 AUTHOR Marso, Ronald N.; Pigge, Fred ... · DOCUMENT RESUME ED 341 651 SP 033...
13
DOCUMENT RESUME ED 341 651 SP 033 532 AUTHOR Marso, Ronald N.; Pigge, Fred L. TITLE The Identification of Academic, Personal, and Affective Predictors of Student Teaching Performance. PUB DATE Oct 91 NOTE 15p.; Paper presented at the Annual Meeting of the Midwestern Educational Research Association (Chicago, IL, October 16-19, 1991). Appendixes contain small blurred type. The scale for rating student teaching performance contains small, marginally legible type. PUB TYPE Speeches/Conference Papers (150) -- Reports - Research/Technical (143) -- Tests/Evaluation Instruments (160) MRS PRICE MF01/PC01 Plus Postage. DESCRIPTORS Attitude Measures; Elementary Secondary Education; Higher Education; Personality Measures; *Personality Traits; *Predictive Measurement; *Predictor Variables; Preservice Teacher Education; Projective Measures; Rating Scales; Student Teacher Attitudes; *Student Teacher Evaluation; Student Teacher Supervisors; *Student Teaching) *Teacher Effectiveness IDENTIFIERS Myers Briggs Type Indicator; Rotter Internal External Locus of Control Scale ABSTRACT The purpose of the study described here was to determine the extent to which student teachers' performance, as assessed by their university supervisors, could be predicted from the following sets of measurements: (1) high school and college academic pLrformance indexes; (2) self-reported attitudes, anxieties, and concerns about teaching; and (3) Myers-Briggs Type Indicator and Rotter's locus of control scores. Subjects were teacher education students (N=87) who Tad completed their student teaching (60 percent were elementary and 40 percent were secondary education majors, and SO percent were female). University supervisors provided a numerical evaluation of student teaching performance. Results suggest that the most significant predictors of prospective teachers' success are university grade point averages; self-ratings of future success; and Myers-Briggs classification preferences for intuition in contrast to sensing and for feeling rather than thinking. Additionally it appears that prospective teachers who are more anxious about teaching, who feel they have less control over their environment (external locus of control), and have a perceptive rather than judging attitude on the Myers-Briggs inventory are more likely to be rated lower than their fellow prospective teachers by university supervisors. Appendixes include a scale for rating student teaching performance and a report form for Myers-Briggs Type Indicator. (LL)
Transcript of ED 341 651 SP 033 532 AUTHOR Marso, Ronald N.; Pigge, Fred ... · DOCUMENT RESUME ED 341 651 SP 033...

DOCUMENT RESUME
ED 341 651 SP 033 532
AUTHOR Marso, Ronald N.; Pigge, Fred L.TITLE The Identification of Academic, Personal, and
Affective Predictors of Student TeachingPerformance.
PUB DATE Oct 91NOTE 15p.; Paper presented at the Annual Meeting of the
Midwestern Educational Research Association (Chicago,IL, October 16-19, 1991). Appendixes contain smallblurred type. The scale for rating student teachingperformance contains small, marginally legibletype.
PUB TYPE Speeches/Conference Papers (150) -- Reports -Research/Technical (143) -- Tests/EvaluationInstruments (160)
MRS PRICE MF01/PC01 Plus Postage.DESCRIPTORS Attitude Measures; Elementary Secondary Education;
Higher Education; Personality Measures; *PersonalityTraits; *Predictive Measurement; *PredictorVariables; Preservice Teacher Education; ProjectiveMeasures; Rating Scales; Student Teacher Attitudes;*Student Teacher Evaluation; Student TeacherSupervisors; *Student Teaching) *TeacherEffectiveness
IDENTIFIERS Myers Briggs Type Indicator; Rotter Internal ExternalLocus of Control Scale
ABSTRACTThe purpose of the study described here was to
determine the extent to which student teachers' performance, asassessed by their university supervisors, could be predicted from thefollowing sets of measurements: (1) high school and college academicpLrformance indexes; (2) self-reported attitudes, anxieties, andconcerns about teaching; and (3) Myers-Briggs Type Indicator andRotter's locus of control scores. Subjects were teacher educationstudents (N=87) who Tad completed their student teaching (60 percentwere elementary and 40 percent were secondary education majors, andSO percent were female). University supervisors provided a numericalevaluation of student teaching performance. Results suggest that themost significant predictors of prospective teachers' success areuniversity grade point averages; self-ratings of future success; andMyers-Briggs classification preferences for intuition in contrast tosensing and for feeling rather than thinking. Additionally it appearsthat prospective teachers who are more anxious about teaching, whofeel they have less control over their environment (external locus ofcontrol), and have a perceptive rather than judging attitude on theMyers-Briggs inventory are more likely to be rated lower than theirfellow prospective teachers by university supervisors. Appendixesinclude a scale for rating student teaching performance and a reportform for Myers-Briggs Type Indicator. (LL)

Predicting Performance
The Identification of Academic, Personal, and AffectivePredictors of Student Teaching Performance
11.1 OIRIMITilitit OF EOUCATIOVOthre d ouossond Raleeech ifnivOwnentEDUCOMONAL RESOURCES INFORMATION
CENTER IEFSCI
I' Ts+s Scrums++, Not been ressocluced as+wowed Ind++ the Dereen of Orgefuzehonohernelino
r +dm*, changes have been made tv 'motoff.reerOduceen Que3ilv
Preeted wsw o. odmons smith:1,n 1144 Ocx utrim? CIO nO1 nefeellarey reorsient otfic.111OER1 POINfion o Pehci,
Ronald N. Marso and Fred L. PiggeCollege of Education and Allied Professions
Bowling Green State UniversityBawling Green, OH 43403
A paper presented at the Annual Meeting of theMidwestern Educational Research Association
Chicago, Illinois
October 16-19, 1991
Running Head: PREDICTING PERFORMANCE
"PERMISSION TO REPRODUCE THISMATERIAL HAS SEEN GRANTED BY
kAiL4.4
1. P
TO THE EDUCATIONAL RESOURCESINFORMATION CENTER (ERIC)."
The nature of the impact of student teaching upon neophyteteachers continues to receive considerable attention in theprofessional literature. Perceptions of this impact vary fromit being insignificant relative to the overall socialization ofteachers (Lortie, 1975), it being a coercive conformity toschool bureaucracy (Hoy & Rees, 1977), to it being prospectiveteachers most practical and useful orientation to the realworld of teaching (Berliner, 1985).
Relatedly, the findings from the studies of the influence ofstudent teaching upon prospective teachers have been described asbeing ambiguous and contradictory (Hersh, Hull, & Leighton, 1982;Zeichner, 1980). More recent research studies, however, suggest thatthe student teaching experience does have an effect upon neophyteteachers but that a number c: factors influence the consequences ofthe experience. Tabachnick and Zeichner (1984) concluded that boththe characteristics of the prospective teacher and the nature of theschool placement influence the outcomes of the student teachingexperience.
Additionally, Pigge and Marso (1987) reported that planned gradelevel of instruction, selected major, and gender were related tochanges in prospective teachers during teacher training; Byler andByler (1984) found a relationship between change in morale duringstudent teaching and axtet;: of early field experience during teachertraining; Zeichner and Grant (1981) found that whether or notprospective teachers.' change to a more custodial pupil orientationduring student teaching may be related to the custodial orientation oftheir cooperating teachers; Koehler (1985) concluded from the researchliterature that the extent of congruence between instructionalstrategies employed by student teachers and common practices occurringin their assigned classrooms has a major influence upon the ultimateinstructional practices of neophyte Leachers; and Marso and Pigge(1989-90) reported that prospective teachers became less concerned andless anxious about teaching as a result of student teaching.
2BEST COPY AVAILAILE

Predicting Performance
2
Researchers who have investigated criteria or factors which mightbe used to predict performance in student teaching have reported thatproblems arise from accuracy of measurement and restricted samplevariance. Findings from two relatively recent studies illustratethese difficulties in predicting and measuring student teachingperformance. Dobry, Murphy, and Schmidt (1985) found that ratings ofstudent teaching performance did not correlate with either theNational Teacher Examination professional knowledge scores or theoverall grade point averages of student teachers. Phelps, Schmitz,and Boatright (1986) found their student teacher performance ratingssuffered from halo effect and leniency error and found restrictedsample variance which they attributed to selective admissions toteacher education programs. More specifically, these researchersnoted that their raters of student teaching performance did notdifferentiate among different instructional skill areas and did notuse the lower end of the rating scales. They reported mean ratingsranging from 4.47 to 4.89 on a one to five-point scale.
The purpose of the present study was to determine to what extentselected academic, personal, and affective characteristics might be
-dictors of a sample of prospective teachers' student teachingperformance as rated by the student teachers' university supervisors.More specifically, the present multiple regression study was designedto ascertaiL the extent that student teachers' performance, asassessed by their university supervisors, could be predicted from thefollowing three sets of measurements: a) high school and collegeacademic performance indices, b) self reported attitudes, anxieties,and concerns about teaching, and c) Myers-Briggs Type Indicator andRotter's locus of control scores.
Method
The subjects for this study consisted of all students enteringthe teacher preparation program at Bowling Green State Universityduring the 1985 calendar year and who had completed their studentteaching experience by the end of the second semester of the 1987-88academic year and for whom all possible sets of predictor scores (22)as shown on Table 1 were available. This sample consisted of 87prospective teachers of whom approximately 60% anticipated teaching inelementary grades and 40% at the secondary level and of whomapproximately 80% were females.
These prospective teachers had completed the Myers-Briggs TypeIndicator (Myers & McCaulley, 1985) and Rotter's Locus of Control(Rotter, 1966) measures just prior to their student teachingexperience. This locus of ccntrol measure provides a singleexternality score; whereas the Myers-Briggs measure provides both aresearch score for each of four preference scales(extraversion-introversion, sensing-intuitive, thinking-feeling, andjudging-perceptive) plus a dichotomous classification for each ofthese four preference scales. (See Appendix A for a description ofLhese scales).
3
Predicting Performance
3
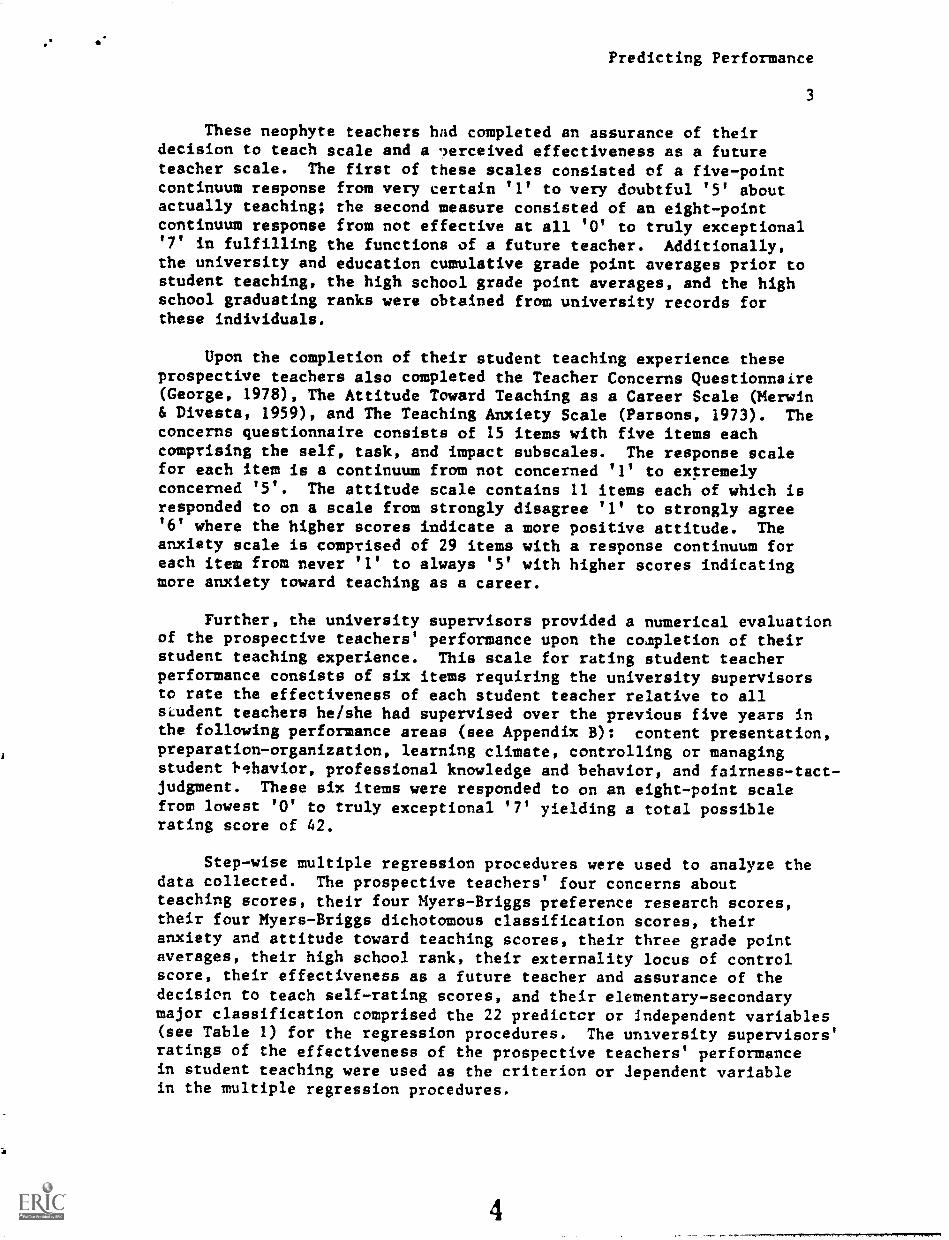
These neophyte teachers had completed an assurance of theirdecision to teach scale and a ?erceived effectiveness as a futureteacher scale. The first of these scales consisted of a five-pointcontinuum response from very certain to very doubtful '5' aboutactually teaching; the second measure consisted of an eight-pointcontinuum response from not effective at all '0' to truly exceptional'7' in fulfilling the functions of a future teacher. Additionally,the university and education cumulative grade point averages prior tostudent teaching, the high school grade point averages, and the highschool graduating ranks were obtained from university records forthese individuals.
Upon the completion of their student teaching experience theseprospective teachers also completed the Teacher Concerns Questionnaire(George, 1970, The Attitude Toward Teaching as a Career Scale (MerwinDivesta, 1959), and The Teaching Anxiety Scale (Parsons, 1973). The
concerns questionnaire consists of 15 items with five items eachcomprising the self, task, and impact subscales. The response scalefor each item is a continuum from not concerned '1' to extremelyconcerned '5'. The attitude scale contains 11 items each of which isresponded to on a scale from strongly disagree '1' to strongly agree'6' where the higher scores indicate a more positive attitude. Theanxiety scale is comprised of 29 items with a response continuum foreach item from never '1' to always '5' with higher scores indicatingmore anxiety toward teaching as a career.
Further, the university supervisors provided a numerical evaluationof the prospective teachers' performance upon the completion of theirstudent teaching experience. This scale for rating student teacherperformance consists of six items requiring the university supervisorsto rate the effectiveness of each student teacher relative to allsLudent teachers he/she had supervised over the previous five years inthe following performance areas (see Appendix B): content presentation,preparation-organization, learning climate, controlling or managingstudent 1.ehavior, professional knowledge and behavior, and fairness-tact-judgment. These six items were responded to on an eight-point scalefrom lowest '0' to truly exceptional '7' yielding a total possiblerating score of 42.
Step-wise multiple regression procedures were used to analyze thedata collected. The prospective teachers' four concerns aboutteaching scores, their four Myers-Briggs preference research scores,their four Myers-Briggs dichotomous classification scores, theiranxiety and attitude toward teaching scores, their three grade pointaverages, their high school rank, their externality locus of controlscore, their effectiveness as a future teacher and assurance of thedecision to teach self-rating scores, and their elementary-secondarymajor classification comprised the 22 predictcr or independent variables(see Table 1) for the regression procedures. The university supervisors'ratings of the effectiveness of the prospective teachers' performancein student teaching were used as the criterion or Jependent variablein the multiple regression procedures.

Predicting Performance
4
The step-wise analysis procedures first selected the best singlepredictor of the student teaching performance rating criterion, thenselected the best two predictors, then the best three predictors, etc.The p value for selection was set at .15, but only those variablescontributing to the prediction at or near the .05 alpha level arereported in this paper.
Results
The Pearson product-moment or point biserial correlationcoefficients between the 22 predictor variables and the studentteaching performance rating criterion are reported in Table 1. As canbe noted from this data, just six of these coefficients differedsignificantly from zero with alpha set at or below the .05 level:university GPA (.33), education GPA (.28), anxiety about teaching(-.21), self-rating of future effectiveness as a teacher (.21),external locus of control (-.19), and Myers-Briggs judging-perceptivepreference classification (-.18). The greatest amount of variancecontrolled in the student teaching perfaxmance scores by a singlepredictor variable (university GPA, .33 ) was approximately 11%. Toascertain how much variance in the dependent variable could becontrolled by all the predictive variables, a step-wise multipleregression analysis was completed.
Insert Table 1 about here
The results of the step-wise multiple regression procedures arepresented on Table 2. The single best predictor of student teachingperformance was the university GPA with an R value of .33, followed bythe Myers-Briggs sensing-intuition research score bringing the multipleR value to .42, followed by the self-rating of future success as ateacher bringing this multiple R value to .47, followed by the Myers-Briggs sensing-intuition dichotomous clasalfication bringing themultiple R value to .50, and followed by (the last variable selectionwith an F value of p < .05) the Myers-Briggs thinking-feeling dichotomousclassification bringing the total multiple R value to .54. Data inTable 2 also reveal that yariations in these five variables controlledapproximately 29% (.288.R ) of the variation in the student teachingperformance ratings. None of the other 17 independent variableseither singularly or in concert contributed markedly to the control ordetermination of addltional amounts of variance in the student teachingperformance scores.
Insert Table 2 about here
Summary and Implications
Six of the 22 predictor variables correlated significantly(p < .05) with the student teaching performance ratings with absolutevalues of coefficients ranging from .18 to .33. The step-wise multiple
5

Predicting Performance
5
regression procedures identified a team of five significant predictorsof the student teaching performance scores. The multiple correlationcoefficient with the five predictor variables was .54, its square wasapproximately 29%.
The five significant predictors were university GPA (entered inthe first step of the process), self-rating of future effectiveness asa teacher (entered at the third step), and three of the eight Myers-Briggs scores or classifications comprised the remaining predictors.
It would appear from these findings that: 1) A reasonablyeffective set of predictors of student teaching performance has beenidentified; this set accounts for approximately 30% of the variance inthe university supervisors' ratings of the performance of theirstudent teachers. In addition, the measurement of these predictorsother than cumulative university GPA required less than 30 minutes oftesting time. A multiple correlation coefficient of .54 is similar inmagnitude to that of high school grades or rank plus ACT/SAT scoresused on many university campuses for predicting college freshmen GPA.2) The student teaching performance scale used in the present studymay have overcome some of the measurement livitations associated withthe ratings of student teaching performance noted earlier in thispaper (Dobry, Murphy, 6 Schmidt, 1985; Phelps, Schmitz, 6 Boatright,1986). Our student teaching rating scores ranged from 13 to 42.3) Based upon this single sample of student teachers, it appears thatprospective teachers with a combination of high university grade pointaverages, who perceive themselves as likely to become highly successfulfuture teachers, who have a Myers-Briggs classification preference forintuition in contrast to sensing (a preference for looking forpossibilities and relationships rather than work with known facts),and who have a Myers-Briggs classification preference for feelingrather than thinking (a preference for making judgments more onpersonal values than on impersonal analysis and logic) are more likelyto have their student tea,Thing performance rated higher by theiruniversity supervisors than are their fellow student teachers withopposite preferences, lower GPA's, and lower expectations of theirfuture success as teachers. 4) Additionally, it appears that thoseprospective teachers who are more anxious about teaching, who feelthat they have less control over their environment (external locus ofcontrol), and who have a Myers-Briggs classification of perceptiverather than judging attitude (like a spontaneous way of life ratherthan a planned, orderly way of life) are more likely than their fellowprospective teachers to have their student teaching performance ratedlower by their university supervisors.
50/2

6
References
Berliner, D. C. (1985). Laboratory settings and the study ofeducation. Journal of Teacher Education, 36(6), 2-8.
Byler, B. L., & Byler, L. F. (1984). Analysis of student teachermorale before and after student teaching. Journal of the AmericanAssociation of Teacher Education in Agriculture, 25, 22-28.
Pobry, A. M., Murphy, P. D., & Schmidt, P. M. (1985). Predictingteacher competence. Action in Teacher Education 7(1-2), 69-75.
George, A. A. (1978). Measuring self, task, and impact concerns: Amanual for use of the teacher concerns questionnaire. The Researchand Development Center for Teacher Education, The University ofTexas at Austin, 92pp.
Hersh, R. H., Hull, R., & Leighton, M. S. (1982). Student teaching.In H. E. Mitzel, J. H. Best, and W. Robinowitz (Eds.), Encyclopediaof Educational Research (Vols. 1-4, 1812-1822). New York: TheFree Press.
Hoy, W. K., & Rees, R. (1977). The bureaucratic socialization ofstudent teachers. Journal of Teacher Education, 28, 23-25.
Koehler, V. (1985). Research on preservice education. Journal ofTeacher Education, 36, 23-30.
Lortie, D. C. (1975). School teacher: A sociological study.Chicago: The University of Chicago Press.
Marso, R. N., & Pigiz, F. L. (1989-90). Student teaching: Changesin concerns, anxiety, and attituee. The Journal: The Arts andSciences in Teacher Education, 4, 49-52.
Merwin, J. C., & DiVesta, F. J. (1959). The study of need theory andcareer choice. Journal of Counseling Psychology, 6, 302-306.
Myers, I. B., & McCaulley, M. H. (1985). Manual: A guide to thedevelopment and use of the Myers-Briggs type indicator. ConsultingPsychologists Press, Palo Alto.
Parsons, J. J. (1973). Assessment of anxiety about teaching usingthe Teaching Anxiety Scale: Manual and research report. TheResearch and Development Center for Teacher Education, TheUniversity of Texas at Austin, 55pp.
Phelps, L., Schmitz, C. D., & Boatright, B. (1986). The effects ofhalo and leniency on cooperating teacher reports using Likert-typerating scales. Journal of Educational Research, 79, 151-154.
7

7
Pigge, F. L. 6 Margo, R. N. (1987). Relationships between studentcharacteristics and changes in attitudes, concerns, anxieties, and'confidence about teaching during teacher preparation. Journal ofEducational Research, 81, 109-115.
Rotter, J. B. (1966). Generalized expectancies for internal versusexternal control of reinforcement. Psychological Monographs, 80,(Whole No. 609).
Tabachnick, R. 6 Zeichner, K. (1984). The impact of the studentteaching experience on the development of teacher perspectives.Journal of Teacher Education, 35(6), 28-36.
Zeichner, K. M. (1980). Myths and realities: Field-basedexperiences in preservice teacher education. Journal of TeacherEducation, 31, 45-55.
Zeichner, K. M., 6 Grant, C. A. (1981). Biography and socialstructure in the socialization of student teachers: Are-examination of the pupil control ideologies of studentteachers. Journal of Education for Teaching, 7, 298-314.
50/6

9
Table 1
Pearson Product-Moment or Point Biserial Correlation Coefficients Between Selected Predictor
Variables and the Student Teaching Performance Rating Criterion Measure
VariableVariable
University CPA .33 .001 High School Rar1- .09 .31
Education GPA .29 .001 Sensing-Intuitiv. Score -.09 .29
Anxiety about Teaching -.21 .01 Thinking-Feeling Classification* -.08 .32
Effectiveness Future Teacher .21 .02 Attitude Toward Teaching .08 .35
Locus of Control (externality) -.19 .05 Impact Concerns -.07 .36
Judging-PerceptiveExtraversion-Introversion
Classification* -.18 .05 Classification* -.06 .47
Assurance about Teaching .14 .10 Extraversion-Introversion Score -.05 .53
Judging-Perceptive Score -.14 .10 High School CPA .04 .63
Total Concerns -.11 .18 Sensing-Intuitive Classification* .04 .59
Task Concerns -.10 .21 Thinking-Feeling Score -.04 .65
Self Concerns -.10 .24 Elementary Major -.02 .83
* The Myers-Briggs classifications were entered with the first classification label as '1',
second classification label as '2'; therefore the minus coefficient for Judging-Perceptive
mPans that those subjects classified as perceptive received lower student teaching
performance ratings than those who were classified as judging.
1 0

Table 2
alp=1121_nitiple Correlation R Values Between Predictors and StudentTeaching Performance Rating Criterion
Step* Predictor R R2
1 University GPA .33 .109 10.52 .002
2 Sensing-Intuition Score .42 .17" 7.08 .009
3 Effectiveness Future Teacher .47 .219 4.50 .037
4 Sensing-Intuition Classification .50 .253 3.73 .057
5 Thinking-Feeling Classification .54 .288 4.02 .048
* Only variables with p-values approximately equal to .05 were
included. None of the other 17 predictor variables added
significantly to the prediction process.

APPENDIX
A. Scale for Rating Student Teaching Performance
B. Report Form for Myers-Briggs Type Indicator
12

OESS Sesearch Project. sop Supervisor Sating of Student Teacher
sae, ofStudent Teacher
incial Security 9
Det
Directions: Please Tete titss student teacher's performance relative to all other studentiTraTirins have supervised say evil's the pest fiv yeats on each of the following sixcategories by circling the single number best reflecting his/her relative rent. The ratingounblits are defined as follows:
7 TRUL7 EXCEPTIONAL. within top St of students i have supervised.6 OUTSTANDING, nest St, approainately SS% of my present and past student teachers wool
cettainly have ratings below this.S UNUSUALLY GOOD, not at the very top but certainly in top 1/4 of all student teacheru
have supetvised.4 A LITTLE ABOVE me AVERAGE student teacher, somewhat above the midd:e in terms of
perforoancer about 49% of my pest students have done better than this individual. SIhave done worse.
3 A LITTLE BELOW MY AVERAGE student teacher, bout if% of sy past students have donebetter than this individual, 49% MOO.
3 BELOW AVERAGE, certainly in the bottom 1/3 of my past student teachers, but I have hworse!
1 NEAR THE bOTTOM, probably in the bottom 11211% of students I have supervised. (Butcould still be of sufficJent quality (or promise) to earn a teaching certificate).
9 The BOTTOMPoorest student I have ever had! I don't see how he/sbe ever got to thstudent teaching stage.
The above described ratings are illustrated by the following line schema.
CONPARED TO ALL STUDENT TEACHESS I HAVE SUPERVISED ovve tmt LAST FIVE YEARS,THIS INDIVIDUEr RANKS:
loctctsi
War Belo+ A Little A Littletie IllowaVo. Wm/ lif Mew ?ivBoma In Bottos *wrap *vamp
113 Stabnt Sturbrit
'Amens "mall=
(Please circle your ratings.)
Performance Category
1. Presents Content Effectively: Lessonsclear, focused, well organized, effective*samples, appropriate pace, essignnentoclear, communicates well, etc.
2. Plans, Prepares, and Organises Activities:sell prepared learning activities, effec-tive ese of time, monitors activities, allstudents participate, students on test, etc.
3. maintains positive Learning Climate:Sensitive to student needs, friendly andaccepting, good interaction with students,displays and accepts huger, high but realis-tic espectstions, positive leadership, etc.
4. maintains Appropriate Student lehavior:Clear iv:plantation regarding classroom con-duct, promotes student self control, usespraise and consequences more than punishoent,aware of and eddtesses undesirable behavior,shows consistency in applying rules. etc.
S. Displays Professional knowledge 6 Behavior:Knows sulnect setter, cooperative attitude,responds positively to supervision, modelsprofessional behavior, growing professional-ly, etc.
6. Shows feitnessi Tact. Comoassion, and Good.41;3;1...ant, in dialing witn pupils, parents,supervisors, other teachers, etc.
Pertinent Evaluative Coneants:
()woolly artsteelirc, Truly
Oxd, TR: In Dccep-
In Sty I./4 ticrts/,
Itp %
This Student's Performance Rating,Based CO Average of My Pest
Student Teachers, is:The Truly
Bottom! Exceptions
II 1 2 3 4 S 6 7
1 2 3 4 S 6 7
I I 2 3 4 S 6 7
4 1 2 3 4 S 6 7
0 1 2 3 4 S 6 7
0 I 2 3 4 5 6 7
13 BEST COPY AVAILABLE
please send conpieted form to Prod Pigge. 325 Ld lIdq, ben), within Iii days lif possible) freceipt. Thank you.

1 4
Report Form for Myers-Briggs Type Indicator*Name
POINTSFOH
EXTRAVERSION riSENSING ri
THINKING nJUDGING
Sex: MO FO Age Other Dale
PREFERENCE STRENGTHS
60 40 20 a 20
TYPE 1 1 1 1
40 60
NTROVERSION
TUITION
FEELING
pERCEPTIVE
indicator questions deal with the way you like tu use your perception and judgment, that is, the way you like to look at things and
the way you like to go about deciding things. Thc answers given reflect four separate preferences called El, SN, TI and JP. The inutile
above shows your Score On each prelrence. The folif letters of your stype" idl how you cattle Out on all four plefeiCtICCS. What cads
pre fer ence Weans is ShOwit bclUw.
c fin Cstfaversion probably you relate inure eabily to the
L outer world uf people and things tLar! to the inner world of ideas.
e nAn S fru sesing probably means you would rather work withLi known facts than look for possibdities and rdatiussibips.
T A T for thinking probably oilcans you babe your jusignrcurs inure oninspcibunal analyklb and logic than on czousaI value).
A J for the judging attitude probAbly nicalt$ you like a planned.Jeti..44. orderly wy of life better thwn a flexible, spoontancous
way.
Ats I kir Intatnicfstun probably means you relate Moly easily so the
inner world of ideas than to the tinter world of !fell& and dints).
An N fur intunion probably eans you would raihrt look lotpossilninies And selationsIsips than wutk with known facts.
Ass I " tor feding probably means you babe your Judgments name ton
petannal Vahlt!* than ton insperbonal analpis and logic.
A I' fur die perceptive attitude probably nicaiss you like a lir ',stoic,
spontaneous way of life better than a planned, decided, orderlyWay.
Each combination of preferences tends to be characterized by its own set of interests, values and skills. On the back of this page are
very brief descriptions of each type. Find thc one matching your four letters and see whether or mit it fits you. If it doesn't, try to find
one that does. Whatever your preferences, of course, you may still use some behaviors characteristic of contrasting preferences, but not
with equal liking or skill. This tendency may be greater if preference strength on a scale is luw (under 15). For a Inure 4:0110111cte
discussion of the types and their vocational and personal implications, sec Introduction to Type by Isabel Briggs Myers, or consult your
counselor.
PsyCluilinasTs iN( :., 57 I COI.I.ME i V4til. PAIA) A1.10i AI.111/RNIA 9.1.1061 5