ECR Technologies, Inc. - EPA Archives · The GHG Center collaborated with ECR Technologies, Inc....
47
Transcript of ECR Technologies, Inc. - EPA Archives · The GHG Center collaborated with ECR Technologies, Inc....


SRI/USEPA-GHG-VR-34 September 2006
Environmental Technology Verification Report
ECR Technologies, Inc. EarthLinked® Ground-Source Heat Pump Water Heating System
Prepared by:
Greenhouse Gas Technology CenterSouthern Research Institute
Under a Cooperative Agreement With U.S. Environmental Protection Agency

EPA REVIEW NOTICE
This report has been peer and administratively reviewed by the U.S. Environmental Protection Agency, and approved for publication. Mention of trade names or commercial products does not constitute endorsement or recommendation for use.
SRI/USEPA-GHG-VR-34 September 2006
THE ENVIRONMENTAL TECHNOLOGY VERIFICATION PROGRAM
SOUTHERN RESEARCH I N S T I T U T E
U.S. Environmental Protection Agency
ETV Joint Verification Statement TECHNOLOGY TYPE: Ground-Source Heat Pump Water Heating System
APPLICATION: Water Heating
TECHNOLOGY NAME: EarthLinked® Water Heating System
COMPANY: ECR Technologies, Inc.
ADDRESS: 3536 DMG Drive Lakeland, FL 33811
E-MAIL: [email protected]
The U.S. Environmental Protection Agency (EPA) has created the Environmental Technology Verification (ETV) program to facilitate the deployment of innovative or improved environmental technologies through performance verification and dissemination of information. The goal of the ETV program is to further environmental protection by accelerating the acceptance and use of improved and cost-effective technologies. ETV seeks to achieve this goal by providing high-quality, peer-reviewed data on technology performance to those involved in the purchase, design, distribution, financing, permitting, and use of environmental technologies
ETV works in partnership with recognized standards and testing organizations, stakeholder groups that consist of buyers, vendor organizations, and permitters, and with the full participation of individual technology developers. The program evaluates the performance of technologies by developing test plans that are responsive to the needs of stakeholders, conducting field or laboratory tests, collecting and analyzing data, and preparing peer-reviewed reports. All evaluations are conducted in accordance with rigorous quality assurance protocols to ensure that data of known and adequate quality are generated and that the results are defensible.
The Greenhouse Gas Technology Center (GHG Center), one of six verification organizations under the ETV program, is operated by Southern Research Institute in cooperation with EPA’s National Risk Management Research Laboratory. GHG Center stakeholders are particularly interested in building heating and cooling technologies, including technologies used primarily to heat domestic hot water, with the potential to improve efficiency and reduce concomitant GHG and criteria pollutant emissions.
The GHG Center collaborated with ECR Technologies, Inc. (ECR) to evaluate their EarthLinked Ground-Source Heat Pump Water Heating System’s performance as installed in a commercial setting. The system incorporates a ground-sourced heat pump into a building’s water heating system. ECR states that the
S-1
SRI/USEPA-GHG-VR-34 September 2006
EarthLinked system may provide up to 70% reduction in power consumption when compared to electric water heating systems of equivalent capacity. This reduced energy consumption would also reduce emissions from the electric power system’s generators or natural gas combustion in direct-fired systems. Broad utilization of such technologies could have a significant beneficial impact on GHG and pollutant emissions.
TECHNOLOGY DESCRIPTION
The following technology description is based on information provided by ECR and does not represent verified information. The EarthLinked system typically consists of two or more 50- or 100-foot copper refrigerant loops (earth loops) installed in the ground, a compressor, a heat exchanger, refrigerant liquid flow controls, and an active charge control. The earth loops can be installed in horizontal, vertical, or diagonal configurations. The EarthLinked system circulates non-ozone depleting refrigerant (R-407c) through the copper earth loops. The manufacturer claims that the system’s direct heat transfer from the earth to the refrigerant is intended to improve heat transfer efficiency.
The liquid refrigerant absorbs heat from the ground, which is typically at a constant temperature year round (40-80 ºF, depending on location), and vaporizes. A compressor raises the refrigerant pressure and routes it to a heat exchanger. There, the vapor condenses and yields the latent heat of vaporization to domestic water passing through a heat exchanger and circulating back to the hot water tanks. Refrigerant is then returned to the earth loops via a patented refrigerant flow control device.
The EarthLinked system consumes power in the compressor and hot water circulation pump, and has no direct emissions. ECR states that typical EarthLinked heating systems will focus on commercial applications that require a minimum of 2,000 gallons per day such as restaurants and laundries.
The reader is encouraged to note that this is a heat pump water heater and performance results cannot be directly compared with those of conventional heating, ventilation, and air conditioning heat pumps.
The test plan defines the EarthLinked heat pump as the device under test (DUT). The DUT and its integration into the host facility are known as the system under test (SUT).
HOST FACILITY and INSTALLED SYSTEM DESCRIPTION
The Lake Towers Retirement Community, located in Sun City Center, Florida, served as the host facility. Tests occurred at the Sun Terrace, a one-story building with two residential wings for assisted living. Each wing has 15 rooms, each with a small vanity sink. Other domestic hot water (DHW) uses include two shower rooms, one bathtub, two utility closets, four nurses’ stations, and a kitchen.
The system has four 100-ft copper earth loops installed at a depth of 100-ft and in a vertical configuration. The facility’s DHW source consists of two 15 kilowatt (kW), 480 V electric water heaters operating in parallel. Each water heater has two electric elements controlled by a single theremostat. One element port in each heater was removed and is used for the heated water return from the DUT. As hot water at the site is used, cold city water enters the tanks. ECR claims that the EarthLinked system operates most efficiently when heating cold water. For this installation, the average return temperature to the heat pump was 94 oF. Table S-1 lists the specifications for the EarthLinked unit installed at the site.
S-2
Table S-1. EarthLinked Specifications
(Source: ECR Technologies, Inc.) Model Number HC-036-3ARated Performance 36,000 Btu Rated Coefficient of Performance 3.7 Heating Capacity 60 gal/hra
Width 24.375” Depth 12.375” Height 26.5” a rated at 90 oF water temperature rise
SRI/USEPA-GHG-VR-34 September 2006
A recirculation pump continuously cycles hot water from Tanks #1 and #2 through the building’s DHW piping and back to the tanks. The circulation loop ensures the immediate availability of hot water at each tap throughout the facility. Thermal losses due to this loop can be substantial. For the purposes of this test, thermal losses due to the recirculation loop are considered as part of the total site load.
VERIFICATION DESCRIPTION
A series of short-term tests and a long-term monitoring period were conducted to determine the performance of the EarthLinked system as compared to the baseline electric resistance-type hot water heaters.
Short-term testing was conducted on May 26, 2005. Industry-accepted American National Standards Institute (ANSI) / American Society of Heating, Refrigerating and Air-Conditioning Engineers (ASHRAE) Type V heat pump water heater test methods formed the basis for the short-term tests.
Short-term test verification parameters were:
• DUT water heating capacity while raising the lowest achievable city water temperature (likely to be approximately 72 oF in Florida in May) 20 oF or to whatever temperature can be achieved over a 60-minute period (whichever occurs first), British thermal units per hour (Btu/h)
• DUT water heating capacity while raising the water temperature from 110 to 130 oF or over a 60-minute period (whichever occurs first), Btu/h
• DUT coefficient of performance (COP) at the lower and elevated temperatures, dimensionless
• DUT standby heat loss rate, Btu/h, while operating with the EarthLinked system at 120 ± 5 oF
Long-term monitoring began on May 25, 2006 and continued through July 12, 2006. The goal of the long-term testing was to characterize the SUT performance in normal daily use. As such, the ANSI/ASHRAE test method was not valid for long-term testing. The ANSI/ASHRAE method is performed under controlled conditions over a specific temperature range and does not characterize in-use operations.
Long-term monitoring results allowed the assessment of:
• difference between SUT electrical power consumption with and without the EarthLinked system, kW
S-3
SRI/USEPA-GHG-VR-34 September 2006
• hot water usage and parasitic losses, kW • operational COP of the DUT, dimensionless • estimated EarthLinked carbon dioxide (CO2) and oxides of nitrogen (NOX) emission
changes as compared to the baseline electric water heater, lb/year • estimated simple cost savings based on the price of electricity saved, $/year
Rationale for the experimental design, determination of verification parameters, detailed testing procedures, test log forms, and quality assurance/quality control (QA/QC) procedures can be found in the test and quality assurance plan titled Test and Quality Assurance Plan – ECR Technologies, Inc. EarthLinked Ground-Source Heat Pump Water Heating System (Southern Research Institute, 2005), and the addendum to the test plan, titled Addendum to Test and Quality Assurance Plan - ECR Technologies, Inc. EarthLinked Ground-Source Heat Pump Water Heating System (Southern Research Institute, 2006).
VERIFICATION OF PERFORMANCE
Results of the verification are representative of the EarthLinked system’s performance as installed at the Lake Towers Retirement Community. Quality assurance (QA) oversight of the verification testing was provided following specifications in the ETV Quality Management Plan. This verification was supported by an audit of data quality (ADQ) conducted by the GHG Center QA manager. During the ADQ, the QA manager randomly selected data supporting each of the primary verification parameters and followed the data through the analysis and data processing system. The ADQ confirmed that no systematic errors were introduced during data handling and processing.
Short-Term Tests
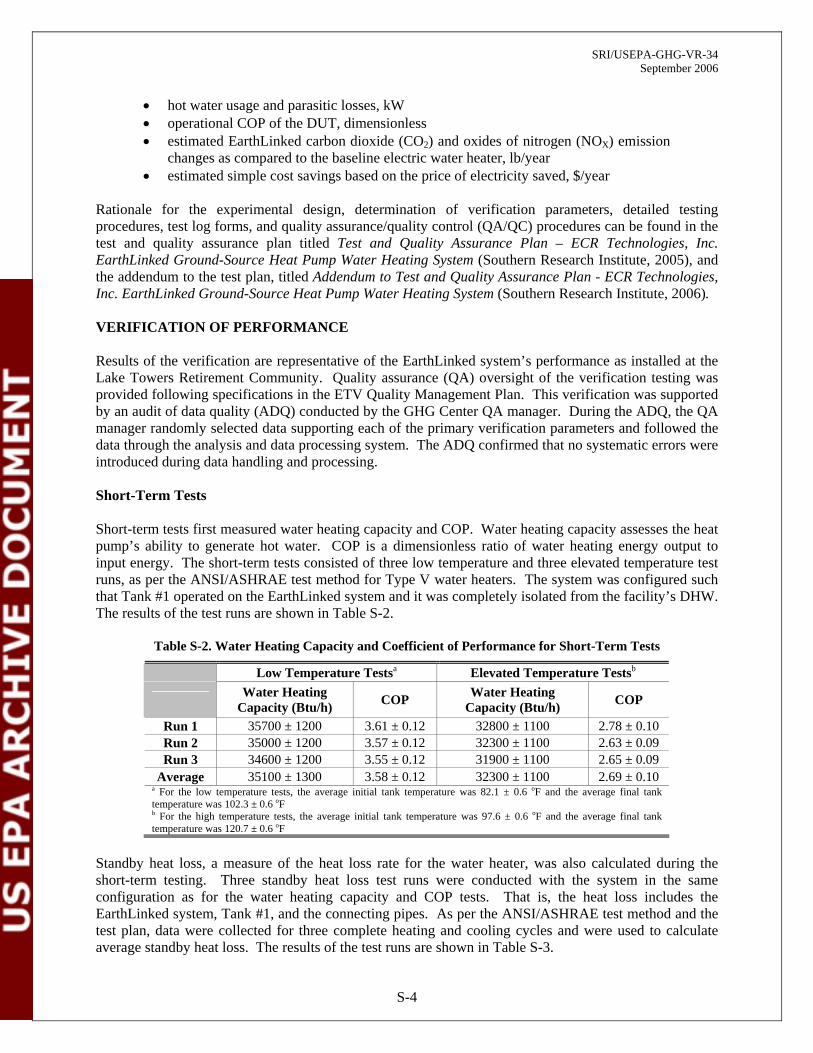
Short-term tests first measured water heating capacity and COP. Water heating capacity assesses the heat pump’s ability to generate hot water. COP is a dimensionless ratio of water heating energy output to input energy. The short-term tests consisted of three low temperature and three elevated temperature test runs, as per the ANSI/ASHRAE test method for Type V water heaters. The system was configured such that Tank #1 operated on the EarthLinked system and it was completely isolated from the facility’s DHW. The results of the test runs are shown in Table S-2.
Table S-2. Water Heating Capacity and Coefficient of Performance for Short-Term Tests
Low Temperature Testsa Elevated Temperature Testsb
Water Heating Capacity (Btu/h) COP Water Heating
Capacity (Btu/h) COP
Run 1 35700 ± 1200 3.61 ± 0.12 32800 ± 1100 2.78 ± 0.10 Run 2 35000 ± 1200 3.57 ± 0.12 32300 ± 1100 2.63 ± 0.09 Run 3 34600 ± 1200 3.55 ± 0.12 31900 ± 1100 2.65 ± 0.09
Average 35100 ± 1300 3.58 ± 0.12 32300 ± 1100 2.69 ± 0.10 a For the low temperature tests, the average initial tank temperature was 82.1 ± 0.6 oF and the average final tank temperature was 102.3 ± 0.6 oF b For the high temperature tests, the average initial tank temperature was 97.6 ± 0.6 oF and the average final tank temperature was 120.7 ± 0.6 oF
Standby heat loss, a measure of the heat loss rate for the water heater, was also calculated during the short-term testing. Three standby heat loss test runs were conducted with the system in the same configuration as for the water heating capacity and COP tests. That is, the heat loss includes the EarthLinked system, Tank #1, and the connecting pipes. As per the ANSI/ASHRAE test method and the test plan, data were collected for three complete heating and cooling cycles and were used to calculate average standby heat loss. The results of the test runs are shown in Table S-3.
S-4
SRI/USEPA-GHG-VR-34 September 2006
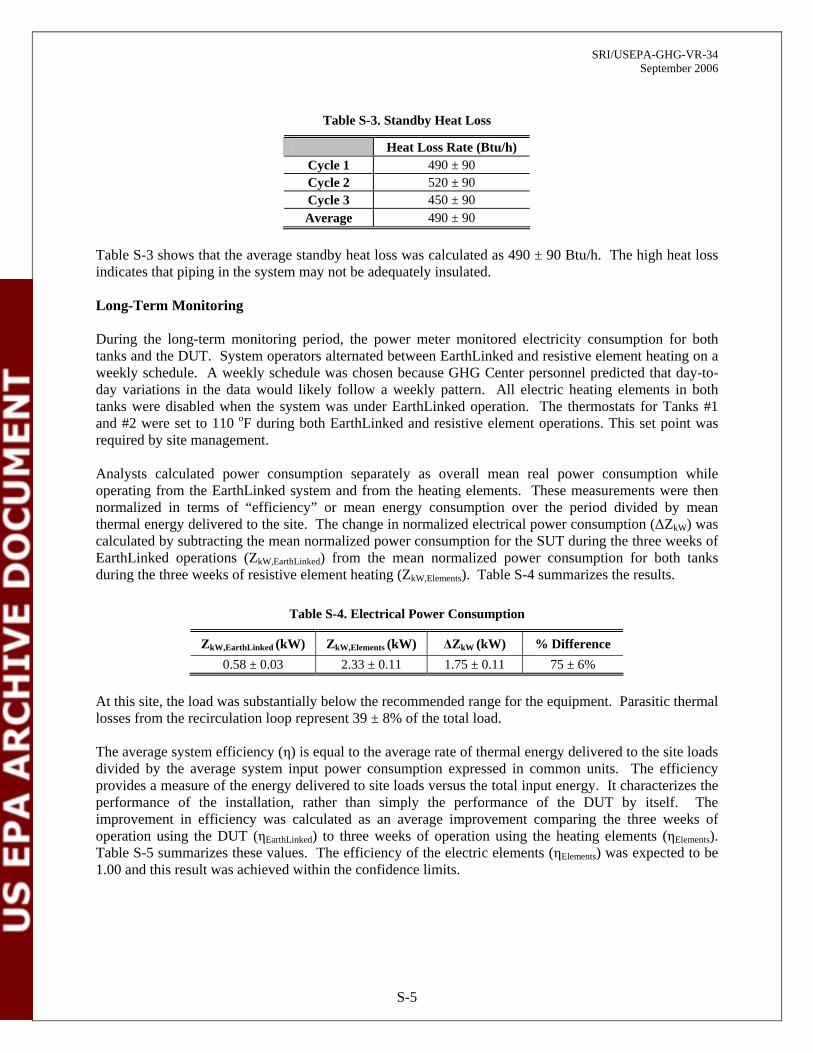
Table S-3. Standby Heat Loss
Heat Loss Rate (Btu/h) Cycle 1 490 ± 90 Cycle 2 520 ± 90 Cycle 3 450 ± 90 Average 490 ± 90
Table S-3 shows that the average standby heat loss was calculated as 490 ± 90 Btu/h. The high heat loss indicates that piping in the system may not be adequately insulated.
Long-Term Monitoring
During the long-term monitoring period, the power meter monitored electricity consumption for both tanks and the DUT. System operators alternated between EarthLinked and resistive element heating on a weekly schedule. A weekly schedule was chosen because GHG Center personnel predicted that day-today variations in the data would likely follow a weekly pattern. All electric heating elements in both tanks were disabled when the system was under EarthLinked operation. The thermostats for Tanks #1 and #2 were set to 110 oF during both EarthLinked and resistive element operations. This set point was required by site management.
Analysts calculated power consumption separately as overall mean real power consumption while operating from the EarthLinked system and from the heating elements. These measurements were then normalized in terms of “efficiency” or mean energy consumption over the period divided by mean thermal energy delivered to the site. The change in normalized electrical power consumption (∆ZkW) was calculated by subtracting the mean normalized power consumption for the SUT during the three weeks of EarthLinked operations (ZkW,EarthLinked) from the mean normalized power consumption for both tanks during the three weeks of resistive element heating (ZkW,Elements). Table S-4 summarizes the results.
Table S-4. Electrical Power Consumption
ZkW,EarthLinked (kW) ZkW,Elements (kW) ∆ZkW (kW) % Difference 0.58 ± 0.03 2.33 ± 0.11 1.75 ± 0.11 75 ± 6%
At this site, the load was substantially below the recommended range for the equipment. Parasitic thermal losses from the recirculation loop represent 39 ± 8% of the total load.
The average system efficiency (η) is equal to the average rate of thermal energy delivered to the site loads divided by the average system input power consumption expressed in common units. The efficiency provides a measure of the energy delivered to site loads versus the total input energy. It characterizes the performance of the installation, rather than simply the performance of the DUT by itself. The improvement in efficiency was calculated as an average improvement comparing the three weeks of operation using the DUT (ηEarthLinked) to three weeks of operation using the heating elements (ηElements). Table S-5 summarizes these values. The efficiency of the electric elements (ηElements) was expected to be 1.00 and this result was achieved within the confidence limits.
S-5

SRI/USEPA-GHG-VR-34 September 2006
Table S-5. Average System Efficiency
ηEarthLinked ηElements ∆η 4.01 ± 0.07 1.005 ± 0.018 3.00 ± 0.07
The operational COP of the DUT was also calculated. Operational COP differs from the efficiency reported in Table S-5. COP looks at the performance of only the DUT and is commonly used to characterize heat pump technologies. The efficiency characterizes the performance of the whole system installation, not just the DUT. Operational COP was calculated as the rate of energy delivered by the DUT to the site (ZkW, DUT ) versus the rate of energy consumed by the DUT (ZkW, EarthLinked) during actual operating conditions. This is distinct from the COP measured in the short-term tests. The short-term tests were performed under controlled conditions for a specific temperature range. This calculation of COP is performed during actual operating conditions. Table S-6 summarizes the results.
Table S-6. Operational Coefficient of Performance of the DUT
ZkW,DUT (kW) ZkW, EarthLinked (kW) COP 2.59 ± 0.19 0.58 ± 0.03 4.43 + 0.09, -0.3
The average COP of the DUT during the in-use monitoring was higher than the average COP observed in the short-term testing (refer to Table S-2). Calculation of COP for the short-term tests was conducted following the ANSI/ASHRAE tests for Type V heat pump water heaters. Analysts found that this procedure, however useful for comparison between different pieces of equipment of the same class under controlled circumstances, may not provide results that are directly representative of in-service operating conditions. Calculation of COP for the long-term tests was based on the ratio of thermal energy delivered by the device and the electrical energy consumed by the DUT.
The procedure used for estimating SUT emission reductions correlates the estimated annual electricity savings in megawatt-hours per year (MWh/year) with Florida and nationwide electric power system emission rates in pounds per megawatt-hour (lb/MWh). For this verification, analysts assumed that the EarthLinked system operates continuously throughout the year with electric power savings as measured during the long-term monitoring period (refer to Table S-4). Emission data from the EPA’s “EGRID” database were used to estimate state and nationwide emission rates. Table S-7 summarizes the estimated yearly emission reductions.
Table S-7. Estimated Yearly Emissions Reductions
Florida Nationwide Pollutant CO2 NOx CO2 NOx EREPS,i (lb/MWh) 1420.42 3.36 1392.49 2.96 MWhDUT,Ann (MWh/year) 15 ± 1 Emission Offset (lb/year) 21,700 ± 1,400 51 ± 3 21,300 ± 1,300 45 ± 3
The procedure for estimating SUT simple cost savings is based on the Florida and nationwide prices for retail electricity at “commercial” rates. Varying prices for retail electricity can be found in many resources. This methodology of estimating simple cost savings uses the prices found in the Energy Information Agency’s Table 5.6.A. Average Retail Price of Electricity to Ultimate Customers by End-Use Sector, by State. Similar to emissions reductions, analysts assumed that the EarthLinked system operates continuously throughout the year with electric power savings as measured during the long-term monitoring period. The EarthLinked
S-6

SRI/USEPA-GHG-VR-34 September 2006
system does not use auxiliary fuel, nor is it intended as a power source, so their potential costs or revenues are not considered for this verification. Table S-8 summarizes the estimated yearly cost savings.
Table S-8. Estimated Yearly Cost Savings*
Florida Nationwide MWhDUT,Ann (MWh/year) 15 ± 1 RPelec (cents/kWh) 9.88 9.2 Simple Cost Savings (dollars/year) 1,500 ± 100 1,410 ± 90 * Based on approximately 630 gallons per day average consumption on site. The intended load for this product is 2,000 gallons per day.
Details on the verification test design, measurement test procedures, and QA/QC procedures can be found in the test plan, titled Test and Quality Assurance Plan – ECR Technologies, Inc. EarthLinked Ground-Source Heat Pump Water Heating System (Southern Research Institute 2005), and the test plan addendum, titled Addendum to Test and Quality Assurance Plan - ECR Technologies, Inc. EarthLinked Ground-Source Heat Pump Water Heating System (Southern Research Institute 2006). Detailed results of the verification are presented in the final report, titled Environmental Technology Verification Report for ECR Technologies, Inc. EarthLinked Ground-Source Heat Pump Water Heating System (Southern Research Institute 2006). Both can be downloaded from the GHG Center’s web-site (www.sri-rtp.com) or the ETV Program web-site (www.epa.gov/etv).
Signed by Sally Gutierrez 09/27/06 Signed by Richard Adamson 09/20/06
Sally Gutierrez Richard Adamson Director Director National Risk Management Research Laboratory Greenhouse Gas Technology Center Office of Research and Development Southern Research Institute
Notice: GHG Center verifications are based on an evaluation of technology performance under specific, predetermined criteria and the appropriate quality assurance procedures. The EPA and Southern Research Institute make no expressed or implied warranties as to the performance of the technology and do not certify that a technology will always operate at the levels verified. The end user is solely responsible for complying with any and all applicable Federal, State, and Local requirements. Mention of commercial product names does not imply endorsement or recommendation.
EPA Review Notice This report has been peer and administratively reviewed by the U.S. Environmental Protection Agency, and approved for publication. Mention of trade names or commercial products does not constitute endorsement or recommendation for use.
S-7

SRI/USEPA-GHG-VR-34 September 2006
(this page intentionally left blank)
S-8
SRI/USEPA-GHG-VR-34 September 2006
Greenhouse Gas Technology Center ( ) A U.S. EPA Sponsored Environmental Technology Verification Organization
Environmental Technology Verification Report
ECR Technologies, Inc. EarthLinked® Ground-Source Heat Pump
Water Heating System
Prepared By: Greenhouse Gas Technology Center
Southern Research Institute PO Box 13825
Research Triangle Park, NC 27709 USA Telephone: 919/806-3456
Under EPA Cooperative Agreement
U.S. Environmental Protection AgencyOffice of Research and Development
National Risk Management Research LaboratoryAir Pollution Prevention and Control Division
Research Triangle Park, NC 27711 USA
EPA Project Officer: David A. Kirchgessner

SRI/USEPA-GHG-VR-34 September 2006
(this page intentionally left blank.)
SRI/USEPA-GHG-VR-34 September 2006
TABLE OF CONTENTS
Page
LIST OF FIGURES…………………………………………………………………………………………. ii LIST OF TABLES…………………………………………………………………………………………... ii DISTRIBUTION LIST……………………………………………………………………………………… iii ACKNOWLEDGEMENTS…………………………………………………………………………………. iv ABBREVIATIONS AND ACRONYMS …………………………………………………………………… v
1.0 INTRODUCTION .................................................................................................................................1-11.1 BACKGROUND ..........................................................................................................................1-11.2 EARTHLINKED TECHNOLOGY DESCRIPTION ...................................................................1-21.3 HOST FACILITY AND INSTALLED SYSTEM INTEGRATION............................................1-31.4 PERFORMANCE VERIFICATION OVERVIEW......................................................................1-6
2.0 VERIFICATION RESULTS................................................................................................................2-12.1 SHORT-TERM TEST RESULTS ................................................................................................2-1
2.1.1 Water Heating Capacity and COP....................................................................................2-12.1.2 Standby Heat Loss ...........................................................................................................2-3
2.2 LONG-TERM MONITORING RESULTS ..................................................................................2-42.2.1 Electrical Power Consumption.........................................................................................2-42.2.2 Parasitic Losses ................................................................................................................2-52.2.3 Average System Efficiency..............................................................................................2-82.2.4 Operational COP of the DUT...........................................................................................2-92.2.5 Estimated Emissions Reductions ...................................................................................2-102.2.6 Estimated Simple Cost Savings .....................................................................................2-11
3.0 DATA QUALITY ASSESSMENT.......................................................................................................3-13.1 DATA QUALITY OBJECTIVES ................................................................................................3-13.2 RECONCILIATION OF DQOS AND DQIS ...............................................................................3-13.3 AUDITS........................................................................................................................................3-4
4.0 TECHNICAL AND PERFORMANCE DATA SUPPLIED BY ECR TECHNOLOGIES ................................................................................................................................4-1
5.0 REFERENCES ......................................................................................................................................5-1
i
SRI/USEPA-GHG-VR-34 September 2006
LIST OF FIGURES Page
Figure 1-1. Plumbing Schematic and Sensor Locations ................................................................ 1-4Figure 1-2. System Electrical Schematic and Power Meter Location............................................ 1-4Figure 1-3. Lake Towers Installation............................................................................................. 1-5Figure 1-4. EarthLinked Water Heating System Compressor Unit ............................................... 1-6Figure 2-1. Parasitic Losses and Site Load for One Week ............................................................ 2-6Figure 2-2. Thermal Load Duration Curve over the Long-Term Monitoring................................ 2-7Figure 2-3. Electrical Load Duration Curve for the Heat Pump and Electric Elements ................ 2-8
LIST OF TABLES Page
Table 1-1. EarthLinked Specifications............................................................................................ 1-3Table 2-1. Heat Pump Water Heating Capacity and Coefficient of Performance for
Short-Term Tests .......................................................................................................... 2-2Table 2-2. Standby Heat Loss ......................................................................................................... 2-4Table 2-3. Electrical Power Consumption ...................................................................................... 2-5Table 2-4. Average System Efficiency ........................................................................................... 2-9Table 2-5. Operational COP of the DUT ...................................................................................... 2-10Table 2-6. Estimated Yearly Emissions Reductions ..................................................................... 2-11Table 2-7. Estimated Yearly Simple Cost Savings* ..................................................................... 2-11Table 3-1. Instrument and Accuracy Specifications ....................................................................... 3-2Table 3-2. QA/QC Checks.............................................................................................................. 3-3Table 3-3. Crosscheck between Type V and Type IV Test Methods ............................................. 3-3
ii
SRI/USEPA-GHG-VR-34 September 2006
DISTRIBUTION LIST
U.S. EPA David Kirchgessner Robert Wright
Southern Research Institute Richard Adamson Bill Chatterton
ECR Technologies, Inc. Joe Parsons
Johnson Research, LLC Russ Johnson
CANMET Energy Technology Centre Chris Snoek
iii

SRI/USEPA-GHG-VR-34 September 2006
ACKNOWLEDGEMENTS
The Greenhouse Gas Technology Center wishes to thank Joe Parsons, Russ Bath, and Shan Shevade of ECR Technologies for their assistance with this verification. Thanks are also extended to Russ Johnson, editor of the “In Hot Water” newsletter, and Chris Snoek of CANMET Energy Technology Centre for their inputs to this Verification Report. Finally, thanks go to the staff at the Lake Towers Retirement Community for their assistance with field activities.
iv

SRI/USEPA-GHG-VR-34 September 2006
ABBREVIATIONS AND ACRONYMS
ADQ audit of data quality ANSI American National Standards Institute ASHRAE American Society of Heating, Refrigerating, and Air-Conditioning Engineers Btu/h British thermal units per hour CO carbon monoxide CO2 carbon dioxide COP coefficient of performance DHW domestic hot water DQI data quality indicator DQO data quality objective DUT device under test ECR ECR Technologies, Inc. EPA U.S. Environmental Protection Agency ETV Environmental Technology Verification GHG Center Greenhouse Gas Technology Center kW kilowatt kWh kilowatt-hour lb/ft3 pounds per cubic foot lb/MWh pounds per megawatt-hour MWh megawatt-hour NOx oxides of nitrogen QA/QC quality assurance / quality control QMP quality management plan Southern Southern Research Institute SUT system under test
v

SRI/USEPA-GHG-VR-34 September 2006
(this page intentionally left blank)
vi

SRI/USEPA-GHG-VR-34 September 2006
1.0 INTRODUCTION
1.1 BACKGROUND
The U.S. Environmental Protection Agency’s (EPA) Office of Research and Development operates the Environmental Technology Verification (ETV) program to facilitate the deployment of innovative technologies. The program’s goal is to further environmental protection by accelerating the acceptance and use of these technologies. Primary ETV activities are independent performance verification and information dissemination. Congress funds ETV in response to the belief that many viable environmental technologies exist that are not being used for the lack of credible third-party performance data. With performance data developed under this program, technology buyers, financiers, and permitters will be better equipped to make informed decisions regarding new technology purchases and use.
The Greenhouse Gas Technology Center (GHG Center) is one of several ETV organizations. EPA’s ETV partner, Southern Research Institute (Southern), manages the GHG Center. The GHG Center conducts independent verification of promising energy efficiency, GHG mitigation, and GHG monitoring technologies. It develops verification Test and Quality Assurance Plans (test plans), conducts field tests, collects and interprets field and other data, obtains independent peer-review input, reports findings, and publicizes verifications through numerous outreach efforts. The GHG Center conducts verifications according to the externally reviewed test plans and recognized quality assurance/quality control (QA/QC) protocols.
Volunteer stakeholder groups guide the GHG Center’s ETV activities. These stakeholders advise on appropriate technologies for testing, help disseminate results, and review test plans and reports. National and international environmental policy, technology, and regulatory experts participate in the GHG Center’s Executive Stakeholder Group. The group includes industry trade organizations, environmental technology finance groups, governmental organizations, and other interested parties. Industry-specific stakeholders provide testing strategy guidance within their expertise and peer-review key documents prepared by the GHG Center.
GHG Center stakeholders are particularly interested in building heating and cooling technologies, including technologies used primarily to heat domestic hot water, with the potential to improve efficiency and reduce concomitant GHG and criteria pollutant emissions. The Energy Information Administration reports that in 1999 approximately 3.1 million commercial facilities in the U.S. consumed about 4.8 x 10¹² British thermal units per year (Btu/y). The portion of this energy consumption that is attributable to water heating varies significantly by facility type, but it averages about 11%, or 5.3 x 10¹¹ Btu/y.
ECR Technologies, Inc. (ECR) has addressed this issue with their EarthLinked water heating system. The system incorporates a ground-sourced heat pump into a building’s water heating system. ECR states that the EarthLinked system may provide up to 70% reduction in power consumption when compared to electric water heating systems of equivalent capacity. This reduced energy consumption would also reduce emissions from the electric power system’s generators or natural gas combustion in direct-fired systems. Broad utilization of such technologies could have a significant beneficial impact on GHG and pollutant emissions.
The GHG Center conducted a performance evaluation of the EarthLinked water heating system installed at a retirement community in Sun City Center, Florida. Testing began in May 2005 with a series of short-term tests to determine the EarthLinked heat pump’s performance. A four-week long-term monitoring
1-1

SRI/USEPA-GHG-VR-34 September 2006
period followed. In the course of performing the testing and analysis in accordance with the initial test plan, it was determined that the installation was not representative of what could be considered a ‘typical’ retro-fit installation for the subject technology. As the installation was originally configured, the heat pump did not contribute energy to the overall site load unless there was hot water usage. The heat pump did not contribute energy to supporting the parasitic loads in the system. Further, it was determined that the data collected was inadequate to credibly and accurately reflect the performance of a ‘typical’ installation. With that conclusion, it was determined that:
1) the data collected during the short-term testing performed under the original test plan is reflective of the performance of the ‘device under test’ (DUT) under controlled circumstances, but may not be under in-service operating conditions;
2) the integration with the site, which constitutes the ‘system under test’ (SUT), should be modified to be more reflective of a typical retrofit installation; and
3) data generated during the original long-term testing is invalid and testing should be repeated with a suitably modified instrumentation arrangement to correspond to the new configuration.
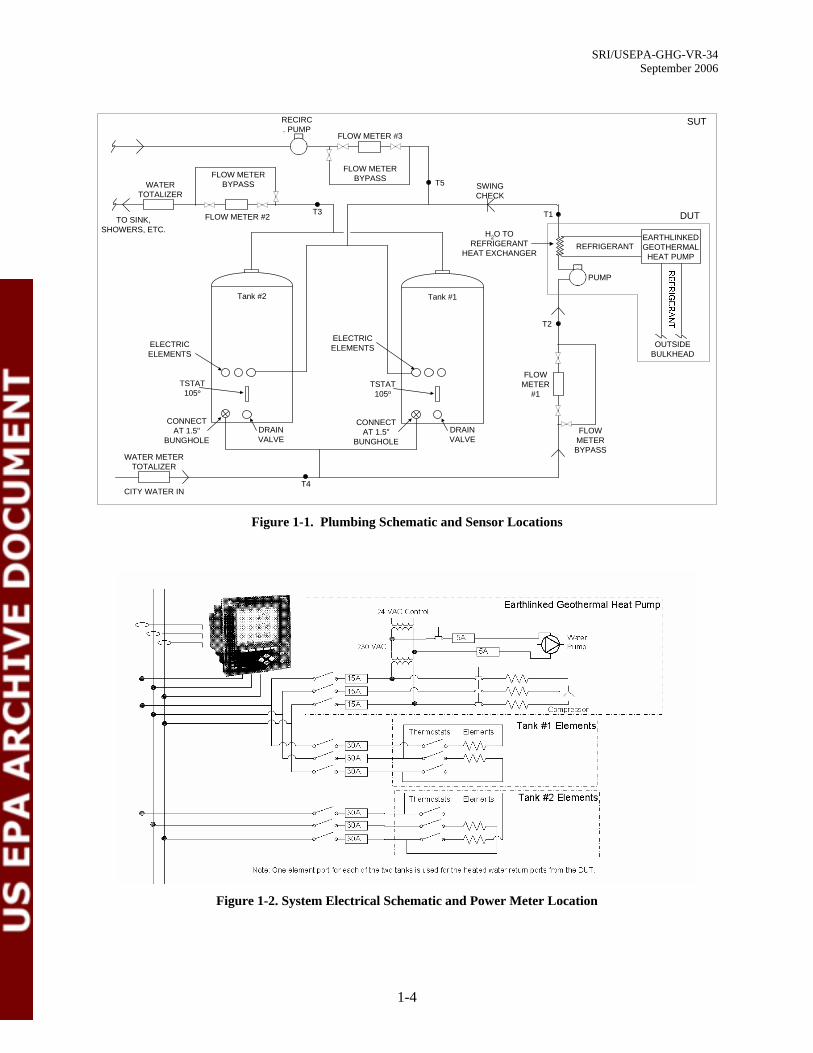
The modified system configuration is shown in Figure 1-1. In this configuration the heat pump supports the site’s parasitic loads, even in the absence of hot water usage.
Details on the verification test design, measurement test procedures, and QA/QC procedures can be found in the test plan, titled Test and Quality Assurance Plan - ECR Technologies, Inc. EarthLinked Ground-Source Heat Pump Water Heating System [1], and the test plan addendum, titled Addendum to Test and Quality Assurance Plan - ECR Technologies, Inc. EarthLinked Ground-Source Heat Pump Water Heating System [2]. They can be downloaded from the GHG Center’s website (www.sri-rtp.com) or the ETV program website (www.epa.gov/etv). The test plan describes the DUT, the SUT, project participants, original test procedures, site specific instrumentation and measurements, and verification specific QA/QC goals. The test plan addendum documents the adjustments to the instrumentation and analysis corresponding to the new system configuration. Both documents were reviewed and revised based on comments received from ECR Technologies and the EPA Quality Assurance Team. The test plan and test plan addendum meet the requirements of the GHG Center's Quality Management Plan (QMP) and satisfy the ETV QMP requirements.
The remainder of Section 1.0 describes the EarthLinked water heating system technology and the test facility, and outlines the performance verification procedures that were followed. Section 2.0 presents test results, and Section 3.0 assesses the quality of the data obtained. Section 4.0, submitted by ECR Technologies, presents additional information regarding the system. Information provided in Section 4.0 has not been independently verified by the GHG Center.
1.2 EARTHLINKED TECHNOLOGY DESCRIPTION
The following technology description is based on information provided by ECR and does not represent verified information. The EarthLinked system typically consists of two or more 50- or 100-foot copper refrigerant loops (earth loops) installed in the ground, a compressor, a heat exchanger, refrigerant liquid flow controls, and an active charge control. The earth loops can be installed in horizontal, vertical, or diagonal configurations. The EarthLinked system circulates non-ozone depleting refrigerant (R-407c) through the copper earth loops. The manufacturer claims that the system’s direct heat transfer from the earth to the refrigerant is intended to improve heat transfer efficiency.
1-2

Table 1-1. EarthLinked Specifications
(Source: ECR Technologies, Inc.) Model Number HC-036-3ARated Performance 36,000 Btu Rated Coefficient of Performance 3.7 Heating Capacity 60 gal/hra
Width 24.375” Depth 12.375” Height 26.5”
SRI/USEPA-GHG-VR-34 September 2006
The liquid refrigerant absorbs heat from the ground, which is typically at a constant temperature year round (40-80 ºF, depending on location), and vaporizes. A compressor raises the refrigerant pressure and routes it to a heat exchanger. There, the vapor condenses and yields the latent heat of vaporization to domestic water passing through a heat exchanger and circulating back to the hot water tanks. Refrigerant is then returned to the earth loops via a patented refrigerant flow control device.
The EarthLinked system consumes power in the compressor and hot water circulation pump, and has no direct emissions. ECR states that typical EarthLinked heating systems will focus on commercial applications that require a minimum of 2,000 gallons per day such as restaurants and laundries.
The reader is encouraged to note that this is a heat pump water heater and performance results cannot be directly compared with those of conventional heating, ventilation, and air conditioning heat pumps.
The test plan defines the EarthLinked heat pump as the DUT. The DUT and its integration into the host facility are known as the SUT. Figure 1-1 shows DUT and SUT boundaries.
1.3 HOST FACILITY AND INSTALLED SYSTEM INTEGRATION
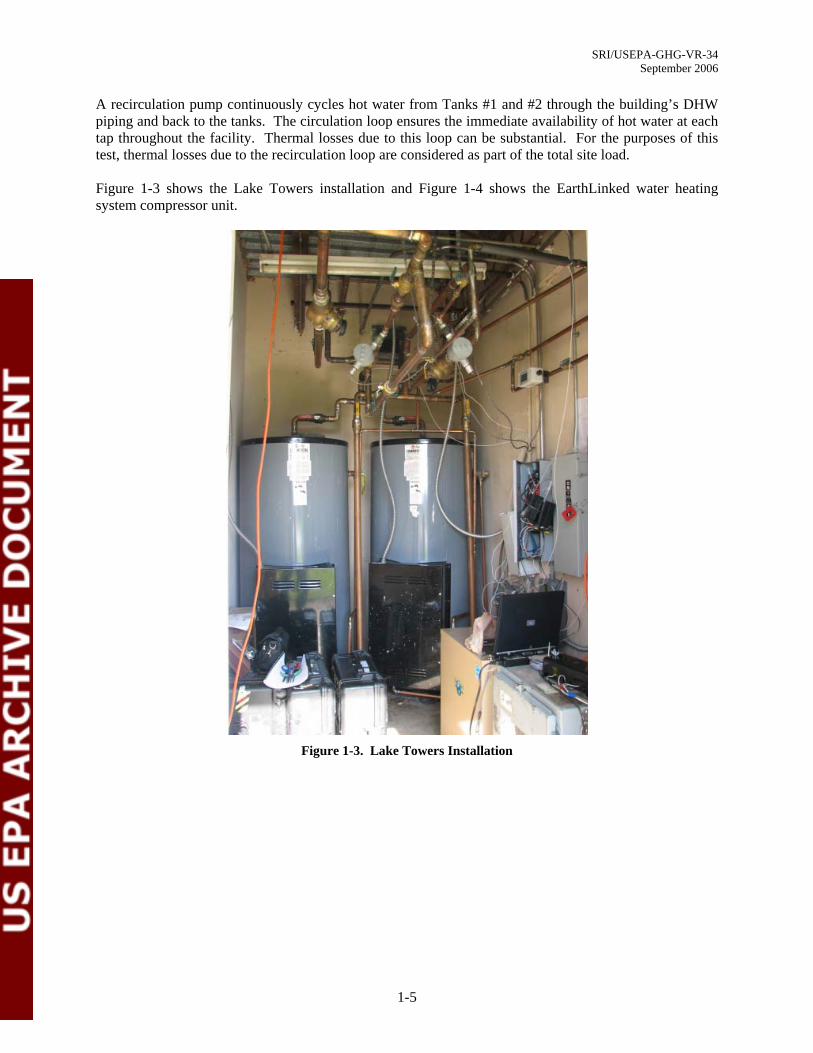
The Lake Towers Retirement Community, located in Sun City Center, Florida, served as the host facility. Tests occurred at the Sun Terrace, a one-story building with two residential wings for assisted living. Each wing has 15 rooms, each with a small vanity sink. Other domestic hot water (DHW) uses include two shower rooms, one bathtub, two utility closets, four nurses’ stations, and a kitchen.
The system has four 100-ft copper earth loops installed at a depth of 100-ft and in a vertical configuration. The facility’s DHW source consists of two 15 kilowatt (kW), 480 V electric water heaters operating in parallel. Each water heater has two electric elements controlled by a single theremostat. One element port in each heater was removed and is used for the heated water return from the DUT. As hot water at the site is used, cold city water enters the tanks. ECR claims that the EarthLinked system operates most efficiently when heating cold water. For this installation, the average return temperature to the heat pump (T2 in Figure 1-1) was 94 oF. Table 1-1 lists the specifications for the EarthLinked unit installed at the site.
a rated at 90 oF water temperature rise
Figure 1-1 shows the plumbing schematic and sensor locations for the installation. It also shows the DUT and SUT boundaries. Figure 1-2 shows the system electrical schematic and power meter location.
1-3
SRI/USEPA-GHG-VR-34 September 2006
Tank #2 Tank #1
H2O TO REFRIGERANT
HEAT EXCHANGER
PUMP
DRAIN VALVE
DRAIN VALVE
CONNECT AT 1.5"
BUNGHOLE
CONNECT AT 1.5"
BUNGHOLE
RECIRC . PUMP
TSTAT 105o
TSTAT 105o
FLOW METER #3
CITY WATER IN
WATER METER TOTALIZER
T4
T2
FLOW METER
#1
WATER TOTALIZER
FLOW METER #2
FLOW METER BYPASS
FLOW METER BYPASS
FLOW METER BYPASS T5
T1T3 TO SINK,
SHOWERS, ETC.
SWING CHECK
DUT
SUT
EARTHLINKED GEOTHERMAL
HEAT PUMP REFRIGERANT
OUTSIDE BULKHEAD
ELECTRIC ELEMENTS
ELECTRIC ELEMENTS
Figure 1-1. Plumbing Schematic and Sensor Locations
Figure 1-2. System Electrical Schematic and Power Meter Location
1-4
SRI/USEPA-GHG-VR-34 September 2006
A recirculation pump continuously cycles hot water from Tanks #1 and #2 through the building’s DHW piping and back to the tanks. The circulation loop ensures the immediate availability of hot water at each tap throughout the facility. Thermal losses due to this loop can be substantial. For the purposes of this test, thermal losses due to the recirculation loop are considered as part of the total site load.
Figure 1-3 shows the Lake Towers installation and Figure 1-4 shows the EarthLinked water heating system compressor unit.
Figure 1-3. Lake Towers Installation
1-5

SRI/USEPA-GHG-VR-34 September 2006
Figure 1-4. EarthLinked Water Heating System Compressor Unit
1.4 PERFORMANCE VERIFICATION OVERVIEW
A series of short-term tests and a long-term monitoring period were conducted to determine the performance of the EarthLinked system as compared to the baseline electric resistance-type hot water heaters.
Short-term testing was conducted on May 26, 2005. Industry-accepted American National Standards Institute (ANSI) / American Society of Heating, Refrigerating and Air-Conditioning Engineers (ASHRAE) Type V heat pump water heater test methods [3] formed the basis for the short-term tests. This is a quasi-steady-state test that measures the change in temperature of the storage tank over time. The short-term tests were conducted with the system in its original piping configuration, as described in the test plan [1]. A diagram of the original piping configuration is also in the test plan.
Short-term test verification parameters were:
• DUT water heating capacity while raising the lowest achievable city water temperature (likely to be approximately 72 oF in Florida in May) 20 oF or to whatever temperature can be achieved over a 60-minute period (whichever occurs first), British thermal units per hour (Btu/h)
• DUT water heating capacity while raising the water temperature from 110 to 130 oF or over a 60-minute period (whichever occurs first), Btu/h
• DUT coefficient of performance (COP) at the lower and elevated temperatures, dimensionless
• DUT standby heat loss rate, Btu/h, while operating with the EarthLinked system at 120 ± 5 oF
Long-term monitoring began on May 25, 2006 and continued through July 12, 2006. The goal of the long-term testing was to characterize the SUT performance in normal daily use. As such, the ANSI/ASHRAE test method was not valid for long-term testing. The ANSI/ASHRAE method is performed under controlled conditions over a specific temperature range and does not characterize in-use operations.
1-6
SRI/USEPA-GHG-VR-34 September 2006
Long-term monitoring occurred with the system in the modified piping configuration, depicted in Figure 1-1. Monitoring began with the tanks operating on the EarthLinked water heating system and the electric elements disabled. After a period of one week, ECR operators set the controls for the tanks to operate on the electric heating elements and disabled the EarthLinked system for one week. This pattern continued for six weeks. A weekly schedule was chosen because GHG Center personnel predicted that day-to-day variations in the data would likely follow a weekly pattern. GHG Center personnel periodically downloaded test data from the local data acquisition system by telephone modem.
Long-term monitoring results allowed the assessment of:
• difference between SUT electrical power consumption with and without the EarthLinked system, kW
• hot water usage and parasitic losses, kW • operational COP of the DUT, dimensionless • estimated EarthLinked carbon dioxide (CO2) and oxides of nitrogen (NOX) emission
changes as compared to the baseline electric water heater, lb/year • estimated simple cost savings based on the price of electricity saved, dollars/year
Circulating flow rate through the DUT, as measured by Flow Meter 1 in Figure 1-1, and the change in temperature across the DUT, measured at T1 and T2, provide a measure of the thermal energy delivered to the hot water tanks. Flow Meter 3 and the differential temperature between T3 and T5 provide a measure of the parasitic thermal energy lost in the recirculation loop. The difference between the flow measurement at Flow Meter 2 and Flow Meter 3 and the differential temperature measured across T4 and T3 provides a measure of the thermal energy delivered to the intended loads. That is, the total thermal energy delivered to the site less the parasitic losses.
1-7

SRI/USEPA-GHG-VR-34 September 2006
.
(this page intentionally left blank)
1-8

⎛ C ⎞pV × ⎜⎜C × v ⎟⎟ × (Tmhf − Tmh0 )
Qh =⎝ fg ⎠ + Qhs (t fh − t 0h )
SRI/USEPA-GHG-VR-34 September 2006
2.0 VERIFICATION RESULTS
Results of the verification are representative of the EarthLinked system’s performance as installed at the Lake Towers Retirement Community. Performance of ground-source heat pumps is known to be dependent on sub-soil temperatures. Results obtained in different geographic areas may differ from those obtained at this site in Florida.
2.1 SHORT-TERM TEST RESULTS
2.1.1 Water Heating Capacity and COP
Short-term testing measured water heating capacity and COP. Water heating capacity assesses the heat pump’s ability to generate hot water. COP is a dimensionless ratio of water heating energy output to input energy.
The short-term tests consisted of three low temperature and three elevated temperature test runs, as per the ANSI/ASHRAE test method for Type V water heaters. ECR personnel installed the EarthLinked system on Tank #1, with provisions to operate either the tank’s electric heating elements or the EarthLinked system. GHG Center personnel isolated Tank #1 from the facility’s DHW during the short-term tests, with the site operating solely on Tank #2 during the test period. A summary of the ANSI/ASHRAE test procedure for the short-term testing follows:
1. Completely drain Tank #1 and refill with the coldest possible city water. Enable data logging. 2. Disable Tank #1 heating elements, record the mean tank temperature, Tmh0, and enable the
EarthLinked system. 3. Continue the test until Tmh has increased by 20 oF or until 60 minutes have elapsed. Record the
final mean tank temperature, Tmhf, and actual elapsed time for the final Tmhf reading. 4. Repeat steps 1 through 3 until three valid test runs are completed. 5. Raise the mean Tank #1 temperature, either with the heat pump or heating elements, to 110 oF. 6. Disable Tank #1 heating elements, record the initial mean tank temperature, Tmh0, and enable the
EarthLinked system. Enable data logging. 7. Continue the test until Tmh has increased by 20 oF or until 60 minutes have elapsed. Record the
final mean tank temperature, Tmhf, and actual elapsed time for the final Tmhf reading. 8. Admit cold water into the tank while discharging heated water until Tmh is less than 110 oF. Raise
the mean tank temperature back to 110 oF. 9. Repeat steps 5 through 8 until three valid test runs are completed at the elevated
temperature.
Water heating capacity (§10.3.2 of [3]) is calculated as:
Eqn. 2-1
2-1

C × Z Qhe = (t fh
ge
− t 0h
h
)
COPh =Qh Qhe
a Low Temperature Tests b Elevated Temperature TestsWater Heating
Capacity (Btu/h) COP Water Heating Capacity (Btu/h) COP
Run 1 35700 ± 1200 3.61 ± 0.12 32800 ± 1100 2.78 ± 0.10 Run 2 35000 ± 1200 3.57 ± 0.12 32300 ± 1100 2.63 ± 0.09 Run 3 34600 ± 1200 3.55 ± 0.12 31900 ± 1100 2.65 ± 0.09
Average 35100 ± 1300 3.58 ± 0.12 32300 ± 1100 2.69 ± 0.10
SRI/USEPA-GHG-VR-34 September 2006
where: Qh = Water heating capacity, Btu/h V = Storage tank capacity, gal (116.3 for this test series) Cp = Specific heat of water at the mean of Tmhf and Tmh0 (from [4]), Btu/lb oF Cfg = Volume conversion factor, 7.48055 gal/ft3
v = Specific volume of water at the mean system pressure (from [5]), ft3/lb Tmhf = Final mean tank temperature (as the average of 6 in-tank sensors), oF Tmh0 = Initial mean tank temperature (as the average of 6 in-tank sensors), oF tfh = Final time stamp, h t0h = Initial time stamp, h Qhs = Mean storage tank heat loss rate as calculated in Equation 2-5, Btu/h or as
estimated from manufacturer’s data (341.2 Btu/h for this test series)
Electric power usage is:
Eqn. 2-2
where: Qhe = Electric power consumption as Btu/h Cge = Power conversion factor, 3412 Btu/kWh Zh = Electric energy consumption, kWh
COP is:
Eqn. 2-3
The results of the test runs are shown in Table 2-1. The average water heating capacity for the low temperature tests was 35,100 ± 1,300 Btu/h. This yields an average COP of 3.58 ± 0.12. The average water heating capacity for the elevated temperature tests was 32,300 ± 1,100 Btu/h. This yields an average COP of 2.69 ± 0.10.
Table 2-1. Heat Pump Water Heating Capacity and Coefficient of Performance for Short-Term Tests
a For the low temperature tests, the average initial tank temperature was 82.1 ± 0.6 oF and the average final tank temperature was 102.3 ± 0.6 oF b For the high temperature tests, the average initial tank temperature was 97.6 ± 0.6 oF and the average final tank temperature was 120.7 ± 0.6 oF
2-2
⎛ Tmhsf − Tahsf ⎞ Cpln V ×
L = ⎝⎜⎜ Tmhs0 −
(tTahs0
−⎠⎟⎟
t
× Cfg × v
hsfhs 0hs )
(Tmh0 − Tah0 )+ (Tmhf − Tahf )Qhs = Lhs,mean × 2
SRI/USEPA-GHG-VR-34 September 2006
2.1.2 Standby Heat Loss
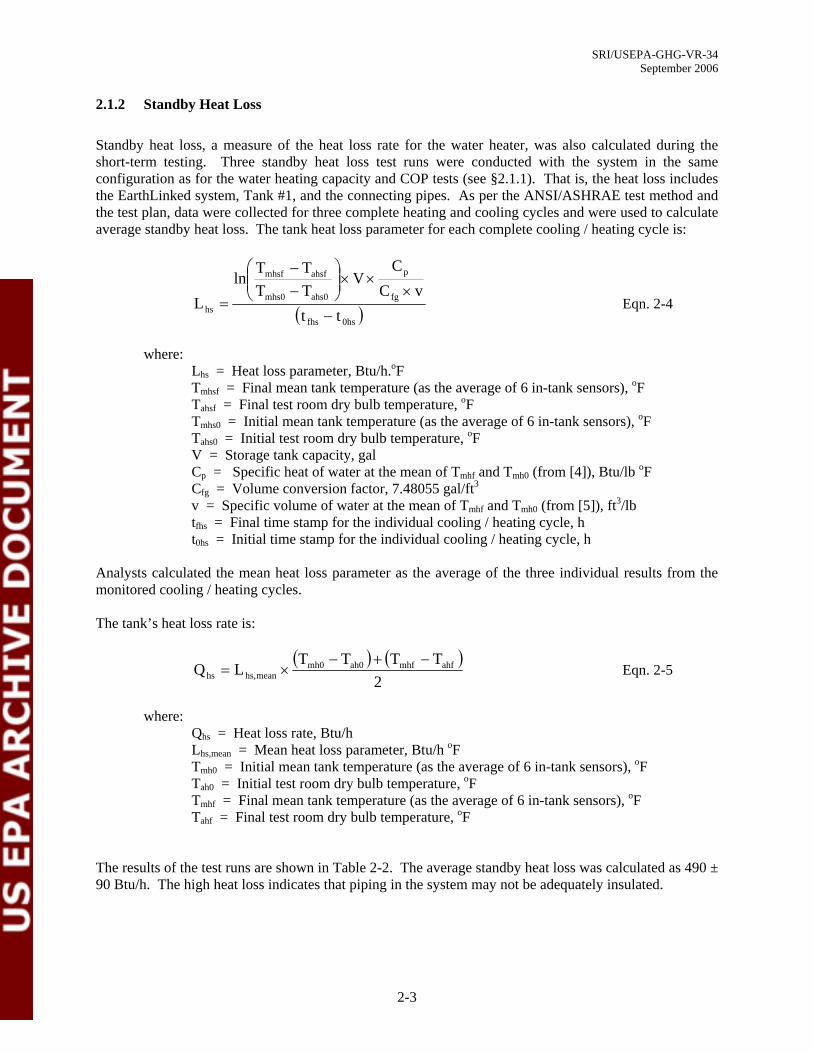
Standby heat loss, a measure of the heat loss rate for the water heater, was also calculated during the short-term testing. Three standby heat loss test runs were conducted with the system in the same configuration as for the water heating capacity and COP tests (see §2.1.1). That is, the heat loss includes the EarthLinked system, Tank #1, and the connecting pipes. As per the ANSI/ASHRAE test method and the test plan, data were collected for three complete heating and cooling cycles and were used to calculate average standby heat loss. The tank heat loss parameter for each complete cooling / heating cycle is:
Eqn. 2-4
where: Lhs = Heat loss parameter, Btu/h.oF Tmhsf = Final mean tank temperature (as the average of 6 in-tank sensors), oF Tahsf = Final test room dry bulb temperature, oF Tmhs0 = Initial mean tank temperature (as the average of 6 in-tank sensors), oF Tahs0 = Initial test room dry bulb temperature, oF V = Storage tank capacity, gal Cp = Specific heat of water at the mean of Tmhf and Tmh0 (from [4]), Btu/lb oF Cfg = Volume conversion factor, 7.48055 gal/ft3
v = Specific volume of water at the mean of Tmhf and Tmh0 (from [5]), ft3/lb tfhs = Final time stamp for the individual cooling / heating cycle, h t0hs = Initial time stamp for the individual cooling / heating cycle, h
Analysts calculated the mean heat loss parameter as the average of the three individual results from the monitored cooling / heating cycles.
The tank’s heat loss rate is:
Eqn. 2-5
where: Qhs = Heat loss rate, Btu/h Lhs,mean = Mean heat loss parameter, Btu/h oF Tmh0 = Initial mean tank temperature (as the average of 6 in-tank sensors), oF Tah0 = Initial test room dry bulb temperature, oF Tmhf = Final mean tank temperature (as the average of 6 in-tank sensors), oF Tahf = Final test room dry bulb temperature, oF
The results of the test runs are shown in Table 2-2. The average standby heat loss was calculated as 490 ± 90 Btu/h. The high heat loss indicates that piping in the system may not be adequately insulated.
2-3

Heat Loss Rate (Btu/h) Cycle 1 490 ± 90Cycle 2 520 ± 90Cycle 3 450 ± 90Average 490 ± 90
ZkW,i,N =ZS × ZkW,i Zs,i
SRI/USEPA-GHG-VR-34 September 2006
Table 2-2. Standby Heat Loss
2.2 LONG-TERM MONITORING RESULTS
During the long-term monitoring period, the power meter monitored electricity consumption for both tanks and the DUT. System operators alternated between EarthLinked and resistive element heating on a weekly schedule. All electric heating elements in both tanks were disabled when the system was under EarthLinked operation. The thermostats for Tanks #1 and #2 were set to 110 oF during both EarthLinked and resistive element operations. This set point was required by site management.
Long-term monitoring began with the tanks operating on the EarthLinked system. The system operated in this configuration for one week before it was switched to operate on the electric heating elements. This configuration pattern began on May 25, 2006 and continued for six weeks, with the completion of long-term monitoring on July 12, 2006.
2.2.1 Electrical Power Consumption
Analysts calculated power consumption separately as overall mean real power consumption while operating from the EarthLinked system and from the heating elements. These measurements were then normalized in terms of “efficiency” or mean energy consumption over the period divided by mean thermal energy delivered to the site. Normalized power consumption for each week was calculated as follows:
Eqn. 2-6
where: Zkw,i,N = normalized power consumption for week “i”, kW ZS = mean rate of energy delivered to site over all 6 weeks of monitoring, kW Zs,i = mean rate of energy delivered to the site during week “i”, kW ZkW,i = mean power consumption during week “i”, kW
The mean rate of energy delivered to the site, Zs, was calculated as the sum of the rate of energy delivered to loads such as showers and sinks, ZL, and the rate of parasitic losses in the recirculation loop, ZP. The equations are as follows:
Z L = (F2 − F3 ) × (T4 − T3 ) × C p × ρ Eqn. 2-7
ZP = (T5 − T3 )× F3 × Cp × ρ Equ. 2-8
2-4

SRI/USEPA-GHG-VR-34 September 2006
Z S = Z L + Z P Eqn. 2-9
where: F2 = water flow rate measured by Flow Meter #2 F3 = water flow rate measured by Flow Meter #3 T3, T4, T5 = temperatures measured at locations on Figure 1-1 Cp = the heat capacity of water and is a function of temperature and pressure; ρ = the density of water, also a function of temperature and pressure.
The change in normalized electrical power consumption (∆ZkW) was calculated by subtracting the mean normalized power consumption for the SUT during the three weeks of EarthLinked operations (ZkW,EarthLinked) from the mean normalized power consumption for both tanks during the three weeks of resistive element heating (ZkW,Elements). Table 2-3 summarizes the results. The average difference in power consumption for the two heating systems was 1.75 ± 0.11 kW. This is a 75 ± 6% decrease in power consumption with the EarthLinked system.
Table 2-3. Electrical Power Consumption
ZkW,EarthLinked (kW) ZkW,Elements (kW) ∆ZkW (kW) % Difference 0.58 ± 0.03 2.33 ± 0.11 1.75 ± 0.11 75 ± 6%
2.2.2 Parasitic Losses
The site’s recirculation pump continuously circulates water through the hot water system and back to the heating tanks. This ensures a minimum delay at the tap when a resident calls for hot water. Depending on the flow rate and insulation on the supply and return piping, thermal losses due to this circulation can be substantial. These losses are defined as the parasitic losses for this system. Figure 2-1 shows the average rate of thermal energy delivered to the site (ZS) and the parasitic loss rate (ZP) due to the recirculation loop during one week in the monitoring period. The chart depicts a two-hour rolling average, which smoothes out fluctuations in the data to show the trends more clearly.
2-5

SRI/USEPA-GHG-VR-34 September 2006
0
1
2
3
4
5
6
7
8
kW
Zs
ZP
1 week
Figure 2-1. Parasitic Losses and Site Load for One Week
The parasitic load was fairly constant throughout the week. This is typical of all weeks in the monitoring period. Overall, the average rate of thermal energy delivered to the site (ZS) for the monitoring period was 2.34 ± 0.17 kW. The average rate of thermal energy delivered to loads such as sinks and showers (ZL) was 1.43 ± 0.03 kW. The average parasitic loss rate for the six-week period was 0.91 ± 0.03 kW, accounting for 39 ± 8% of the average rate of thermal energy delivered to the site.
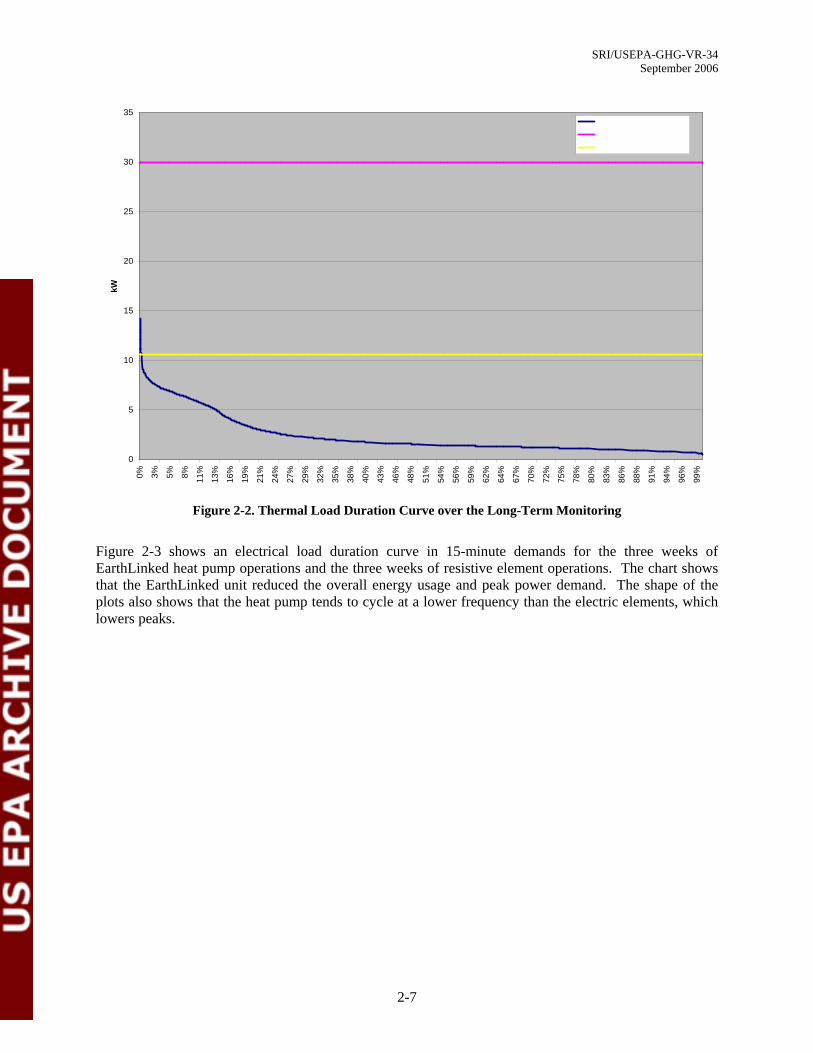
Figure 2-2 shows a load duration curve for the rate of thermal energy delivered to the site (ZS) over the six-week monitoring period in 15-minute demands. The chart shows that both the heat pump and the water heaters were oversized for this installation.
2-6
kW
30
25
20
15
10
5
0
35 Zs Water Heater Capacity Heat Pump Capacity
0% 3% 5% 8% 11%
13%
16%
19%
21%
24%
27%
29%
32%
35%
38%
40%
43%
46%
48%
51%
54%
56%
59%
62%
64%
67%
70%
72%
75%
78%
80%
83%
86%
88%
91%
94%
96%
99%
SRI/USEPA-GHG-VR-34 September 2006
Figure 2-2. Thermal Load Duration Curve over the Long-Term Monitoring
Figure 2-3 shows an electrical load duration curve in 15-minute demands for the three weeks of EarthLinked heat pump operations and the three weeks of resistive element operations. The chart shows that the EarthLinked unit reduced the overall energy usage and peak power demand. The shape of the plots also shows that the heat pump tends to cycle at a lower frequency than the electric elements, which lowers peaks.
2-7

20 kW
18
16
14
12
10
8
6
4
2
0
Heat Pump Resistive Elements
0% 2% 3% 5% 6% 7% 9% 10%
12%
13%
15%
16%
18%
19%
21%
22%
24%
25%
27%
28%
30%
31%
33%
34%
36%
37%
39%
40%
42%
43%
45%
46%
48%
49%
51%
52%
54%
55%
Zη = s
ZkW
Zηelements =
s ZkW,elements
SRI/USEPA-GHG-VR-34 September 2006
Figure 2-3. Electrical Load Duration Curve for the Heat Pump and Electric Elements
2.2.3 Average System Efficiency
The average system efficiency (η) is equal to the average rate of thermal energy delivered to the site loads divided by the average system input power consumption expressed in common units. The efficiency provides a measure of the energy delivered to site loads versus the total input energy. It characterizes the performance of the installation, rather than simply the performance of the DUT by itself. Efficiency is calculated as:
Eqn. 2-10
Thus, for the resistive elements case:
Eqn. 2-11
And for the DUT case:
2-8

ZηEarthlinked =
s
ZkW,Earthlinked
ZkW,DUTCOP = ZkW,Earthlinked
SRI/USEPA-GHG-VR-34 September 2006
Eqn. 2-12
The improvement in efficiency was calculated as an average improvement comparing the three weeks of operation using the DUT (ηEarthLinked) to three weeks of operation using the heating elements (ηElements). Table 2-4 summarizes these values.
Table 2-4. Average System Efficiency
ηEarthLinked ηElements ∆η 4.01 ± 0.07 1.005 ± 0.018 3.00 ± 0.07
The efficiency of the electric elements (ηElements) was expected to be 1.00 and this result was achieved within the confidence limits.
2.2.4 Operational COP of the DUT
The operational COP of the DUT was also calculated. The operational COP differs from the efficiency reported in Table 2-4. COP looks at the performance of only the DUT and is commonly used to characterize heat pump technologies. The efficiency characterizes the performance of the whole system installation, not just the DUT.
Operational COP is calculated as the ratio of the rate of energy delivered by the DUT to the site (ZkW, DUT) versus the rate of energy consumed by the DUT (ZkW, EarthLinked) during actual operating conditions. This is distinct from the COP measured in the short-term tests. The short-term tests were performed under controlled conditions for a specific temperature range. This calculation of COP is performed during actual operating conditions. It was calculated as:
ZkW,DUT = (T1 − T2 ) × F1 × Cp × ρ Eqn. 2-13
Eqn. 2-14
where: ZkW,DUT = from Eqn. 2-13 ZkW,EarthLinked from Table 2-3 F1 = water flow rate measured by Flow Meter #1 (see Figure 1-1) T1 and T2 = temperatures measured at the heat pump inlet and outlet Cp = the heat capacity of water and is a function of temperature and pressure ρ = the density of water, also a function of temperature and pressure.
Table 2-5 summarizes the results.
2-9
SRI/USEPA-GHG-VR-34 September 2006
Table 2-5. Operational COP of the DUT
ZkW,DUT (kW) ZkW, EarthLinked (kW) COP 2.59 ± 0.19 0.58 ± 0.03 4.43 + 0.09, -0.3
The reader is encouraged to note that this technology is a heat pump water heater and the performance results cannot be directly compared with those of conventional heating, ventilation, and air conditioning heat pumps.
It should be noted that the COP has asymmetric error. During post-test equipment calibration checks, GHG Center personnel discovered that the Hedland flow meter (F1 in Figure 1-1) was over-reporting flow by approximately 6%. The meter was calibrated prior to testing and was found to be within its specification of ±1% at that time. Flow readings from the meter were consistent throughout the test period, so this led analysts to conclude that something occurred in shipping either before or after testing that caused the meter to be out of spec. If the assumption is made that the meter over-reported flow throughout the test, this would result in an over-reported COP. As such, the lower error limit was modified to include the effect of the 6% bias.
The average COP of the DUT during the in-use monitoring was higher than the average COP observed in the short-term testing (refer to Table 2-1). Calculation of COP for the short-term tests was conducted following the ANSI/ASHRAE tests for Type V heat pump water heaters. Analysts found that this procedure, however useful for comparison between different pieces of equipment of the same class under controlled circumstances, may not provide results that are directly representative of in-service operating conditions. Calculation of COP for the long-term tests was based on the ratio of thermal energy delivered by the device and the electrical energy consumed by the DUT.
2.2.5 Estimated Emissions Reductions
The procedure used for estimating SUT emission reductions correlates the estimated annual electricity savings in megawatt-hours per year (MWh/year) with Florida and nationwide electric power system emission rates in pounds per megawatt-hour (lb/MWh). For this verification, analysts assumed that the EarthLinked system operates continuously throughout the year with electric power savings as measured during the long-term monitoring period. Emission data from the EPA’s “EGRID” database [6] were used to estimate state and nationwide emission rates. The test plan specified that carbon monoxide (CO), CO2, and NOx emissions reductions would be estimated. EGRID does not supply emission information for CO, so it is not considered here. Potential emissions reductions were calculated as:
Reduction i = ER EPS,i × MWh DUT,Ann Eqn. 2-15
where: Reductioni = annual reduction for pollutant ”i”, lb/year
EREPS,i = electric power system emission rate for pollutant ”i” from EGRID, lb/MWh MWhDUT,Ann = annual estimated device-based power savings, MWh/year
MWhDUT,Ann comes from the change in normalized electrical power consumption between EarthLinked and electric elements operations (∆ZkW) reported in Table 2-3 and then converted to MWh. Table 2-6 summarizes the estimated yearly emission reductions.
2-10
MWh DUT,Ann × RPelec ×103
Simple Cost Savings =100
SRI/USEPA-GHG-VR-34 September 2006
Table 2-6. Estimated Yearly Emissions Reductions
Florida Nationwide Pollutant CO2 NOx CO2 NOx EREPS,i (lb/MWh) 1420.42 3.36 1392.49 2.96 MWhDUT,Ann (MWh/year) 15 ± 1 Emission Offset (lb/year) 21,700 ± 1,400 51 ± 3 21,300 ± 1,300 45 ± 3
2.2.6 Estimated Simple Cost Savings
The procedure for estimating SUT simple cost savings is based on the Florida and nationwide prices for retail electricity at “commercial” rates. Similar to emissions reductions, analysts assumed that the EarthLinked system operates continuously throughout the year with electric power savings as measured during the long-term monitoring period. The EarthLinked system does not use auxiliary fuel, nor is it intended as a power source, so their potential costs or revenues are not considered for this verification. The simple cost savings is the annual estimated device-based power savings multiplied by the average retail price of electricity:
Eqn. 2-16
where: Simple Cost Savings = estimated annual device-based cost savings, dollars/year
MWhDUT,Ann = annual estimated device-based power savings, MWh/year RPelec = average retail price of commercial electricity, cents/kWh 103 = conversion factor from MWh to kWh
100 = conversion factor from cents to dollars
MWhDUT,Ann comes from the change in normalized electrical power consumption between EarthLinked and electric elements operations (∆ZkW) reported in Table 2-3 and then converted to MWh. Varying values for RPelec can be found in many resources. This methodology of estimating simple cost savings uses the Energy Information Agency’s Table 5.6.A. Average Retail Price of Electricity to Ultimate Customers by End-Use Sector, by State [7] to find RPelec.
Table 2-7 summarizes the estimated yearly cost savings.
Table 2-7. Estimated Yearly Simple Cost Savings*
Florida Nationwide MWhDUT,Ann (MWh/year) 15 ± 1 RPelec (cents/kWh) 9.88 9.2 Simple Cost Savings (dollars/year) 1,500 ± 100 1,410 ± 90 * Based on approximately 630 gallons per day average consumption on site. The intended load for this product is 2,000 gallons per day. Increasing the load may be expected to improve savings.
2-11

SRI/USEPA-GHG-VR-34 September 2006
(this page intentionally left blank)
2-12
SRI/USEPA-GHG-VR-34 September 2006
3.0 DATA QUALITY ASSESSMENT
3.1 DATA QUALITY OBJECTIVES
The GHG Center selects test methods and instruments for all verifications to ensure a stated level of data quality in the reported results. The test plan described the data quality objectives (DQOs) for this verification. The test plan also listed contributing measurements, their accuracy requirements, QA/QC checks, and other data quality indicators (DQIs) that, if met, would ensure achievement of the DQOs.
The following activities and procedures supported the achievement of this verification’s objectives:
• on-site QA/QC checks to reconcile the achieved DQIs with the DQOs • audit of data quality (ADQ) • on-site performance evaluation
The test plan defined the following DQOs for this test:
• determine EarthLinked water heating capacity and COP to within ± 5% • determine the power consumed by the baseline and EarthLinked systems (during
long-term monitoring) to within ± 0.4%
The first DQO was met for the EarthLinked water heating capacity tests at both low and elevated temperatures, as well as for the EarthLinked COP at low and elevated temperatures. Water heating capacity was determined to ± 3.6% and COP was determined to ± 3.8%. The second DQO was met for both the baseline and EarthLinked systems. Power consumed during long-term monitoring was determined to ± 0.3%.
The following subsections describe reconciliation of the DQIs with the DQOs, the QA/QC checks, and data quality audits.
3.2 RECONCILIATION OF DQOS AND DQIS
A fundamental component of all ETV verifications is the reconciliation of the collected data and their DQIs with the DQOs. Achievement of these DQIs implies that the DQOs were met. The following tables show the DQI data for the test campaign.
3-1

SRI/USEPA-GHG-VR-34 September 2006
Table 3-1. Instrument and Accuracy Specifications
Measurement Variable Observed Operating
Range Instrument Range Accuracy
Specificationa How Verified /
Determined Result
Achieved
EarthLinked system water flow 10 – 12 gpm 0 – 55 gpm ± 1% Meets spec.
Facility supply water flow 1.7 – 8 gpm 2.5 – 29 gpm ± 0.5%
NIST-traceable calibration within
Does not meet spec.
Meets spec. Recirculation loop water flow 1 – 3 gpm 0.75 – 5 gpm ± 0.5%
System temperature measurements 59 - 120 oF
0 - 250 oF ± 0.6 oF 2 years Meets
spec.
Test room temperature 57 – 89 oF Meets spec.
System pressure 20 - 40 psig 0 - 60 psig ± 3% Does not meet spec.
kW 0 - 31 kW 0 - 125 kW ± 0.15%
NIST-traceable calibration within 6 years; pretest crosscheck
Meets spec.
Current transformers (for kW) 0 - 18 A 0 - 150 A ± 0.3% Manufacturer’s certificate
Meets spec.
Tank #1 volume, gal 120, nominal n/a ± 3.3% Gravimetrically as part of statistical process control
Meets spec.
aAccuracy is % of reading unless stated as absolute units
All instrument and accuracy specifications in Table 3-1 were met with the exception of the facility supply water flow and the system pressure measurements.
The observed operating range for the facility supply flow was outside the lower limit of the flow meter. GHG Center personnel performed a low flow calibration of the meter at approximately 1.7 gpm against a coriolis mass flow meter after the completion of testing to determine the accuracy effects of being below the meter range. The calibration showed that the meter accuracy outside the meter range is ±1%. As such, this accuracy was applied to all calculations. The accuracy change did not have any effect on the confidence limits of reported findings.
A NIST-traceable calibration for the pressure gauge used in testing could not be located. The system pressure that was recorded during field testing was 72 psig. If the gauge had been so out of specification as to read 0 psig, the change in pressure would result in a change in density of 0.016 lb/ft3. This change is negligible and it was therefore deemed unnecessary to recalibrate the pressure gauge to verify that it is within the stated accuracy specification.
Power meters, flow meters, and temperature sensors were cross-checked to confirm performance within expected limits before being shipped to the field (pre-mobilization) and after returning from the field (demobilization) in accordance with Southern Research Standard Operating Procedures.
Table 3-2 summarizes QA/QC checks which the field team leader performed before and during testing.
3-2
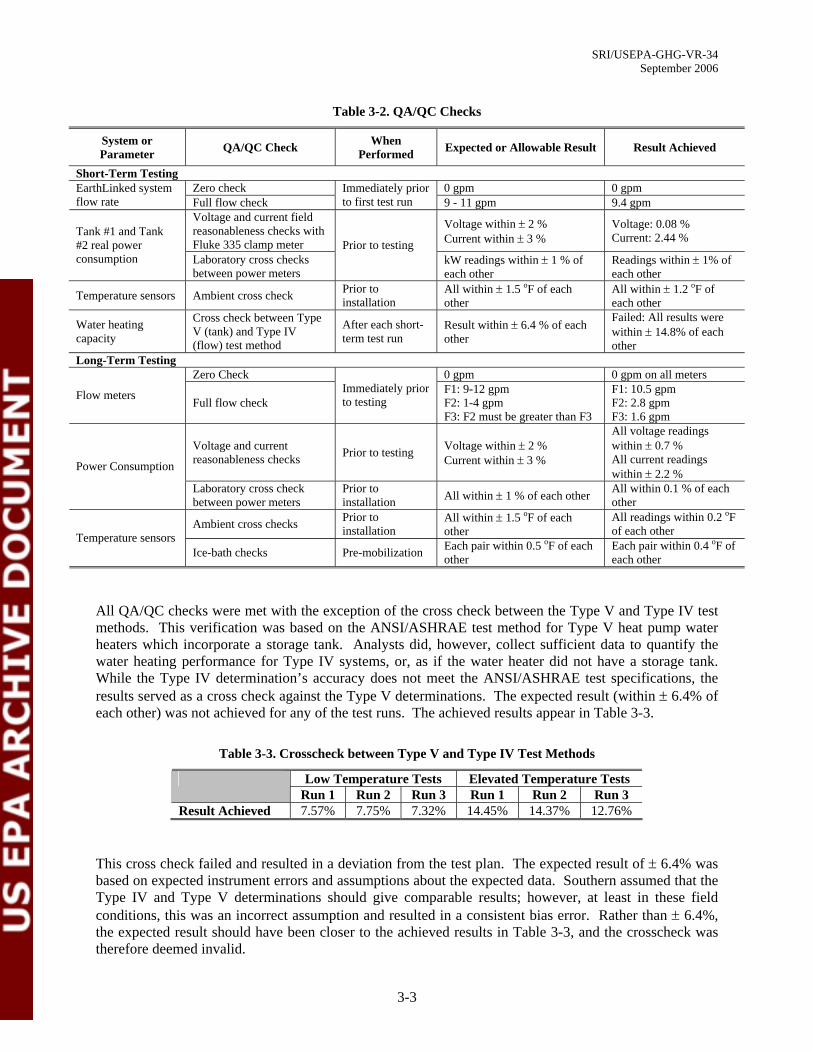
Table 3-2. QA/QC Checks
System or Parameter QA/QC Check When
Performed Expected or Allowable Result Result Achieved
Short-Term Testing EarthLinked system flow rate
Zero check Immediately prior to first test run
0 gpm 0 gpm Full flow check 9 - 11 gpm 9.4 gpm
Tank #1 and Tank #2 real power consumption
Voltage and current field reasonableness checks with Fluke 335 clamp meter Prior to testing
Voltage within ± 2 % Current within ± 3 %
Voltage: 0.08 % Current: 2.44 %
Laboratory cross checks between power meters
kW readings within ± 1 % of each other
Readings within ± 1% of each other
Temperature sensors Ambient cross check Prior to installation
All within ± 1.5 oF of each other
All within ± 1.2 oF of each other
Water heating capacity
Cross check between Type V (tank) and Type IV (flow) test method
After each short-term test run
Result within ± other
6.4 % of each Failed: All results were within ± 14.8% of each other
Long-Term Testing
Flow meters
Zero Check Immediately prior to testing
0 gpm 0 gpm on all meters
Full flow check F1: 9-12 gpm F2: 1-4 gpm F3: F2 must be greater than F3
F1: 10.5 gpm F2: 2.8 gpm F3: 1.6 gpm
Power Consumption
Voltage and current reasonableness checks Prior to testing Voltage within ± 2 %
Current within ± 3 %
All voltage readings within ± 0.7 % All current readings within ± 2.2 %
Laboratory cross check between power meters
Prior to installation All within ± 1 % of each other All within 0.1 % of each
other
Temperature sensors Ambient cross checks Prior to
installation All within ± 1.5 oF of each other
All readings within 0.2 oF of each other
Ice-bath checks Pre-mobilization Each pair within 0.5 oF of each other
Each pair within 0.4 oF of each other
SRI/USEPA-GHG-VR-34 September 2006
All QA/QC checks were met with the exception of the cross check between the Type V and Type IV test methods. This verification was based on the ANSI/ASHRAE test method for Type V heat pump water heaters which incorporate a storage tank. Analysts did, however, collect sufficient data to quantify the water heating performance for Type IV systems, or, as if the water heater did not have a storage tank. While the Type IV determination’s accuracy does not meet the ANSI/ASHRAE test specifications, the results served as a cross check against the Type V determinations. The expected result (within ± 6.4% of each other) was not achieved for any of the test runs. The achieved results appear in Table 3-3.
Table 3-3. Crosscheck between Type V and Type IV Test Methods
Low Temperature Tests Elevated Temperature Tests Run 1 Run 2 Run 3 Run 1 Run 2 Run 3
Result Achieved 7.57% 7.75% 7.32% 14.45% 14.37% 12.76%
This cross check failed and resulted in a deviation from the test plan. The expected result of ± 6.4% was based on expected instrument errors and assumptions about the expected data. Southern assumed that the Type IV and Type V determinations should give comparable results; however, at least in these field conditions, this was an incorrect assumption and resulted in a consistent bias error. Rather than ± 6.4%, the expected result should have been closer to the achieved results in Table 3-3, and the crosscheck was therefore deemed invalid.
3-3

SRI/USEPA-GHG-VR-34 September 2006
3.3 AUDITS
This verification was supported by an ADQ conducted by the GHG Center QA manager. During the ADQ, the QA manager randomly selected data supporting each of the primary verification parameters and followed the data through the analysis and data processing system. The ADQ confirmed that no systematic errors were introduced during data handling and processing.
3-4

SRI/USEPA-GHG-VR-34 September 2006
4.0 TECHNICAL AND PERFORMANCE DATA SUPPLIED BY ECR TECHNOLOGIES
Note: This section provides an opportunity for ECR Technologies to provide additional comments concerning the EarthLinked Water Heating System and its features not addressed elsewhere in this report. The GHG Center has not independently verified the statements made in this section.
Simultaneous with the system testing at Sun City Center, monitoring was conducted in a condominium building in Claremont, NH under the direction of Public Service Company of New Hampshire. In that test, 48 °F supply water was pre-heated to 110 °F by the EarthLinked unit, then the resistive elements of five traditional water heater tanks raised the water temperature to 125 °F and maintained that level within ±5 degrees. The documented energy savings ranged from 65% to 72%, even though the electrical circuit being monitored also served common area lighting. The short cost recovery period shown by the monitored results caused the building owner to install five additional units in other locations.
Pre-heating of low temperature water for a large bank of traditional water heater tanks demonstrates the energy saving capability of the EarthLinked system, the highest return on investment and the greatest environmental savings from a single unit. That arrangement also provides redundancy, which is necessary to provide assurance to commercial and institutional customers that the addition of technology that is new to them will not diminish the reliability of their water heating system.
The cabinet design of the EarthLinked unit encloses the heat pump, the refrigerant-to-water heat exchanger, and the water circulating pump within one unit for a small foot print (21 x 17 inches) and ease of access.
Because of high efficiency thermal exchange with its heat source in the earth, only 100 feet of earth loop per ton of heat pump capacity is needed, and a three inch diameter bore hole is optimal. Therefore, the system is easily adapted to new construction or retrofit applications. The earth loops can be installed vertically, diagonally, or horizontally by trenching, drilling, excavation, or directional boring even under a parking lot.
4-1

SRI/USEPA-GHG-VR-34 September 2006
(this page intentionally left blank)
4-2

SRI/USEPA-GHG-VR-34 September 2006
5.0 REFERENCES
[1] Southern Research Institute, Test and Quality Assurance Plan – ECR Technologies, Inc. EarthLinked Ground-Source Heat Pump Water Heating System, SRI/USEPA-GHG-QAP-34, www.sri-rtp.com, Greenhouse Gas Technology Center, Southern Research Institute, Research Triangle Park, NC. May 2005.
[2] Southern Research Institute, Addendum to Test and Quality Assurance Plan - ECR Technologies, Inc. EarthLinked Ground-Source Heat Pump Water Heating System, SRI/USEPA-GHG-QAP-34A, www.srirtp.com, Greenhouse Gas Technology Center, Southern Research Institute, Research Triangle Park, NC. May 2006.
[3] ANSI /ASHRAE Standard 118.1-2003: Method of Testing for Rating Commercial Gas, Electric, and Oil Service Water Heating Equipment, American Society of Heating, Refrigerating and Air-Conditioning Engineers, Inc. Atlanta, GA. 2003
[4] Handbook of Chemistry and Physics, 60th Edition, “Specific Heat of Water”, page D-174, CRC Press. Boca Raton, FL. 1980
[5] Handbook of Chemistry and Physics, 60th Edition, “Steam Tables—Properties of Saturated Steam and Saturated Water”, page E-18, CRC Press. Boca Raton, FL. 1980
[6] U.S. Environmental Protection Agency, Emissions & Generation Resource Integrated Database (eGRID) Version 2.01, available from < http://www.epa.gov/cleanrgy/egrid/index.htm>, accessed on 09/06/2006.
[7] Energy Information Agency, Table 5.6.A. Average Retail Price of Electricity to Ultimate Customers by End-Use Sector, by State available from <http://www.eia.doe.gov/cneaf/electricity/epm/ table5_6_a.html>, accessed on 09/05/2006.
5-1

SRI/USEPA-GHG-VR-34 September 2006
(his page intentionally left blank)
5-2