
Ecosystem goods and services from Manila clam culture … · Saurel et al.: Manila clam ecosystem...
16
AQUACULTURE ENVIRONMENT INTERACTIONS Aquacult Environ Interact Vol. 5: 255–270, 2014 doi: 10.3354/aei00109 Published online October 24 INTRODUCTION Aquaculture production of high quality protein- based food is needed to meet the increasing world demand for seafood products (Costa-Pierce 2002, Godfray et al. 2010). However, in order to grow sus- tainably, the aquaculture industry must comply with a broad range of natural and social conditions (Jonell et al. 2013, Maltby 2013): (1) social acceptance; (2) comprehensive governance with consistent environ- mental regulations and sustainable culture practices; (3) new culture technologies; (4) stakeholder collabo- © The authors 2014. Open Access under Creative Commons by Attribution Licence. Use, distribution and reproduction are un- restricted. Authors and original publication must be credited. Publisher: Inter-Research · www.int-res.com *Corresponding author: [email protected] Ecosystem goods and services from Manila clam culture in Puget Sound: a modelling analysis Camille Saurel 1 , João G. Ferreira 2, *, Dan Cheney 3 , Andy Suhrbier 3 , Bill Dewey 4 , Jonathan Davis 5 , Jeff Cordell 6 1 Danish Shellfish Center, DTUAqua, Øroddevej 80, 7900 Nykøbing Mors, Denmark 2 Dept. Environmental Science and Engineering, Faculty of Sciences and Technology, New University of Lisbon, 2829-516 Monte de Caparica, Portugal 3 Pacific Shellfish Institute, 509 12th Ave SE, Olympia, WA 98501, USA 4 Chuckanut Shellfish Inc., 704 E. Hiawatha Blvd., Shelton, WA 98584, USA 5 Baywater Inc, 15425 Smoland Lane NE, Bainbridge Island, WA, 98110-1040 USA 6 University of Washington, School of Aquatic and Fisheries Sciences (SAFS), Box 355020, Seattle, WA 98195-5020, USA ABSTRACT: The carrying capacity of a 2.4 ha Manila clam Venerupis philippinarum farm, using mechanised harvesting in North Puget Sound, WA, USA, was determined by means of an ecological model; the results were also scaled to Puget Sound as a whole. An individual Manila clam growth model was developed, calibrated and validated for the commercial farm, together with a macro- algal model to simulate fouling of the predator nets by seaweeds. Both models are based on our previously developed generic frameworks for bivalves (AquaShell) and seaweeds (AquaFrond). For the most part, equations are taken or adapted from the literature and parameterised for the studied site. The individual models were incorporated into the Farm Aquaculture Resource Man- agement (FARM) model to simulate the production cycle, environmental effects and economic optimisation of culture. Both the individual and farm-scale models are built using object-oriented programming. Potential effects of clam production on seaweed growth were analysed and found to be about 10% above background. The FARM model was also used to classify the farm area with respect to its eutrophication status, by applying the Assessment of Estuarine Trophic Status (ASSETS) model. Farm production ranging from 32 to 45 t of clams per year is well reproduced by the model. Harvest yield is very sensitive to mortality, and profitability is very sensitive to seed costs. Manila clam culture provides a potential nutrient credit trading value of over US $41 000 per year, over 1000 Population-Equivalents (PEQ, i.e. loading from humans or equivalent loading from agriculture or industry) with respect to eutrophication control. The potential income would add 21% to the annual profit ($194 900) from clam sales. A scaling exercise to the whole of Puget Sound is in reasonable agreement with declared production (difference of 16%), and suggests that clams provide a significant ecosystem service, of the order of 90 000 PEQ per year. KEY WORDS: Manila clam · Aquaculture · Sustainability · Ecological model · Culture practice · FARM model OPEN PEN ACCESS CCESS
Transcript of Ecosystem goods and services from Manila clam culture … · Saurel et al.: Manila clam ecosystem...

AQUACULTURE ENVIRONMENT INTERACTIONSAquacult Environ Interact
Vol. 5: 255–270, 2014doi: 10.3354/aei00109
Published online October 24
INTRODUCTION
Aquaculture production of high quality protein-based food is needed to meet the increasing worlddemand for seafood products (Costa-Pierce 2002,Godfray et al. 2010). However, in order to grow sus-
tainably, the aquaculture industry must comply witha broad range of natural and social conditions (Jonellet al. 2013, Maltby 2013): (1) social acceptance; (2)comprehensive governance with consistent environ-mental regulations and sustainable culture practices;(3) new culture technologies; (4) stakeholder collabo-
© The authors 2014. Open Access under Creative Commons byAttribution Licence. Use, distribution and reproduction are un -restricted. Authors and original publication must be credited.
Publisher: Inter-Research · www.int-res.com
*Corresponding author: [email protected]
Ecosystem goods and services from Manila clamculture in Puget Sound: a modelling analysis
Camille Saurel1, João G. Ferreira2,*, Dan Cheney3, Andy Suhrbier3, Bill Dewey4, Jonathan Davis5, Jeff Cordell6
1Danish Shellfish Center, DTUAqua, Øroddevej 80, 7900 Nykøbing Mors, Denmark2Dept. Environmental Science and Engineering, Faculty of Sciences and Technology, New University of Lisbon,
2829-516 Monte de Caparica, Portugal3Pacific Shellfish Institute, 509 12th Ave SE, Olympia, WA 98501, USA
4Chuckanut Shellfish Inc., 704 E. Hiawatha Blvd., Shelton, WA 98584, USA5Baywater Inc, 15425 Smoland Lane NE, Bainbridge Island, WA, 98110-1040 USA
6University of Washington, School of Aquatic and Fisheries Sciences (SAFS), Box 355020, Seattle, WA 98195-5020, USA
ABSTRACT: The carrying capacity of a 2.4 ha Manila clam Venerupis philippinarum farm, usingmechanised harvesting in North Puget Sound, WA, USA,was determined by means of an ecologicalmodel; the results were also scaled to Puget Sound as a whole. An individual Manila clam growthmodel was developed, calibrated and validated for the commercial farm, together with a macro-algal model to simulate fouling of the predator nets by seaweeds. Both models are based on ourpreviously developed generic frameworks for bivalves (AquaShell) and seaweeds (AquaFrond).For the most part, equations are taken or adapted from the literature and parameterised for thestudied site. The individual models were incorporated into the Farm Aquaculture Resource Man-agement (FARM) model to simulate the production cycle, environmental effects and economicoptimisation of culture. Both the individual and farm-scale models are built using object-orientedprogramming. Potential effects of clam production on seaweed growth were analysed and foundto be about 10% above background. The FARM model was also used to classify the farm area withrespect to its eutrophication status, by applying the Assessment of Estuarine Trophic Status(ASSETS) model. Farm production ranging from 32 to 45 t of clams per year is well reproduced bythe model. Harvest yield is very sensitive to mortality, and profitability is very sensitive to seedcosts. Manila clam culture provides a potential nutrient credit trading value of over US $41000 peryear, over 1000 Population-Equivalents (PEQ, i.e. loading from humans or equivalent loading fromagriculture or industry) with respect to eutrophication control. The potential income would add21% to the annual profit ($194 900) from clam sales. A scaling exercise to the whole of PugetSound is in reasonable agreement with declared production (difference of 16%), and suggeststhat clams provide a significant ecosystem service, of the order of 90 000 PEQ per year.
KEY WORDS: Manila clam · Aquaculture · Sustainability · Ecological model · Culture practice ·FARM model
OPENPEN ACCESSCCESS
Aquacult Environ Interact 5: 255–270, 2014256
ration and incentives and (5) compliance of farmerswith best management practices, and improved eco-certification across local to international scales.
Aquaculture is the fastest growing food productionsector in the world, with a 650% increase in the last30 yr. Sixty million tonnes per year of aquatic pro -ducts now come from aquaculture, 88% of whichoriginate in Asia (FAO 2012). Aquaculture needs toin crease to 80 million tonnes to meet the demand infish protein from a human population expected to hit9.3 billion by 2050 (Godfray et al. 2010, UN 2010,FAO 2012). Due to unsustainable exploitation of someof the wild stocks and increased demand for aquaticproducts (Jackson et al. 2001, Worm et al. 2009,Worm & Branch 2012), aquaculture now ex ceeds thewild fish supply for human food (FAO 2012).
The projected yield from capture fisheries andaquaculture is realistic if (1) fisheries are sustainablymanaged (Merino et al. 2012), and (2) aquacultureex pands following the ecosystem approach, by opti-mising ecological equilibrium, stakeholder well-being and multiple ecosystem uses (Soto et al. 2008).
In the marine environment, shellfish correspond to75.5% of total aquaculture production, while finfishrepresent only 8.7%, despite the recent substantialincrease in salmonid culture (FAO 2012). However,over two-thirds of aquaculture takes place in land-based ponds, for freshwater species such as tilapiaand carp, and bivalve shellfish represent only 23.6%of world production, although they are one of themost sustainable forms of aquaculture animals lowin the food chain that obtain their food throughorganic extraction (Shumway et al. 2003, Burkholder& Shumway 2011).
In the US, legislation such as the National Aquacul-ture Act (1980), Clean Water Act (CWA 1972) andCoastal Zone Management Act (1972) has been fol-lowed by the National Shellfish Initiative (NSI 2011)supported by the National Oceanic and AtmosphericAdministration (NOAA), which was followed by theWashington Shellfish Initiative (WSI 2011). The WSIwas developed through a partnership among Wash-ington State, tribes, shellfish restoration practitionersand the shellfish industry, with an emphasis on PugetSound, to promote clean water with the objective of‘protecting and enhancing a resource that is impor-tant for jobs, industry, citizens and tribes’. This initia-tive includes industry partnerships to promote neweconomic opportunities, restoration and improvedwater quality, as well as science on the impacts ofocean acidification on shellfish recruitment.
Bivalve aquaculture may be seen as a green indus-try, providing ecosystem goods and services (Jackson
et al. 2001, Smaal et al. 2001, Newell 2004, Coen etal. 2007, zu Ermgassen et al. 2013) that include: (1)re duction of turbidity and nutrient control throughfiltration of organic matter (Forrest et al. 2009, Carls-son et al. 2012, Pollack et al. 2013); (2) water qualityimprovement through reduction of primary eutrophi-cation symptoms, thereby minimizing secondarysymptoms such as hypoxia (Bricker et al. 2003, Fer-reira et al. 2007); (3) provision of habitat for earlystages of invertebrates, and food for local predators(Inglis & Gust 2003, Dealteris et al. 2004, Segvic-Bubic et al. 2011) and (4) potential improvement ofshellfish recruitment in adjacent areas, thereby help-ing restoration (Wilbur et al. 2005).
High shellfish culture density may, however, im -pact the ecosystem through food competition withwild filter-feeders (Dame & Prins 1997) and causeshifts in the phytoplankton community (Prins et al.1997). It may also have an indirect impact on recruit-ment of benthic predators (Inglis & Gust 2003), pro-mote seaweed fouling through nutrient release in thevicinity of the farm (e.g. Lavoie et al. 2013) and,under extreme conditions, biodeposits may result insediment anoxia (Cranford et al. 2009).
In general, sediment organic enrichment due toshellfish farming is considered to be limited (Craw-ford et al. 2003, Forrest et al. 2009) farmers under-stand that stocking densities leading to these effectsdo not benefit production, due to high mortality andreduced growth rates. Shellfish growers in NorthAmerica are committed to maintaining good waterquality status for their growing areas (Dewey et al.2011). In 2010, the EPA funded the Clean Samish Ini-tiative: ‘Clean Samish and Pollution Identificationand Correction (PIC) Program’ to improve the waterquality of the bay.
Nevertheless, there is some controversy in PugetSound concerning the use of intertidal areas (beaches)for shellfish cultivation, and licensing of new farms.Dumbauld et al. (2009) described the ecological roleof bivalves on the West Coast and established that al-though shellfish culture may temporally enhance sed-iment disturbance during harvest and maintenance,and cause removal of suspended material through filtration, it introduces beneficial physical structure, ina similar way to seagrass beds, and is unlikely to havea negative impact on the well-flushed waters of PugetSound. At the farm, an increased number of certainspecies under netting has been observed, as it pro-vides protection not only to the cultured species butto other bivalves as well.
In this work, we explored various aspects of carry-ing capacity and sustainability of state-of-the-art

Saurel et al.: Manila clam ecosystem goods and services
shellfish farming, using as an example Manila clambottom cultivation at the Chuckanut Shellfish farm inSamish Bay, North Puget Sound, WA, USA.
The well-tested (Ferreira et al. 2009, 2012, Nuneset al. 2011) Farm Aquaculture Resource Manage-ment (FARM) model was applied to:
(1) Simulate the operations of the Chuckanut Shell-fish farm, such as the effect of bed preparation, pred-ator net fouling and clam harvest
(2) Examine the environmental effects and eco-nomic externalities of cultivation
(3) Determine the appropriate shellfish density foroptimal carrying capacity
(4) Provide information on culture technologiessuch as mechanical culture practice, with outreach toManila clam farmers in the region, and other shell-fish farmers and harvesters in the US and worldwide.
MATERIALS AND METHODS
Clam culture in the Pacific NW United States
On the US West Coast, aquaculture started in thelate 1800s (Dumbauld et al. 2009); Manila clamsVene rupis philippinarum and Pacific oysters Crasso -strea gigas were introduced in the 1930s (Chew 1989),
and at present clam culture occurs mainly in Washing-ton State, with an annual production of ap proximately4500 t in 2009, while very little is produced in Califor-nia (336 t). Canada produced 1113 t in 2012 (www.dfo-mpo.gc.ca/stats/aqua/aqua12-eng. htm, Pacific CoastShellfish Growers Association 2012).
Study site
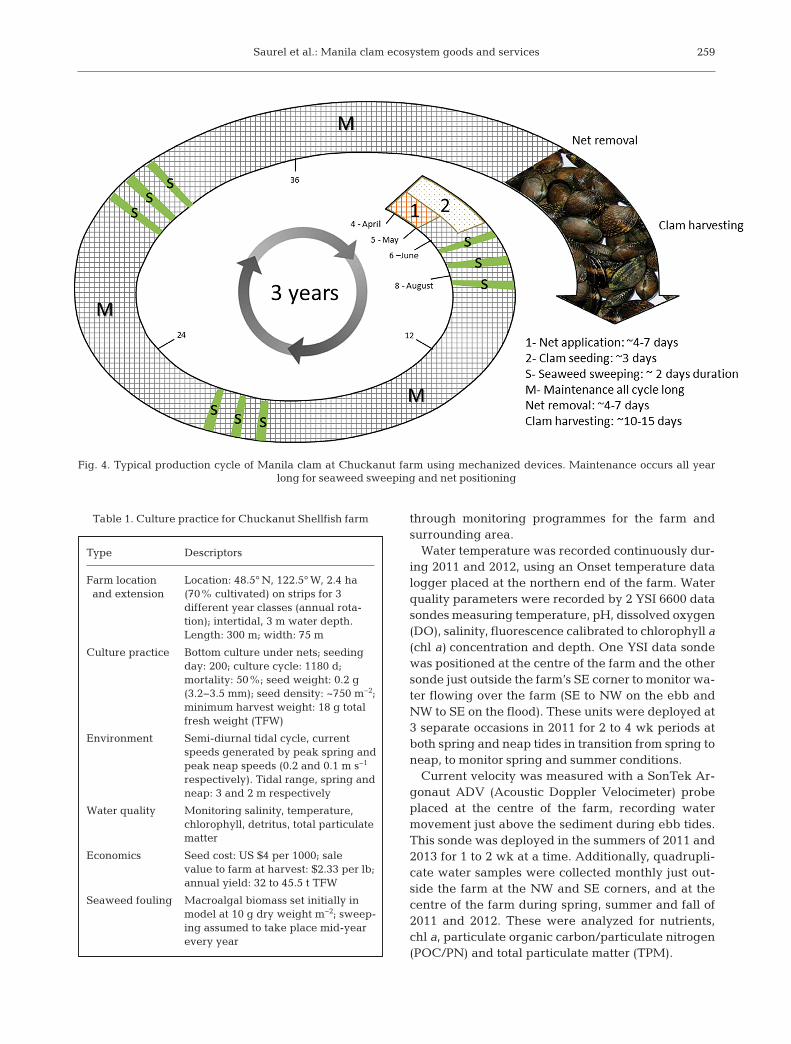
The Chuckanut Shellfish farm in Samish Bay,(Washington State, USA), a Puget Sound embaymentin the Salish Sea, (Fig. 1) developed innovative tech-niques and practices about a decade ago, aiming topromote sustainable aquaculture — Manila clams areplanted under predator nets, which are mechanicallydeployed and defouled. Clam harvesting is alsomechanised (Figs. 2−4). The detail of the farm prac-tice is described in Table 1 and Fig. 4. The harvest atChuckanut is more efficient (over 10 times faster)and cost-effective (70% cheaper) than manual har-vesters using short-handled rakes; cost comparisonsaccount for both amortization of plant and equipmentand marginal costs (B. Dewey pers. obs.).
Experiments were conducted at the 2.6 ha (6.5 acres)currently farmed at Chuckanut. Intertidal bottom cul-ture of Manila clams uses 70% of the farm area, while
257
100 m
122°30’W 122°27’
48°35’N
±
Fig. 1. Chuckanut Shellfish farm location in Samish Bay, northern part of Washington State, USA. (Right) Farm layout, linesrepresent the cultivated strips. Sampling areas for water quality, clam production and reference sites are contained within or
are adjacent to the farm layout

Aquacult Environ Interact 5: 255–270, 2014
the remaining 30% forms aisles between cultivatedrows.Predatornets(90to460mlength,1.2mwidth)aredeployed in strips, buried along the edges and fixedto the sediment with large steel staples; clam seed isthen planted within the strips, at a density of 750 ind.m−2 (70 ind. ft−2). Fouling occurs mainly throughattachment and growth of green algae (e.g. Ulva sp.)on the predator nets, boosted by the available sub-strate and by the supply of dissolved nutrients.
The animals are supplied by certified high healthhatcheries and harvested during the third year afterseeding. Marketable size is reached after 2 yr, but
since the clams are marketed by the pound, the extraweight gained by allowing a third year of growthwarrants the additional growing season. The shellfishare cultivated as separate year classes in differentsections of the farm, allowing for an annual harvest.As a consequence, approximately one third of the to-tal area is harvested every year, and subsequently re-seeded (Fig. 4). The reported harvest ranges from 30to 45 t yr−1 (70 000 to 100 000 lb yr−1).
Water quality data, morphometry, culture practiceand appropriate economic indicators required to runand validate the local-scale models were obtained
258
A) Manual B) Mechanical
Fig. 2. (A) Manual versus (B) mechanical intertidal bottom culture of Manila clams in Samish Bay (Photo courtesy B. Dewey)
A) Fouling B) Sweeping
Fig. 3. (A) Predator nets strips of Manila clam bottom culture fouled by algae are swept mechanically and (B) removed algae are left in the corridors between the net strips (Photo courtesy B. Dewey)
Saurel et al.: Manila clam ecosystem goods and services
through monitoring programmes for the farm andsurrounding area.
Water temperature was recorded continuously dur-ing 2011 and 2012, using an Onset temperature datalogger placed at the northern end of the farm. Waterquality parameters were recorded by 2 YSI 6600 datasondes measuring temperature, pH, dissolved oxygen(DO), salinity, fluorescence calibrated to chlorophyll a(chl a) concentration and depth. One YSI data sondewas positioned at the centre of the farm and the othersonde just outside the farm’s SE corner to monitor wa-ter flowing over the farm (SE to NW on the ebb andNW to SE on the flood). These units were deployed at3 separate occasions in 2011 for 2 to 4 wk periods atboth spring and neap tides in transition from spring toneap, to monitor spring and summer conditions.
Current velocity was measured with a SonTek Ar -go naut ADV (Acoustic Doppler Velocimeter) probeplaced at the centre of the farm, recording watermovement just above the sediment during ebb tides.This sonde was deployed in the summers of 2011 and2013 for 1 to 2 wk at a time. Additionally, quadrupli-cate water samples were collected monthly just out-side the farm at the NW and SE corners, and at thecentre of the farm during spring, summer and fall of2011 and 2012. These were analyzed for nutrients,chl a, particulate organic carbon/particulate nitrogen(POC/PN) and total particulate matter (TPM).
259
Type Descriptors
Farm location Location: 48.5° N, 122.5° W, 2.4 ha and extension (70% cultivated) on strips for 3
different year classes (annual rota -tion); intertidal, 3 m water depth.Length: 300 m; width: 75 m
Culture practice Bottom culture under nets; seedingday: 200; culture cycle: 1180 d;mortality: 50%; seed weight: 0.2 g(3.2−3.5 mm); seed density: ~750 m−2;minimum harvest weight: 18 g totalfresh weight (TFW)
Environment Semi-diurnal tidal cycle, currentspeeds generated by peak spring andpeak neap speeds (0.2 and 0.1 m s−1
respectively). Tidal range, spring andneap: 3 and 2 m respectively
Water quality Monitoring salinity, temperature,chlorophyll, detritus, total particulatematter
Economics Seed cost: US $4 per 1000; sale value to farm at harvest: $2.33 per lb; annual yield: 32 to 45.5 t TFW
Seaweed fouling Macroalgal biomass set initially inmodel at 10 g dry weight m−2; sweep-ing assumed to take place mid-yearevery year
Table 1. Culture practice for Chuckanut Shellfish farm
Fig. 4. Typical production cycle of Manila clam at Chuckanut farm using mechanized devices. Maintenance occurs all year long for seaweed sweeping and net positioning

Aquacult Environ Interact 5: 255–270, 2014
Average Manila clam densities, size ranges andmacroalgal biomass were assessed monthly duringthe spring, summer and early fall of 2011 and 2012,and once during the winter of 2012 to 2013. Random0.25 m2 quadrats were taken on transects that ranfrom the SW to the NE corners of the farm, collectingat least 10 samples during each sampling period.Stocking density, weight (total fresh weight and tis-sue dry weight) and length of clams and macroalgaldry weight were determined.
Seven benthic cores were sampled just before har-vest, and 1 to 2 d after harvest, on 3 different plots atthe centre and northern edges of the farm, on differ-ent dates (July and August 2011, May 2012). Handharvest impact, benthic community composition andmacrofauna were compared to mechanical harvest.
Model development, implementation and validation
Manila clam individual growth model
Experimental growth data (2009 to 2011) from theSamish Island site were used to calibrate and vali-date a Manila clam model based on the genericAquaShell™ framework for bivalves (e.g. Silva et al.2011, Ferreira et al. 2012). Functions for key physio-logical processes specific to Manila clam followDefossez & Daguzan (1995), Flye Sainte Marie et al.(2007), and Walne (1972); formulations for morpho-metric relationships were obtained in this work.
The model simulates changes in individual weight,expressed as tissue dry weight and scaled to totalfresh weight (with shell) and in shell weight scaledto shell length. The model is driven by relevantphysical and biogeochemical components, i.e. allo -metry, total particulate matter, temperature andsalinity, together with phytoplankton and detritus
(Table 2); Clearance rate is a function of allometry(CRm), TPM (CRTPM) and water temperature (CRt)(Eq. 1−3); the model additionally provides environ-mental feedbacks for particulate organic waste(faeces and pseudofaeces) and excretion of dissolvedsubstances.
The effects of allometry of Manila clam dry weightand environmental conditions were modelled asbelow:
(1)
where (modified from Flye Sainte Marie et al. 2007)CRm is the clearance rate as a function of individualdry weight (DW) (l h−1), a is the allometric functionparameter = 20.049 (no unit), b is the allometric func-tion parameter = 0.257 ml min−1 g−1, W is the dryweight of the animal in grams and h is the conversionfactor = 6 × 10⁻⁴.
Clearance rate as a function of individual weightwas used to model the effect of TPM (Eq. 2):
(2)where (modified from Defossez & Daguzan 1995)CRTPM is the clearance rate as a function of TPM(l ind.−1 d−1), TPM is the total particulate matter (mgl−1), TPMo is the TPM optimum (mg l−1), TPMt is theTPM threshold = 100 mg l−1, TPMm is the TPM maxi-mum = 175 mg l−1 and c is the constant = 0.8. Theeffect of temperature (T) on CRTPM was modelled asa Gaussian curve when CR is above or below theoptimal temperature (To) of 15°C:
(3)
CRm = × ×a W hb
if TPM TPM CR CR
if TPM TPM TPM TPM
if TPM TPM CR CRTPMTPM
exp 1TPMTPM
m TPM m
t o
m TPM mo o
( )< → => → = ×
> → = × × −
⎧
⎨⎪⎪
⎩⎪⎪
⎫
⎬⎪⎪
⎭⎪⎪
c
CR CRt TPMo o
exp= × × −⎛⎝
⎞⎠
TT
TT
1
260
Day Temperature Salinity Chlorophyll a POM TPM DOb DINb
(°C) (psu) (μg l−1) (mg l−1) (mg l−1) (mg l−1) (μmol l−1)
165 11 35 4.2 2.6 8.1 6.0 2210 12 35 4.9 2.8 7.5 7.5 4240 13 35 2.5 1.7 4.3 6.0 7270 12 35 3.9 2.7 14.7 6.5 5330 7 35 1.5 1.3 4.1 8.0 10
aValues in italics were not measured on site but either calculated indirectly or taken from literaturebThe last 2 columns (DO and DIN) are used only in the FARM model
Table 2. Data used to run the Manila clam AquaShell individual modela, and the FARM modelb for simulation of farm-scale pro-duction and environmental effects (starting total fresh weight [TFW] 0.65 g, starting date mid-July, cultivation period 1180 d).POM: particulate organic matter, TPM: total particulate matter; DO: dissolved oxygen; DIN: dissolved inorganic nitrogen

Saurel et al.: Manila clam ecosystem goods and services 261
where (modified from Walne 1972, Sobral & Wid-dows 1997) CRt is the clearance rate as a function oftemperature (l ind.−1 d−1), To is optimal water temper-ature = 15 °C and T is the water temperature (°C).Water temperature used for the model varied be -tween a minimum of 7.2°C in winter and 13.3°C insummer (Table 2). Table 2 shows the environmentaldrivers obtained through field measurements, both inthis study and other work; these were used for indi-vidual model runs, and subsequently for simulationsat the farm scale.
Seaweed growth model
A macroalgal individual growth model was imple-mented to simulate fouling of predator nets by sea-weeds. The model is adapted from Nobre et al.(2005), and uses a cell quota formulation (Droop 1970,Eq. 4). This approach was chosen since single-stepkinetics are not a good model for seaweed growth(e.g. Solidoro et al. 1997) because they fail to account,for example, for the fact that production occurs evenwhen dissolved nutrients are depleted. The left term(before the multiplication sign) is the standardMichaelis-Menten formulation, which is often usedfor primary production modelling of phytoplankton,i.e. the nutrient (S) uptake regulates the rate μ, whereμmax is the potential (i.e. light-dependent production).
Droop’s equation, and subsequent adaptations e.g.by Solidoro et al. (1997), make that uptake rate regu-late the quota of nutrients in the cell (in this case inthe seaweeds), which is the whole first term, and thesecond term uses that quota, Q, to reduce the poten-tial (light-limited) production, here represented asPmax:
(4)
where Q is the cell quota (mgN g DW−1), μmax is themaximum dissolved inorganic nitrogen (DIN) uptakerate from the water column (mgN gDW−1 d−1), S is theDIN concentration (μmol l−1), ks is the half-saturationconstant for DIN (μmol l−1), qmax is the maximum DINcell quota (mgN gDW−1), qmin is the minimum DINcell quota (mgN gDW−1), Pmax is the maximum pro-duction rate (d−1) and kc is the nitrogen cell quota forgrowth (mgN gDW−1).
Once the nets are swept of seaweed, N uptakefrom macroalgae is excluded from the FARM modelsince only local processes are considered; i.e. sea-weeds that are lost from the model domain are bydefinition not explicitly factored in subsequent calcu-
lations, except insofar as the nutrient drivers of themodel reflect macroalgal decomposition and miner-alization.
The individual growth model in Eq. (4) is used inEq. (5) to calculate gross primary production (GPP)by scaling to the existing biomass, and net primaryproduction (NPP) is determined according to Eq. (6):
(5)
where P is the production d−1 and:
(6)
where Rl is the light respiration coefficient = 0.3 mgCgDW−1 h−1, E is the exudation coefficient = 0.02 (nounits), B is the macroalgal biomass (g DW) and Rd isthe maintenance respiration coefficient = 0.01 d−1.The individual growth model is forced by photosyn-thetically available radiation (PAR, μmol photons m−2
s−1) and DIN. The farm-scale model (see below) cal-culates the depth of the clam farm at every time step,and determines PAR attenuation in the water columndue to suspended particulate matter when the farm isimmersed.
Farm-scale model
The model simulates processes at the farm-scale byintegrating a set of different sub-models: (1) hydrody-namic and particle settling (for suspension culture),(2) biogeochemical, (3) shellfish and finfish growthmodels and (4) ASSETS eutrophication screeningmodel (Bricker et al. 2003). Three different types ofoutputs may be obtained with FARM, focusing onpeople (production), planet (environmental externali-ties) and profit. The FARM outputs are production,average physical product (a proxy for return on in-vestment), income, expenditure, gross profit, biode-position, nutrient emission and eutrophication assess-ment. A marginal analysis of optimal stocking density(Ferreira et al. 2011) is obtained by increasing seedingdensity (see details in Fig. 11) with the known valuesfor input (Pi = 40 USD for 1 kg of seed in this study)and output (Po = 4 USD for 1 kg of harvested clam)costs, and simulating the corresponding potential har-vest. The Value of Marginal Product (VMP) is thenused to calculate the Marginal Physical Product(MPP) which corresponds to the first derivative of theproduction (Total Physical Product, TPP) curve, andyields the point at which profit maximization occurs(Jolly & Clonts 1993, Ferreira et al. 2007).
1max
minP PqQ
= ⋅ −
if GPP NPP GPP
if GPP NPP GPPl> → = − +
= → = − −0 1
0 1
( )
( )
R E
E B ××⎧⎨⎪
⎩⎪
⎫⎬⎪
⎭⎪Rd
dd
max max
max minmax
min
max
Qt
Sk S
q Qq q
PQ qq k
Qs c
= μ+
⋅ −−
− ⋅ −−
⋅

Aquacult Environ Interact 5: 255–270, 2014262
The individual Manila clam model was incorpo-rated into the FARM model, and locally measuredenvironmental drivers, together with culture practiceestablished both through the farm owner and in situwork (Table 1 & 2), were used to assess actual andpotential production, economic performance andenvironmental externalities.
The FARM model was modified to simulate macro-algal production on the predator nets using a popula-tion, size-based, dynamics model (Nobre et al. 2005),driven by the individual growth model describedabove and by seaweed mortality. Additionally, theseaweed simulation accounts for the sweeping ofpredator nets at regular intervals (Fig. 3), which isnormal operating procedure on the farm — an exces-sive build-up of seaweed biomass may lead to highclam mortality due to sediment hypoxia.
The macroalgal model was initialized with a stand-ing stock of 5 g DW, based on measured data, andvalidated against peak biomass measured as part ofthe field data collection, using the 90th percentile of47.4 g DW as a reference point.
RESULTS AND DISCUSSION
The results from the clam individual growth modeltogether with the mass balance over a growth cycleare briefly reviewed and are followed by the FARMmodel results. Finally, a scaling exercise of the serv-ices provided by Manila clam for the whole of PugetSound is presented.
Individual clam growth model
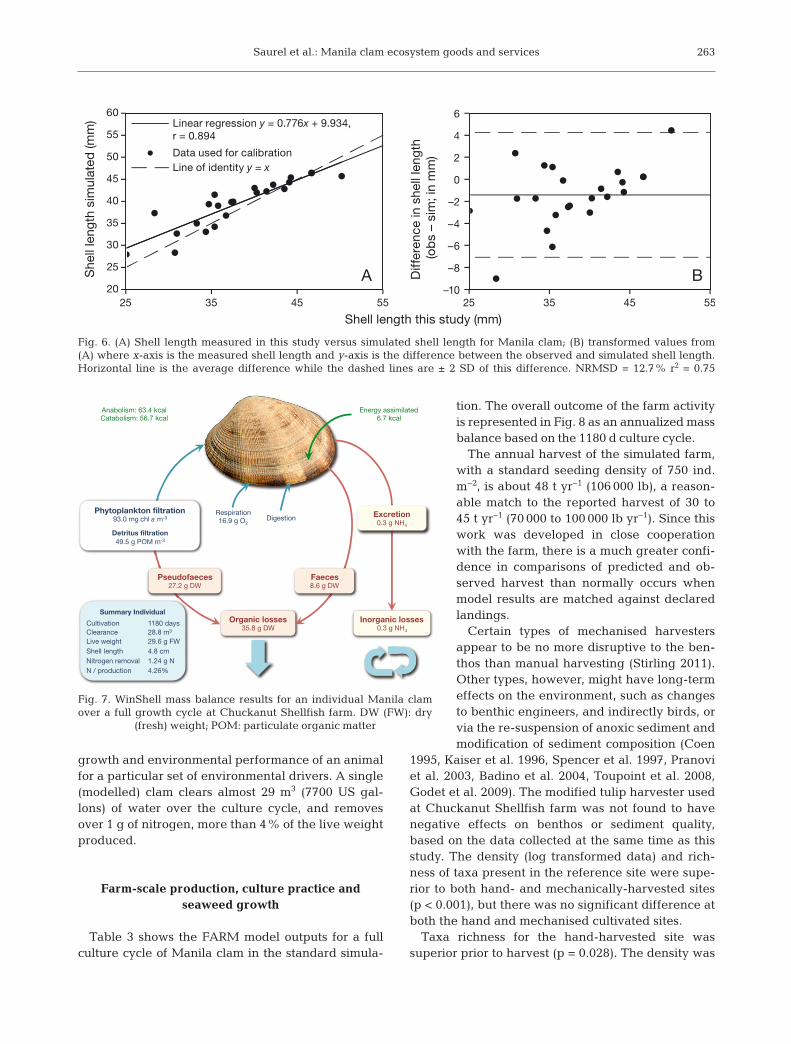
The simulated growth of an individual Manila clamis shown in Fig. 5, using 3 key indicators: shell length,total fresh weight and tissue dry weight. The individ-ual model reproduced the weight increase in thegrowing season, and the negative scope for growth inwinter due to both low temperature and food concen-trations. The model predicted a final shell length of46.5 mm, a total fresh weight of 27 g and a tissuedry weight of 1.27 g at Day 1020. This is in goodagreement with the field data for the same period, i.e.46.7 mm, 26.6 g and 1.44 g respectively.
Validation curves for measured versus simulatedshell length are also presented in Fig. 5. The nor-malised root mean square deviation (NRMSD) wasequal to 12.7%. The slope of the linear regression ofthe simulated versus measured shell length was closeto the line of identity (Fig. 6); only 2 points were
responsible for the slight shift between the line ofidentity and the linear regression, and are outsidethe standard deviation of the average difference be -tween simulated and observed data.
The individual model was tested in WinShell, aworkbench that handles model pre- and post-pro-cessing, and generates a mass balance output for thewhole culture cycle, taking into account both produc-tion and environmental effects (Fig. 7).
WinShell is not useful for analysing the cultivationof large numbers of clams, but provides a user-friendly platform to handle input and output fromAquaShell, and allows the farmer to look at the
15
20
25
30
35
40
45
50
55
0 200 400 600 800 1000 1200
She
ll le
ngth
(mm
)
AquaShell model2009 plant2010 seed2011 seed
0
5
10
15
20
25
30
0 200 400 600 800 1000 1200
Tota
l fre
sh w
eigh
t (g
)
0.0
0.5
1.0
1.5
2.0
0 200 400 600 800 1000 1200
Tis
sue
dry
wei
ght
(g)
Day
A
B
C
Fig. 5. Simulation of (A) shell length, (B) total fresh weightand (C) tissue dry weight over a full growth cycle. Error bars
are SD
Saurel et al.: Manila clam ecosystem goods and services
growth and environmental performance of an animalfor a particular set of environmental drivers. A single(modelled) clam clears almost 29 m3 (7700 US gal-lons) of water over the culture cycle, and removesover 1 g of nitrogen, more than 4% of the live weightproduced.
Farm-scale production, culture practice and seaweed growth
Table 3 shows the FARM model outputs for a fullculture cycle of Manila clam in the standard simula-
tion. The overall outcome of the farm activityis represented in Fig. 8 as an annualized massbalance based on the 1180 d culture cycle.
The annual harvest of the simulated farm,with a standard seeding density of 750 ind.m−2, is about 48 t yr−1 (106 000 lb), a reason-able match to the reported harvest of 30 to45 t yr−1 (70 000 to 100 000 lb yr−1). Since thiswork was developed in close cooperationwith the farm, there is a much greater confi-dence in comparisons of predicted and ob -served harvest than normally occurs whenmodel results are matched against declaredlandings.
Certain types of mechanised harvestersappear to be no more disruptive to the ben-thos than manual harvesting (Stirling 2011).Other types, however, might have long-termeffects on the environment, such as changesto benthic engineers, and indirectly birds, orvia the re-suspension of anoxic sediment andmodification of sediment composition (Coen
1995, Kaiser et al. 1996, Spencer et al. 1997, Pranoviet al. 2003, Badino et al. 2004, Toupoint et al. 2008,Godet et al. 2009). The modified tulip harvester usedat Chuckanut Shellfish farm was not found to havenegative effects on benthos or sediment quality,based on the data collected at the same time as thisstudy. The density (log transformed data) and rich-ness of taxa present in the reference site were supe-rior to both hand- and mechanically-harvested sites(p < 0.001), but there was no significant difference atboth the hand and mechanised cultivated sites.
Taxa richness for the hand-harvested site wassuperior prior to harvest (p = 0.028). The density was
263
20
25
30
35
40
45
50
55
60
25 35 45 55
She
ll le
ngth
sim
ulat
ed (m
m)
Shell length this study (mm)
Linear regression y = 0.776x + 9.934, r = 0.894
Data used for calibrationLine of identity y = x
–10
–8
–6
–4
–2
0
2
4
6
25 35 45 55
Diff
eren
ce in
she
ll le
ngth
(o
bs
– si
m; i
n m
m)
A B
Fig. 6. (A) Shell length measured in this study versus simulated shell length for Manila clam; (B) transformed values from(A) where x-axis is the measured shell length and y-axis is the difference between the observed and simulated shell length.Horizontal line is the average difference while the dashed lines are ± 2 SD of this difference. NRMSD = 12.7% r2 = 0.75
Faeces 8.6 g DW
Pseudofaeces27.2 g DW
Phytoplankton filtration 93.0 mg chl a m-3
Detritus filtration 49.5 g POM m-3
Cultivation 1180 days Clearance 28.8 m3 Live weight 29.6 g FW Shell length 4.8 cm Nitrogen removal 1.24 g N N / production 4.26%
Excretion 0.3 g NH4
Energy assimilated 6.7 kcal
Anabolism: 63.4 kcal Catabolism: 56.7 kcal
Inorganic losses 0.3 g NH4
Organic losses 35.8 g DW
Summary Individual
Respiration 16.9 g O2
Digestion
Fig. 7. WinShell mass balance results for an individual Manila clamover a full growth cycle at Chuckanut Shellfish farm. DW (FW): dry
(fresh) weight; POM: particulate organic matter

Aquacult Environ Interact 5: 255–270, 2014
more variable depending on the date: July: pre- topost-harvest p < 0.001; August: pre- to post-harvestp = 0.030, while in May there was no significant dif-ference (p = 0.254).
On the other hand, there were no significant dif -ferences between the pre-mechanical versus post-mechanical harvest for both density (p = 0.824) andtaxa richness (p = 0.073).
At Chuckanut, predator nets are deployed andkept on site during the whole culture period; they arethen recycled for use in the next period. Severalauthors have shown that similarly de ployed nets may
in crease concentrations of or -ganic matter to a limited extent(Munroe & McKinley 2007, Ben-dell et al. 2010), and could implyshifts in community structure(Ben dell et al. 2010), but in an -other experiment where preda-tor nets were placed above netbags for hard clams, they alsoacted as artificial reefs and in -crease biodiversity and providenursery grounds through macro-algal colonisation (Powers et al.2007).
The FARM model results sug-gest that there is a minimal in -crease in ammonia concentra-tion in the surrounding water(Table 3), and the simulated ex -cre tion of NH4
+ by the clamsbecomes a nutrient source forthe seaweeds (Figs. 9 & 10). Themodel provides an adequatesimulation of the measured bio-mass (Fig. 9) of macroalgae (Ulvaand other genera) with a 90thpercentile of 47.4 g DW.
The FARM model simulatessweeping at regular intervals,and the subsequent new growthof macroalgae on the nets. Cur-rently, the swept seaweeds floataway or decompose in the areasbetween clam rows, but Chuck-anut Shellfish is working onalternatives for potential re-useof swept macroalgae. The sec-ond and third year clams arelarger and excrete more ammo-nia, and the model adequatelyreflects this with higher seaweed
biomass peaks. This fouling pattern with increasingclam size has been verified in loco (Dewey et al.2013).
Fig. 10 shows the difference in fouling with andwithout clams, and illustrates the fact that somemacroalgal colonisation would occur be cause of theavailable substrate (pre dator nets), even if clamswere not cultivated. The in creased fouling in farmsections with larger clams (higher year classes) isalso shown, and reflects a greater emission of ammo-nia from the clam beds due to excretion by larger animals.
264
Variable Model results
Model inputs Seeding (kg total fresh weight [TFW]) per production cycle 3375
Model outputs Production Total physical product (kg TFW) per production cycle 157 554Average physical product (APP, Output/Input) 47
Environmental externalities Change in 90th percentile NH4
+ concentration (μmol l−1) 8.92 (in)−9.04 (out)Change in 90th percentile chlorophyll a (mg chl a m−3) 4.49 (in)−3.98 (out)Change in 10th percentile O2 concentration (mg l−1) 6.17 (in)−6.10 (out)ASSETS eutrophication model score No change (in to out)
Profit and loss Total income (i.e. Manila clam sales, US $ per cycle) 630 210Total marginal expenditure (i.e. seeds, US $ per cycle) 135 000Farm profit (i.e. income–expenditure, US $ per cycle) 495 210
Table 3. Simulated production and environmental effects of Manila clam farming in North Puget Sound (per 1180 d cycle)
Phytoplankton removal12305 kg C yr–1
Detritus removal53852 kg C yr–1
Population equivalents (PEQ)1037 PEQ yr–1
Algae –1914Detritus –8377Excretion 787Faeces 6001Mortality 79
Mass balance –3423
N removal (kg yr–1)
Shellfishfiltration
Assets
Chl a
O2
Score
Shellfish farming income: 194 k$ yr–1
Nutrient treatment: 41.5 k$ yr–1
Density: 750 ind.
Cultivation period: 1180 d
Total income: 236.4 k$ yr–1
Income Parameters
Fig. 8. FARM model annualized mass balance for Manila clam culture at Chuckanut Shellfish farm (the seaweed fouling component is not included)

Saurel et al.: Manila clam ecosystem goods and services
The results in Table 3 additionally highlight thatthe effects of clam culture on DO are minimal(−0.07 mg l−1), and that there is a significant draw-down of chl a, 0.5 μg l−1, or 20% of the ambient concentration. This is an important positive ex -ternality of clam culture at Chucka nut Shellfish,since it contri butes to a reduction of primary symp-toms of eutrophication , and therefore short-circuitsthe potential development of secondary symptomsassociated with organic decomposition (e.g. Brickeret al. 2003).
This raises the possibility of integrating farms suchas Chuckanut Shellfish into a broader, catchment-scale nutrient management plan. For instance, nutri-ent credit trading is one approach used for the pro-posed Chesapeake Clean Water and EcosystemRestoration Act of 2009 (H.R. 3852/S. 1816; Jones etal. 2010), aimed at creating revenue opportunitiesand reducing the cost associated with excess nutrient
at the bay scale, and promoting the reduction ofnutrient loads.
FARM not only makes it possible to simulate thetotal mass balance of phytoplankton and organicdetritus removed, but also the monetary equivalentfor nutrient removal, which in this case correspondsto over $40 000 per year (1 kg N is valued at 12.4 USDby Meybeck et al. 1989; Fig. 8). The macroalgalsweeping component is not included in this figure,and should be amended once a harvesting systemis developed. Over 20% of additional income maybe de rived from nutrient credit trading when sucha management plan is implemented in the area(Fig. 8). This figure should be seen as a minimum,since the cost of nutrient removal is largely depend-ent on both the sources and the methods used.Stephenson et al. (2010) estimate that a low-end costof 73 USD kg−1 (33 USD lb−1) for low cost septic re -tirement escalates to 843−1337 USD kg−1 (383−653USD lb−1) for wet ponds, and can reach a peak of4873 USD kg−1 (2215 USD lb−1) for high cost sand filters.
A marginal analysis of optimal stocking density(Fig. 11) showed that from a food resource perspec-tive there is scope for increasing cultivation seedingdensity up to 9 t of seeds over a culture cycle, sincethe present value of 3.4 t is still in the first stage of theproduction curve. However, high mortalities, princi-pally due to heavy predation by Dungeness crabsMetacarcinus magister are already a significant riskfactor, so changes should be effected in a precaution-ary manner. Moreover, lower densities also con-tribute to the ecological carrying capacity, through amore balanced partitioning of available food, andtherefore help maintain other filter-feeding speciesin the farm area (only about 20% of the total area isactually farmed).
Potential services provided by Manila clam inthe Puget Sound
The overall ASSETS score (Bricker et al. 2003,2008) was in the high status category (Fig. 8), bothfor water entering the farm and after processingthrough the clam culture. Since ASSETS focuses onwater column indicators (chl a and DO only at thelocal scale), a shellfish farm will typically provide anecosystem service with respect to chl a drawdown,provided oxygen consumption within the farm doesnot lead to a marked reduction in DO concentration.Our chl a simulations showed that the ChuckanutShellfish farm does exercise top-down control of
265
0
5
10
15
20
25
30
35
40
45
50
200 400 600 800 1000 1200 1400
Sea
wee
d fo
ulin
g (g
DW
m–2
)
Day
Year 1 Year 2 Year 3
Sweeping in mid-year
Fig. 9. Seaweed fouling on predator nets at the ChuckanutShellfish farm; 20 onsite measurements of seaweed dry
weight: 90th percentile = 47.4 g dry weight (DW)
0.0
0.5
1.0
1.5
2.0
2.5
3.0
3.5
4.0
200 400 600 800 1000 1200 1400
ΔSea
wee
d fo
ulin
g (Δ
g D
W m
–2)
Day
Year 1 Year 2 Year 3
Sweeping in mid-year
Fig. 10. Difference in seaweed fouling on predator nets at Chuckanut Shellfish farm for planted and fallow plots

Aquacult Environ Interact 5: 255–270, 2014266
phytoplankton, but since the inflowing water is al -ready at a high status, the ASSETS score remainedunchanged.
However, the ASSETS score for Puget Sound indi-cates that Hood Canal and South Puget Sound havehigh eutrophication symptoms, whereas other re -gions of the sound have an overall score of moderate,with blooms of nuisance algae that lead to shellfish-ery closures (Bricker et al. 1999, 2008, Trainer et al.2007). Bricker et al. (1999) reported that eutrophica-tion in Puget Sound was likely to worsen due toincreasing human population pressure in the coastalareas.
The overall role of Manila clam culture for top-down control of eutrophication symptoms in PugetSound was estimated through a simple budget(Fig. 12). It assumed that existing farms have thesame general conditions as Chuckanut Shellfish, andthe results are, therefore, indicative of conditionstypically observed in Puget Sound.
However, potential interactions among farms can-not be resolved with this type of local-scale ap -proach, and require a system-scale model, such asEcoWin.NET (e.g. Ferreira et al. 2013), that can ac -count for food de pletion effects as more shellfishfarms are licensed. Moreover, an individual farm’sproduction and environmental effects will vary as afunction of the flushing rate at its location (Dumbauldet al. 2009).
The general background level of bivalve density inthe culture plots is near zero with the exception of a
few small taxa and there is no natu-ral re cruitment of Manila clams inSamish Bay. Despite the previouslyreported caveats, and given thatoverall there is a low density offarms in the area which allows us toneglect farm–farm interactions, it isinstructive to upscale the resultsfrom Chuckanut to the whole ofPuget Sound — a comparison withdeclared production shows reason-able agreement, with a differenceof 16%. This suggests Manila clamculture in Puget Sound may providean annual ecosystem service for eu -trophication control correspondingto 90 000 PEQ (1 PEQ = 3.3 kg Nyr−1; Lindahl et al. 2005), for a pro-duction of approximately 4500 t yr−1
(Fig. 12).
CONCLUSIONS
Chuckanut farm production is well represented bythe model. Harvest yield is very sensitive to mortal-ity, and profitability is very sensitive to seed costs.Mortality is mainly due to Dungeness crab Meta -carcinus magister, white winged sea duck Melanittafusca and surf Scoter Melanitta perspicillata preda-tion, which can result in up to 100% crop loss whenthe farm is without net protection, while seed costvaries with seed size and survival (Stirling 2011).
Chuckanut Shellfish uses mechanised technologiesto minimise the impact of Manila clam culture. Thiswork showed that there were no significant before-versus-after effects of mechanical harvest on totalinvertebrate densities or any individual taxa tested.The differences in effects of hand harvest on totalinvertebrate density were inconclusive — lower afterharvest on one date, higher on another and none onthe third — and the species richness was significantlylower after hand harvest.
As has been shown elsewhere (Stirling 2011), thisform of mechanised harvesting appears to have asmall and transient impact on the seabed. Moreover,clams are seeded as a single cohort line, with har-vesting occurring only at the end of the culture cycle(~3 yr). This time-limited substrate disturbance dur-ing harvest, together with reduced predator netmaintenance for fouling control, minimises impactson the sediment. Mechanised culture practice hasbeen recently adopted by 2 other shellfish companies
–10
0
10
20
30
40
(0
100
120
140
160
180
200
220
240
260
280
300
2 4 6 8 10 12 14 16
AP
P a
nd M
PP
(no
units
)
Har
vest
able
bio
mas
s (to
nnes
live
wei
ght)
Total seed over a culture cycle (t)
TPP (tonnes) APP MPP
Present seeding: 3.4 t
Optimal MPP = 10
9 t of seeds
VMP = MPP.Po VMP = Pi MPP = Pi/Po Pi = 40 USD Po = 4.0 USD
Fig. 11. Marginal analysis for Manila clam culture at Chuckanut Shellfish farm.APP: average physical product; MPP: marginal physical product; TPP: total
physical product: VMP: value of marginal product; Pi (Po): input (output)

Saurel et al.: Manila clam ecosystem goods and services 267
in Samish Bay and mechanisation technology isresponsible for an increase of almost 40% in totalharvest of Manila clam in recent years, which pro-vides both increased profits and job creation.
The results presented in this work provide valuableinformation for both the shellfish aquaculture indus-try and future management of sustainable aquacul-ture on the West Coast of the USA and elsewhere.These simulations fit well with the Ecosystem Ap -proach to Aquaculture (EAA; Soto et al. 2008), andwith the National and Washington Shellfish Initiativestrategies (NSI and WSI 2011) blueprint for action torestore and protect Puget Sound, with a goal of a netincrease of 44 km2 (10 800 acres) of harvestable shell-fish by 2020.
In Puget Sound, similar eutrophication concerns tothose in Chesapeake Bay (Boesch et al. 2001) havebeen raised for the past decade, with increasing peri-ods of localised anoxic conditions and an increase inharmful algal blooms (Anderson et al. 2008), both of
which have repercussions on shellfish harvest. Theincrease in nutrient loading from the watershed tothe bay (Krembs 2013) together with the particularupwelling conditions along the US West Coast areamplifying both eutrophication and ocean acidifica-tion phenomena (Khangaonkar et al. 2012).
It is well established that shellfish aquaculture serv-ices regarding eutrophication symptoms are of interestfor ecosystem restoration initiatives to ‘protect and en-hance a resource that is important for jobs, industry,citizens and tribes’. Clam culture provides the 4 eco-system services as described by the Millennium Eco-system Assessment (Millennium Ecosystem Assess-ment 2005, Maltby 2013): (1) food provisioningservice, (2) regulating service for water clarity by re-ducing eutrophication symptoms, (3) supporting serv-ice for nutrient cycling and creating artificial reefsand (4) cultural service via tourism and recreationalactivities and from cultural heritage. The increase offarms using the Chuckanut approach, along with thecreation of new jobs, holds promise both for industrydevelopment and eutrophication abatement.
However, the EAA includes not only productionand ecological carrying capacity (Thrush et al. 2012,Ross et al. 2013), but also social and governance com-ponents (Inglis et al. 2000, McKindsey et al. 2006,Costa-Pierce 2008, Soto et al. 2008). Social ac -ceptance for non-fed aquaculture has improved, forinstance through eco-certification (Jonell et al. 2013),and together with the development of new culturetechnologies for sustainable aquaculture (CostaPierce 2010), more initiatives for developing furthershellfish aquaculture are emerging in developedcountries where constraints are greater than in otherparts of the world.
We hope that the analysis presented herein, basedon a real farm with a genuine commitment to envi-ronmental stewardship, might help competitive usersof waterfront resources, government agencies andstakeholders in general to better appreciate the rolethat sustainable shellfish culture plays in the provi-sion of ecosystem goods and services.
Acknowledgements. The research received support fromthe NOAA Saltonstall-Kennedy Grant Program (FY10) grantnumber NA10NMF4270309. The authors are grateful toNOAA Saltonstall-Kennedy Grant Program for the monitor-ing data used in the study. The authors additionally thank4 anonymous reviewers for comments on an earlier draft.
LITERATURE CITED
Anderson DM, Burkholder JM, Cochlan WP, Glibert PM andothers (2008) Harmful algal blooms and eutrophication:
Fig. 12. Scaling of environmental externalities of clam cul-ture at Chuckanut Shellfish farm (red dot) to the total Manila
clam production in Puget Sound
268
examining linkages from selected coastal regions of theUnited States. Harmful Algae 8: 39−53
Badino G, Bona F, Maffiotti A, Giovanardi O, Pranovi F(2004) Impact of mechanical clam harvesting on a ben-thic habitat: evaluation by means of sediment profileimaging. Aquat Conserv 14: S59−S67
Bendell LI, Duckham C, L’Espérance T, Whiteley JA (2010)Changes in geochemical foreshore attributes as a conse-quence of intertidal shellfish aquaculture: a case study.Mar Ecol Prog Ser 404: 91−108
Boesch DF, Brinsfield RB, Magnien RE (2001) ChesapeakeBay eutrophication: scientific understanding, ecosystemrestoration, and challenges for agriculture. J EnvironQual 30: 303−320
Bricker SB, Clement CG, Pirhalla DE, Orlando SP, FarrowDRG (1999) National estuarine eutrophication assess-ment: effects of nutrient enrichment in the nation’s estu-aries. NOAA, National Ocean Service, Special ProjectsOffice and the National Centers for Coastal Ocean Sci-ence. Silver Spring, MD
Bricker SB, Ferreira JG, Simas T (2003) An integratedmethodology for assessment of estuarine trophic status.Ecol Modell 169: 39−60
Bricker SB, Longstaf B, Dennison W, Jones A, Boicourt K,Wicks C, Woerner J (2008) Effects of nutrient enrichmentin the nation’s estuaries: a decade of change. HarmfulAlgae 8: 21−32
Burkholder JM, Shumway SE (2011) Bivalve shellfish aqua-culture and eutrophication, In: Shumway SE (ed) Shell-fish and the environment. Wiley, New York, NY, p 155−215
Carlsson MS, Engström P, Lindahl O, Ljungqvist L, PetersenJK, Svanberg L, Holmer M (2012) Effects of mussel farmson the benthic nitrogen cycle on the Swedish west coast.Aquacult Environ Interact 2: 177−191
Chew KK (1989) Manila clam biology and fishery develop-ment in western North America. In: Manzi JJ, CastagnaM (eds) Clam mariculture in North America. ElsevierPress, New York, NY, p 243–261
Coen LD (1995) A review of the potential impacts ofmechanical harvesting on subtidal and intertidal shellfish resources. South Carolina Department of Natural Re sources. Available at www. ecsga. org/ Pages/Sustainability/ Coen% 2095%20review.pdf (accessed 15October 2013)
Coen LD, Brumbaugh RD, Bushek D, Grizzle R and others(2007) Ecosystem services related to oyster restoration.Mar Ecol Prog Ser 341: 303−307
Costa-Pierce B (2002) Ecology as the paradigm for the futureof aquaculture. In: Costa-Pierce B (ed) Ecological aqua-culture: the evolution of the blue revolution. BlackwellScience, Oxford, p 339−372
Costa-Pierce BA (2008) An ecosystem approach to marineaquaculture: a global review. In: Soto D, Aguilar-Manjarrez J, Hishamunda N (eds) Building an ecosystemapproach to aquaculture. FAO/Universitat de les illesBalears Expert Workshop, 7–11 May 2007, Palma deMallorca, FAO Fisheries and Aquaculture ProceedingsNo. 14, Rome, p 81–116
Costa-Pierce BA (2010) Sustainable ecological aquaculturesystems: the need for a new social contract for aqua -culture development. Mar Technol Soc J 44: 88−112
Cranford PJ, Hargrave BT, Doucette LI (2009) Benthicorganic enrichment from suspended mussel (Mytilusedulis) culture in Prince Edward Island, Canada. Aqua-culture 292: 189−196
Crawford CM, Macleod CKA, Mitchell IM (2003) Effects ofshellfish farming on the benthic environment. Aqua -culture 224: 117−140
Dame RF, Prins TC (1997) Bivalve carrying capacity incoastal ecosystems. Aquat Ecol 31: 409−421
Dealteris JT, Kilpatrick BD, Rheault RB (2004) A compara-tive evaluation of the habitat value of shellfish aquacul-ture gear, submerged aquatic vegetation and a non- vegetated seabed. J Shellfish Res 23: 867−874
Defossez JM, Daguzan J (1995) Mesure comparative dudébit palléal des bivalves Tapes decussatus et Ruditapesphilippinarum lors de rapides changements de tempéra-ture et de turbidité. Cah Biol Mar 36: 299−307
Dewey W, Davis JP, Cheney DP (2011) Shellfish aquacultureand the environment: an industry perspective. In: Shum -way SE (ed) Shellfish aquaculture and the environment,Wiley, New York, NY, p 33−50
Dewey W, Shurbier AD, Ferreira JG, Cordell JR, Davis JP,Cheney DP (2013) Assessing the effects of mechanizedManila clam farming in North Puget Sound, Washington,USA. World Aquaculture Society Conference 2013 —Nashville, TN, USA, 21−25 February 2013
Droop MR (1970) Vitamin-B12 and marine ecology. Helgo-länder wiss Meeresunter 20: 629−636
Dumbauld BR, Ruesink JL, Rumrill SS (2009) The ecologicalrole of bivalve shellfish aquaculture in the estuarineenvironment: a review with application to oyster andclam culture in West Coast (USA) estuaries. Aquaculture290: 196−223
FAO (Food and Agriculture Organization of the UnitedNations) (2012) The state of world fisheries and aqua -culture (SOFIA). FAO, Rome
Ferreira JG, Hawkins AJS, Bricker SB (2007) Managementof productivity, environmental effects and profitability ofshellfish aquaculture — the Farm Aquaculture Resource— Management (FARM) model. Aquaculture 264: 160−174
Ferreira JG, Sequeira A, Hawkins AJS, Newton A and oth-ers (2009) Analysis of coastal and offshore aquaculture: application of the FARM model to multiple systems andshellfish species. Aquaculture 289: 32−41
Ferreira JG, Hawkins AJS, Bricker S (2011) Chapter 1. Therole of shellfish farms in provision of ecosystem goodsand services. In: Shumway S (ed) Shellfish aquacul -ture and the environment. Wiley-Blackwell, Chichester,p 3−32
Ferreira JG, Saurel C, Ferreira JM (2012) Cultivation of gilt-head bream in monoculture and integrated multi-trophicaquaculture. Analysis of production and environmentaleffects by means of the FARM model. Aquaculture358−359: 23−34
Ferreira JG, Ramos L, Costa-Pierce BA (2013) Key driversand issues surrounding carrying capacity and site selec-tion, with emphasis on environmental components. In: Ross LG, Telfer TC, Falconer L, Soto D, Aguilar-Manjar-rez J (eds) Site selection and carrying capacities forinland and coastal aquaculture. FAO/Institute of Aqua-culture, University of Stirling, Expert Workshop, 6−8December 2010, Stirling. FAO Fisheries and AquacultureProceedings No. 21, Rome, p 47−86
Flye-Sainte-Marie J, Jean F, Paillard C, Ford S, Powell E,Hofmann E, Klinck J (2007) Ecophysiological dynamicmodel of individual growth of Ruditapes philippinarum.Aquaculture 266: 130−143
Forrest BM, Keeley NB, Hopkins GA, Webb SC, Clement
Aquacult Environ Interact 5: 255–270, 2014
269
DM (2009) Bivalve aquaculture in estuaries: review andsynthesis of oyster cultivation effects. Aquaculture 298: 1−15
Godet L, Toupoint N, Fournier J, Le Mao P, Retiere C,Olivier F (2009) Clam farmers and oystercatchers: effectsof the degradation of Lanice conchilega beds by shellfishfarming on the spatial distribution of shorebirds. MarPollut Bull 58: 589−595
Godfray HCJ, Beddington JR, Crute IR, Haddad L and oth-ers (2010) Food security: the challenge of feeding 9 bil-lion people. Science 327: 812−818
Inglis GJ, Gust N (2003) Potential indirect effects of shellfishculture on the reproductive success of benthic predators.J Appl Ecol 40: 1077−1089
Inglis GJ, Hayden BJ, Ross AH (2000) An overview of factors affecting the carrying capacity of coastal embay-ments for mussel culture. Client Report CHC00/69,National Institute of Water and Atmospheric Research(NIWA), Christchurch
Jackson JBC, Kirby MX, Berger WH, Bjorndal KA and oth-ers (2001) Historical overfishing and the recent collapseof coastal ecosystems. Science 293: 629−637
Jolly CM, Clonts HA (1993) Economics of aquaculture. FoodProducts Press, New York, NY
Jonell M, Phillips M, Ronnback P, Troell M (2013) Eco-certi-fication of farmed seafood: Will it make a difference?Ambio 42: 659−674
Jones C, Branoksy E, Selman M, Perez M (2010) ‘How nutri-ent trading could help restore the Chesapeake Bay.’ WRIWorking Paper. World Resources Institute, Washington,DC. Available at http: //pdf.wri. org/ working_ papers/ how_nutrient_trading_could_help_restore_the_chesapeake_bay. pdf (accessed 21 April 2014)
Kaiser MJ, Edwards DB, Spencer BE (1996) Infaunal com-munity changes as a result of commercial clam cultiva-tion and harvesting. Aquat Living Resour 9: 57−63
Khangaonkar T, Sackmann B, Long W, Mohamedali T,Roberts M (2012) Simulation of annual biogeochemicalcycles of nutrient balance, phytoplankton bloom(s), andDO in Puget Sound using an unstructured grid model.Ocean Dyn 62: 1353−1379
Krembs C (2013) Eutrophication in Puget Sound. In: IrvineJR, Crawford WR (eds) State of physical, biological, andselected fishery resources of Pacific Canadian marineecosystems in 2012. DFO Can Sci Advis Sec Res Doc2013/032, Ottawa, 106−112. Available at www.dfo-mpo.gc. ca/ Csas- sccs/ publications/resdocs-docrech/ 2013/ 2013_032-eng.pdf (accessed 21 April 2014)
Lavoie M-F, McKindsey CW, Pearce CM Archambault P(2013) Assessing the influence of intertidal aquacultureof the Manila clam (Venerupis philippinarum) on biogeo-chemical fluxes. Poster at the AQUA2013 conference,Las Palmas, Gran Canaria, Spain, 2−7 November 2013
Lindahl O, Hart R, Hernroth B, Kollberg S and others (2005)Improving marine water quality by mussel farming: aprofitable solution for Swedish society. Ambio 34: 131−138
Maltby L (2013) Ecosystem services and the protection, res-toration, and management of ecosystems exposed tochemical stressors. Environ Toxicol Chem 32: 974−983
McKindsey CW, Thetmeyer H, Landry T, Silvert W (2006)Review of recent carrying capacity models for bivalveculture and recommendations for research and manage-ment. Aquaculture 261: 451−462
Merino G, Barange M, Blanchard JL, Harle J and others
(2012) Can marine fisheries and aquaculture meet fishdemand from a growing human population in a changingclimate? Glob Environ Change 22: 795−806
Meybeck M, Chapman DV, Helmer R (1989) Global waterquality: a first assessment. World Health Organisation/United Nations Environment Programme. Basil Black-well, Cambridge
Millennium Ecosystem Assessment (2005) Ecosystems andhuman wellbeing: synthesis. Island Press, Washington,DC. Available at www.millenniumassessment.org/documents/ document.356.aspx.pdf (accessed 21 April2014)
Munroe D, McKinley RS (2007) Commercial Manila clam(Tapes philippinarum) culture in British Columbia, Can-ada: the effects of predator netting on intertidal sedimentcharacteristics. Estuar Coast Shelf Sci 72: 319−328
Newell RIE (2004) Ecosystem influences of natural and cul-tivated populations of suspension-feeding bivalve mol-luscs: a review. J Shellfish Res 23: 51−61
Nobre AM, Ferreira JG, Newton A, Simas T, Icely JD, NevesR (2005) Management of coastal eutrophication: integra-tion of field data, ecosystem-scale simulations andscreening models. J Mar Syst 56: 375−390
Nunes JP, Ferreira JG, Bricker SB, O’Loan B and others(2011) Towards an ecosystem approach to aquaculture: assessment of sustainable shellfish cultivation at differ-ent scales of space, time and complexity. Aquaculture315: 369−383
Pacific Coast Shellfish Growers Association (2012) Shellfishproduction on the west coast. Available at http: // pcsga.org/ wprs/wp-content/uploads/2013/04/ production _ stats.pdf (accessed 25 August 2013)
Pollack JB, Yoskowitz D, Kim HC, Montagna PA (2013) Roleand value of nitrogen regulation provided by oysters(Crassostrea virginica) in the Mission-Aransas Estuary,Texas, USA. PLoS ONE 8: e65314
Powers MJ, Peterson CH, Summerson HC, Powers SP (2007)Macroalgal growth on bivalve aquaculture nettingenhances nursery habitat for mobile invertebrates andjuvenile fishes. Mar Ecol Prog Ser 339: 109−122
Pranovi F, Libralato S, Raicevich S, Granzotto A, Pastres R,Giovanardi O (2003) Mechanical clam dredging inVenice lagoon: ecosystem effects evaluated with atrophic mass-balance model. Mar Biol 143: 393−403
Prins TC, Smaal AC, Dame RF (1997) A review of the feed-backs between bivalve grazing and ecosystem pro-cesses. Aquat Ecol 31: 349−359
Ross LG, Telfer TC, Falconer L, Soto D and others (2013)Carrying capacities and site selection within the ecosys-tem approach to aquaculture. In: Ross LG, Telfer TC, Fal-coner L, Soto D, Aguilar-Manjarrez J (eds) Site selectionand carrying capacities for inland and coastal aquacul-ture. FAO/Institute of Aquaculture, University of Stirling,Expert Workshop, 6−8 December 2010, Stirling. FAOFisheries and Aquaculture Proceedings No. 21, Rome,p 19−46
Šegvic-Bubic T, Grubišic L, Karaman N, Ti<ina V, JelavicKM, Katavic I (2011) Damages on mussel farms poten-tially caused by fish predation-self service on the ropes?Aquaculture 319: 497−504
Shumway SE, Davis C, Downey R, Karney R and others(2003) Shellfish aquaculture — in praise of sustainableeconomies and environments. World Aquacult 34: 15−17
Silva C, Ferreira JG, Bricker SB, DelValls TA, Martin-DiazML, Yanez E (2011) Site selection for shellfish aquacul-
Saurel et al.: Manila clam ecosystem goods and services

Aquacult Environ Interact 5: 255–270, 2014
ture by means of GIS and farm-scale models, with anemphasis on data-poor environments. Aquaculture 318: 444−457
Smaal A, van Stralen M, Schuiling E (2001) The interactionbetween shellfish culture and ecosystem processes. CanJ Fish Aquat Sci 58: 991−1002
Sobral P, Widdows J (1997) Influence of hypoxia and anoxiaon the physiological responses of the clam Ruditapes de -cussatus from southern Portugal. Mar Biol 127: 455−461
Solidoro C, Pecenik G, Pastres R, Franco D, Dejak C (1997)Modelling macroalgae (Ulva rigida) in the Venicelagoon: model structure identification and first para -meters estimation. Ecol Modell 94: 191−206
Soto D, Aguilar-Manjarrez J, Brugère C, Angel D and others(2008) Applying an ecosystem-based approach to aqua-culture: principles, scales and some management meas-ures. In: Soto D, Aguilar-Manjarrez J, Hishamunda N(eds) Building an ecosystem approach to aquaculture.FAO/Universitat de les illes Balears Expert Workshop,7–11 May 2007, Palma de Mallorca, FAO Fisheries andAquaculture Proceedings No. 14, Rome, p 15−35
Spencer BE, Kaiser MJ, Edwards DB (1997) Ecologicaleffects of intertidal Manila clam cultivation: observationsat the end of the cultivation phase. J Appl Ecol 34: 444−452
Stephenson K, Aultman S, Metcalfe T, Miller A (2010) Anevaluation of nutrient nonpoint offset trading in Virginia: a role for agricultural nonpoint sources? Water ResourRes 46: W04519, doi: 10.1029/2009WR008228
Stirling D (2011) Mechanized clam harvesting for coastalBritish Columbia: environmental implications. MSc the-
sis. University of VictoriaThrush MA, Dunn PL, Peeler EJ (2012) Monitoring emerg-
ing diseases of fish and shellfish using electronic sources.Transbound Emerg Dis 59: 385−394
Toupoint N, Godet L, Fournier J, Retiere C, Olivier F (2008)Does Manila clam cultivation affect habitats of the engi-neer species Lanice conchilega (Pallas, 1766)? Mar PollutBull 56: 1429−1438
Trainer VL, Cochlan WP, Erickson A, Bill BD, Cox FH,Borchert JA, Lefebvre KA (2007) Recent domoic acid clo-sures of shellfish harvest areas in Washington Stateinland waterways. Harmful Algae 6: 449−459
UN (2010) World population prospects: the 2010 revision.Department of Economic and Social Affairs. PopulationDivision, New York, NY
Walne PR (1972) The influence of current speed, body sizeand water temperature on the filtration rate of five spe-cies of bivalves. J Mar Biol Assoc UK 52: 345−374
Wilbur AE, Seyoum S, Bert TM, Arnold WS (2005) A geneticassessment of bay scallop (Argopecten irradians) restora-tion efforts in Florida’s Gulf of Mexico coastal waters(USA). Conserv Genet 6: 111−122
Worm B, Branch TA (2012) The future of fish. Trends EcolEvol 27: 594−599
Worm B, Hilborn R, Baum JK, Branch TA and others (2009)Rebuilding global fisheries. Science 325: 578−585
zu Ermgassen PSE, Gray MW, Langdon CJ, Spalding MD,Brumbaugh RD (2013) Quantifying the historic contribu-tion of Olympia oysters to filtration in Pacific Coast (USA)estuaries and the implications for restoration objectives.Aquat Ecol 47: 149−161
270
Editorial responsibility: Alejandro Buschmann, Puerto Montt, Chile
Submitted: December 27, 2013; Accepted: August 4, 2014Proofs received from author(s): October 12, 2014


![[PPT]Clam Dissection · Web viewDissection of the Clam Venus mercenaria * copyright cmassengale * * * * * * copyright cmassengale Resource * * * * * * * * * * * * * * * * * * * * *](https://static.fdocuments.in/doc/165x107/5aa6232f7f8b9a7c1a8e5555/pptclam-dissection-viewdissection-of-the-clam-venus-mercenaria-copyright-cmassengale.jpg)


