Economy of the European Countries- Latest
49
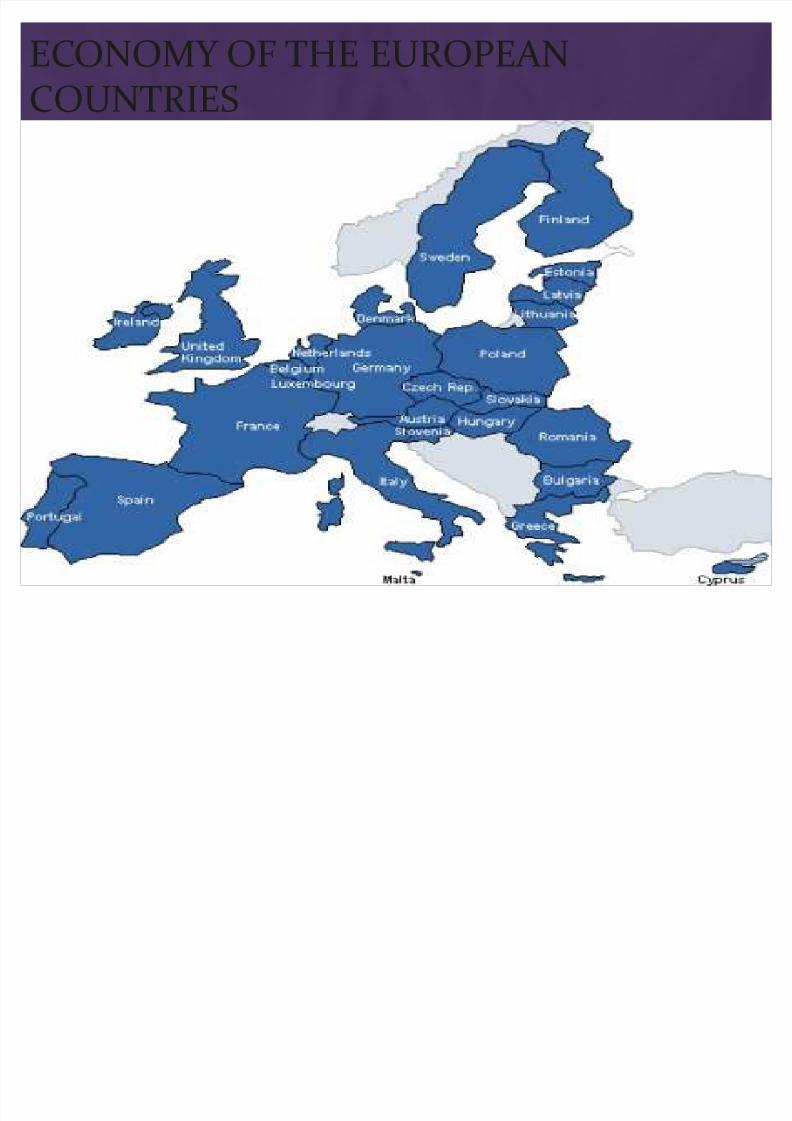
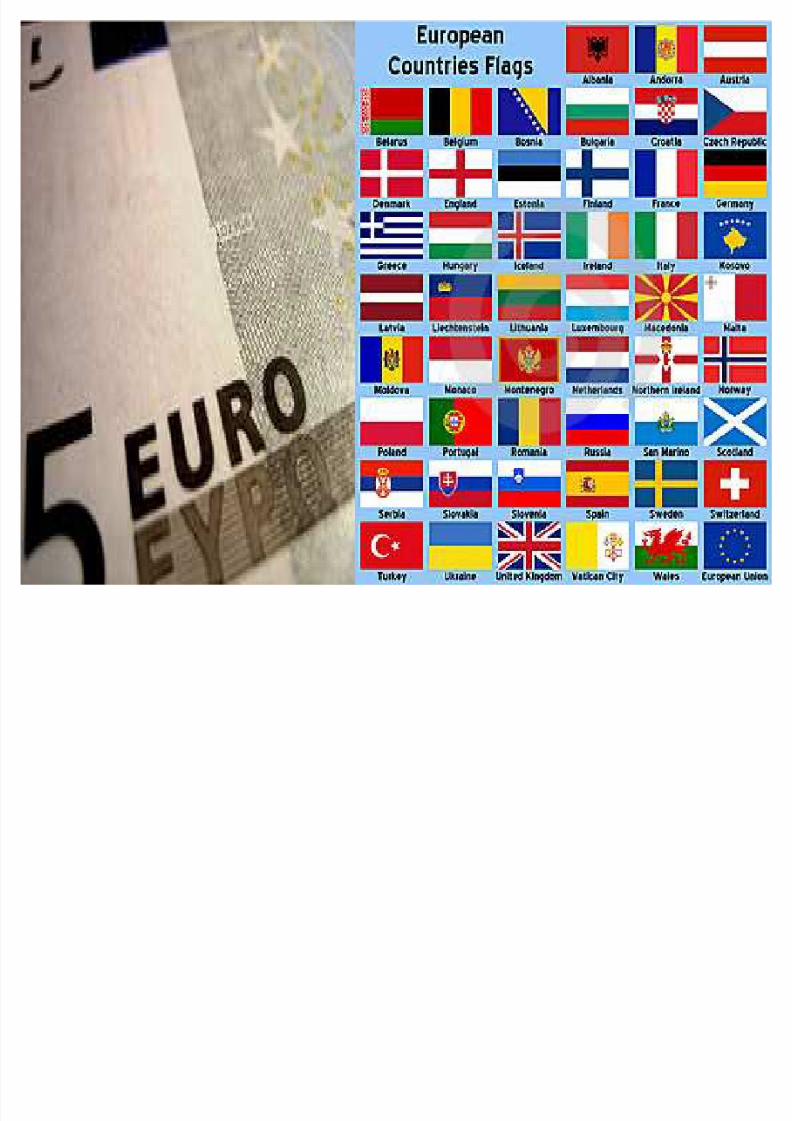
ECONOMY OF THE EUROPEAN COUNTRIES
-
Upload
niraj-patel -
Category
Documents
-
view
220 -
download
0
Transcript of Economy of the European Countries- Latest
8/6/2019 Economy of the European Countries- Latest
http://slidepdf.com/reader/full/economy-of-the-european-countries-latest 1/49
ECONOMY OF THE EUROPEAN
COUNTRIES
8/6/2019 Economy of the European Countries- Latest
http://slidepdf.com/reader/full/economy-of-the-european-countries-latest 2/49

8/6/2019 Economy of the European Countries- Latest
http://slidepdf.com/reader/full/economy-of-the-european-countries-latest 3/49
AUSTRIA
Government type : federal republic

8/6/2019 Economy of the European Countries- Latest
http://slidepdf.com/reader/full/economy-of-the-european-countries-latest 4/49
GDP (purchasing power parity):
$332.6 billion (2010 est.)
country comparison to the world: 36
note: data are in 2010 US dollars
GDP (official exchange rate):
$366.3 billion (2010 est.)
GDP - real growth rate:
2% (2010 est.)
country comparison to the world: 150
GDP - per capita (PPP):
$40,300 (2010 est.)
country comparison to the world: 20
note: data are in 2010 US dollars
GDP - composition by sector:
agriculture: 1.5%
industry: 29.4%
services: 69.1% (2010 est.)
Unemployment rate:
4.5% (2010 est.)
country comparison to the world: 42
Population below poverty line:
6% (2008)

8/6/2019 Economy of the European Countries- Latest
http://slidepdf.com/reader/full/economy-of-the-european-countries-latest 5/49
Inflation rate (consumer prices):
1.9% (2010 est.)
country comparison to the world: 50
Industrial production growth rate:
7% (2010 est.)
country comparison to the world: 46
Electricity - production:
68.85 billion kWh (2009 est.)
country comparison to the world: 40
Electricity - consumption:
65.67 billion kWh (2009 est.)
country comparison to the world: 39
Electricity - exports:
18.76 billion kWh (2009 est.)
Electricity - imports:
19.54 billion kWh (2009 est.)
Oil - production:
21,880 bbl/day (2009 est.)
country comparison to the world: 73
Oil - consumption:
247,700 bbl/day (2009 est.)
country comparison to the world: 50
Oil - exports:
50,410 bbl/day (2009 est.)
country comparison to the world: 77
Oil - imports:
273,000 bbl/day (2009 est.)
country comparison to the world: 37
Oil - proved reserves:
89 million bbl (1 January 2010 est.)
country comparison to the world: 72
8/6/2019 Economy of the European Countries- Latest
http://slidepdf.com/reader/full/economy-of-the-european-countries-latest 6/49
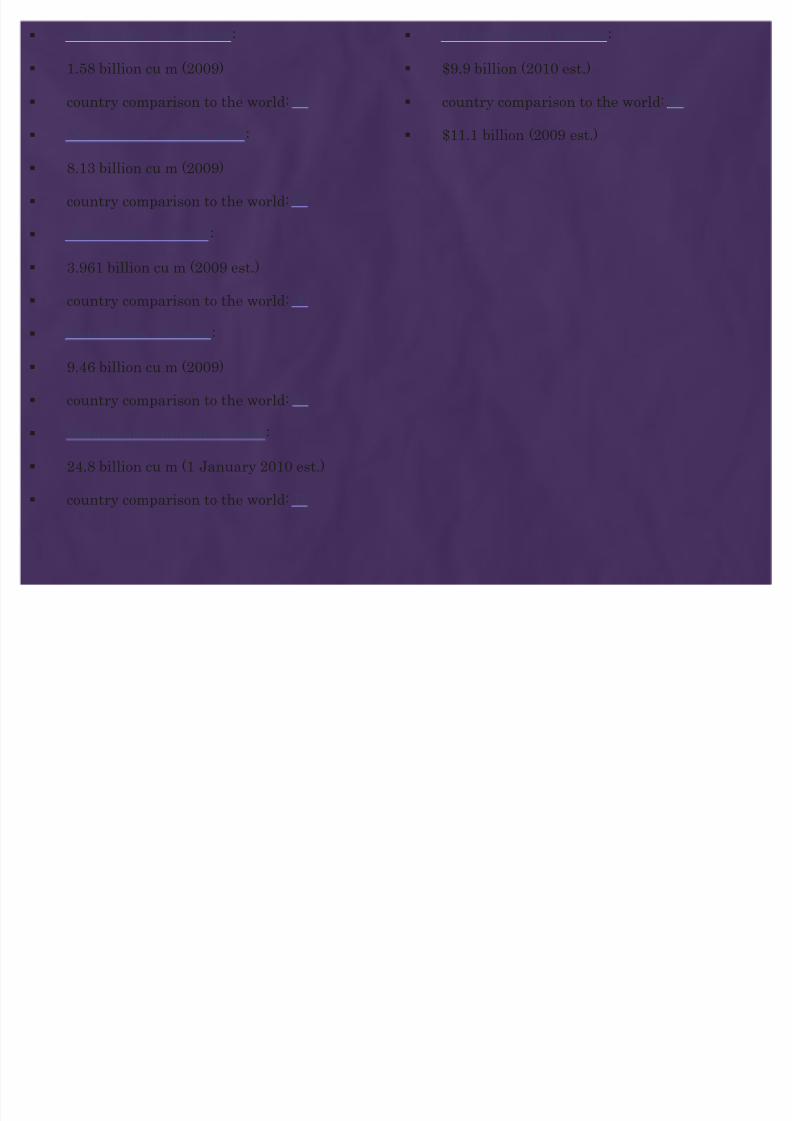
Natural gas - production:
1.58 billion cu m (2009)
country comparison to the world: 60
Natural gas - consumption:
8.13 billion cu m (2009)
country comparison to the world: 52
Natural gas - exports:
3.961 billion cu m (2009 est.)
country comparison to the world: 30
Natural gas - imports:
9.46 billion cu m (2009)
country comparison to the world: 23
Natural gas - proved reserves:
24.8 billion cu m (1 January 2010 est.)
country comparison to the world: 75
Current account balance:
$9.9 billion (2010 est.)
country comparison to the world: 23
$11.1 billion (2009 est.)

8/6/2019 Economy of the European Countries- Latest
http://slidepdf.com/reader/full/economy-of-the-european-countries-latest 7/49
Exports:
$157.4 billion (2010 est.)
country comparison to the world: 29
Exports - commodities:
machinery and equipment, motor vehicles andparts, paper and paperboard, metal goods,chemicals, iron and steel, textiles, foodstuffs
Exports - partners:
Germany 30.96%,I
taly 8.17%, Switzerland4.99%, US 3.99% (2009)
Airports:
55 (2010)
country comparison to the world: 85
Heliports:
1 (2010)
Ports and terminals:
Enns, Krems, Linz, Vienna
Imports:
$156 billion (2010 est.)
country comparison to the world: 29
Imports - commodities:
machinery and equipment, motor vehicles,chemicals, metal goods, oil and oil products;foodstuffs
Imports - partners:
Germany 45.07%, Switzerland 6.76%,I
taly6.66%, Netherlands 4.03% (2009)
Debt - external:
$755 billion (30 June 2010)
country comparison to the world: 17
8/6/2019 Economy of the European Countries- Latest
http://slidepdf.com/reader/full/economy-of-the-european-countries-latest 8/49
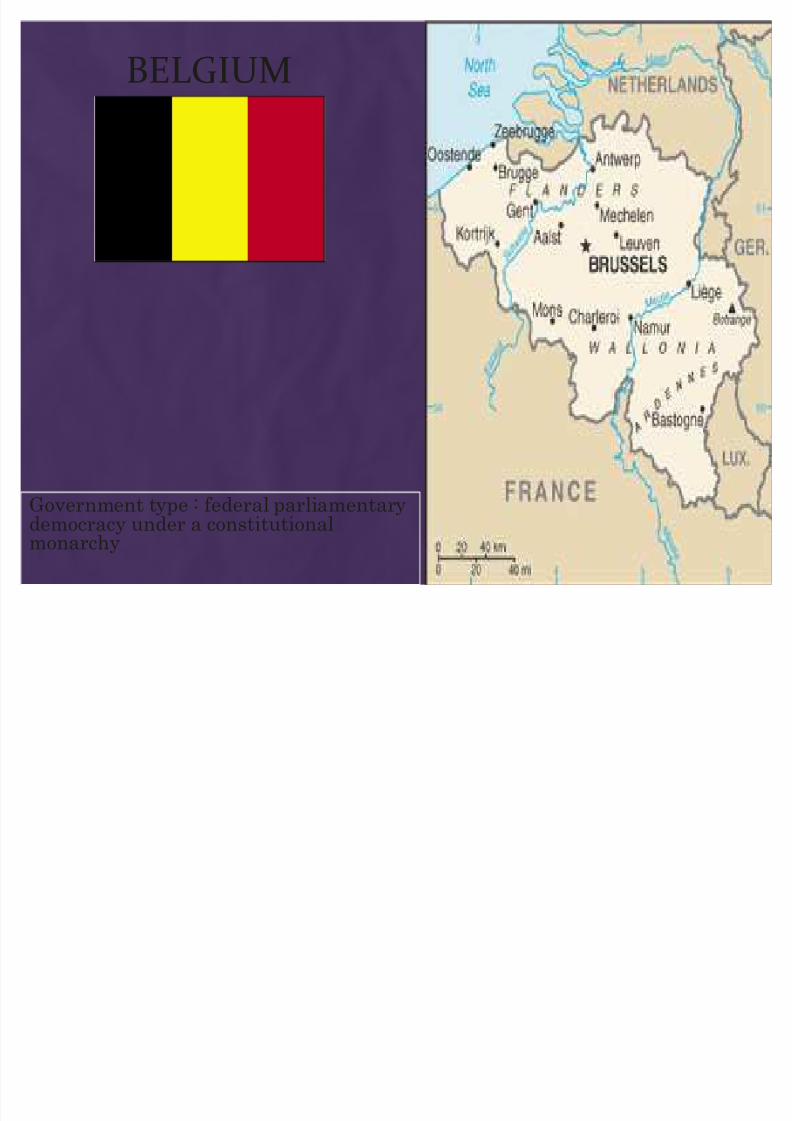
BELGIUM
Government type : federal parliamentarydemocracy under a constitutionalmonarchy

8/6/2019 Economy of the European Countries- Latest
http://slidepdf.com/reader/full/economy-of-the-european-countries-latest 9/49
GDP (purchasing power parity):
$396.9 billion (2010 est.)
country comparison to the world: 31
note: data are in 2010 US dollars
GDP (official exchange rate):
$461.3 billion (2010 est.)
GDP - real growth rate:
2.1% (2010 est.)
country comparison to the world: 148
GDP - per capita (PPP):
$37,900 (2010 est.)
country comparison to the world: 25
note: data are in 2010 US dollars
GDP - composition by sector:
agriculture: 0.7%
industry: 22.1%
services: 77.2% (2010 est.)
Unemployment rate:
8.5% (2010 est.)
country comparison to the world: 99
Population below poverty line:
15.2% (2007 est.)

8/6/2019 Economy of the European Countries- Latest
http://slidepdf.com/reader/full/economy-of-the-european-countries-latest 10/49
Inflation rate (consumer prices):
2.3% (2010 est.)
Industrial production growth rate:
4% (2010 est.)
country comparison to the world: 89
Electricity - production:
82.17 billion kWh (2007 est.)
country comparison to the world: 36
Electricity - consumption:
84.88 billion kWh (2007 est.)
country comparison to the world: 34
Electricity - exports:
6.561 billion kWh (2008 est.)
Electricity - imports:
17.16 billion kWh (2008 est.)
Oil - production:
11,220 bbl/day (2009 est.)
country comparison to the world: 82
Oil - consumption:
608,200 bbl/day (2009 est.)
country comparison to the world: 27
Oil - exports:
433,700 bbl/day (2008 est.)
country comparison to the world: 31
Oil - imports:
1.12 million bbl/day (2008 est.)
country comparison to the world: 16
Oil - proved reserves:
0 bbl (1 January 2010 est.)
country comparison to the world: 106

8/6/2019 Economy of the European Countries- Latest
http://slidepdf.com/reader/full/economy-of-the-european-countries-latest 11/49
Natural gas - production:
0 cu m (2008 est.)
country comparison to the world: 149
Natural gas - consumption:
16.87 billion cu m (2009 est.)
country comparison to the world: 39
Natural gas - exports:
0 cu m (2008 est.)
country comparison to the world: 58
Natural gas - imports:
16.78 billion cu m (2009 est.)
country comparison to the world: 14
Natural gas - proved reserves:
0 cu m (1 January 2010 est.)
country comparison to the world: 150
Current account balance:
-$1.129 billion (2010 est.)
country comparison to the world: 139
8/6/2019 Economy of the European Countries- Latest
http://slidepdf.com/reader/full/economy-of-the-european-countries-latest 12/49
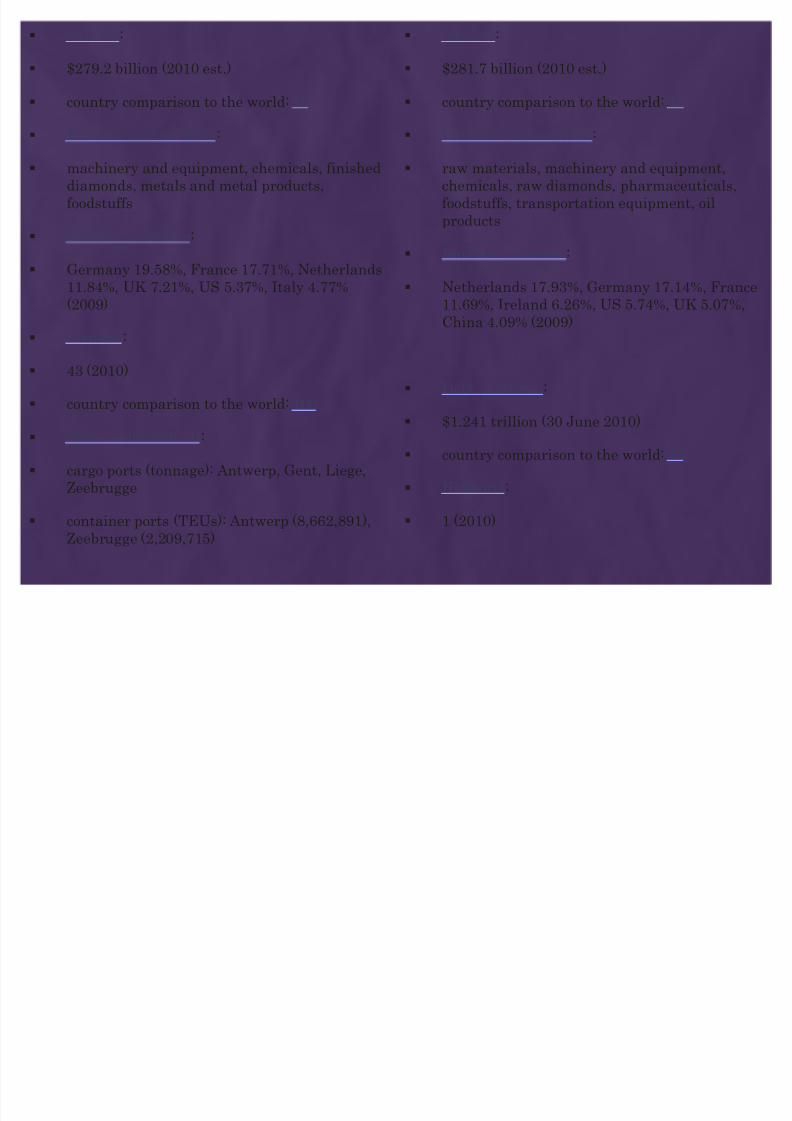
Exports:
$279.2 billion (2010 est.)
country comparison to the world: 16
Exports - commodities:
machinery and equipment, chemicals, finisheddiamonds, metals and metal products,foodstuffs
Exports - partners:
Germany 19.58%, France 17.71%, Netherlands11.84%, UK 7.21%, US 5.37%, Italy 4.77%(2009)
Airports:
43 (2010)
country comparison to the world: 100
Ports and terminals:
cargo ports (tonnage): Antwerp, Gent, Liege,Zeebrugge
container ports (TEUs): Antwerp (8,662,891),Zeebrugge (2,209,715)
Imports:
$281.7 billion (2010 est.)
country comparison to the world: 17
Imports - commodities:
raw materials, machinery and equipment,chemicals, raw diamonds, pharmaceuticals,foodstuffs, transportation equipment, oilproducts
Imports - partners:
Netherlands 17.93%, Germany 17.14%, France11.69%, Ireland 6.26%, US 5.74%, UK 5.07%,China 4.09% (2009)
Debt - external:
$1.241 trillion (30 June 2010)
country comparison to the world: 12
Heliports:
1 (2010)

8/6/2019 Economy of the European Countries- Latest
http://slidepdf.com/reader/full/economy-of-the-european-countries-latest 13/49
CZECH REPUBLIC
Government type : parliamentarydemocracy

8/6/2019 Economy of the European Countries- Latest
http://slidepdf.com/reader/full/economy-of-the-european-countries-latest 14/49

8/6/2019 Economy of the European Countries- Latest
http://slidepdf.com/reader/full/economy-of-the-european-countries-latest 15/49
Inflation rate (consumer prices):
1.5% (2010 est.)
Industrial production growth rate:
15.9% (2010 est.)
country comparison to the world: 7
Electricity - production:
82.25 billion kWh (2009 est.)
country comparison to the world: 35
Electricity - consumption:
53.42 billion kWh (2009 est.)
country comparison to the world: 44
Electricity - exports:
22.23 billion kWh (2009 est.)
Electricity - imports:
8.58 billion kWh (2009 est.)
Oil - production:
10,970 bbl/day (2009 est.)
country comparison to the world: 83
Oil - consumption:
207,600 bbl/day (2009 est.)
country comparison to the world: 54
Oil - exports:
29,670 bbl/day (2008 est.)
country comparison to the world: 85
Oil - imports:
219,900 bbl/day (2008 est.)
country comparison to the world: 42
Oil - proved reserves:
15 million bbl (1 January 2010 est.)
country comparison to the world: 84

8/6/2019 Economy of the European Countries- Latest
http://slidepdf.com/reader/full/economy-of-the-european-countries-latest 16/49
Natural gas - production:
178 million cu m (2009 est.)
country comparison to the world: 75
Natural gas - consumption:
8.164 billion cu m (2009 est.)
country comparison to the world: 51
Natural gas - exports:
1.111 billion cu m (2009 est.)
country comparison to the world: 35
Natural gas - imports:
9.683 billion cu m (2009 est.)
country comparison to the world: 21
Natural gas - proved reserves:
3.072 billion cu m (1 January 2010 est.)
country comparison to the world: 92
Current account balance:
-$5.956 billion (2010 est.)
country comparison to the world: 172

8/6/2019 Economy of the European Countries- Latest
http://slidepdf.com/reader/full/economy-of-the-european-countries-latest 17/49
Exports:
$116.5 billion (2010 est.)
country comparison to the world: 33
Exports - commodities:
machinery and transport equipment, rawmaterials and fuel, chemicals
Exports - partners:
Germany 31.7%, Slovakia 8.7%, Poland 6.2%,France 5.5%, UK 4.9%, Austria 4.7%, Italy 4.5%(2010 est.)
Airports:
122 (2010)
country comparison to the world: 50
Heliports:
1 (2010)
Ports and terminals:
Decin, Prague, Usti nad Labem
Imports:
$109.2 billion (2010 est.)
country comparison to the world: 31
Imports - commodities:
machinery and transport equipment, rawmaterials and fuels, chemicals
Imports - partners:
Germany 25.6%, China 11.9%, Poland 6.5%,Russia 5.4%, Slovakia 5.2% (2010 est.)
Debt - external:
$86.79 billion (31 December 2010 est.)
country comparison to the world: 40

8/6/2019 Economy of the European Countries- Latest
http://slidepdf.com/reader/full/economy-of-the-european-countries-latest 18/49
DENMARK
Government type : constitutionalmonarchy

8/6/2019 Economy of the European Countries- Latest
http://slidepdf.com/reader/full/economy-of-the-european-countries-latest 19/49
GDP (purchasing power parity):
$201.4 billion (2010 est.)
country comparison to the world: 52
note: data are in 2010 US dollars
GDP (official exchange rate):
$311.9 billion (2010 est.)
GDP - real growth rate:
1% (2010 est.)
country comparison to the world: 180
GDP - per capita (PPP):
$36,700 (2010 est.)
country comparison to the world: 28
note: data are in 2010 US dollars
GDP - composition by sector:
agriculture: 1.1%
industry: 22.8%
services: 76.1% (2010 est.)
Unemployment rate:
4.2% (2010 est.)
country comparison to the world: 38
Population below poverty line:
12.1% (2007)
8/6/2019 Economy of the European Countries- Latest
http://slidepdf.com/reader/full/economy-of-the-european-countries-latest 20/49
Inflation rate (consumer prices):
2.6% (2010 est.)
country comparison to the world: 68
I
ndustrial production growth rate:
4% (2010 est.)
country comparison to the world: 82
Electricity - production:
36.4 billion kWh (2008 est.)
country comparison to the world: 58
Electricity - consumption:
34.3 billion kWh (2008 est.)
country comparison to the world: 56
Electricity - exports:
11.36 billion kWh (2008)
Electricity - imports:
12.82 billion kWh (2008)
Oil - production:
262,100 bbl/day (2009 est.)
country comparison to the world: 40
Oil - consumption:
166,500 bbl/day (2009 est.)
country comparison to the world: 61
Oil - exports:
268,500 bbl/day (2008 est.)
country comparison to the world: 46
Oil - imports:
173,100 bbl/day (2008 est.)
country comparison to the world: 50
Oil - proved reserves:
1.06 billion bbl (1 January 2010 est.)
country comparison to the world: 42

8/6/2019 Economy of the European Countries- Latest
http://slidepdf.com/reader/full/economy-of-the-european-countries-latest 21/49
Natural gas - production:
8.398 billion cu m (2009)
country comparison to the world: 44
N
atural gas - consumption:
4.41 billion cu m (2009)
country comparison to the world: 61
Natural gas - exports:
3.98 billion cu m (2009)
country comparison to the world: 29
Natural gas - imports:
0 cu m (2008)
country comparison to the world: 178
Natural gas - proved reserves:
61.3 billion cu m (1 January 2010 est.)
country comparison to the world: 62
Current account balance:
$14.35 billion (2010 est.)
country comparison to the world: 21

8/6/2019 Economy of the European Countries- Latest
http://slidepdf.com/reader/full/economy-of-the-european-countries-latest 22/49
Exports:
$99.37 billion (2010 est.)
country comparison to the world: 35
Exports - commodities:
machinery and instruments, meat and meatproducts, dairy products, fish, pharmaceuticals,furniture, windmills
Exports - partners:
Germany 17.53%, Sweden 12.68%, UK 8.49%,US 6.05%, Norway 6.01%, Netherlands 4.84%,France 4.57% (2009)
Airports:
92 (2010)
country comparison to the world: 65
Ports and terminals:
Aalborg, Aarhus, Copenhagen, Ensted, Esbjerg,Fredericia, Kalundborg
Imports:
$90.83 billion (2010 est.)
country comparison to the world: 33
I
mports - commodities:
machinery and equipment, raw materials andsemimanufactures for industry, chemicals,grain and foodstuffs, consumer goods
Imports - partners:
Germany 21.07%, Sweden 13.18%, Norway 7%,Netherlands 6.97%, China 6.22%, UK 5.53%(2009)
Debt - external:
$559.5 billion (30 June 2010)
country comparison to the world: 19
8/6/2019 Economy of the European Countries- Latest
http://slidepdf.com/reader/full/economy-of-the-european-countries-latest 23/49
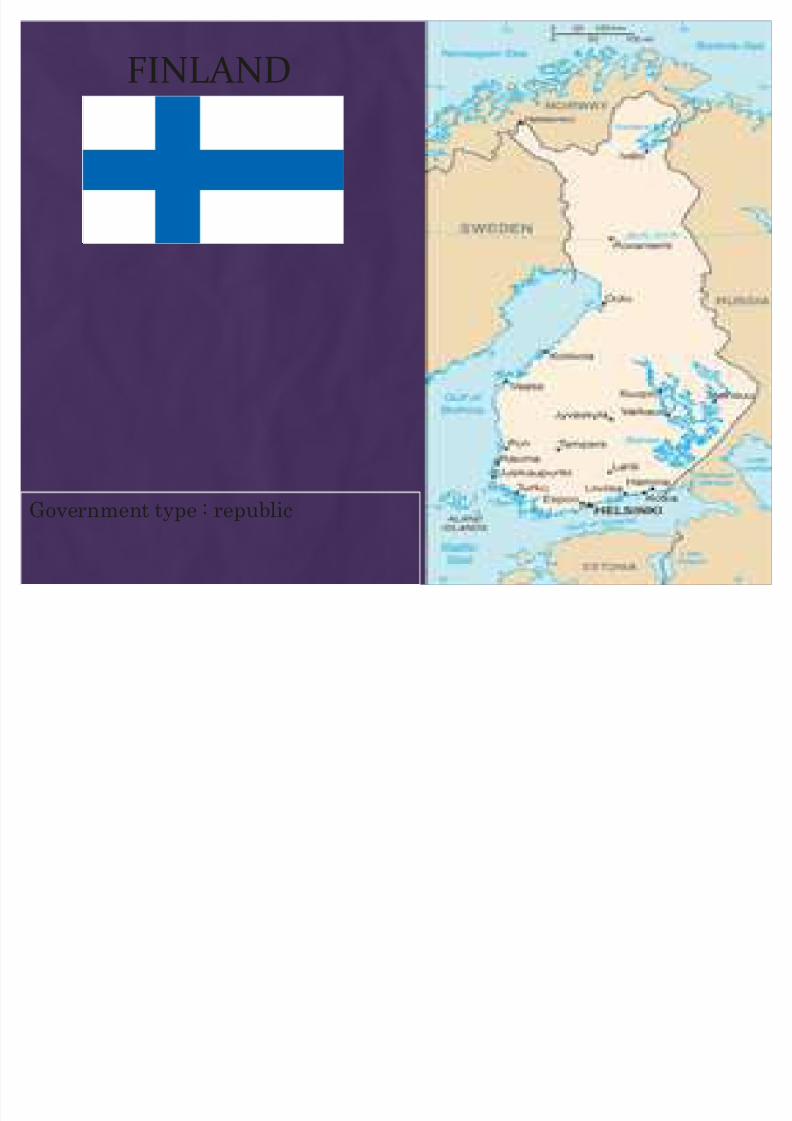
FINLAND
Government type : republic

8/6/2019 Economy of the European Countries- Latest
http://slidepdf.com/reader/full/economy-of-the-european-countries-latest 24/49
GDP (purchasing power parity):
$187.6 billion (2010 est.)
country comparison to the world: 56
note: data are in 2010 US dollars GDP (official exchange rate):
$238 billion (2010 est.)
GDP - real growth rate:
3.2% (2010 est.)
country comparison to the world: 116
GDP - per capita (PPP):
$35,300 (2010 est.)
country comparison to the world: 35
note: data are in 2010 US dollars GDP - composition by sector:
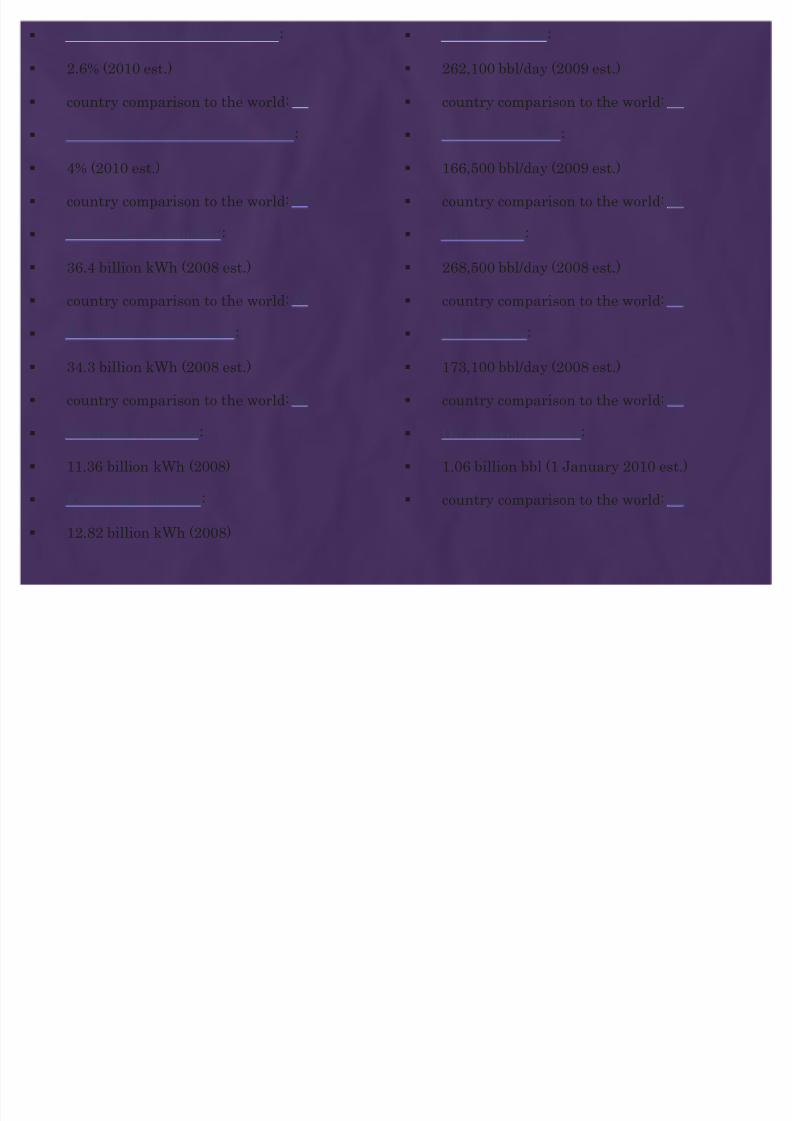
agriculture: 2.6%
industry: 29.1%
services: 68.2% (2010 est.)
Unemployment rate:
8.4% (2010 est.)
country comparison to the world: 98
Population below poverty line:
N A%
8/6/2019 Economy of the European Countries- Latest
http://slidepdf.com/reader/full/economy-of-the-european-countries-latest 25/49
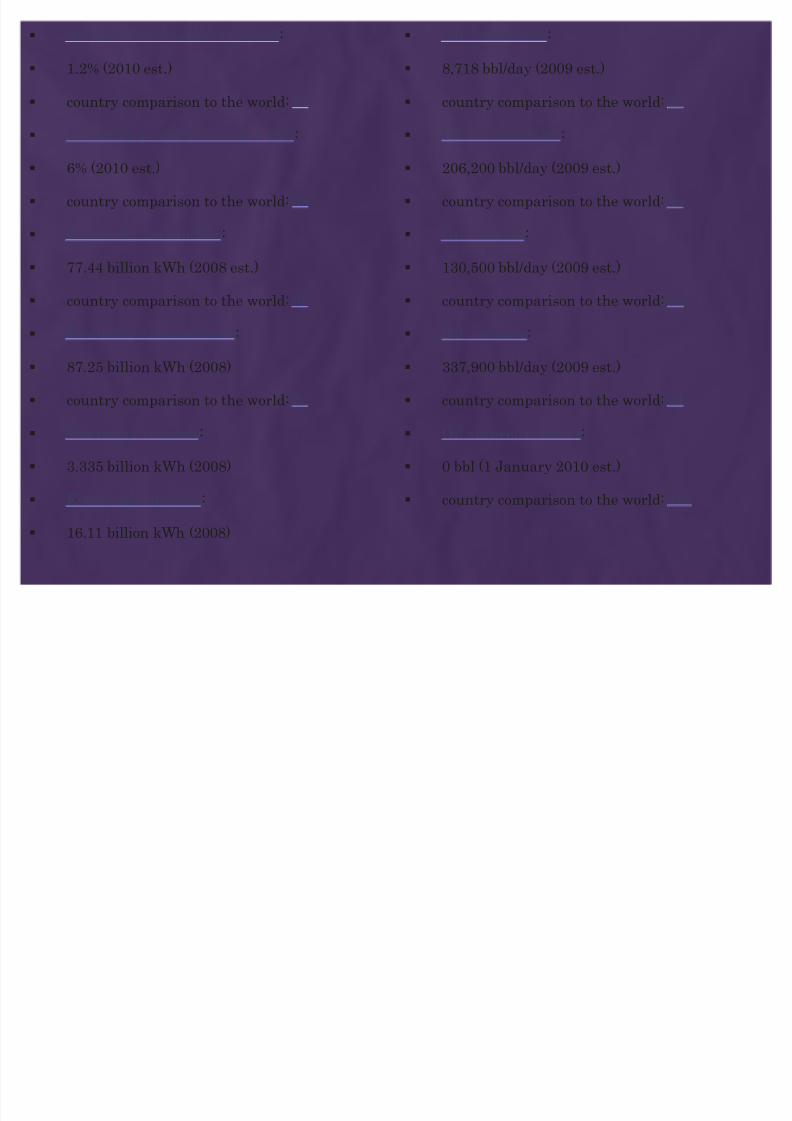
Inflation rate (consumer prices):
1.2% (2010 est.)
country comparison to the world: 27
I
ndustrial production growth rate: 6% (2010 est.)
country comparison to the world: 59
Electricity - production:
77.44 billion kWh (2008 est.)
country comparison to the world: 38
Electricity - consumption:
87.25 billion kWh (2008)
country comparison to the world: 32
Electricity - exports:
3.335 billion kWh (2008)
Electricity - imports:
16.11 billion kWh (2008)
Oil - production:
8,718 bbl/day (2009 est.)
country comparison to the world: 87
Oil - consumption: 206,200 bbl/day (2009 est.)
country comparison to the world: 55
Oil - exports:
130,500 bbl/day (2009 est.)
country comparison to the world: 62
Oil - imports:
337,900 bbl/day (2009 est.)
country comparison to the world: 31
Oil - proved reserves:
0 bbl (1 January 2010 est.)
country comparison to the world: 128

8/6/2019 Economy of the European Countries- Latest
http://slidepdf.com/reader/full/economy-of-the-european-countries-latest 26/49
Natural gas - production:
N A
Natural gas - consumption:
4.289 billion cu m (2009) country comparison to the world: 63
Natural gas - exports:
0 cu m (2008 est.)
country comparison to the world: 93
Natural gas - imports:
4.289 billion cu m (2009)
country comparison to the world: 34
Natural gas - proved reserves:
0 cu m (1 January 2010 est.)
country comparison to the world: 177
Current account balance:
$4.696 billion (2010 est.)
country comparison to the world: 33
8/6/2019 Economy of the European Countries- Latest
http://slidepdf.com/reader/full/economy-of-the-european-countries-latest 27/49
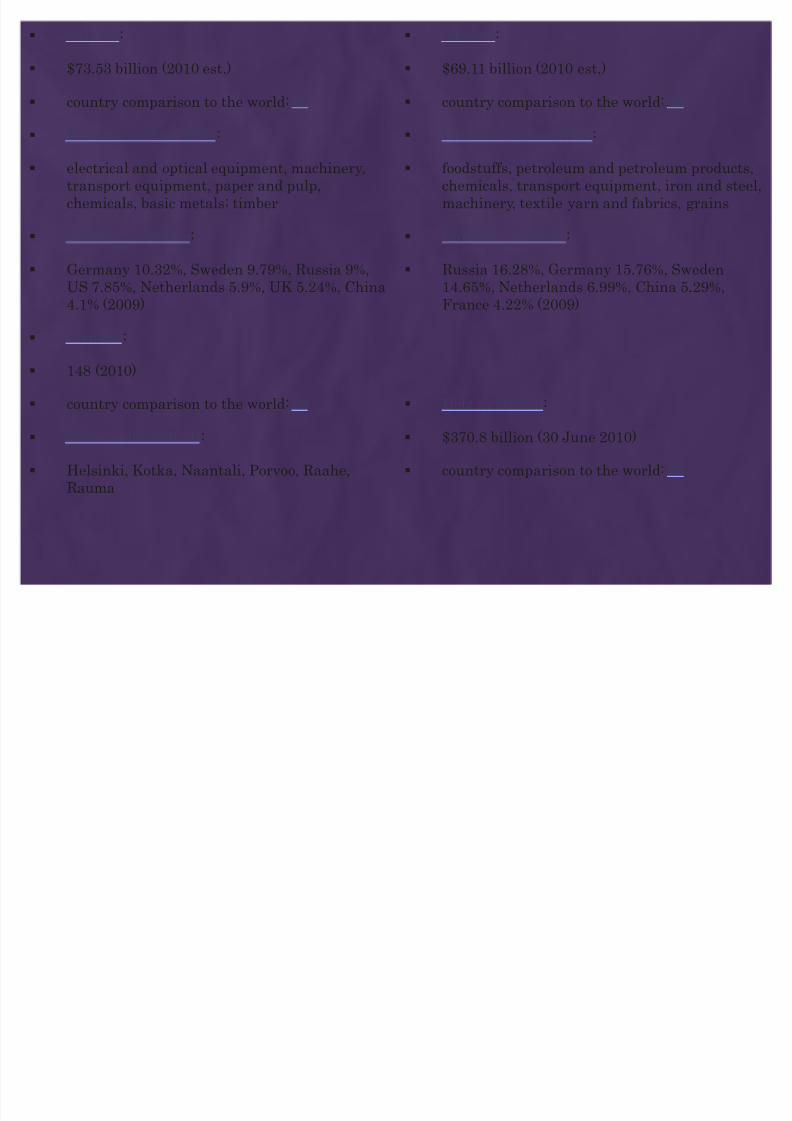
Exports:
$73.53 billion (2010 est.)
country comparison to the world: 40
Exports - commodities: electrical and optical equipment, machinery,
transport equipment, paper and pulp,chemicals, basic metals; timber
Exports - partners:
Germany 10.32%, Sweden 9.79%, Russia 9%,US 7.85%, Netherlands 5.9%, UK 5.24%, China4.1% (2009)
Airports:
148 (2010)
country comparison to the world: 38
Ports and terminals:
Helsinki, Kotka, Naantali, Porvoo, Raahe,Rauma
Imports:
$69.11 billion (2010 est.)
country comparison to the world: 39
I
mports - commodities: foodstuffs, petroleum and petroleum products,
chemicals, transport equipment, iron and steel,machinery, textile yarn and fabrics, grains
Imports - partners:
Russia 16.28%, Germany 15.76%, Sweden14.65%, Netherlands 6.99%, China 5.29%,France 4.22% (2009)
Debt - external:
$370.8 billion (30 June 2010)
country comparison to the world: 24

8/6/2019 Economy of the European Countries- Latest
http://slidepdf.com/reader/full/economy-of-the-european-countries-latest 28/49
GERMANY
Government type : federal republic
8/6/2019 Economy of the European Countries- Latest
http://slidepdf.com/reader/full/economy-of-the-european-countries-latest 29/49
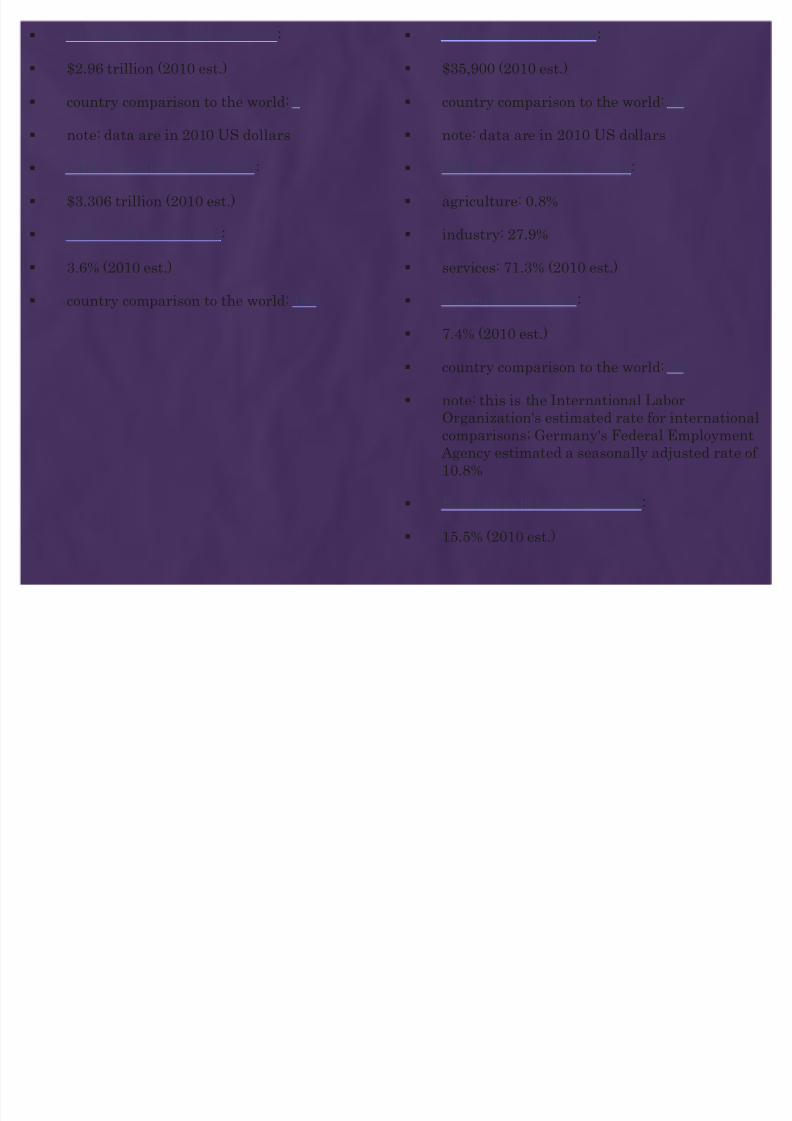
GDP (purchasing power parity):
$2.96 trillion (2010 est.)
country comparison to the world: 6
note: data are in 2010 US dollars GDP (official exchange rate):
$3.306 trillion (2010 est.)
GDP - real growth rate:
3.6% (2010 est.)
country comparison to the world: 102
GDP - per capita (PPP):
$35,900 (2010 est.)
country comparison to the world: 31
note: data are in 2010 US dollars GDP - composition by sector:
agriculture: 0.8%
industry: 27.9%
services: 71.3% (2010 est.)
Unemployment rate:
7.4% (2010 est.)
country comparison to the world: 78
note: this is the International Labor
Organization's estimated rate for internationalcomparisons; Germany's Federal Employment Agency estimated a seasonally adjusted rate of 10.8%
Population below poverty line:
15.5% (2010 est.)

8/6/2019 Economy of the European Countries- Latest
http://slidepdf.com/reader/full/economy-of-the-european-countries-latest 30/49
Inflation rate (consumer prices):
1.1% (2010 est.)
country comparison to the world: 21
I
ndustrial production growth rate: 9% (2010 est.)
country comparison to the world: 24
Electricity - production:
593.4 billion kWh (2007 est.)
country comparison to the world: 8
Electricity - consumption:
547.3 billion kWh (2007 est.)
country comparison to the world: 7
Electricity - exports:
61.7 billion kWh (2008 est.)
Electricity - imports:
41.67 billion kWh (2008 est.
Oil - production:
156,800 bbl/day (2009 est.)
country comparison to the world: 45
Oil - consumption: 2.437 million bbl/day (2009 est.)
country comparison to the world: 8
Oil - exports:
536,600 bbl/day (2008 est.)
country comparison to the world: 28
Oil - imports:
2.862 million bbl/day (2008 est.)
country comparison to the world: 7
Oil - proved reserves:
276 million bbl (1 January 2010 est.)
country comparison to the world: 54

8/6/2019 Economy of the European Countries- Latest
http://slidepdf.com/reader/full/economy-of-the-european-countries-latest 31/49
Natural gas - production:
15.29 billion cu m (2009 est.)
country comparison to the world: 34
Natural gas - consumption:
96.26 billion cu m (2009 est.)
country comparison to the world: 5
Natural gas - exports:
12.64 billion cu m (2009 est.)
country comparison to the world: 16
Natural gas - imports:
94.57 billion cu m (2009 est.)
country comparison to the world: 2
Natural gas - proved reserves:
175.6 billion cu m (1 January 2010 est.)
country comparison to the world: 47
Current account balance:
$162.3 billion (2010 est.)
country comparison to the world: 3

8/6/2019 Economy of the European Countries- Latest
http://slidepdf.com/reader/full/economy-of-the-european-countries-latest 32/49
Exports:
$1.337 trillion (2010 est.)
country comparison to the world: 3
Exports - commodities:
machinery, vehicles, chemicals, metals andmanufactures, foodstuffs, textiles
Exports - partners:
France 10.2%, US 6.7%, Netherlands 6.7%, UK 6.6%, Italy 6.3%, Austria 6%, China 4.5%,
Switzerland 4.4% (2009 est.)
Airports:
549 (2010)
country comparison to the world: 13
Heliports:
25 (2010)
Ports and terminals:
Bremen, Bremerhaven, Duisburg, Hamburg,Karlsruhe, Lubeck, Neuss-Dusseldorf, Rostock,
Wilhemshaven
Imports:
$1.12 trillion (2010 est.)
country comparison to the world: 4
Imports - commodities:
machinery, vehicles, chemicals, foodstuffs,textiles, metals
Imports - partners:
Netherlands 8.5%, China 8.2%, France 8.2%,US 5.9%, Italy 5.9%, UK 4.9%, Belgium 4.3%,
Austria 4.3%, Switzerland 4.2% (2009 est.)
Debt - external:
$4.713 trillion (30 June 2010)
country comparison to the world: 4

8/6/2019 Economy of the European Countries- Latest
http://slidepdf.com/reader/full/economy-of-the-european-countries-latest 33/49
ITALY
Government type : republic
8/6/2019 Economy of the European Countries- Latest
http://slidepdf.com/reader/full/economy-of-the-european-countries-latest 34/49
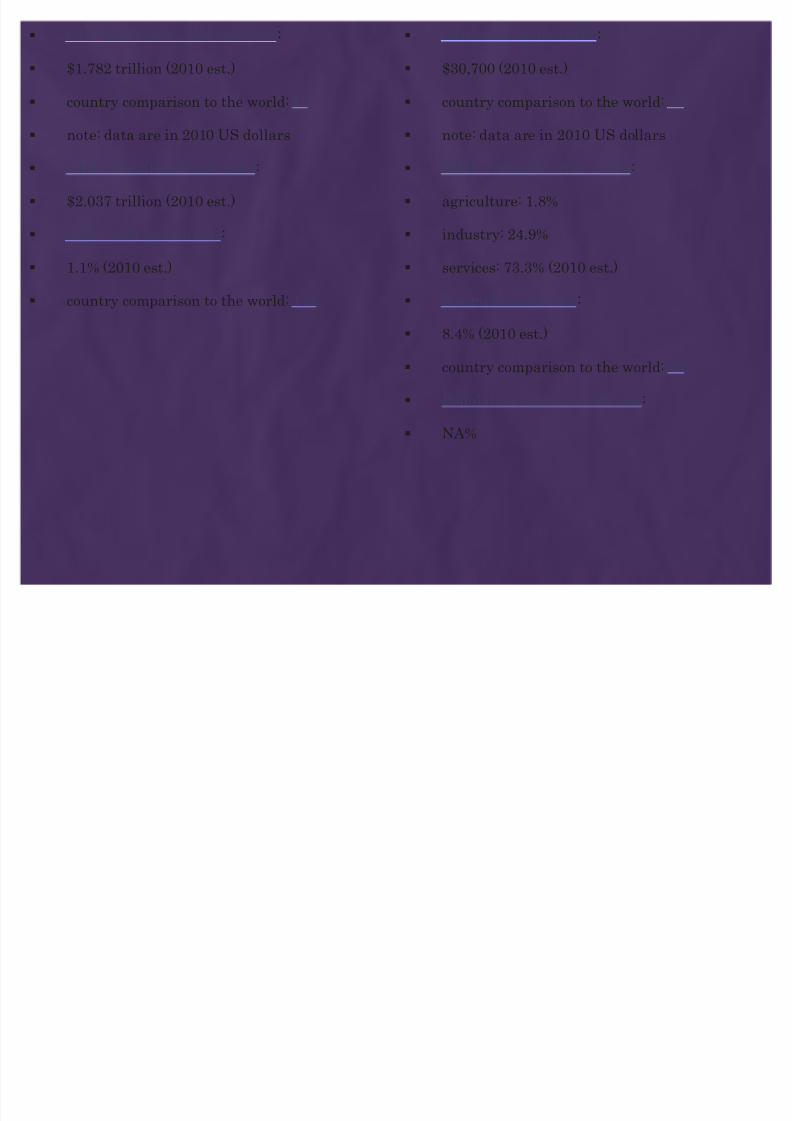
GDP (purchasing power parity):
$1.782 trillion (2010 est.)
country comparison to the world: 11
note: data are in 2010 US dollars
GDP (official exchange rate):
$2.037 trillion (2010 est.)
GDP - real growth rate:
1.1% (2010 est.)
country comparison to the world: 174
GDP - per capita (PPP):
$30,700 (2010 est.)
country comparison to the world: 43
note: data are in 2010 US dollars
GDP - composition by sector:
agriculture: 1.8%
industry: 24.9%
services: 73.3% (2010 est.)
Unemployment rate:
8.4% (2010 est.)
country comparison to the world: 96
Population below poverty line:
N A%

8/6/2019 Economy of the European Countries- Latest
http://slidepdf.com/reader/full/economy-of-the-european-countries-latest 35/49
Inflation rate (consumer prices):
1.4% (2010 est.)
country comparison to the world: 32
Industrial production growth rate:
0.5% (2010 est.)
country comparison to the world: 150
Electricity - production:
289.7 billion kWh (2007 est.)
country comparison to the world: 14
Electricity - consumption:
315 billion kWh (2007 est.)
country comparison to the world: 13
Electricity - exports:
3.431 billion kWh (2008 est.)
Electricity - imports:
43 billion kWh (2008 est.)
Oil - production:
146,500 bbl/day (2009 est.)
country comparison to the world: 47
Oil - consumption:
1.537 million bbl/day (2009 est.)
country comparison to the world: 16
Oil - exports:
586,900 bbl/day (2008 est.)
country comparison to the world: 26
Oil - imports:
1.911 million bbl/day (2008 est.)
country comparison to the world: 10
Oil - proved reserves:
423.7 million bbl (1 January 2010 est.)
country comparison to the world: 52

8/6/2019 Economy of the European Countries- Latest
http://slidepdf.com/reader/full/economy-of-the-european-countries-latest 36/49

8/6/2019 Economy of the European Countries- Latest
http://slidepdf.com/reader/full/economy-of-the-european-countries-latest 37/49
Exports:
$458.4 billion (2010 est.)
country comparison to the world: 8
Exports - commodities:
engineering products, textiles and clothing,production machinery, motor vehicles,transport equipment, chemicals; food,beverages and tobacco; minerals, andnonferrous metals
Exports - partners:
Germany 12.6%, France 11.57%, US 5.92%,Spain 5.69%, UK 5.13%, Switzerland 4.69%(2009)
Airports:
132 (2010)
country comparison to the world: 44
Ports and terminals:
Augusta, Cagliari, Genoa, Livorno, SantaPanagia (Melilli), Taranto, Trieste, Venice
Imports:
$459.7 billion (2010 est.)
country comparison to the world: 8
Imports - commodities:
engineering products, chemicals, transportequipment, energy products, minerals andnonferrous metals, textiles and clothing; food,beverages, and tobacco
Imports - partners:
Germany 16.68%, France 8.82%, China 6.53%,Netherlands 5.63%, Spain 4.3%, Russia 4.12%,Belgium 4.08% (2009)
Debt - external:
$2.223 trillion (30 June 2010 est.)
country comparison to the world: 9
Heliports:
6 (2010)
8/6/2019 Economy of the European Countries- Latest
http://slidepdf.com/reader/full/economy-of-the-european-countries-latest 38/49
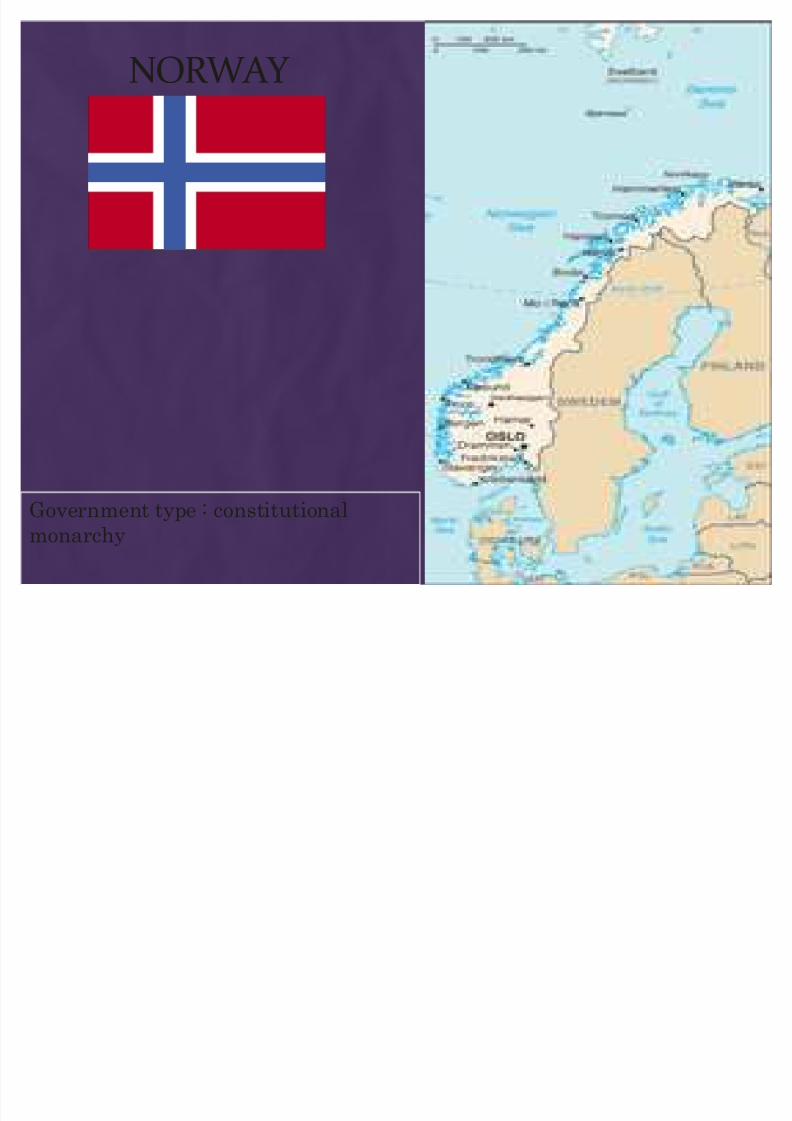
NORWAY
Government type : constitutionalmonarchy

8/6/2019 Economy of the European Countries- Latest
http://slidepdf.com/reader/full/economy-of-the-european-countries-latest 39/49
GDP (purchasing power parity):
$276.4 billion (2010 est.)
country comparison to the world: 44
note: data are in 2010 US dollars
GDP (official exchange rate):
$413.5 billion (2010 est.)
GDP - real growth rate:
1.5% (2010 est.)
country comparison to the world: 169
GDP - per capita (PPP):
$59,100 (2010 est.)
country comparison to the world: 5
note: data are in 2010 US dollars
GDP - composition by sector:
agriculture: 2.1%
industry: 40.1%
services: 57.8% (2010 est.)
Unemployment rate:
3.6% (2010 est.)
country comparison to the world: 31
Population below poverty line:
N A%
( )

8/6/2019 Economy of the European Countries- Latest
http://slidepdf.com/reader/full/economy-of-the-european-countries-latest 40/49
Inflation rate (consumer prices):
2.4% (2010 est.)
country comparison to the world: 63
Industrial production growth rate:
0.3% (2010 est.)
country comparison to the world: 152
Electricity - production:
142.7 billion kWh (2008 est.)
country comparison to the world: 26
Electricity - consumption:
128.8 billion kWh (2008 est.)
country comparison to the world: 26
Electricity - exports:
17.29 billion kWh (2008 est.)
Electricity - imports:
3.414 billion kWh (2008 est.)
Oil - production:
2.35 million bbl/day (2009 est.)
country comparison to the world: 14
Oil - consumption:
204,100 bbl/day (2009 est.)
country comparison to the world: 56
Oil - exports:
2.15 million bbl/day (2009 est.)
country comparison to the world: 9
Oil - imports:
107,500 bbl/day (2008 est.)
country comparison to the world: 62
Oil - proved reserves:
6.68 billion bbl (1 January 2010 est.)
country comparison to the world: 21

8/6/2019 Economy of the European Countries- Latest
http://slidepdf.com/reader/full/economy-of-the-european-countries-latest 41/49
Natural gas - production:
103.5 billion cu m (2009 est.)
country comparison to the world: 6
Natural gas - consumption:
4.62 billion cu m (2009 est.)
country comparison to the world: 60
Natural gas - exports:
98.85 billion cu m (2009 est.)
country comparison to the world: 2
Natural gas - imports:
0 cu m (2008 est.)
country comparison to the world: 105
Natural gas - proved reserves:
2.313 trillion cu m (1 January 2010 est.)
country comparison to the world: 17
Current account balance:
$60.23 billion (2010 est.)
country comparison to the world: 5
I

8/6/2019 Economy of the European Countries- Latest
http://slidepdf.com/reader/full/economy-of-the-european-countries-latest 42/49
Exports:
$137 billion (2010 est.)
country comparison to the world: 31
Exports - commodities:
petroleum and petroleum products, machineryand equipment, metals, chemicals, ships, fish
Exports - partners:
UK 24.28%, Germany 13.4%, Netherlands10.87%, France 8.55%, Sweden 5.76%, US
4.82% (2009)
Airports:
98 (2010)
country comparison to the world: 61
Heliports:
1 (2010)
Ports and terminals:
Bergen, Haugesund, Maaloy, Mongstad,Narvik, Sture
Imports:
$74.02 billion (2010 est.)
country comparison to the world: 37
Imports - commodities:
machinery and equipment, chemicals, metals,foodstuffs
Imports - partners:
Sweden 13.86%, Germany 12.89%, China 7.8%,Denmark 6.78%, US 6.16%, UK 6.01% (2009)
Debt - external:
$2.232 trillion (30 June 2010)
country comparison to the world: 8

8/6/2019 Economy of the European Countries- Latest
http://slidepdf.com/reader/full/economy-of-the-european-countries-latest 43/49
SPAIN
Government type : parliamentarymonarchy
GDP ( h i it ): GDP it (PPP):

8/6/2019 Economy of the European Countries- Latest
http://slidepdf.com/reader/full/economy-of-the-european-countries-latest 44/49
GDP (purchasing power parity):
$1.376 trillion (2010 est.)
country comparison to the world: 14
note: data are in 2010 US dollars
GDP (official exchange rate):
$1.375 trillion (2010 est.)
GDP - real growth rate:
-0.2% (2010 est.)
country comparison to the world: 192
GDP - per capita (PPP):
$29,500 (2010 est.)
country comparison to the world: 47
note: data are in 2010 US dollars
GDP - composition by sector:
agriculture: 2.9%
industry: 25.5%
services: 71.6% (2010 est.)
Unemployment rate:
20% (2010 est.)
country comparison to the world: 166
Population below poverty line:
19.8% (2005)
I fl ti t ( i ): Oil d ti :

8/6/2019 Economy of the European Countries- Latest
http://slidepdf.com/reader/full/economy-of-the-european-countries-latest 45/49
Inflation rate (consumer prices):
1.3% (2010 est.)
country comparison to the world: 29
Industrial production growth rate:
-2% (2010 est.)
country comparison to the world: 161
Electricity - production:
300.5 billion kWh (2008 est.)
country comparison to the world: 13
Electricity - consumption:
276.1 billion kWh (2008 est.)
country comparison to the world: 14
Electricity - exports:
16.92 billion kWh (2008 est.)
Electricity - imports:
5.88 billion kWh (2008 est.)
Oil - production:
27,230 bbl/day (2009 est.)
country comparison to the world: 71
Oil - consumption:
1.482 million bbl/day (2009 est.)
country comparison to the world: 17
Oil - exports:
218,600 bbl/day (2008 est.)
country comparison to the world: 53
Oil - imports:
1.716 million bbl/day (2008 est.)
country comparison to the world: 11
Oil - proved reserves:
150 million bbl (1 January 2010 est.)
country comparison to the world: 65
N t l d ti : C t t b l :
8/6/2019 Economy of the European Countries- Latest
http://slidepdf.com/reader/full/economy-of-the-european-countries-latest 46/49
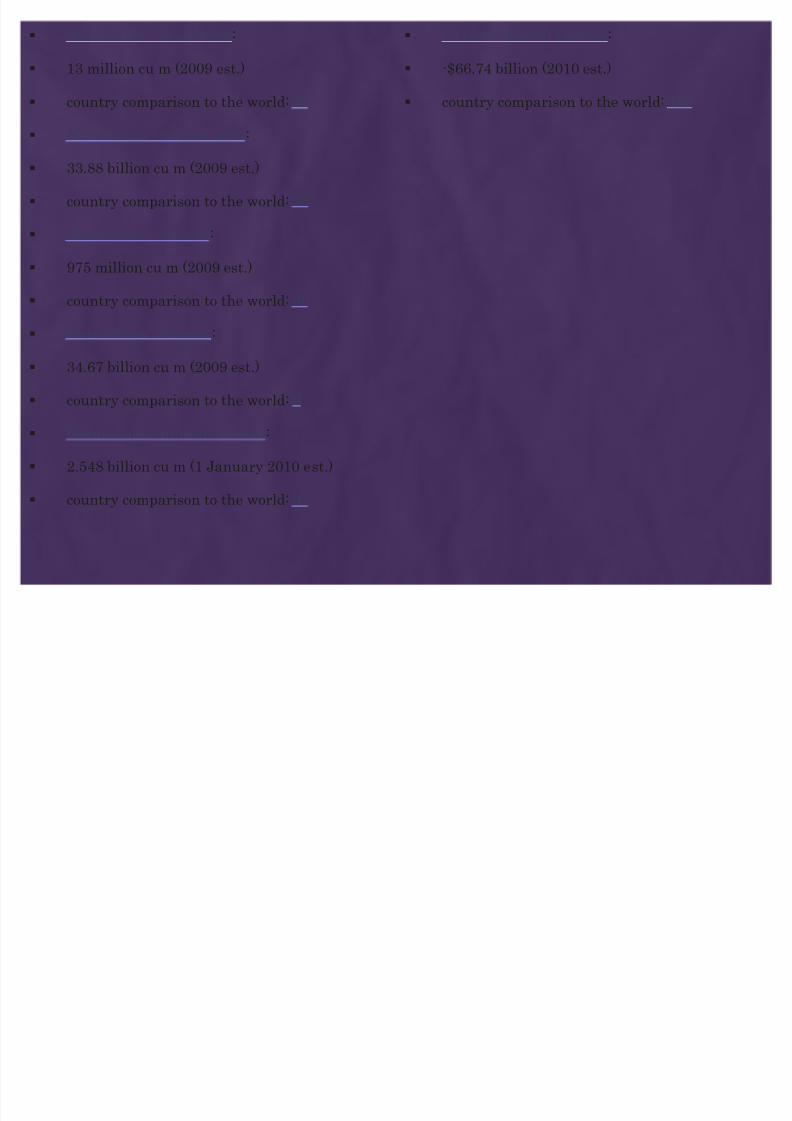
Natural gas - production:
13 million cu m (2009 est.)
country comparison to the world: 89
Natural gas - consumption:
33.88 billion cu m (2009 est.)
country comparison to the world: 26
Natural gas - exports:
975 million cu m (2009 est.)
country comparison to the world: 36
Natural gas - imports:
34.67 billion cu m (2009 est.)
country comparison to the world: 9
Natural gas - proved reserves:
2.548 billion cu m (1 January 2010 est.)
country comparison to the world: 95
Current account balance:
-$66.74 billion (2010 est.)
country comparison to the world: 190
E ports: Imports:

8/6/2019 Economy of the European Countries- Latest
http://slidepdf.com/reader/full/economy-of-the-european-countries-latest 47/49
Exports:
$268.3 billion (2010 est.)
country comparison to the world: 18
Exports - commodities:
machinery, motor vehicles; foodstuffs,pharmaceuticals, medicines, other consumergoods
Exports - partners:
France 19.27%, Germany 11.11%, Portugal
9.21%, Italy 8.24%, UK 6.18% (2009)
Airports:
154 (2010)
country comparison to the world: 35
Ports and terminals:
Algeciras, Barcelona, Bilbao, Cartagena,Huelva, Tarragona, Valencia (Spain); LasPalmas, Santa Cruz de Tenerife (CanaryIslands)
Imports:
$324.6 billion (2010 est.)
country comparison to the world: 14
Imports - commodities:
machinery and equipment, fuels, chemicals,semifinished goods, foodstuffs, consumer goods,measuring and medical control instruments
Imports - partners:
Germany 15.02%, France 12.82%, Italy 7.17%,
China 5.8%, Netherlands 5.22%, UK 4.7%(2009)
Debt - external:
$2.166 trillion (30 June 2010)
country comparison to the world: 10
Heliports:
9 (2010)

8/6/2019 Economy of the European Countries- Latest
http://slidepdf.com/reader/full/economy-of-the-european-countries-latest 48/49
MY THOUGHT :
´ Do not expect the circumstances to be always in
your favor« Because this world has not beencreated for you alone«µ

8/6/2019 Economy of the European Countries- Latest
http://slidepdf.com/reader/full/economy-of-the-european-countries-latest 49/49
Prepared by:
Ni j P t l