ECONOMICSNAPSHOT - NYCEDC · ECONOMICSNAPSHOT A Summary of New York City’s Economy APRIL 2016...
4
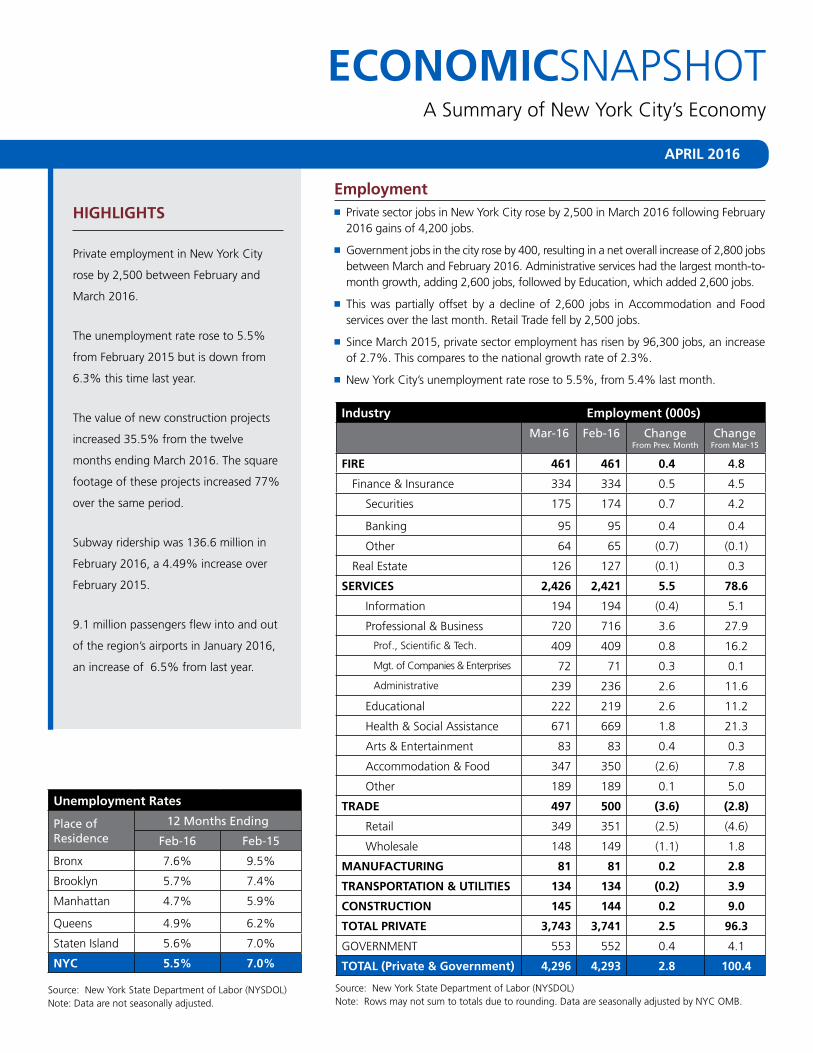
ECONOMICSNAPSHOT A Summary of New York City’s Economy APRIL 2016 Employment ■ Private sector jobs in New York City rose by 2,500 in March 2016 following February 2016 gains of 4,200 jobs. ■ Government jobs in the city rose by 400, resulting in a net overall increase of 2,800 jobs between March and February 2016. Administrative services had the largest month-to- month growth, adding 2,600 jobs, followed by Education, which added 2,600 jobs. ■ This was partially offset by a decline of 2,600 jobs in Accommodation and Food services over the last month. Retail Trade fell by 2,500 jobs. ■ Since March 2015, private sector employment has risen by 96,300 jobs, an increase of 2.7%. This compares to the national growth rate of 2.3%. ■ New York City’s unemployment rate rose to 5.5%, from 5.4% last month. HIGHLIGHTS Private employment in New York City rose by 2,500 between February and March 2016. The unemployment rate rose to 5.5% from February 2015 but is down from 6.3% this time last year. The value of new construction projects increased 35.5% from the twelve months ending March 2016. The square footage of these projects increased 77% over the same period. Subway ridership was 136.6 million in February 2016, a 4.49% increase over February 2015. 9.1 million passengers flew into and out of the region’s airports in January 2016, an increase of 6.5% from last year. Source: New York State Department of Labor (NYSDOL) Note: Data are not seasonally adjusted. Source: New York State Department of Labor (NYSDOL) Note: Rows may not sum to totals due to rounding. Data are seasonally adjusted by NYC OMB. Unemployment Rates Place of Residence 12 Months Ending Feb-16 Feb-15 Bronx 7.6% 9.5% Brooklyn 5.7% 7.4% Manhattan 4.7% 5.9% Queens 4.9% 6.2% Staten Island 5.6% 7.0% NYC 5.5% 7.0% Industry Employment (000s) Mar-16 Feb-16 Change From Prev. Month Change From Mar-15 FIRE 461 461 0.4 4.8 Finance & Insurance 334 334 0.5 4.5 Securities 175 174 0.7 4.2 Banking 95 95 0.4 0.4 Other 64 65 (0.7) (0.1) Real Estate 126 127 (0.1) 0.3 SERVICES 2,426 2,421 5.5 78.6 Information 194 194 (0.4) 5.1 Professional & Business 720 716 3.6 27.9 Prof., Scientific & Tech. 409 409 0.8 16.2 Mgt. of Companies & Enterprises 72 71 0.3 0.1 Administrative 239 236 2.6 11.6 Educational 222 219 2.6 11.2 Health & Social Assistance 671 669 1.8 21.3 Arts & Entertainment 83 83 0.4 0.3 Accommodation & Food 347 350 (2.6) 7.8 Other 189 189 0.1 5.0 TRADE 497 500 (3.6) (2.8) Retail 349 351 (2.5) (4.6) Wholesale 148 149 (1.1) 1.8 MANUFACTURING 81 81 0.2 2.8 TRANSPORTATION & UTILITIES 134 134 (0.2) 3.9 CONSTRUCTION 145 144 0.2 9.0 TOTAL PRIVATE 3,743 3,741 2.5 96.3 GOVERNMENT 553 552 0.4 4.1 TOTAL (Private & Government) 4,296 4,293 2.8 100.4
Transcript of ECONOMICSNAPSHOT - NYCEDC · ECONOMICSNAPSHOT A Summary of New York City’s Economy APRIL 2016...
ECONOMICSNAPSHOTA Summary of New York City’s Economy
APRIL 2016
Employment■ Private sector jobs in New York City rose by 2,500 in March 2016 following February
2016 gains of 4,200 jobs.
■ Government jobs in the city rose by 400, resulting in a net overall increase of 2,800 jobs between March and February 2016. Administrative services had the largest month-to-month growth, adding 2,600 jobs, followed by Education, which added 2,600 jobs.
■ This was partially offset by a decline of 2,600 jobs in Accommodation and Food services over the last month. Retail Trade fell by 2,500 jobs.
■ Since March 2015, private sector employment has risen by 96,300 jobs, an increase of 2.7%. This compares to the national growth rate of 2.3%.
■ New York City’s unemployment rate rose to 5.5%, from 5.4% last month.
HIGHLIGHTS
Private employment in New York City
rose by 2,500 between February and
March 2016.
The unemployment rate rose to 5.5%
from February 2015 but is down from
6.3% this time last year.
The value of new construction projects
increased 35.5% from the twelve
months ending March 2016. The square
footage of these projects increased 77%
over the same period.
Subway ridership was 136.6 million in
February 2016, a 4.49% increase over
February 2015.
9.1 million passengers flew into and out
of the region’s airports in January 2016,
an increase of 6.5% from last year.
Source: New York State Department of Labor (NYSDOL)Note: Data are not seasonally adjusted.
Source: New York State Department of Labor (NYSDOL)Note: Rows may not sum to totals due to rounding. Data are seasonally adjusted by NYC OMB.
Unemployment Rates
Place ofResidence
12 Months Ending
Feb-16 Feb-15
Bronx 7.6% 9.5%
Brooklyn 5.7% 7.4%
Manhattan 4.7% 5.9%
Queens 4.9% 6.2%
Staten Island 5.6% 7.0%
NYC 5.5% 7.0%
Industry Employment (000s)
Mar-16 Feb-16 Change From Prev. Month
Change From Mar-15
FIRE 461 461 0.4 4.8
Finance & Insurance 334 334 0.5 4.5
Securities 175 174 0.7 4.2
Banking 95 95 0.4 0.4
Other 64 65 (0.7) (0.1)
Real Estate 126 127 (0.1) 0.3
SERVICES 2,426 2,421 5.5 78.6
Information 194 194 (0.4) 5.1
Professional & Business 720 716 3.6 27.9
Prof., Scientific & Tech. 409 409 0.8 16.2
Mgt. of Companies & Enterprises 72 71 0.3 0.1
Administrative 239 236 2.6 11.6
Educational 222 219 2.6 11.2
Health & Social Assistance 671 669 1.8 21.3
Arts & Entertainment 83 83 0.4 0.3
Accommodation & Food 347 350 (2.6) 7.8
Other 189 189 0.1 5.0
TRADE 497 500 (3.6) (2.8)
Retail 349 351 (2.5) (4.6)
Wholesale 148 149 (1.1) 1.8
MANUFACTURING 81 81 0.2 2.8
TRANSPORTATION & UTILITIES 134 134 (0.2) 3.9
CONSTRUCTION 145 144 0.2 9.0
TOTAL PRIVATE 3,743 3,741 2.5 96.3
GOVERNMENT 553 552 0.4 4.1
TOTAL (Private & Government) 4,296 4,293 2.8 100.4

BIODIVERSITY IN NYC
1 DeCandido et al. (2004) “A first approximation of the historical and extant vascular flora of New York City: Implications for native plant species conservation.”
2 Department of Environmental Conservation Nature Explorer3 DeCandido et al (2004).
■ Coyotes in Inwood Park, beavers in the East River, and a Painted Bunting in Brooklyn…In our concrete jungle, it can be easy to think that nature exists somewhere else, but the city’s five boroughs are home to an extraordinary number of habitats and species. In honor of Earth Day, our monthly snapshot takes a closer look at New York City’s biodiversity.
■ Staten Island is perhaps the most biodiverse borough with over 1,600 recorded species of plants alone1. The Bronx is home to some of the rarest species in the five boroughs, including five that are federally endangered or threatened, including the Northern Long-Eared Bat, the Piping Plover (a bird), the American Burying Beetle, the Atlantic Sturgeon, and the Shortnose Sturgeon2. Some species have been newly discovered in New York, including a new type of centipede in Central Park and a species of frog in Staten Island.
■ Animals and plants have found interesting ways to adapt to New York’s urban landscape. Peregrine Falcons are known to nest on skyscrapers that remind them of the steep cliffs in their native habitats. A live falcon cam at 55 Water Street allows real-time viewing of Adele, a Peregrine Falcon that is currently nursing four eggs.
■ NYC’s Parks Department is currently analyzing the results from the 2015 tree census. In the 2005 survey the London Planetree was the most common tree in the city, though Honey Locusts were more common in the Bronx and Manhattan, and the Norway Maple is dominant in Queens. In total, more than 592,000 trees were counted, a 19% increase from ten years before. Trees intercept storm water, sequester CO2 and other emissions, and generate savings on electricity and natural gas costs due to their shading and wind blocking properties. The oldest and tallest tree in NYC is the ‘Queens Giant’, a tulip tree in Alley Pond Park that may be much as 400 years old, predating Dutch settlement of the city.
■ Biodiversity provides value to the humans of New York in many ways. The city’s rivers and bays are home to delicious species of fish including skate, eel, monkfish, porgy, bluefish, and striped bass (which can weigh up to 40 pounds). There are more than 230 species of bees that pollinate our flowers, trees, and community gardens. Perhaps New
York’s most financially valuable species is the prehistoric Horseshoe Crab, an ancient arthropod that’s bright blue blood is highly valued by the pharmaceutical industry in manufacturing vaccines. A single quart is worth $15,000!
■ The city’s biodiversity is under threat, however. Invasive species, habitat fragmentation, pollution, and climate change all contribute to species loss. One study in 2004 found that, of the pre-settlement 1,357 native plant species in New York, only 779 remained3. You can help the problem by planting a garden with native plants, participating in a tree count or bird count, and walking or biking to work instead of driving. Happy Earth Day!
Peregrine Falcon
London Plane Tree on Governor’s Island
Horseshoe Crabs

Real Estate and Construction
Manhattan Office Market■ In March 2016, the Manhattan Class A direct vacancy rate rose to 9.8%
from 8.4% one month prior, while the average rental rate held steady
at $80.■ The Midtown South Class A sublease vacancy rate rose from 0.2% in
January to 0.4% in March, while the direct vacancy fell held steady to
2.7%.■ The overall Manhattan sublease vacancy rate rose 0.1% to 1.2% and
the sublease rental rate increased to $55 PSF from $53 one month prior.
ConstructionFor the twelve months ending March 2016:
■ Building projects (including new, additions, and alterations) that started
construction in NYC rose by 24.4% while infrastructure (non-building)
project starts were down 19.6% from the twelve months ending March
2015.
■ The total value of construction projects grew by 35.3%, reaching
over $40 billion for the twelve months ending in March 2016 with a
corresponding growth by 77.0% in square footage. Residential building
project values have grown 53.1% over the same period.
■ Of the 8,193 building projects that began construction, 3,890 were
residential projects, representing a 31.9% increase from the twelve
months ending March 2015. These starts contained 53,020 units, up
94.7% from the preceding twelve months.
Transit, Travel, and Tourism
Transit Ridership■ Total ridership on MTA subways, trains, and buses in
February 2016 was 210.0 million, a 4.92% increase from February 2015.
■ Subway ridership in February 2016 was 136.6 million, up 4.49% from February 2015.
Source: Metropolitan Transportation Authority
Travel and TourismAir Traffic■ In January 2016, 9.1 million passengers flew into and out
of the region’s airports, representing an increase of 6.5% from January 2015.
■ Domestic air carriers account for 64.8% of these flights, with 5.9 million passengers, a 7.1% increase from January 2015 and resulting in over 81 million total passengers in the 12 months ending January 2016.
■ The region’s airports transported a total of 156,364 tons of freight in January 2016, over 65% of which was from international flights.
Source: Port Authority of New York and New Jersey
Broadway Ticket Sales■ Total Broadway attendance was 1,128,843 over the four
weeks ending April 24, 2016 and 967,113 for the prior four weeks. While attendance over this period was down 1.8% from April 2015, February attendance was up 8.6% from February of last year.
■ Broadway revenues in April were rose 2.5% from the same time last year, reaching $115.5 million. February Broadway revenues were $102.5 million, a 7.4% increase from February 2015.
Source: The Broadway League
Note: Gross revenue and attendance figures may not include all shows
Hotel Occupancy■ In January, the average daily hotel room rate was $207
a 2.2% decrease from January 2015.
■ Hotel occupancy was 71.7% in January, up from 70.4% in January 2015.
■ The average daily hotel room rate decreased the most in hotels charging between $245 and $300 per night.
Source: McGraw-Hill
Construction Starts, Twelve Months Ending
IndicatorBuilding Non-Building
Mar-16 Mar-15 Mar-16 Mar-15
Number of projects 7,807 6,277 386 480
Square feet (000s) 85,443 48,277 n.a. n.a.
Value ($000s) 7,420,025 24,697,625 2,914,051 5,105,722
Source: Cushman and WakefieldNote: based on latest available data
Class A Office Vacancy Rates and Average Rents
Vacancy Rate Average Rents/SF
Direct Sublease Direct Sublease
Mar-16 Feb-16 Mar-16 Mar-16 Feb-16 Mar-16
Midtown 9.7% 8.2% 1.4% $88 $87 $56
Midtown South
2.7% 3.1% 0.4% $77 $80 $59
Downtown 12.6% 10.9% 0.6% $63 $65 $46
Manhattan Totals 9.8% 8.4% 1.2% $80 $80 $55
Source: PKF ConsultingNote: based on latest available data
Manhattan Hotel Occupancy and Room Rate
$0
$50
$100
$150
$200
$250
$300
$350
$400
0%10%20%30%40%50%60%70%80%90%
100%
Nov
-14
Dec
-14
Jan-
15
Feb-
15
Mar
-15
Apr
-15
May
-15
Jun-
15
Jul-1
5
Aug
-15
Sep-
15
Oct
-15
Nov
-15
Dec
-15
Jan-
16
Occupancy Rate Avg. Daily Room Rate

Center for Economic Transformation
www.nycedc.com
Find us on:
dribbble.com/malyousfi dr ibbble.com/malyousfi
dr ibbble.com/malyousfidr ibbble.com/malyousfi
dr ibbble.com/malyousfi
dr ibbble.com/malyousfi
About NYCEDC
The New York City Economic Development Corporation is the City’s primary
engine for economic development charged with leveraging the City’s assets to
drive growth, create jobs and improve quality of life. NYCEDC is an organization
dedicated to New York City and its people. We use our expertise to develop, advise,
manage and invest to strengthen businesses and help neighborhoods thrive. We
make the city stronger.
About NYCEDC Economic Research & Analysis
The Economic Research and Analysis group from NYCEDC’s Center for Economic
Transformation conducts economic analysis of New York City projects, performs
industry and economic research on topics affecting the city and tracks economic
trends for the Mayor, policy-makers and the public as a whole. As part of its goal
of providing up-to-date economic data, research and analysis to New Yorkers,
it publishes a monthly New York City Economic Snapshot as well as the Trends
& Insights series of publications covering such topics as Tech Venture Capital
Investment, Borough & Local Economies, and Industry Economic Sectors. It also
sponsors the Thinking Ahead series of events that brings together thought
leaders and stakeholders to discuss and debate key issues shaping New York City’s
economic future.
Economic Research & Analysis Group
Michael Moynihan, PhD, Chief Economist & Senior Vice President
Eileen Jones, Vice President
Claudia Crawford, Assistant Vice President
Kyle Marks, Senior Project Manager
Kimberly Grauer, Project Manager
Matthew Gordon, Project Manager
Andrew Perry, Project Manager
Maria Surilas, Intern
For more information, visit nycedc.com/NYCeconomics
Contact us at [email protected]