Economics ppt
33
Abhishek Mishra Bishwarup Mitra Vivek Rajan Sanket Kabra Sidharth VD Hiral Shah Automobile Industry
-
Upload
abhishek31m -
Category
Business
-
view
1.440 -
download
0
Transcript of Economics ppt
Abhishek MishraBishwarup Mitra
Vivek RajanSanket KabraSidharth VDHiral Shah
Automobile Industry
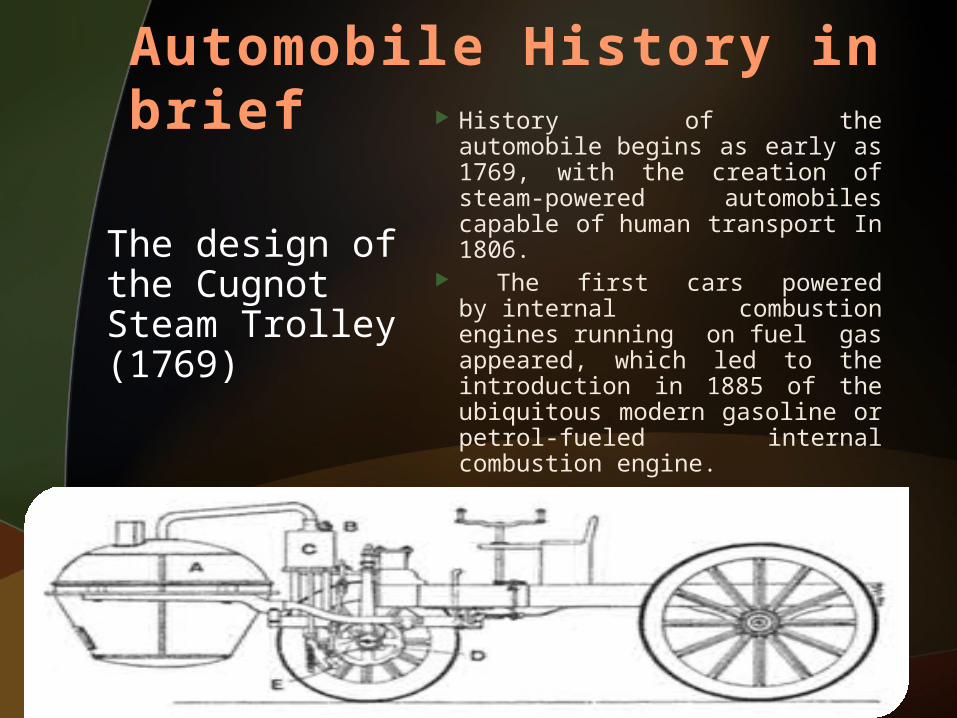
History of the automobile begins as early as 1769, with the creation of steam-powered automobiles capable of human transport In 1806.
The first cars powered by internal combustion engines running on fuel gas appeared, which led to the introduction in 1885 of the ubiquitous modern gasoline or petrol-fueled internal combustion engine.
The design of the Cugnot Steam Trolley (1769)
Automobile History in brief
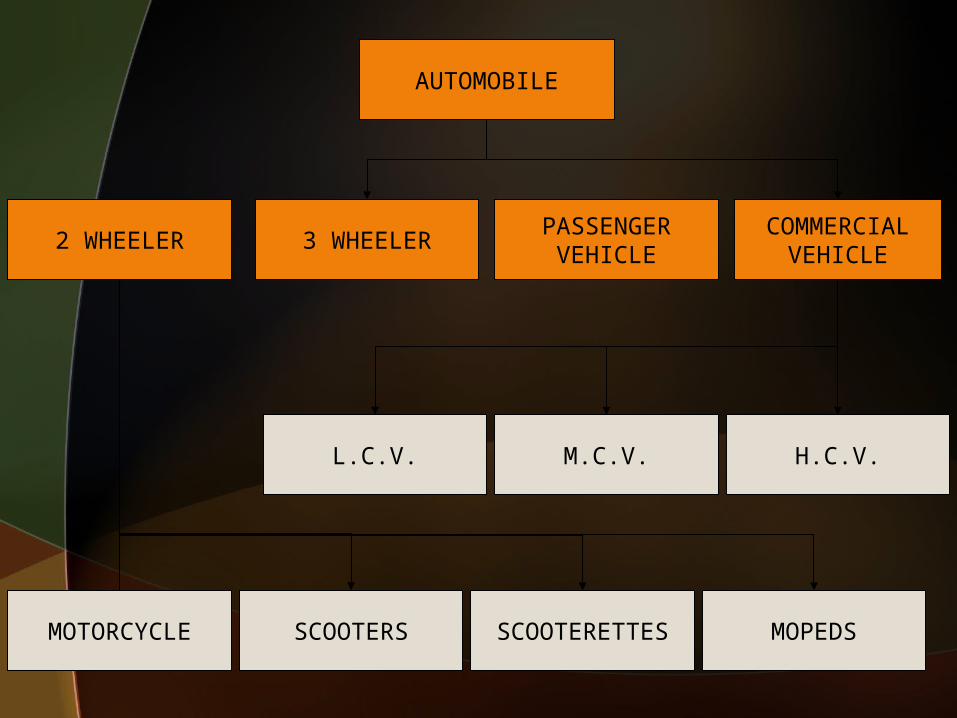
AUTOMOBILE
2 WHEELER 3 WHEELERPASSENGER
VEHICLECOMMERCIAL
VEHICLE
MOTORCYCLE SCOOTERS SCOOTERETTES MOPEDS
L.C.V. M.C.V. H.C.V.
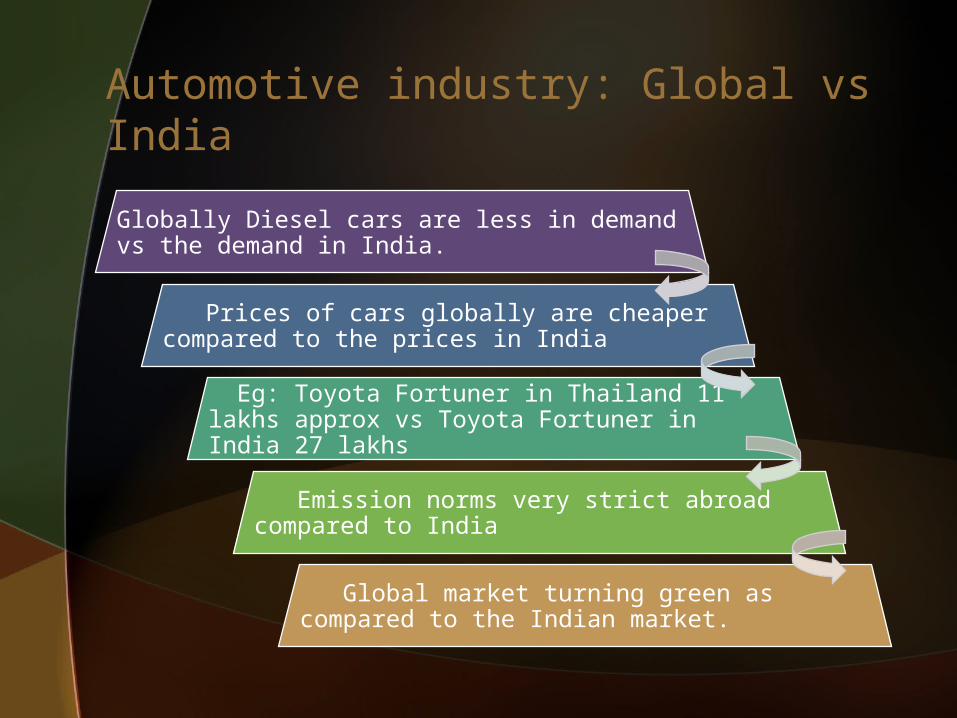
Globally Diesel cars are less in demand vs the demand in India.
Prices of cars globally are cheaper compared to the prices in India
Eg: Toyota Fortuner in Thailand 11 lakhs approx vs Toyota Fortuner in India 27 lakhs
Emission norms very strict abroad compared to India
Global market turning green as compared to the Indian market.
Automotive industry: Global vs India
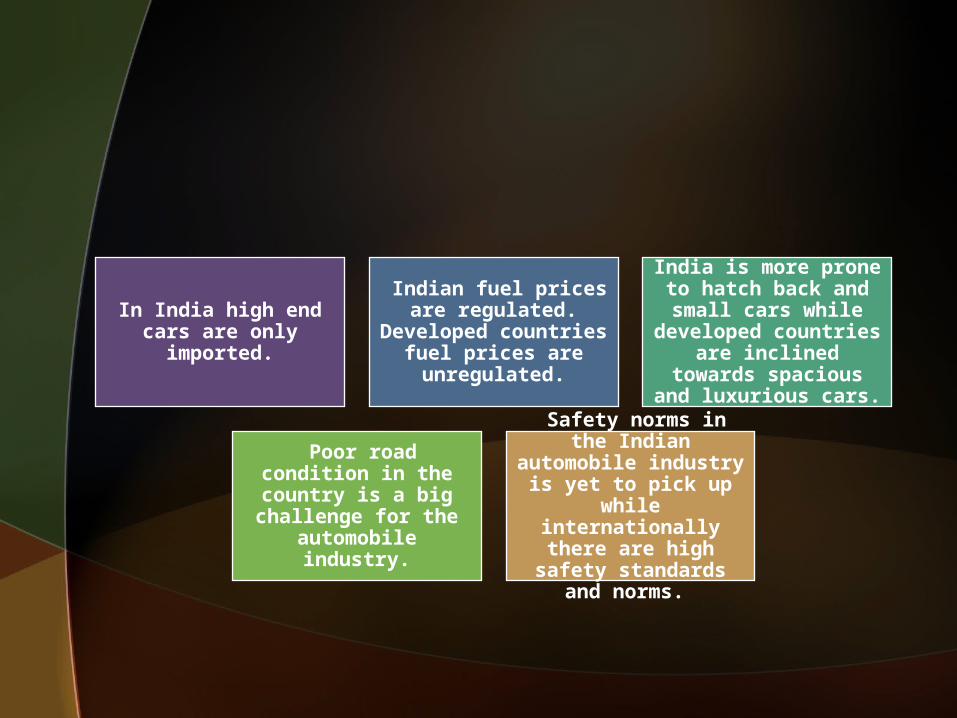
In India high end cars are only
imported.
Indian fuel prices are regulated.
Developed countries fuel prices are unregulated.
India is more prone to hatch back and small cars while
developed countries are inclined towards
spacious and luxurious cars.
Poor road condition in the country is a
big challenge for the automobile industry.
Safety norms in the Indian automobile industry is yet to
pick up while internationally there
are high safety standards and
norms.
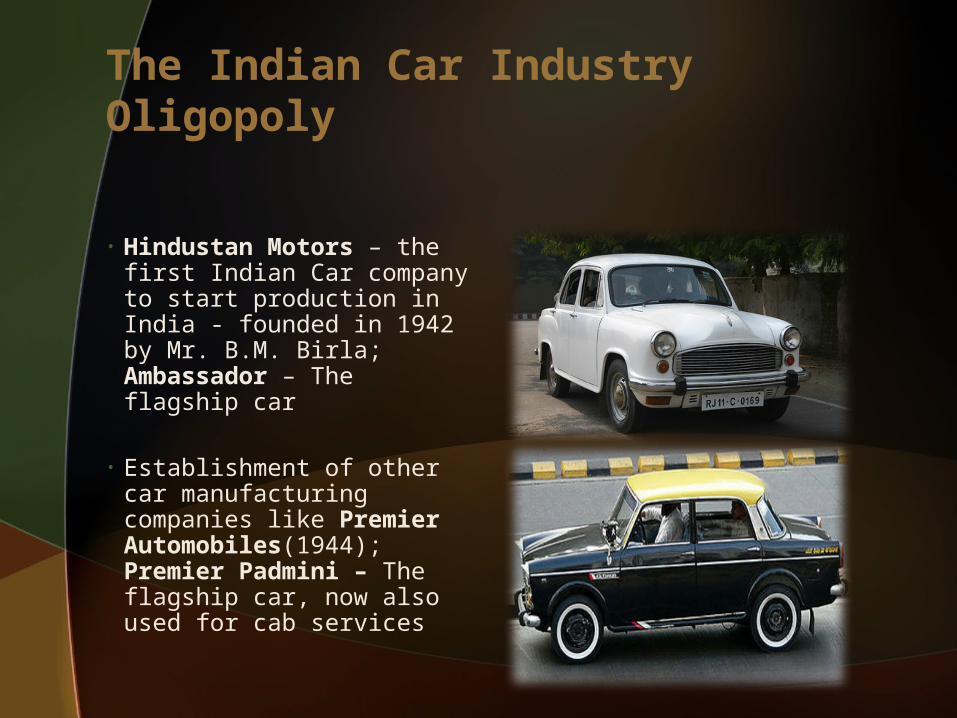
• Hindustan Motors – the first Indian Car company to start production in India - founded in 1942 by Mr. B.M. Birla; Ambassador – The flagship car
• Establishment of other car manufacturing companies like Premier Automobiles(1944); Premier Padmini – The flagship car, now also used for cab services
The Indian Car Industry Oligopoly
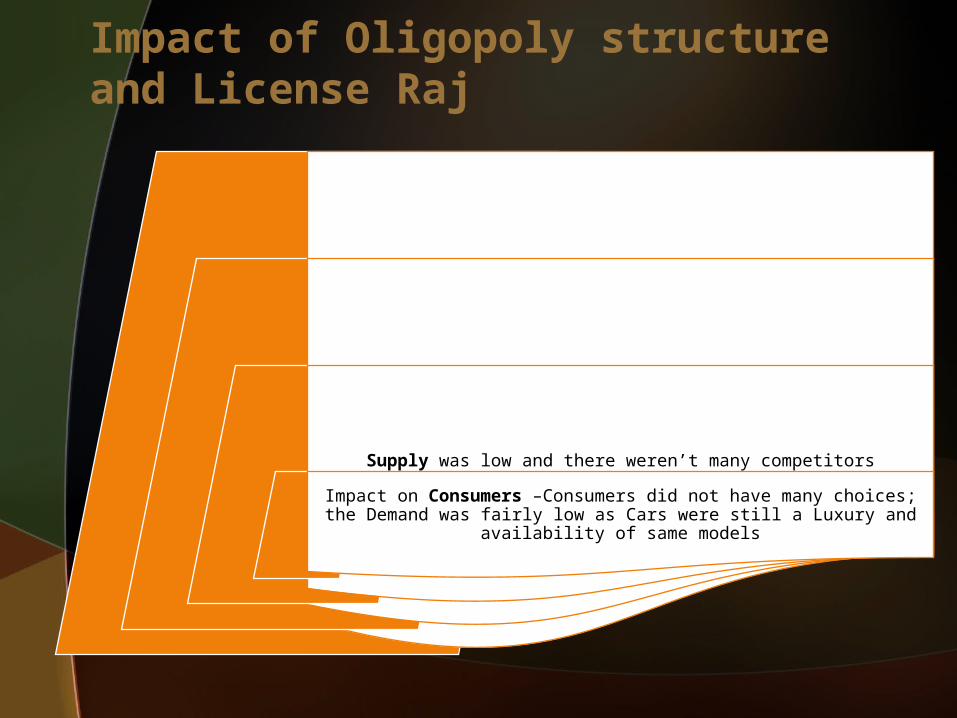
Growth very slow because of Low Demand and Low Economic Status of the country
Government restrictions provided no motivation or incentive for firms to do technological upgradation.
Supply was low and there weren’t many competitors
Impact on Consumers –Consumers did not have many choices; the Demand was fairly low as Cars were still a Luxury and availability of
same models
Impact of Oligopoly structure and License Raj
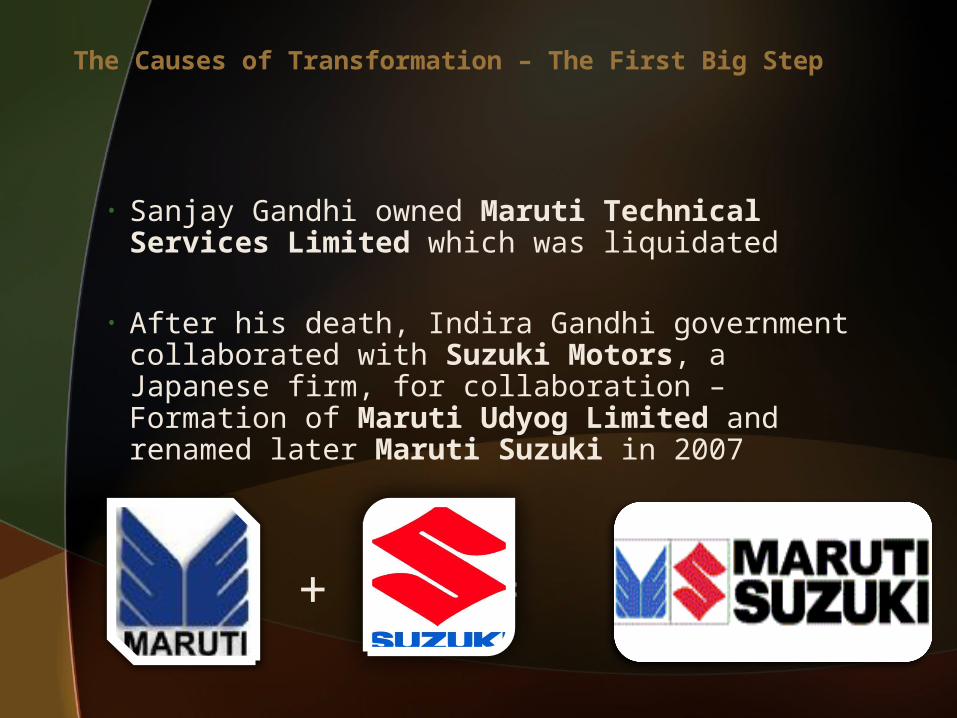
• Sanjay Gandhi owned Maruti Technical Services Limited which was liquidated
• After his death, Indira Gandhi government collaborated with Suzuki Motors, a Japanese firm, for collaboration – Formation of Maruti Udyog Limited and renamed later Maruti Suzuki in 2007
+ =
The Causes of Transformation – The First Big Step
• Policy changes introduced in 2 doses:1. Partial de-regulation in 1985 – eased
licensing requirements, allowed selective capacity-expansion, partial relaxation of controls with regard to foreign collaboration, imports.
However, trade and investment regulations continued, constraining growth of big business houses.
2. 1991 policy changes – Dispensed with bulk controls and regulations
• Partial de-regulation allowed technology inflow into India
The Causes of Transformation
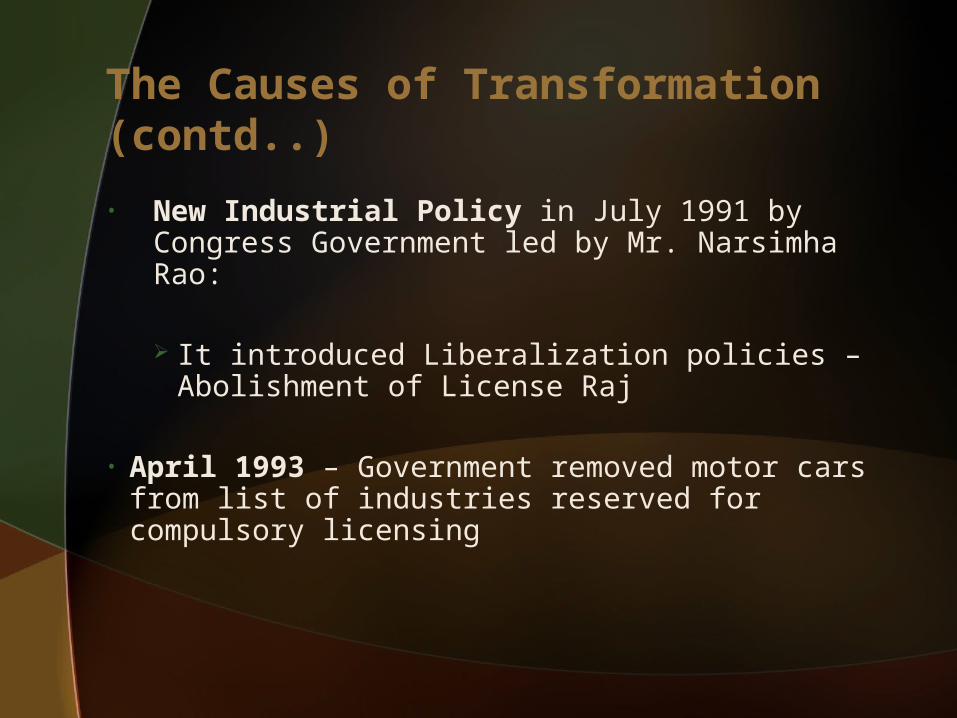
• New Industrial Policy in July 1991 by Congress Government led by Mr. Narsimha Rao:
It introduced Liberalization policies – Abolishment of License Raj
• April 1993 – Government removed motor cars from list of industries reserved for compulsory licensing
The Causes of Transformation (contd..)
• New firms, including foreign players, entered with modern engineering, efficient processes and modern shop-floor layouts
• Indian automobile industry grew at 14.31% per annum in post-1991 era compared to 8.56% per annum during 1985-91
• Delicencing of sector attracted many major Global OEMs (GM, Ford, Honda, Hyundai etc.) to start assembly in India
Effects of the Transformation
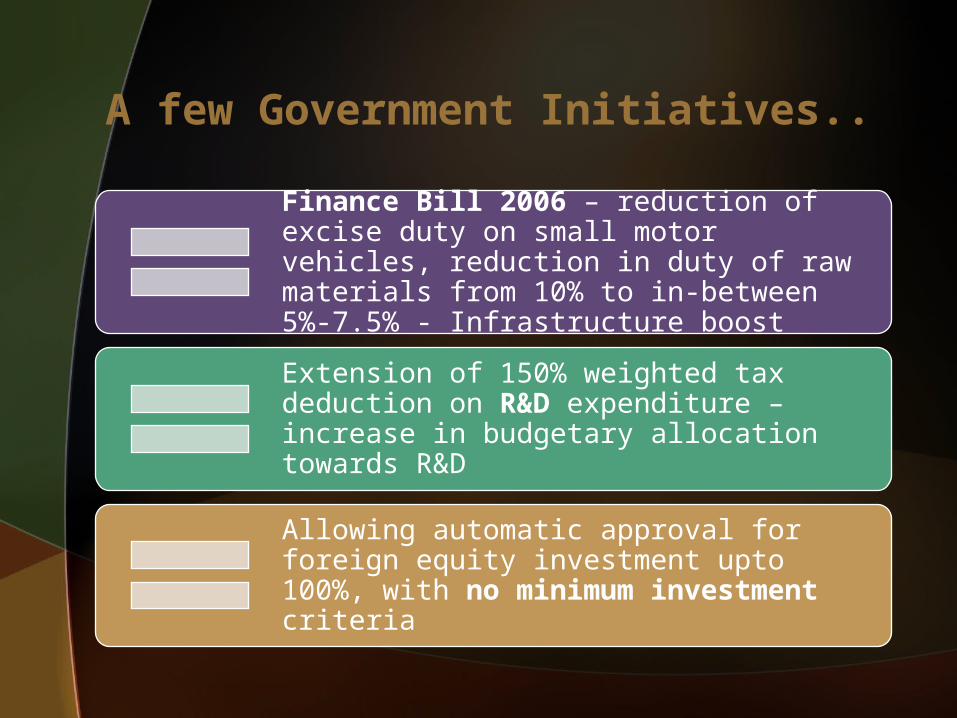
Finance Bill 2006 – reduction of excise duty on small motor vehicles, reduction in duty of raw materials from 10% to in-between 5%-7.5% - Infrastructure boost
Extension of 150% weighted tax deduction on R&D expenditure – increase in budgetary allocation towards R&D
Allowing automatic approval for foreign equity investment upto 100%, with no minimum investment criteria
A few Government Initiatives..
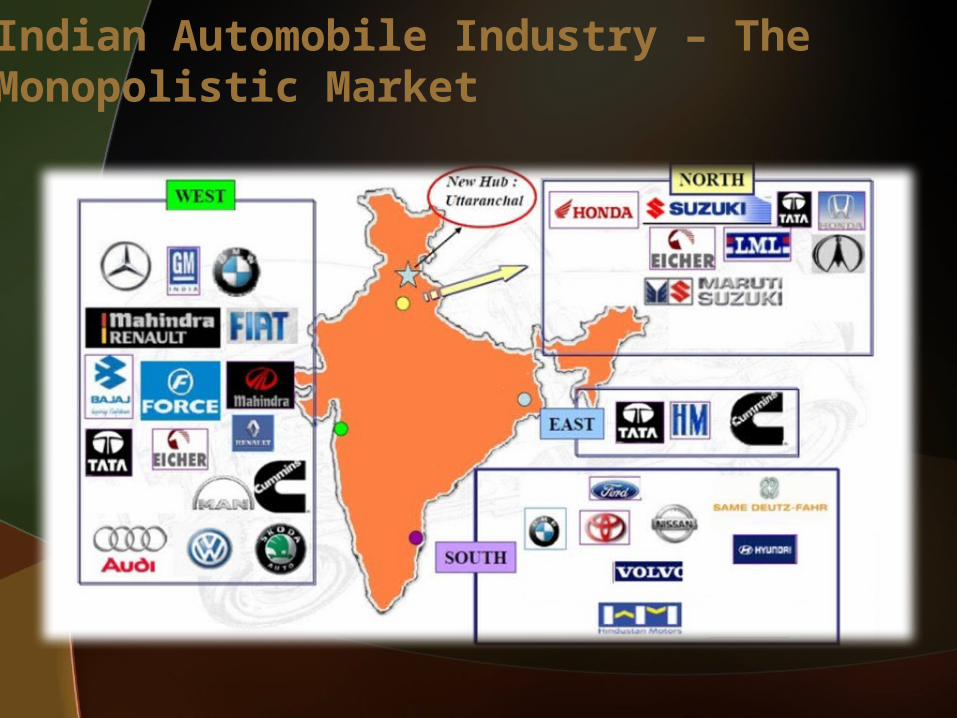
Indian Automobile Industry – The Monopolistic Market
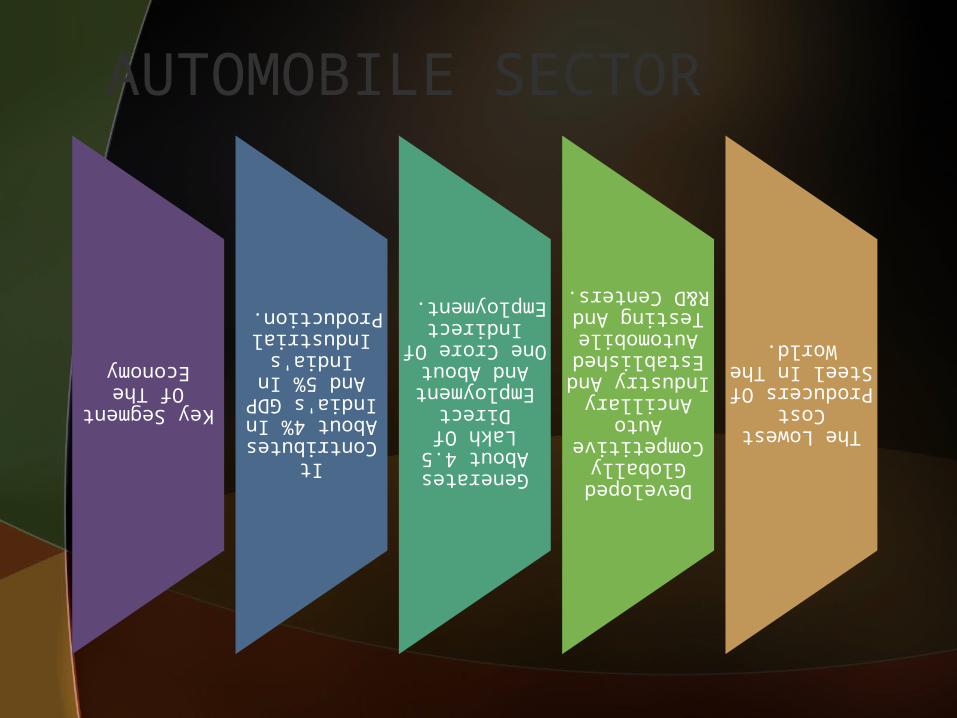
Key Segment Of The Economy It Contributes About 4% In India's GDP And 5% In India's Industrial Production.
Generates About 4.5 Lakh Of Direct Employment And About One Crore Of Indirect Employment.
Developed Globally Competitive Auto Ancillary Industry And Established Automobile Testing And
R&D Centers.The Lowest Cost Producers Of Steel In The World.
AUTOMOBILE SECTOR
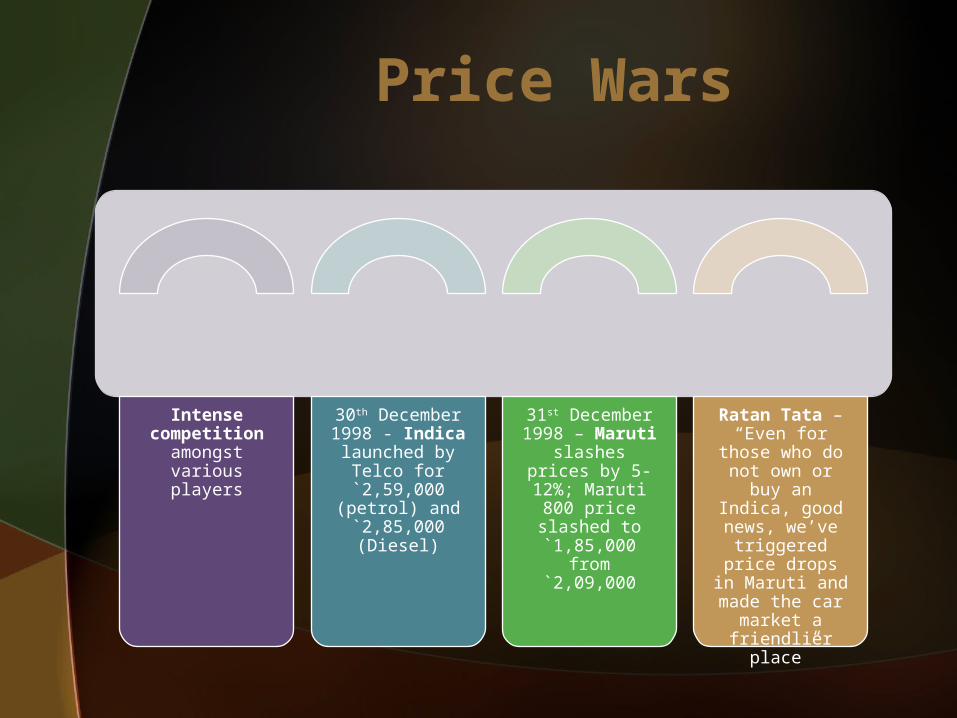
Intense competition
amongst various players
30th December 1998 - Indica
launched by Telco for `2,59,000 (petrol) and `2,85,000 (Diesel)
31st December 1998 – Maruti
slashes prices by 5-12%; Maruti
800 price slashed to `1,85,000 from
`2,09,000
Ratan Tata – “Even for those who do not own or buy an Indica, good news, we’ve
triggered price drops in Maruti
and made the car market a
friendlier place”
Price Wars
• Tata has come up with ` 1 Lakh car – Tata Nano
• This again has created price war
• Nissan-Renault to develop a $3000 car using India’s “frugal engineering expertise”
• Bajaj to experiment with the idea of a small car
Current Trends
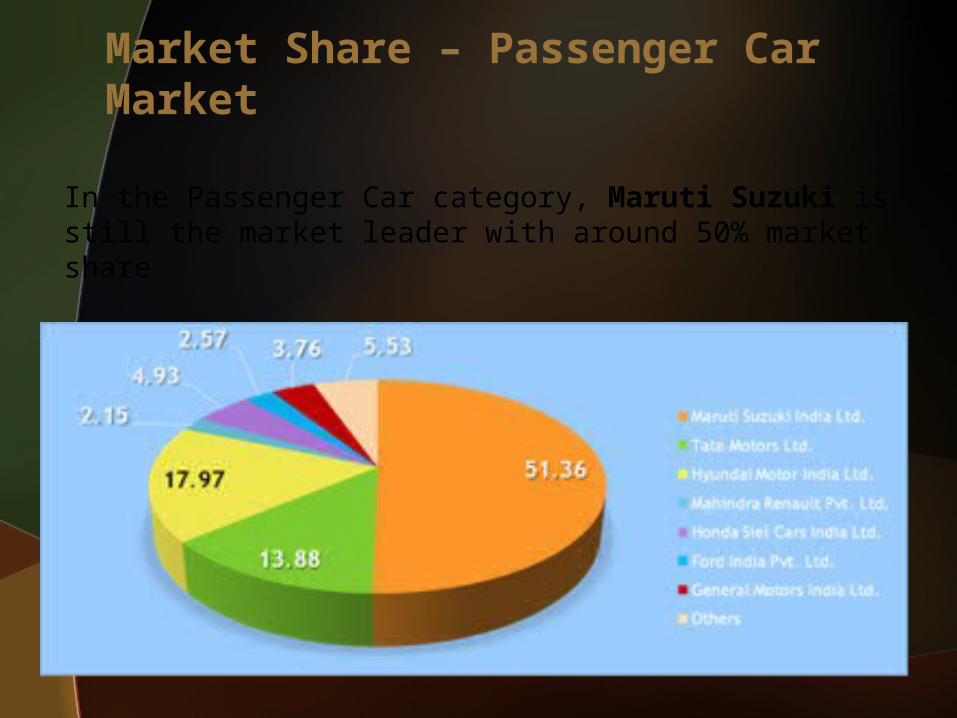
Market Share – Passenger Car Market
In the Passenger Car category, Maruti Suzuki is still the market leader with around 50% market share
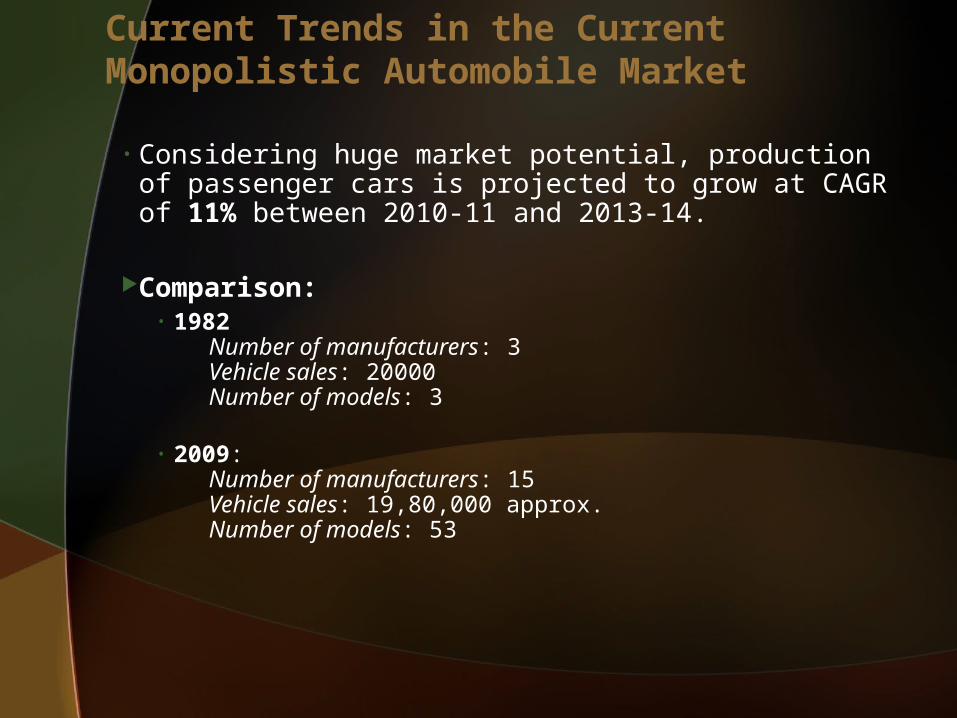
• Considering huge market potential, production of passenger cars is projected to grow at CAGR of 11% between 2010-11 and 2013-14.
Comparison:• 1982
Number of manufacturers: 3Vehicle sales: 20000Number of models: 3
• 2009:Number of manufacturers: 15Vehicle sales: 19,80,000 approx.Number of models: 53
Current Trends in the Current Monopolistic Automobile Market
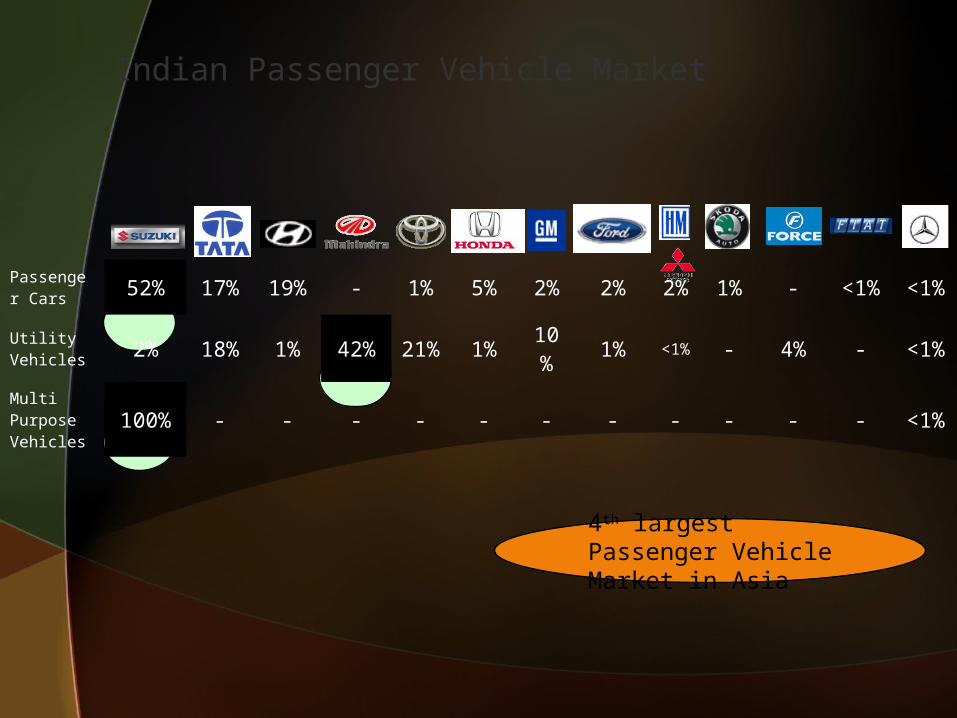
Passenger Cars 52% 17% 19% - 1% 5% 2% 2% 2
% 1% - <1%
<1%
Utility Vehicles 2% 18% 1% 42% 21
% 1% 10% 1% <1
% - 4% - <1%
Multi Purpose Vehicles
100% - - - - - - - - - - - <1%
Indian Passenger Vehicle Market
4th largest Passenger Vehicle Market in Asia
Petrol Vs Diesel
Diesel car or a Petrol car?
Important for consumers to know they're getting value for money when they buy a car.
Petrol car running cost is Rs.5/KM where as Diesel car running cost is Rs.2.5/Km.
Continued..
Less KM Run people prefer Petrol cars and for more KM Run people prefer Diesel cars.
Petrol car users= 1/ KM Run.
Business class prefer Diesel car more than Petrol Cars, Where as Service class prefer more petrol car than diesel car
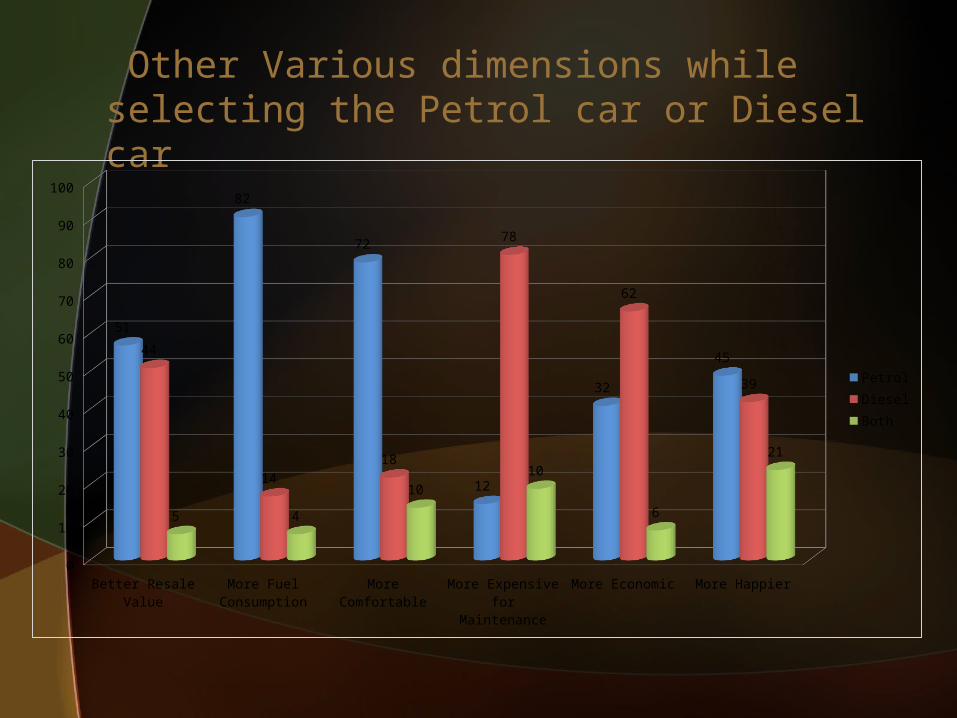
Other Various dimensions while selecting the Petrol car or Diesel car
Better
Resale
Value
More Fu
el Consu
mption
More Comforta
ble
More Ex
pensiv
e for M
ainten
ance
More Eco
nomic
More Hap
pier0
10
20
30
40
50
60
70
80
90
100
51
82
72
12
32
4544
1418
78
62
39
5 4
1010
6
21PetrolDieselBoth
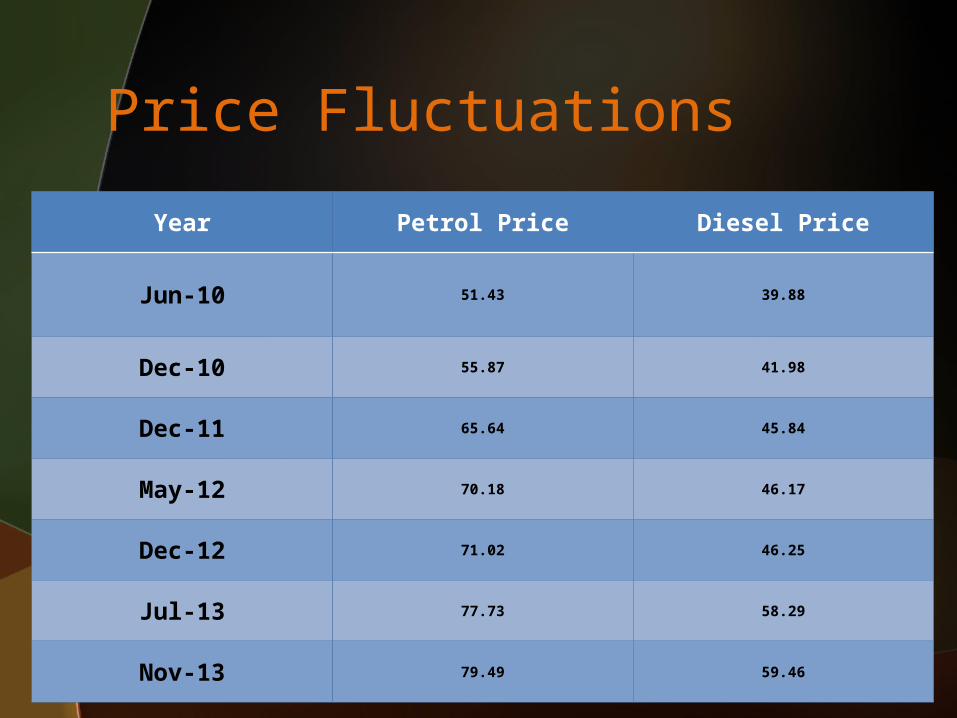
Price Fluctuations
Year Petrol Price Diesel Price
Jun-10 51.43 39.88
Dec-10 55.87 41.98
Dec-11 65.64 45.84
May-12 70.18 46.17
Dec-12 71.02 46.25
Jul-13 77.73 58.29
Nov-13 79.49 59.46
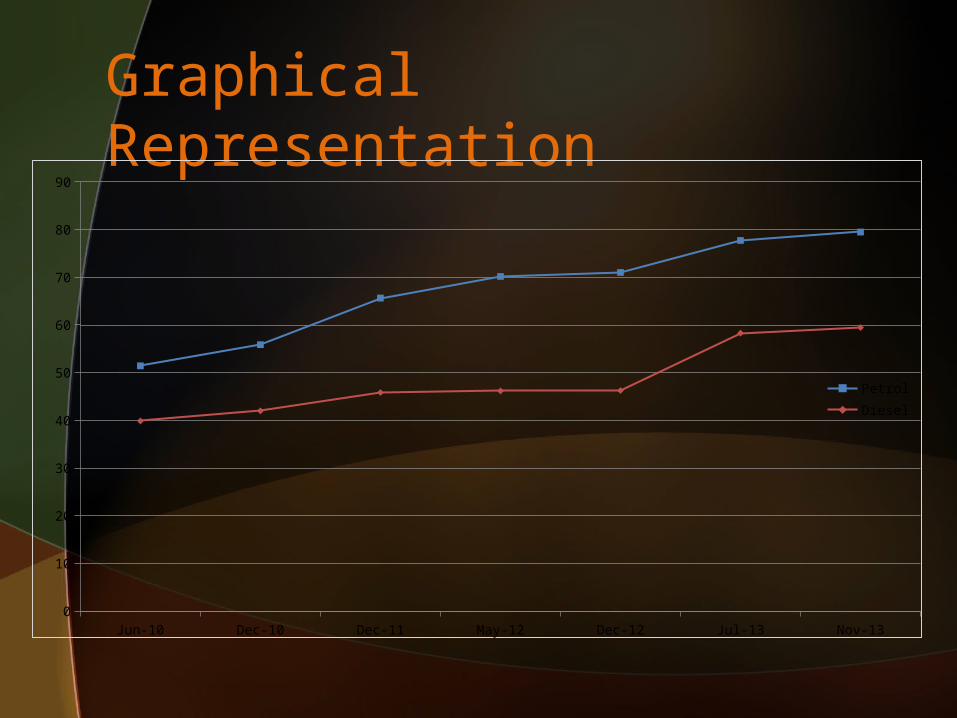
Graphical Representation
Jun-10 Dec-10 Dec-11 May-12 Dec-12 Jul-13 Nov-130
10
20
30
40
50
60
70
80
90
PetrolDiesel
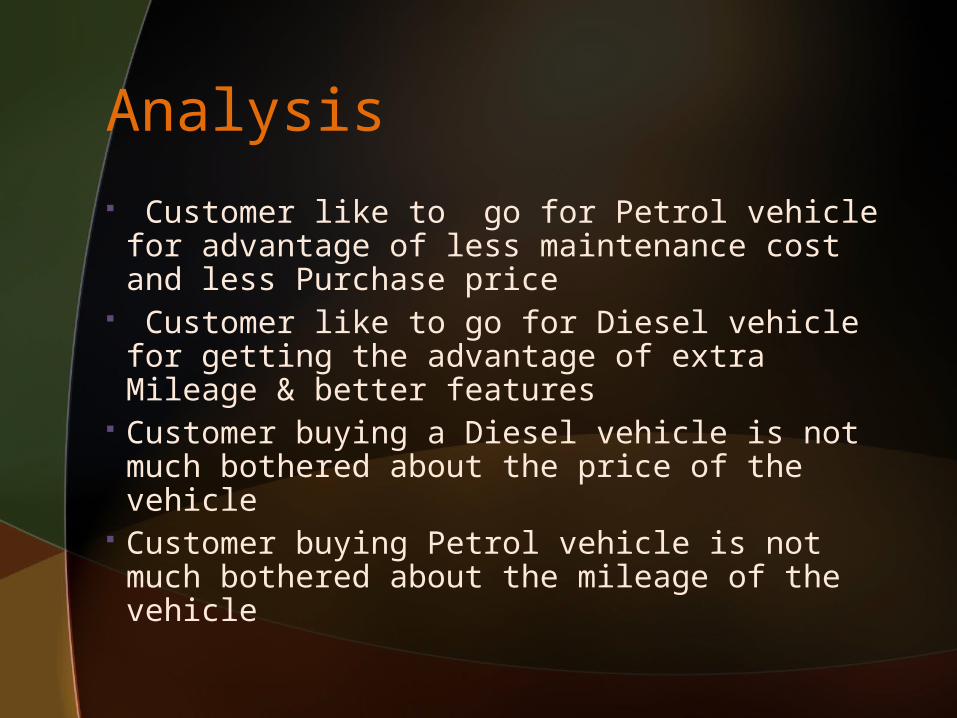
Analysis
Customer like to go for Petrol vehicle for advantage of less maintenance cost and less Purchase price
Customer like to go for Diesel vehicle for getting the advantage of extra Mileage & better features
Customer buying a Diesel vehicle is not much bothered about the price of the vehicle
Customer buying Petrol vehicle is not much bothered about the mileage of the vehicle
Factors Influencing the Sales Rise Convergence of government policiesEconomy’s growthIncrease in People’s purchasing power.Pursuit of better lifestyleGrowth in the road infrastructure
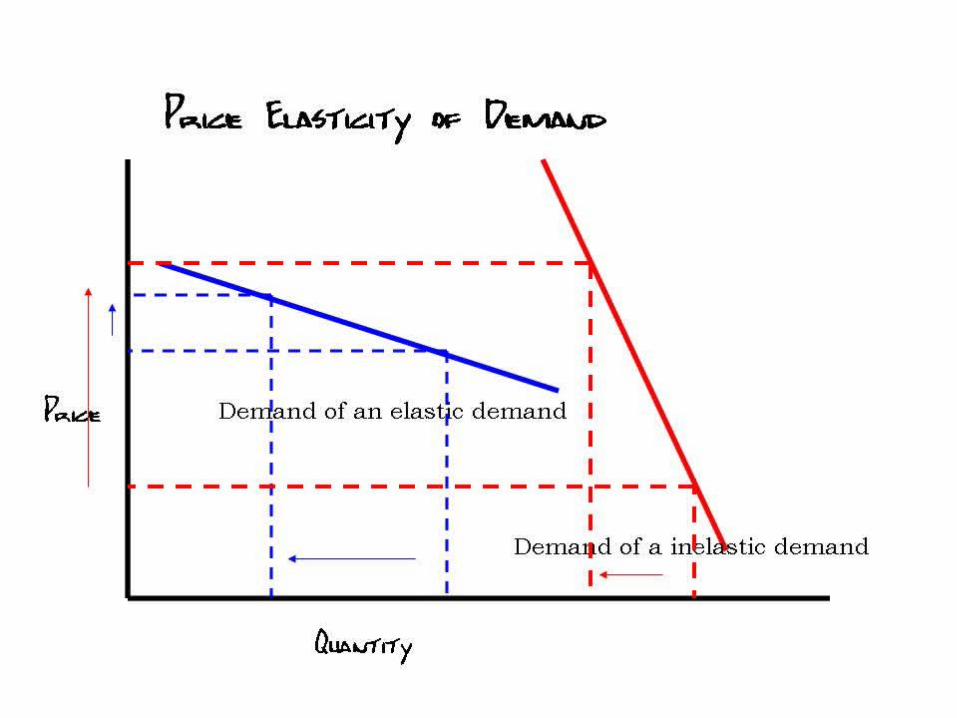
PRICE ELASTICITY OF DEMANDRelatively inelastic demand for
Mercedes car owner compared to a Maruti Suzuki car owner who will have a relatively elastic demand
when it comes to charging him for service .
This is because owner of mercedes wont mind in paying higher amount.
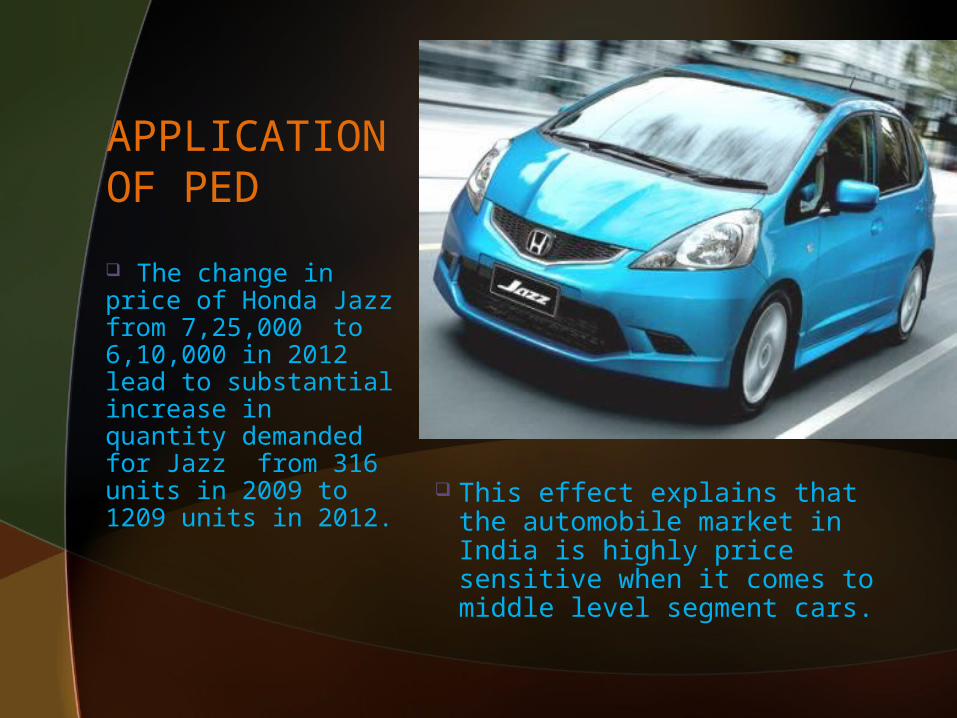
This effect explains that the automobile market in India is highly price sensitive when it comes to middle level segment cars.
The change in price of Honda Jazz from 7,25,000 to 6,10,000 in 2012 lead to substantial increase in quantity demanded for Jazz from 316 units in 2009 to 1209 units in 2012.
APPLICATION OF PED
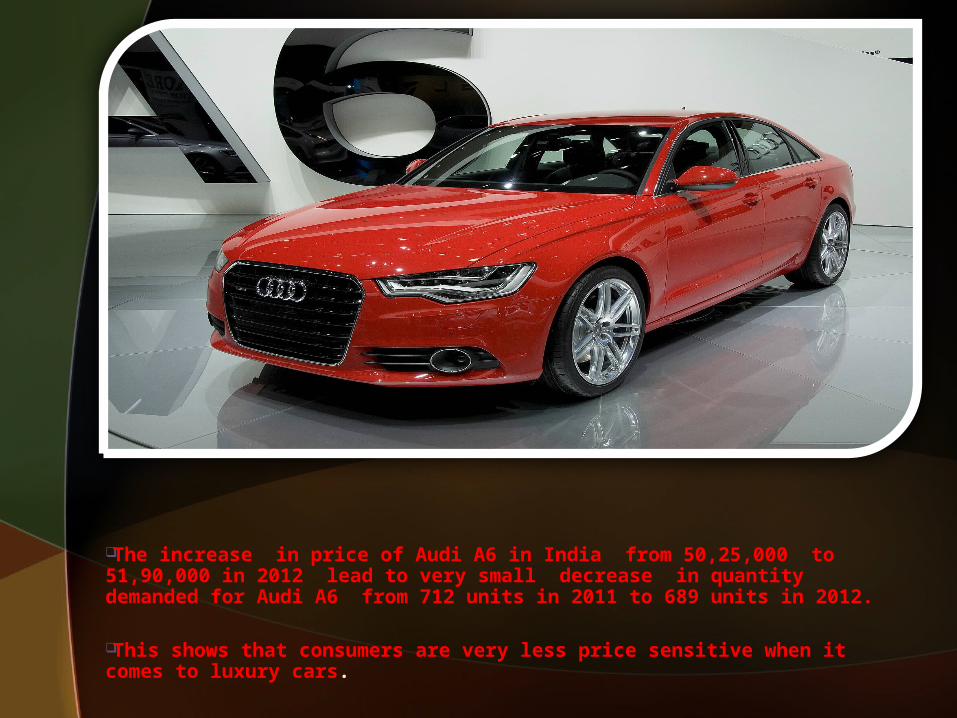
The increase in price of Audi A6 in India from 50,25,000 to 51,90,000 in 2012 lead to very small decrease in quantity demanded for Audi A6 from 712 units in 2011 to 689 units in 2012.
This shows that consumers are very less price sensitive when it comes to luxury cars.
CRISIL Reports
http://auto.indiamart.com/
http://www.wikinvest.com
http://india-reports.in
http://wheelsunplugged.in/
http://en.wikipedia.org
References