Economics of Tobacco Control An Introduction on the Economics of Tobacco Control ... ITC Project,...
57
1 Frank J. Chaloupka Chair, WHO Collaborating Centre on the Economics of Tobacco & Tobacco Control Distinguished Professor, University of Illinois at Chicago Economics of Tobacco Control – An Introduction Symposium on the Economics of Tobacco Control Hacettepe University, Ankara, Turkey 15 April, 2013
Transcript of Economics of Tobacco Control An Introduction on the Economics of Tobacco Control ... ITC Project,...

1
Frank J. ChaloupkaChair, WHO Collaborating Centre on the Economics of Tobacco &
Tobacco Control Distinguished Professor, University of Illinois at Chicago
Economics of Tobacco Control
–An Introduction
Symposium on the Economics of Tobacco ControlHacettepe University, Ankara, Turkey
15 April, 2013

2

3
Economics & Tobacco Control
Tobacco control efforts: public health + economic- Cost effectiveness of tobacco control
interventions
21st Century: economic issues are key:– health care costs, lost productivity, lost income– tobacco farming– limited public health budgets in LMICs– increasing consolidation of the global tobacco industry
4
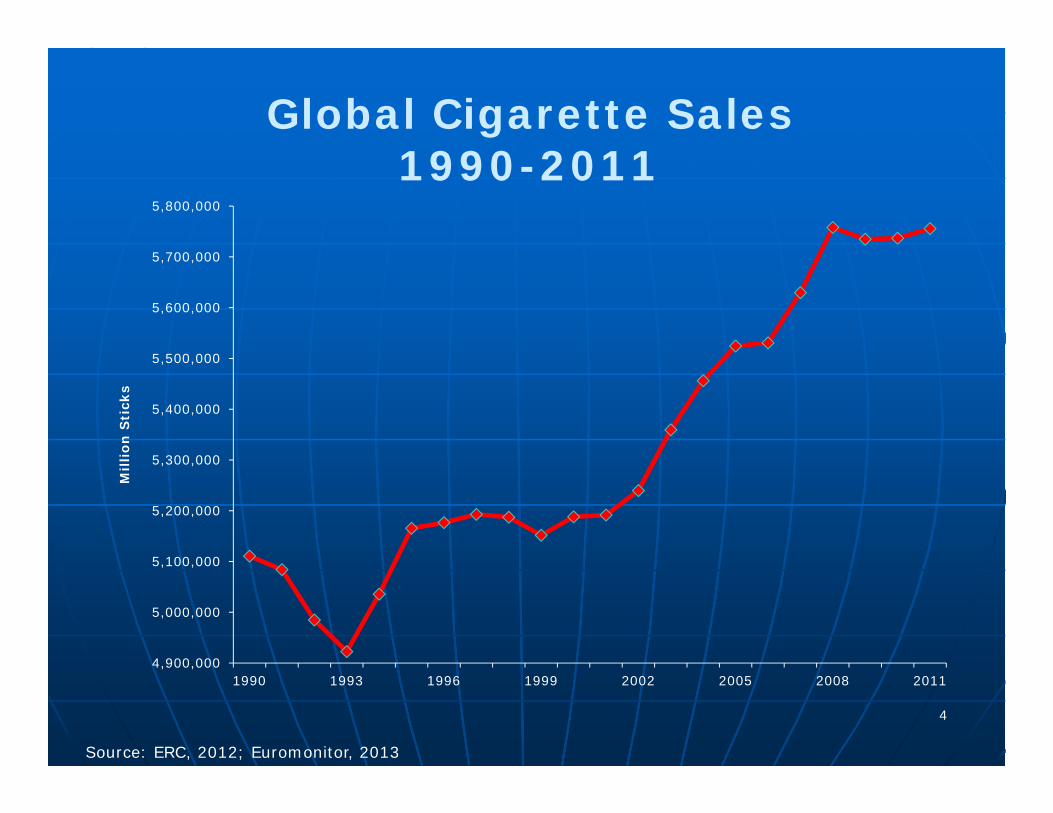
Source: ERC, 2012; Euromonitor, 2013
4,900,000
5,000,000
5,100,000
5,200,000
5,300,000
5,400,000
5,500,000
5,600,000
5,700,000
5,800,000
1990 1993 1996 1999 2002 2005 2008 2011
Mill
ion
Sti
cks
Global Cigarette Sales1990-2011

5
Source: TMA, 2010
70.0
80.0
90.0
100.0
110.0
120.0
130.0
140.0
150.0
1990 1993 1996 1999 2002 2005 2008
Cig
aret
te S
ales
, I
nd
exed
, 1
99
0=
10
0
Americas Middle East & Africa Western Europe Eastern Europe & FSU Asia & Australia
Cigarette Sales by Region1990-2008

WORLD: Annual Tobacco Deaths (in millions)
Source: Peto, Lopez, et al 1997
1990 2030Developed 2 ~3Developing ~1 ~7World Total 3 ~10
Current smokers, mainly teenagers and young adults
Past smokers, mainly adults

Considerable evidence from high-income countries:• US: smoking-attributable health care
expenditures of $96 billion in early 2000s• Lifetime health care costs for smokers are
significantly higher than those of nonsmokers• US: additional $97 billion in lost productivity
from premature death• Additional lost/reduced productivity from
smoking on the job, smoking-attributable morbidity, exposure to TSP
Economic Costs of Tobacco Use
Source: CDC, 2008

Limited, but emerging evidence from low and middle-income countries:
• China:• 3.1% of health care costs; 1.9% of GDP
• India:• 4.7% of health care costs; 0.25% of GDP
• Bangladesh:• >3% of GDP
• Economic costs in LMICs will almost certainly rise over time
Economic Costs of Tobacco Use
Sources: WHO 2007; John et al. 2009; Hu et al., 2008

Poverty and Tobacco Use
Sources: WHO 2007

Cycle of tobacco and
poverty
Poor men smoke
Forgone income 1: More money spent Less money spent on tobacco: on education, nutrition, etc
High opportunity cost
Breadwinner getssick due to tobacco use
Forgone income 2:Treatment cost &
Lost working days & income
Forgone income 3:Breadwinner dies
prematurely
Family falls into poverty
Tobacco and Poverty
Source: Yurekli, 2007

11
Poverty and Tobacco Use
Burdens of poverty are compounded by tobacco use• Responsible for impoverishment of over 50
million in China and over 15 million in India• Crowding out of other spending:
• Bangladesh: tobacco money spent equivalent to:• Males = 1402 calories of rice per day• Females = 770 calories of rice per day
Sources: Hu, et al., 2008; John, et al., 2011; Efroymson, et al., 2001

12
Crowding Out17 ITC Countries
Source: ITC Project, 2012
Tobacco crowds out spending on essentials. – Greater crowding out
in LMICs

Why should governments intervene?Economic rationale or “market failures”
Smokers do not know their risks Addiction and youth onset of smoking
• Lack of information and unwillingness to act on information
• Regret habit later, but many addicted
Costs imposed on others• Costs of environmental tobacco smoke and
health costs
Source: Jha et al., 2000

Government roles in intervening To deter children from smoking To protect non-smokers from others’
smoke To provide adults with necessary
information to make an informed choice
First-best instrument, such as youth restrictions, are less effective.
Tax increases are highly effective, but are blunt instruments.
Source: Jha et al., 2000
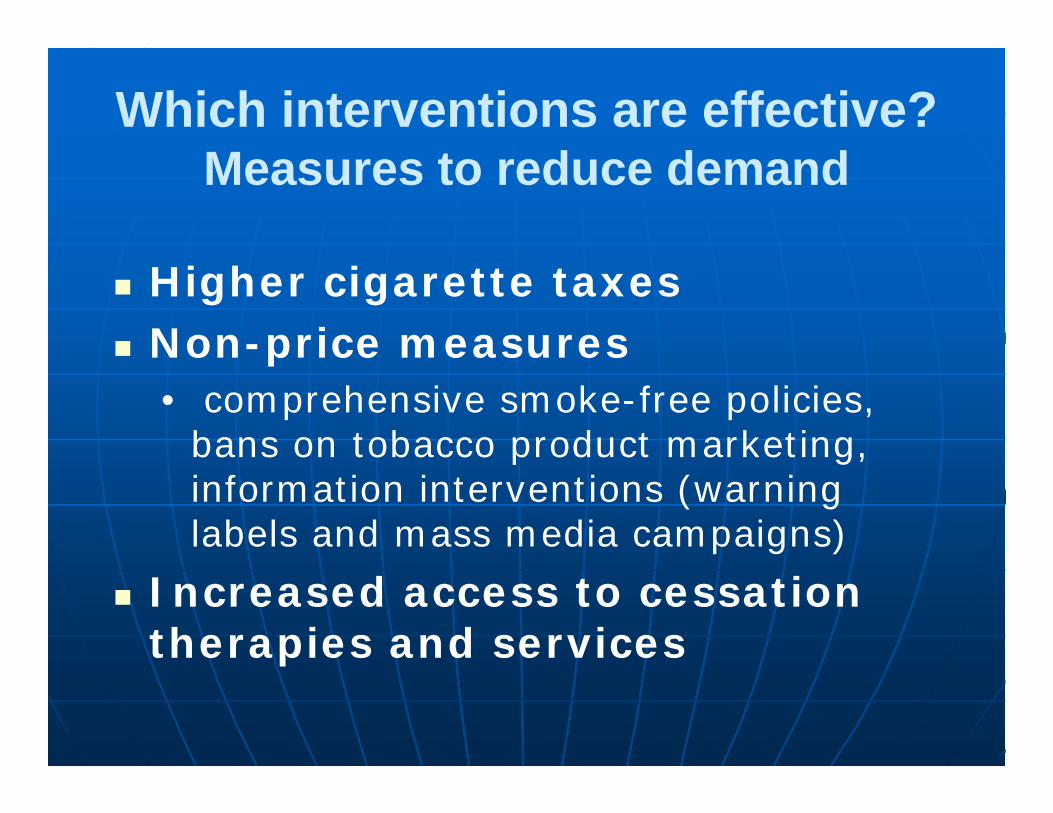
Which interventions are effective?Measures to reduce demand
Higher cigarette taxes Non-price measures
• comprehensive smoke-free policies, bans on tobacco product marketing, information interventions (warning labels and mass media campaigns)
Increased access to cessation therapies and services

16
Tobacco Taxation
“… We [] have a package of six policy measures, known as MPOWER, that can help countries implement the provisions in the Convention. All six measures have a proven ability to reduce tobacco use in any resource setting. But tobacco taxes are by far the most effective.”
WHO Director General Dr. Margaret Chan

17
Increases in tobacco excise taxes that increase prices result in a decline in overall tobacco
use.
Tobacco Taxes and Tobacco Use

18
Taxes, Prices and Tobacco UseTaiwan, 1998-2010
Source: Euromonitor, 2011
34,000
35,000
36,000
37,000
38,000
39,000
40,000
41,000
42,000
33
35
37
39
41
43
45
47
1998 1999 2000 2001 2002 2003 2004 2005 2006 2007 2008 2009 2010
Cig
aret
te S
ales
, M
illio
n S
tick
s
20
10
Tai
wan
ese
Do
llars
per
Pac
k
Price (2010 Dollars) Sales (million sticks)

19
Increases in tobacco excise taxes that increase prices
reduce the prevalence of adult tobacco use.
Tobacco Taxes and Prevalence of Tobacco Use

20Source: Tax Burden on Tobacco, 2011, National Health Interview Survey, and author’s calculations
$1.50
$2.00
$2.50
$3.00
$3.50
$4.00
$4.50
$5.00
$5.50
19
23
27
31
35
1970 1973 1976 1979 1982 1985 1988 1991 1994 1997 2000 2003 2006 2009
Pric
e A
ug 2
011
dol
lars
)
Pre
vale
nce
Year
Cigarette Prices and Adult Smoking Prevalence United States, 1970-2010
Prevalence Price
21
Increases in tobacco excise taxes that increase prices
induce current tobacco users to quit.
Tobacco Taxes and Cessation

220
50,000
100,000
150,000
200,000
2004 2005 2005 2005 2006 2006 2006 2007 2007 2007 2008 2008 2008 2009 2009 2009
Monthly Quit Line Calls, United States11/04-11/09
4/1/09 Federal Tax Increase
1/1/08 WI Tax Increase

Source: BRFSS, Tax Burden on Tobacco, 2010, and author’s calculations
y = 0.0283x + 43.083R² = 0.371
45
50
55
60
65
70
350 400 450 500 550 600 650 700 750 800 850
% E
ver
Sm
oker
s W
ho
Hav
e Q
uit
Average price (in cents)
Cigarette Prices and CessationUS States & DC, 2009

24
Increases in tobacco excise taxes that increase prices reduce the initiation and uptake of tobacco use among young people, with a
greater impact on the transition to regular use.
Tobacco Taxes and Youth Tobacco Use

25
Tobacco use among young people responds more to changes in
tobacco product taxes and prices than does tobacco use among
adults.
Tobacco Taxes and Youth Tobacco Use

26
Source: MTF, Tax Burden on Tobacco, 2011, and author’s calculations
6
11
16
21
26
31
36
$2.50
$3.25
$4.00
$4.75
$5.50
1991 1993 1995 1997 1999 2001 2003 2005 2007 2009 2011
Sm
okin
g P
reva
lenc
e
Pric
e pe
r pac
k (8
/11
dolla
rs)
Year
Cigarette Price and Youth Smoking Prevalence United States, 1991-2011
Cigarette Price 12th grade prevalence 10th grade prevalence 8th grade prevalence

27
The demand for tobacco products in low-income countries is at least
as responsive to price as is the demand for tobacco products in
high-income countries.
Tobacco Taxes and LMICs

28
In many countries, tobacco use among lower-income populations
is more responsive to tax and price increases than is tobacco use among higher-income populations.
Tobacco Taxes and Low-Income Populations

Source: Chaloupka et al., in progress; assumes higher income smokers smoke more expensive brands
Who Pays & Who BenefitsImpact of Federal Tax Increase, U.S., 2009
11.9%
20.7%
67.4%
46.3%
29.5%
24.2%
0.0%
10.0%
20.0%
30.0%
40.0%
50.0%
60.0%
70.0%
<poverty line 1-2* poverty line >2* poverty line
Share of Tax Increase Share of Reduced Deaths

30
Tobacco tax increases that increase prices improve population
health
Tobacco Taxes and Population Health

2.0
2.5
3.0
3.5
4.0
4.5
5.0
5.5
6.0
1980 1985 1990 1995 2000 2005Year
Num
ber/a
dult/
day
50
100
150
200
250
300
Pric
e/De
aths
(% R
elat
ive
to 1
980) Lung Cancer Deaths:
males age 35-44/4
Relative Price
Number cigarettes/adult/day
Tax, Price, Smoking, and Male Lung Cancer, France, 1980-2005
Source: Jha, 2009

32
Higher and more uniform specific tobacco excise taxes result in
higher tobacco product prices and increase the effectiveness of taxation policies in reducing
tobacco use.
Tobacco Tax Structure

33
Cigarette Prices & Tax Structure
Source: Chaloupka, et al., in progress
0.00
0.10
0.20
0.30
0.40
0.50
0.60
Sta
nd
ard
Dev
iati
on
, P
rice
s o
f To
p 5
Bra
nd
s

34
To achieve public health goals, tobacco tax and price increases
need to reduce the affordability of tobacco products.
Tobacco Taxes and Affordability

35
Cigarette Affordability16 ITC Countries over Time
Source: ITC Project, 2012

36
Tobacco tax increases increase tobacco tax revenues.
Tobacco Taxes and Tobacco Tax Revenues

37
Tobacco Taxes and Revenues
Source: Van Walbeek, 2003
Inflation Adjusted Cigarette Taxes andCigarette Tax Revenues, South Africa, 1961-2003
0
50
100
150
200
250
300
350
1961
1965
1969
1973
1977
1981
1985
1989
1993
1997
2001
Rea
l exc
ise
rate
(in
con
stan
t 200
0 ce
nts)
0
1000
2000
3000
4000
Rea
l exc
ise
reve
nue
(R m
illio
n, 2
000
pric
es)
Real excise rate Real excise revenue

38
Tobacco Taxes, Sales & Revenues
Source: WHO 2013
WHO TaXSiMmodel forecasts of tax changes announced in 2012
% change in average excise
per pack
% change in average price
per pack
% change in annual sales
volume
% change in annual excise
revenue
Philippines (median est.) 201% 70% -48% 58%
Senegal 57% 50% -22% 23%India (bidi cigarettes) 25% 1% -1% 5%
Thailand 21% 14% -6% 12%India (white cigarettes) 20% 18% -9% 9%
Fiji 10% 4% -3% 7%Papua New Guinea 10% 3% -3% 7%
Bangladesh 8% 5% -2% 6%
Indonesia 5% 3% -1% 4%

39
Tax avoidance and tax evasion reduce, but do not eliminate, the public health and revenue impact
of tobacco tax increases.
Tax Avoidance &Tax Evasion

40
A coordinated set of interventions that includes international
collaborations, strengthened tax administration, increased
enforcement, and swift, severe penalties reduces illicit trade in
tobacco products
Curbing Tax Evasion

Cigarette Taxes and Illegal Cigarettes, Spain 1991-2008
Spain: Size of contraband cigarette market & total tax level on cigarette price
59.0%
71.7%
71.2% 71.4%
77.6%17.7%
13.6%
2.7%
1.1% 1.0%
21.2%
-3.0%
2.0%
7.0%
12.0%
17.0%
22.0%
1991
1992
1993
1994
1995
1996
1997
1998
1999
2000
2001
2002
2003
2004
2005
2006
2007
2008
% o
f con
traba
nd c
igar
ette
s in
dut
y pa
id s
ales
45%
50%
55%
60%
65%
70%
75%
80%
Tota
l tax
as
% o
f Mos
t Pop
ular
Bra
nd
Pric
e
total tax incidence% of contraband
Source: WHO, unpublished data

Which interventions are ineffective at reducing consumption?
Most measures to reduce supply
Prohibition Youth access restrictions Crop substitution Trade restrictions Control of smuggling is key supply-
side measure Product regulation promising

43
Economics & Tobacco Control
Effective tobacco control makes good economic sense:– Taxes can increase revenues AND decrease demand
– Restaurants and bars that become smoke-free will maintain or increase their business AND protect health of workers & patrons
– Farmers can be successfully transitioned away from tobacco growing
– Health gains lead to increased productivity and faster economic development

Tobacco-Related Employment
• Very small share of employment dependent on tobacco growing and manufacturing in most countries
• Net gains in total employment with reductions in tobacco use as expenditures are redistributed and specific sectors (e.g., hospitality) improve.
• Employment losses in tobacco-related areas are small and gradual over time.
• Can use revenues from tobacco taxes to help those in tobacco growing/manufacturing shift to other sustainable livelihoods

45
Tobacco Control & Development
Tobacco control can help achieve Millennium Development Goals• Eradicate extreme poverty & hunger• Achieve universal primary education• Promote gender equality• Reduce child mortality• Improve maternal health• Combat HIV/AIDS, malaria & other diseases• Ensure environmental sustainability• Develop global partnership for development
Source: WHO 2004

46
Globalization of Tobacco Industry
• Opening of markets through bilateral, regional, and global trade agreements
• Loosening of restrictions on foreign direct investment
• Privatization of government run tobacco companies A few significant exceptions
• Consolidation among multinational tobacco companies

Globalization of Tobacco Industry
Sources: Maxwell Tobacco Fact Book, various years; Euromonitor, 2013; note: PMI includes Philip Morris International and Altria Group Inc.
Cigarette Company Market Shares, 1985-2011, Selected Years
0%
10%
20%
30%
40%
50%
60%
70%
80%
90%
100%
1985 1990 1995 2000 2006 2011
CNTC PMI BAT JTI ITG Others

48
Globalization and Challenges toNational Tobacco Control Policies
Trade disputes• Section 301 cases between US and Japan, South Korea,
Taiwan and Thailand• PM-Norway challenge to Norway’s retail display ban• Indonesia WTO challenge to US ban on flavored cigarettes
(except menthol)• Ukraine, Dominican Republic and Honduras challenge to
Australia’s plain packaging policy Investment disputes
• PMI challenge to Uruguay’s policy allowing only one brand variation to be sold
• PM-Asia challenge to Australia’s plain packaging policy Decisions to date support public health interests
over trade/investment interests

49
Globalization and Tobacco Control Governments should not impose unilateral
trade restrictions in efforts to reduce demand for tobacco products• Can negotiate exclusion of tobacco and tobacco
products from trade agreements as part of international, multilateral, and bilateral trade agreements (e.g. ongoing negotiations for the Trans-Pacific Partnership agreement)
Instead, adopt comprehensive tobacco control policies and programs that apply evenly to all tobacco products, regardless of origin

50
Evolution of Tobacco Products

51

0
1000
2000
3000
4000
5000
6000
7000
2010Q1
2010Q2
2010Q3
2010Q4
2011Q1
2011Q2
2011Q3
2011Q4
2012Q1
2012Q2
2012Q3
2012Q4
Sal
es V
olu
me
(th
ou
san
ds
of
pie
ces)
Cartridge E-Cig DisposableCartomizer & Automizer E-Cig Starter Kit
Electronic Cigarette SalesTotal US Market – Combined Convenience and FDM Stores (in thousands of
pieces)

53
Globalization of Tobacco ControlWHO FCTC
Gives priority to pubic health Recognizes need for
international action and cooperation
Evidence-based Mindful of potential social
and economic impact of tobacco control efforts
Concerned about role of industry

54
MPOWER Framework
MPOWER Framework• “Monitor” the tobacco
epidemic• “Protect” non-smokers• “Offer” help to quit• “Warn” about the harms• “Enforce” marketing bans• “Raise” taxes
Most cost-effective components of WHO FCTC

55
Key Tobacco Control PoliciesCost-Effectiveness
Source: WHO, unpublished data
$0
$1,000
$2,000
$3,000
$4,000
$5,000
$6,000
Increased taxation Comprehensiveadvertising ban
Clean indoor airlaws
Information andlabelling
NicotineReplacement
therapy
Cos
t p
er D
ALY
Ave
rted
High Income Upper Middle Income Lower Middle Income Low Income
Effective tobacco control makes good economic sense:
• Not just long-term public health, but near-term health and economic benefits
• Tobacco control will not harm economies
• Substantial impact in reducing health care costs, improving productivity, and fostering economic development.
Economic Impact of Tobacco Control