ECONOMICS OF STORAGE LoCal Meeting - July 8, 2009 Presented by Mike He and Prabal Dutta.
27
ECONOMICS OF STORAGE LoCal Meeting - July 8, 2009 Presented by Mike He and Prabal Dutta
-
date post
22-Dec-2015 -
Category
Documents
-
view
217 -
download
0
Transcript of ECONOMICS OF STORAGE LoCal Meeting - July 8, 2009 Presented by Mike He and Prabal Dutta.

ECONOMICS OF STORAGE LoCal Meeting - July 8, 2009
Presented by Mike He and Prabal Dutta
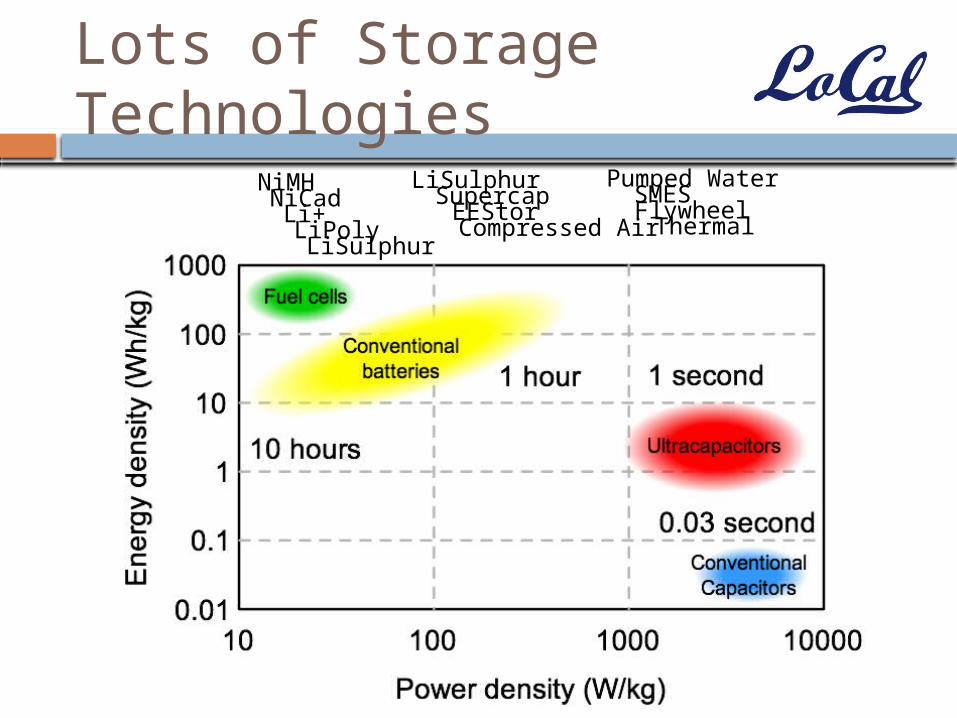
Lots of Storage Technologies
NiMHNiCad
Li+LiPoly
LiSulphur
LiSulphurSupercap
EEStorCompressed Air
Pumped WaterSMES
FlywheelThermal
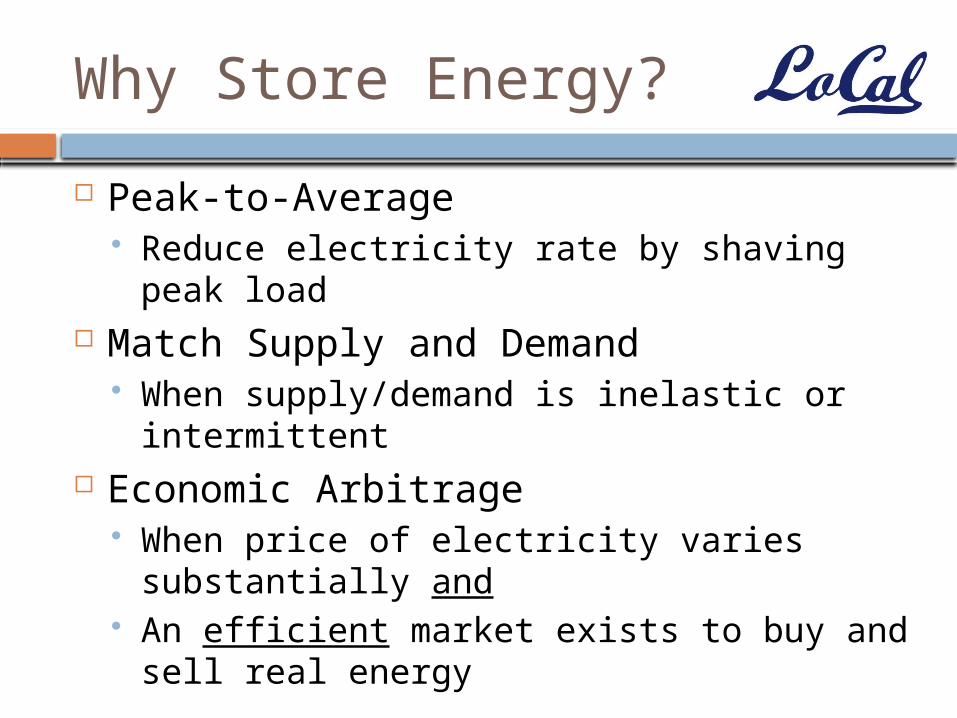
Why Store Energy?
Peak-to-Average Reduce electricity rate by shaving peak
load Match Supply and Demand
When supply/demand is inelastic or intermittent
Economic Arbitrage When price of electricity varies
substantially and An efficient market exists to buy and sell
real energy
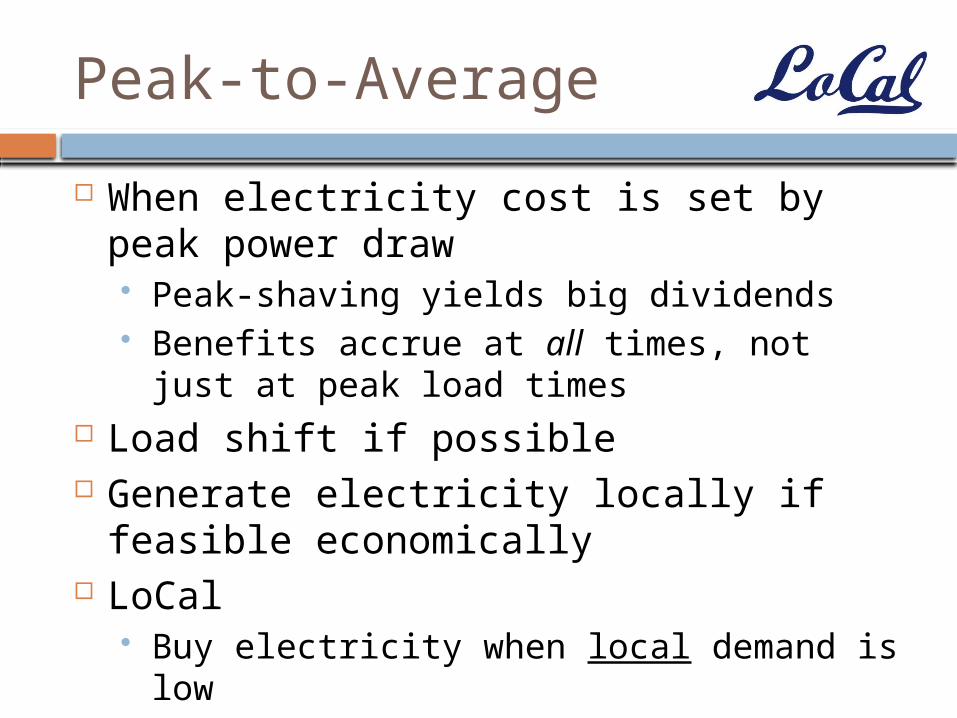
Peak-to-Average
When electricity cost is set by peak power draw Peak-shaving yields big dividends Benefits accrue at all times, not just at
peak load times Load shift if possible Generate electricity locally if feasible
economically LoCal
Buy electricity when local demand is low Convert and store electricity for later use Convert and use electricity when highest
local demand
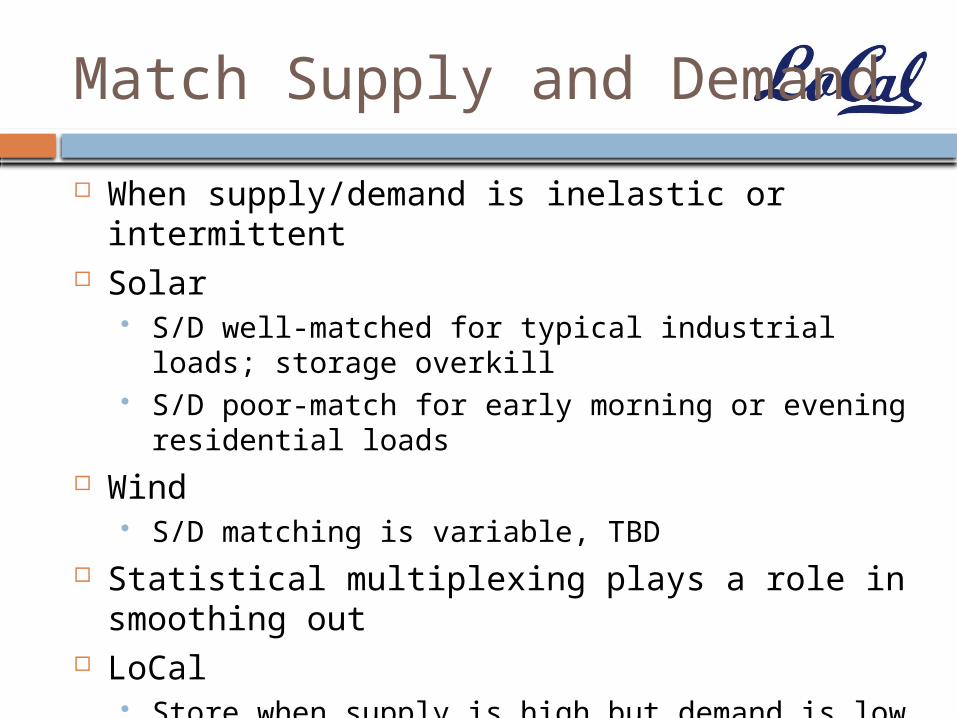
Match Supply and Demand
When supply/demand is inelastic or intermittent
Solar S/D well-matched for typical industrial loads;
storage overkill S/D poor-match for early morning or evening
residential loads Wind
S/D matching is variable, TBD Statistical multiplexing plays a role in
smoothing out LoCal
Store when supply is high but demand is low Use when supply is low but demand is high
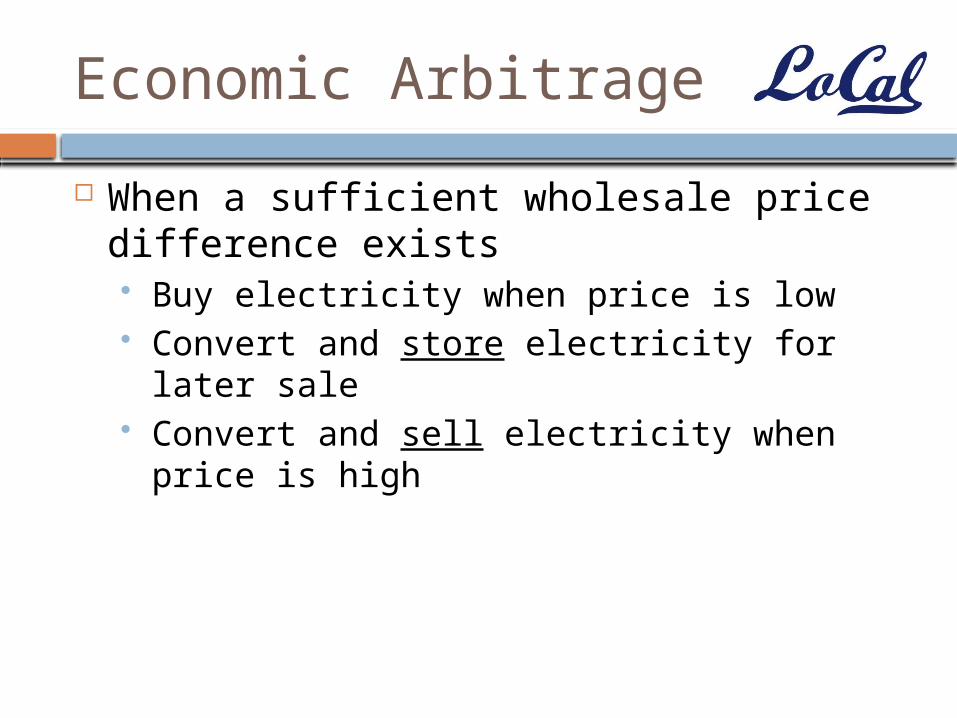
Economic Arbitrage
When a sufficient wholesale price difference exists Buy electricity when price is low Convert and store electricity for later sale Convert and sell electricity when price is
high
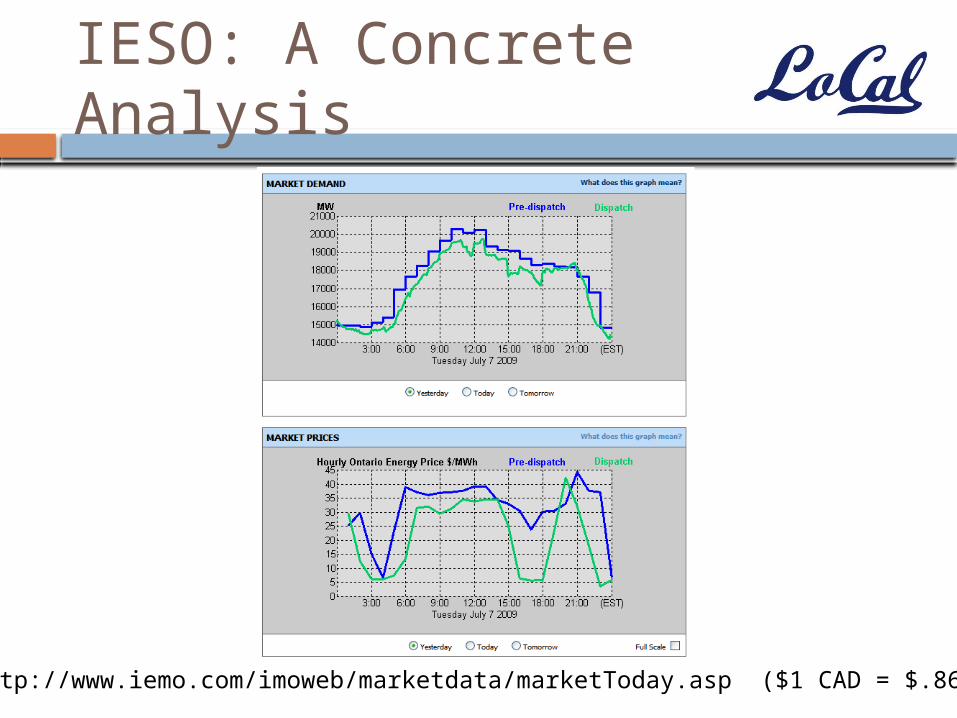
IESO: A Concrete Analysis
http://www.iemo.com/imoweb/marketdata/marketToday.asp ($1 CAD = $.86 USD)
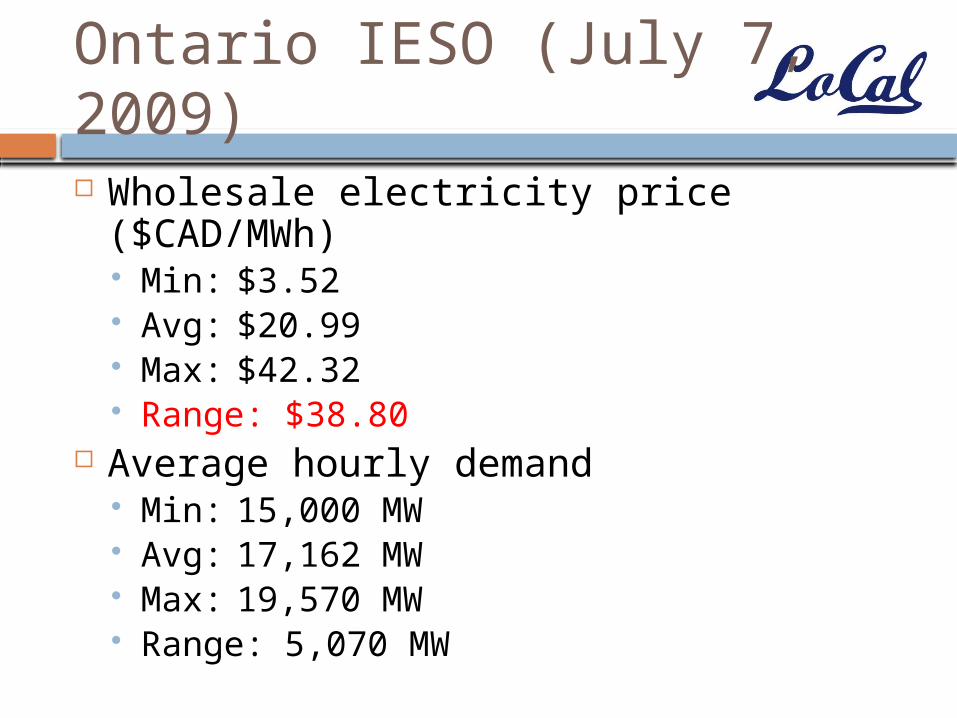
Ontario IESO (July 7, 2009)
Wholesale electricity price ($CAD/MWh) Min: $3.52 Avg: $20.99 Max: $42.32 Range: $38.80
Average hourly demand Min: 15,000 MW Avg: 17,162 MW Max: 19,570 MW Range: 5,070 MW
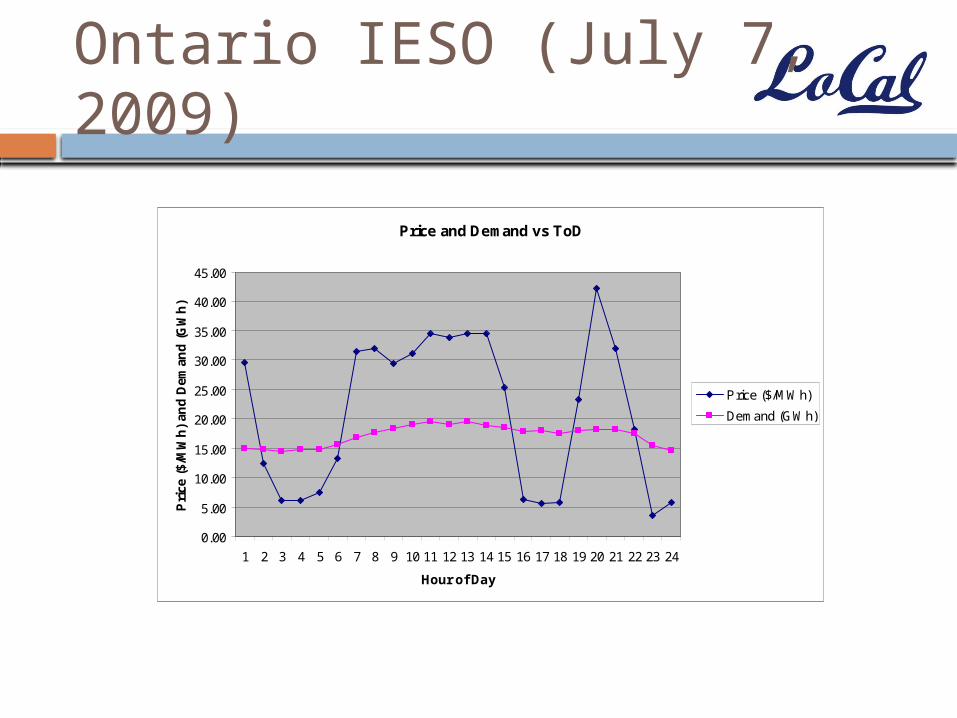
Ontario IESO (July 7, 2009)
Price and Demand vs ToD
0.00
5.00
10.00
15.00
20.00
25.00
30.00
35.00
40.00
45.00
1 2 3 4 5 6 7 8 9 10 11 12 13 14 15 16 17 18 19 20 21 22 23 24
Hour of Day
Pri
ce (
$/M
Wh
) an
d D
eman
d (
GW
h)
Price ($/MWh)
Demand (GWh)
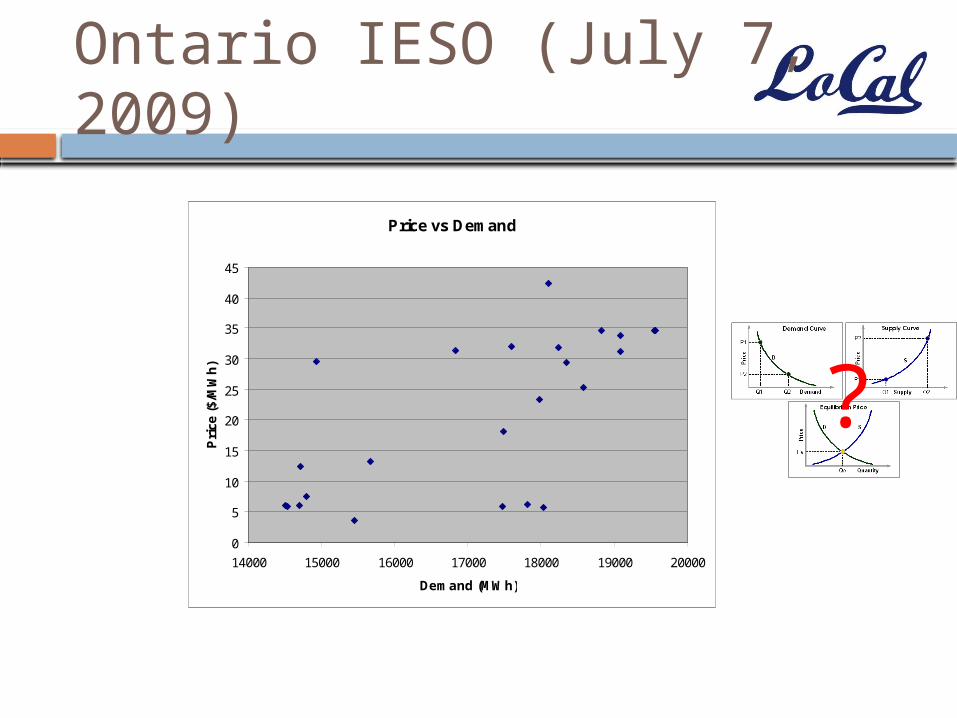
Ontario IESO (July 7, 2009)
Price vs Demand
0
5
10
15
20
25
30
35
40
45
14000 15000 16000 17000 18000 19000 20000
Demand (MWh)
Pri
ce (
$/M
Wh
)
?
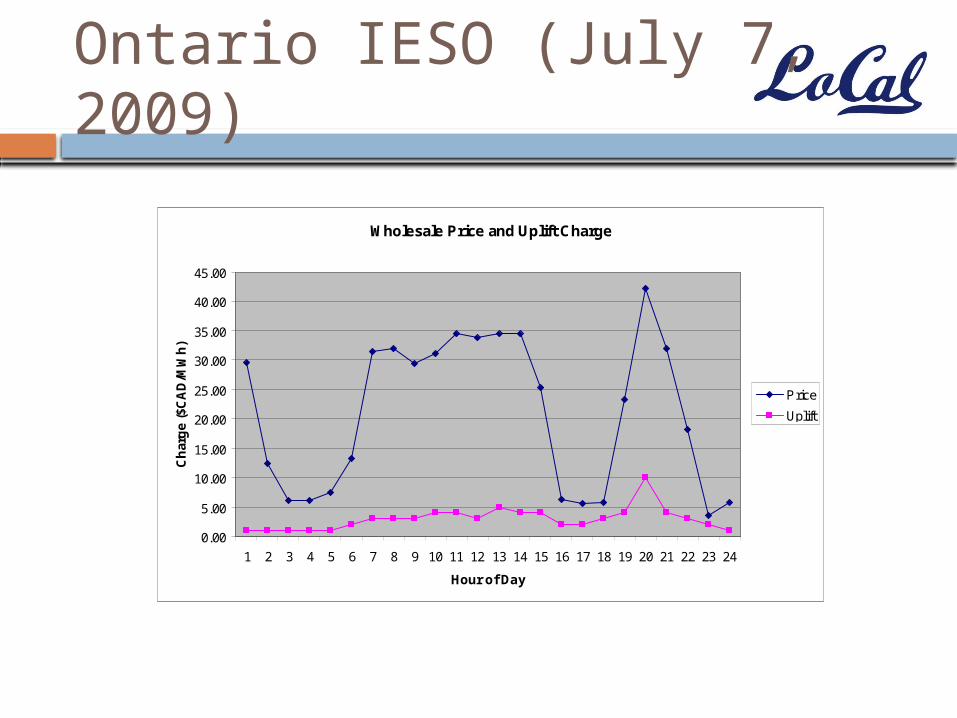
Ontario IESO (July 7, 2009)
Wholesale Price and Uplift Charge
0.00
5.00
10.00
15.00
20.00
25.00
30.00
35.00
40.00
45.00
1 2 3 4 5 6 7 8 9 10 11 12 13 14 15 16 17 18 19 20 21 22 23 24
Hour of Day
Ch
arg
e ($
CA
D/M
Wh
)
Price
Uplift
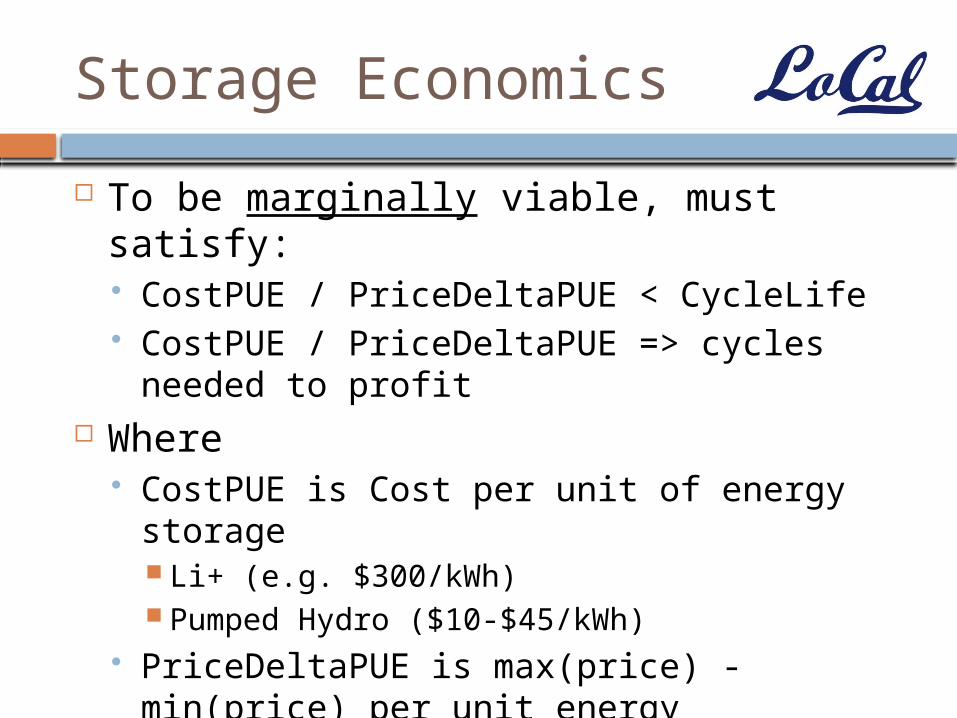
Storage Economics
To be marginally viable, must satisfy: CostPUE / PriceDeltaPUE < CycleLife CostPUE / PriceDeltaPUE => cycles needed
to profit Where
CostPUE is Cost per unit of energy storage Li+ (e.g. $300/kWh) Pumped Hydro ($10-$45/kWh)
PriceDeltaPUE is max(price) - min(price) per unit energy
CycleLife is number of cycles of storage technology
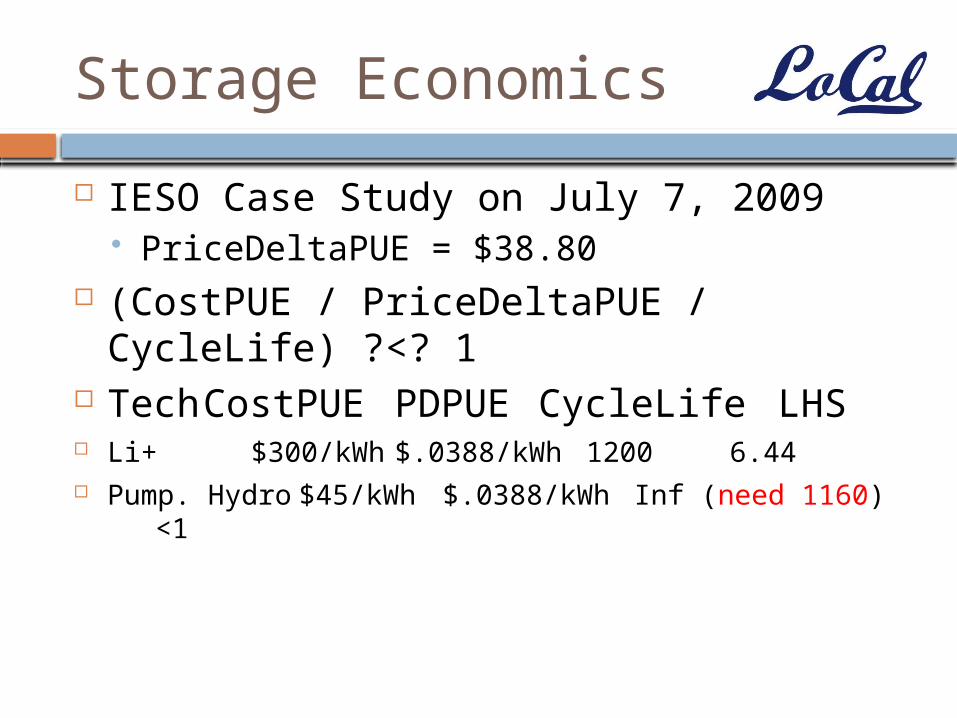
Storage Economics
IESO Case Study on July 7, 2009 PriceDeltaPUE = $38.80
(CostPUE / PriceDeltaPUE / CycleLife) ?<? 1
Tech CostPUE PDPUE CycleLife LHS Li+ $300/kWh $.0388/kWh 1200
6.44 Pump. Hydro $45/kWh $.0388/kWh Inf (need 1160)
<1
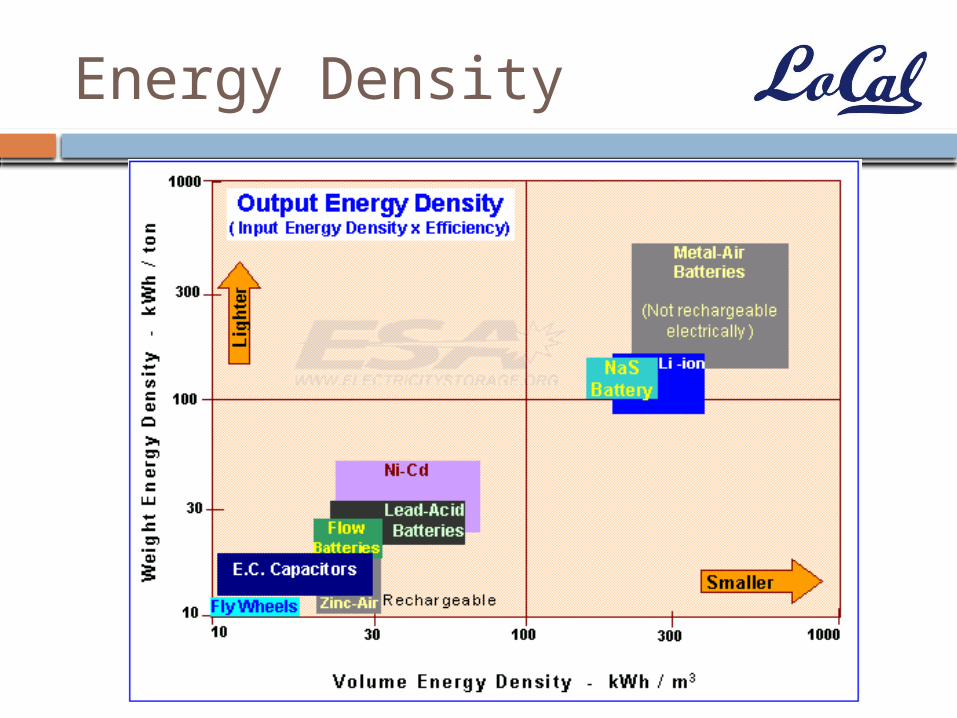
Energy Density
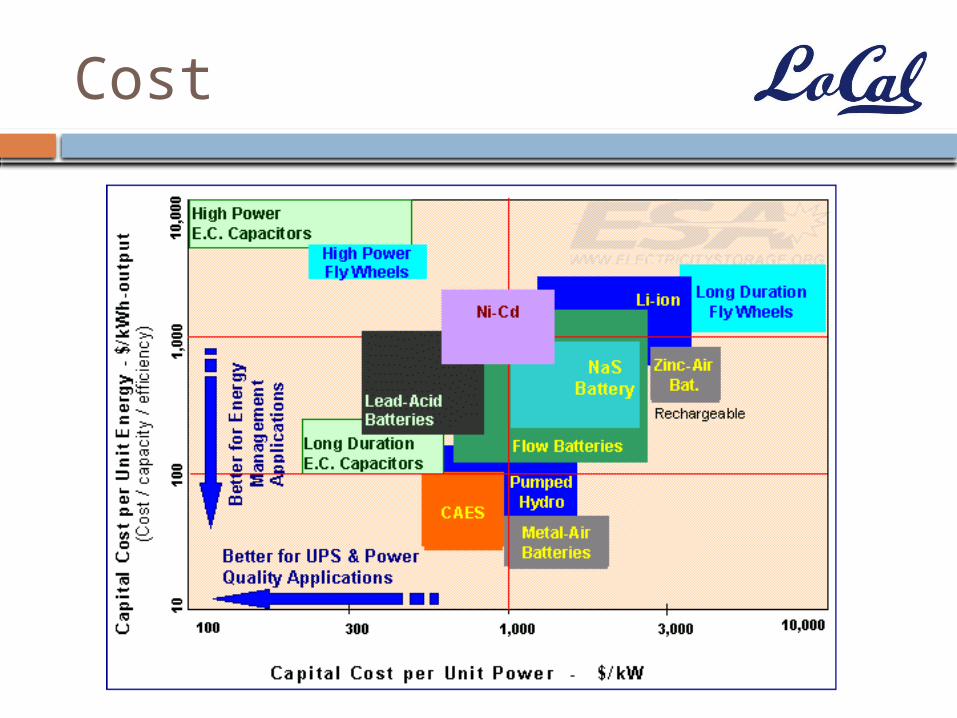
Cost
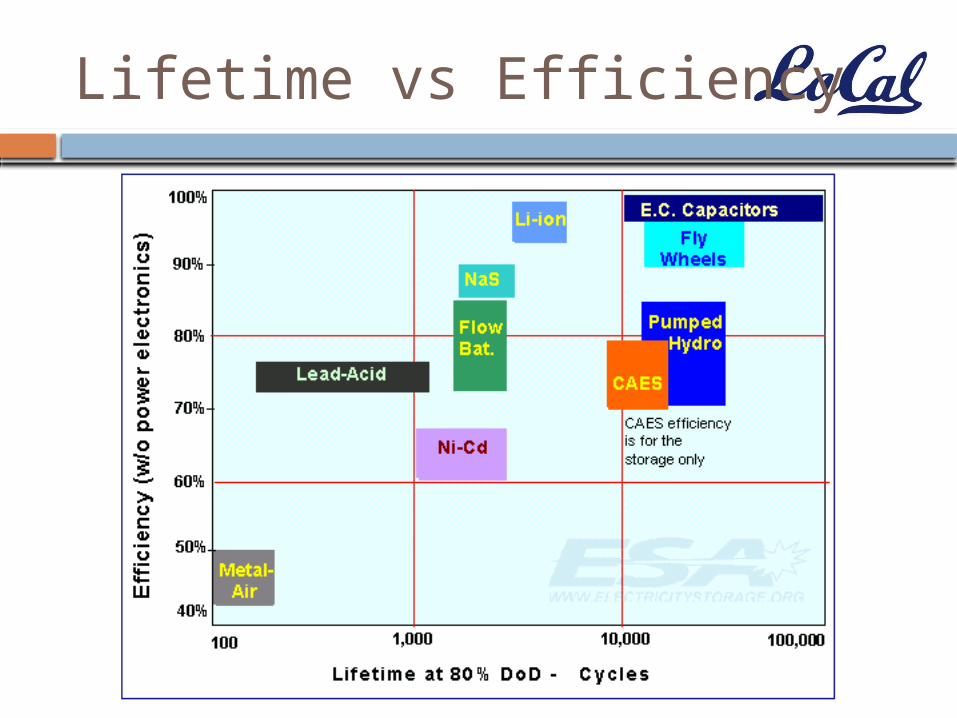
Lifetime vs Efficiency
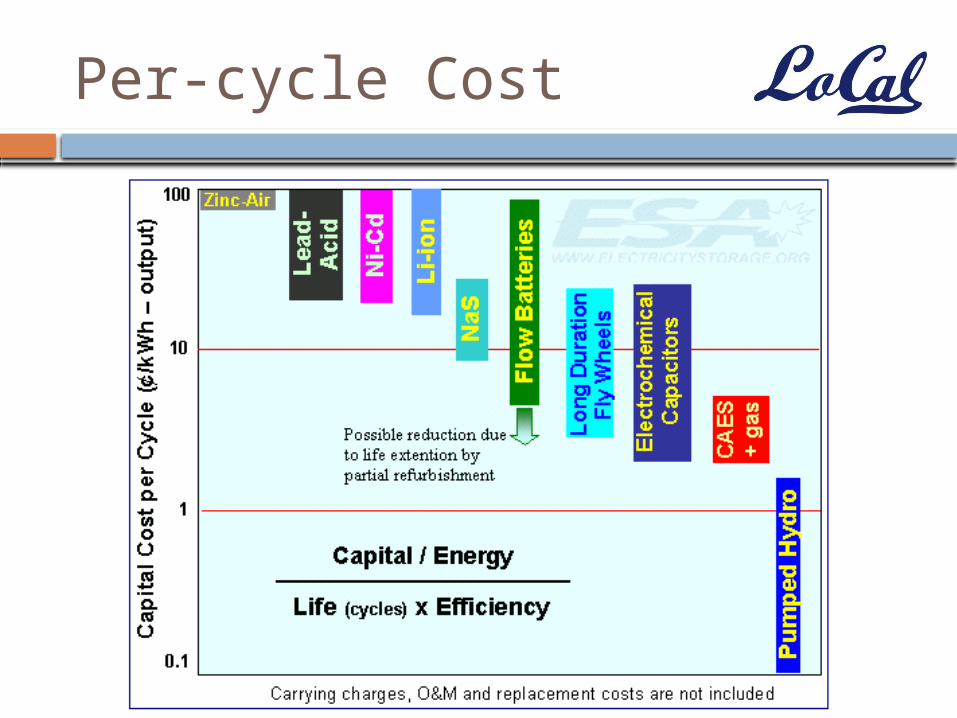
Per-cycle Cost
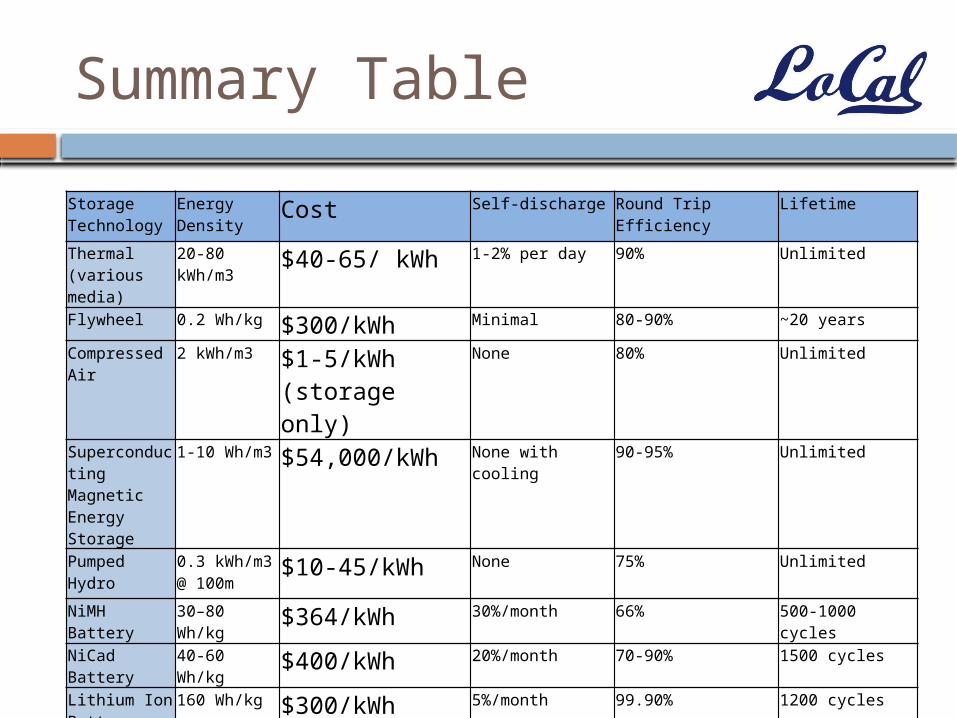
Summary Table
Storage Technology
Energy Density Cost Self-discharge Round Trip Efficiency Lifetime
Thermal (various media)
20-80 kWh/m3 $40-65/ kWh 1-2% per day 90% Unlimited
Flywheel 0.2 Wh/kg $300/kWh Minimal 80-90% ~20 years
Compressed Air 2 kWh/m3 $1-5/kWh (storage only)
None 80% Unlimited
Superconducting Magnetic Energy Storage
1-10 Wh/m3 $54,000/kWh None with cooling 90-95% Unlimited
Pumped Hydro 0.3 kWh/m3 @ 100m
$10-45/kWh None 75% Unlimited
NiMH Battery 30–80 Wh/kg $364/kWh 30%/month 66% 500-1000 cycles
NiCad Battery 40-60 Wh/kg $400/kWh 20%/month 70-90% 1500 cycles
Lithium Ion Battery
160 Wh/kg $300/kWh 5%/month 99.90% 1200 cycles
Lithum Polymer Battery
130-200 Wh/kg $500/kWh 10%/month 99.50% 1000 cycles
Lead Acid Battery
30-40 Wh/kg $100-200/kWh 3%-4%/month 70%-92% 500-800 cycles
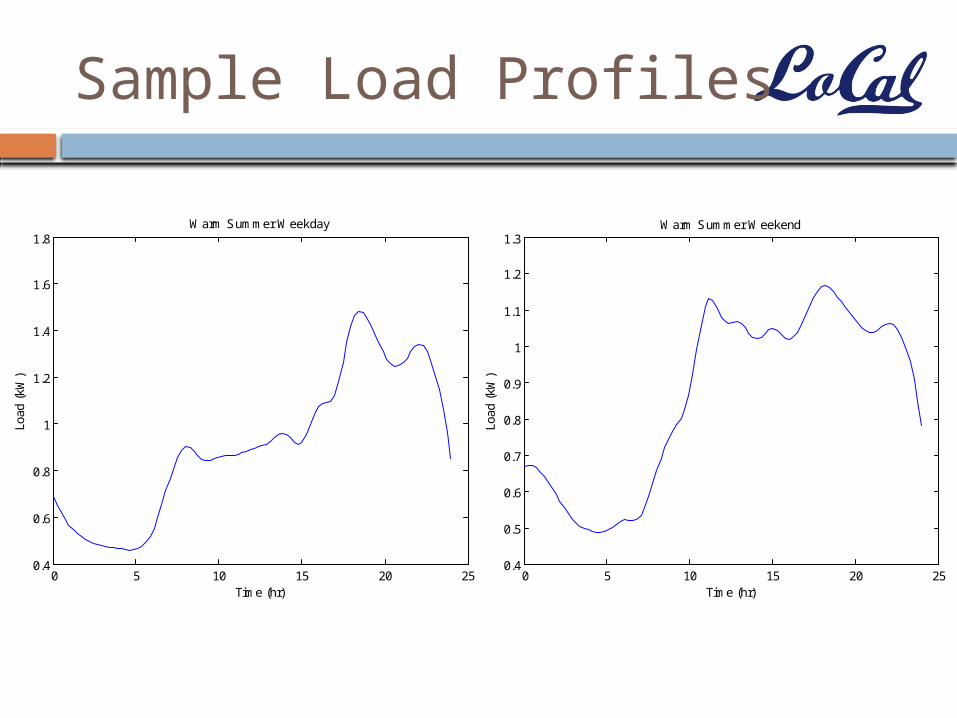
Sample Load Profiles
0 5 10 15 20 250.4
0.6
0.8
1
1.2
1.4
1.6
1.8
Time (hr)
Load
(kW
)
Warm Summer Weekday
0 5 10 15 20 250.4
0.5
0.6
0.7
0.8
0.9
1
1.1
1.2
1.3
Time (hr)
Load
(kW
)
Warm Summer Weekend
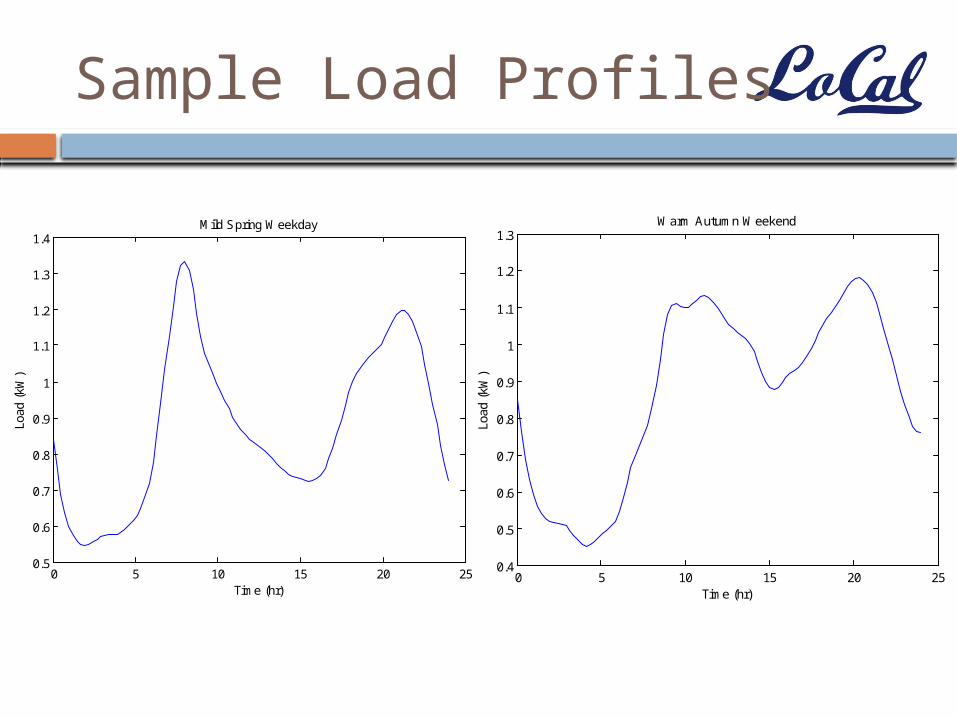
Sample Load Profiles
0 5 10 15 20 250.5
0.6
0.7
0.8
0.9
1
1.1
1.2
1.3
1.4
Time (hr)
Load
(kW
)
Mild Spring Weekday
0 5 10 15 20 250.4
0.5
0.6
0.7
0.8
0.9
1
1.1
1.2
1.3
Time (hr)
Load
(kW
)
Warm Autumn Weekend
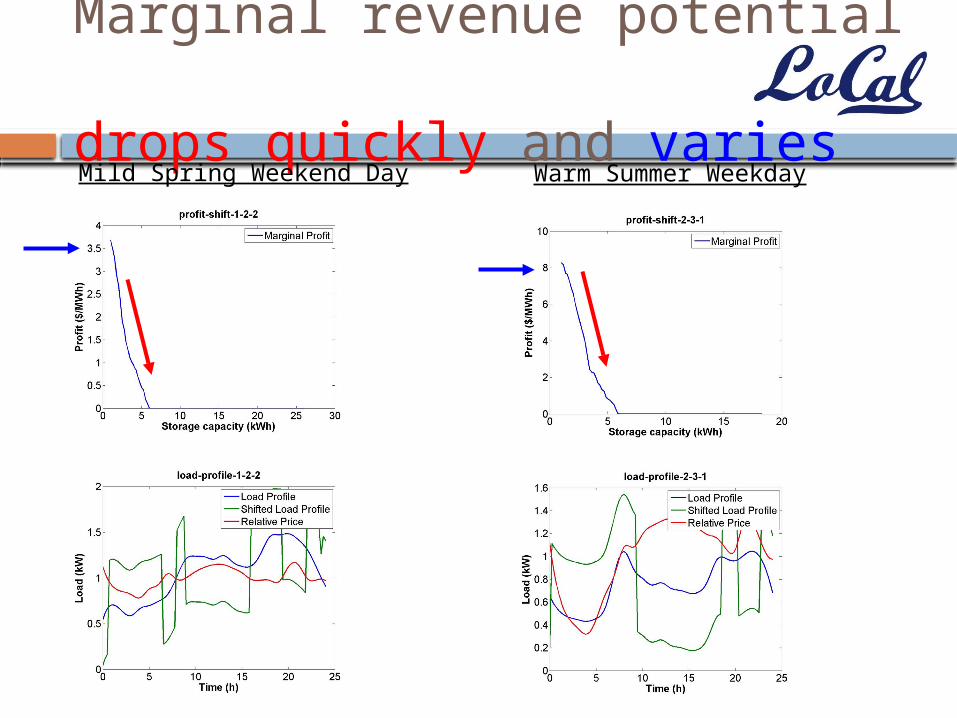
Marginal revenue potential drops quickly and varies
Mild Spring Weekend Day Warm Summer Weekday
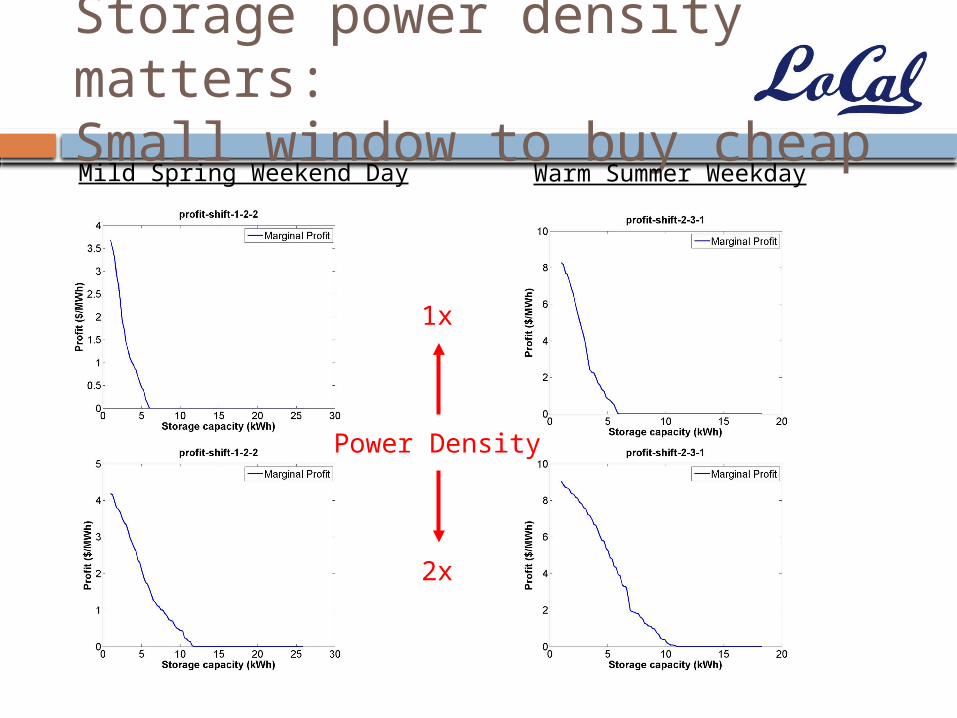
Storage power density matters:Small window to buy cheap
Mild Spring Weekend Day Warm Summer Weekday
1x
Power Density
2x
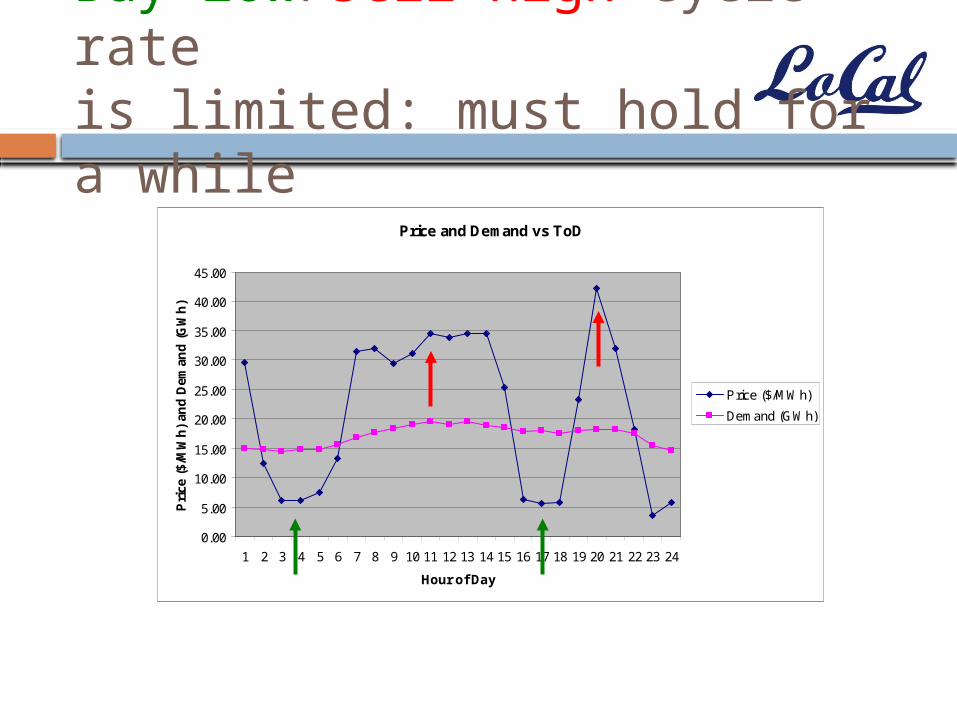
Buy-low/sell-high cycle rateis limited: must hold for a while
Price and Demand vs ToD
0.00
5.00
10.00
15.00
20.00
25.00
30.00
35.00
40.00
45.00
1 2 3 4 5 6 7 8 9 10 11 12 13 14 15 16 17 18 19 20 21 22 23 24
Hour of Day
Pri
ce (
$/M
Wh
) an
d D
eman
d (
GW
h)
Price ($/MWh)
Demand (GWh)
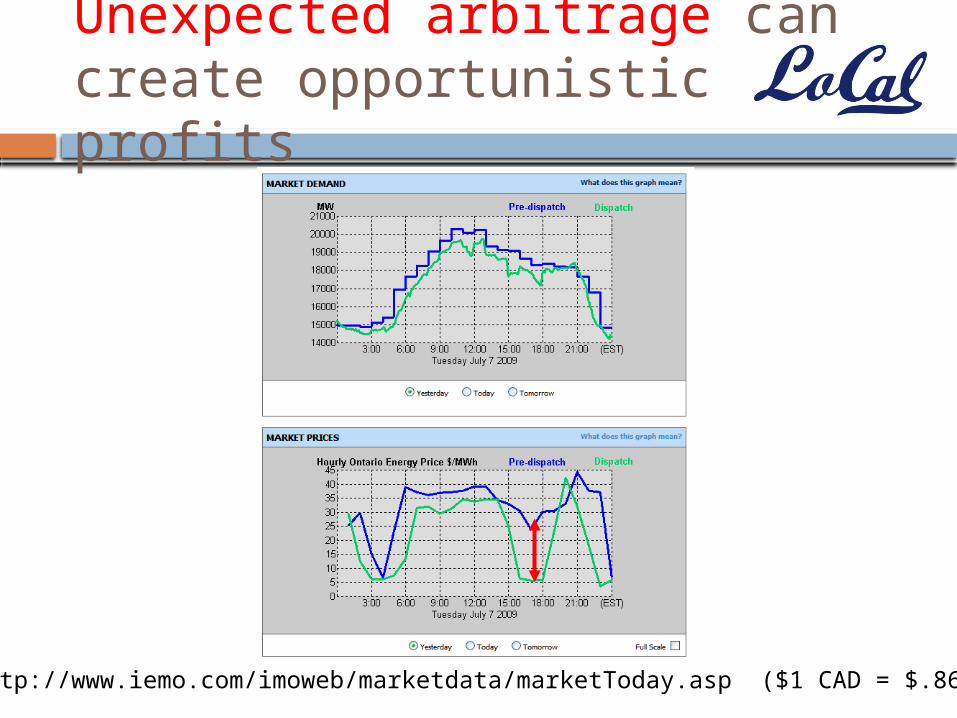
Unexpected arbitrage cancreate opportunistic profits
http://www.iemo.com/imoweb/marketdata/marketToday.asp ($1 CAD = $.86 USD)
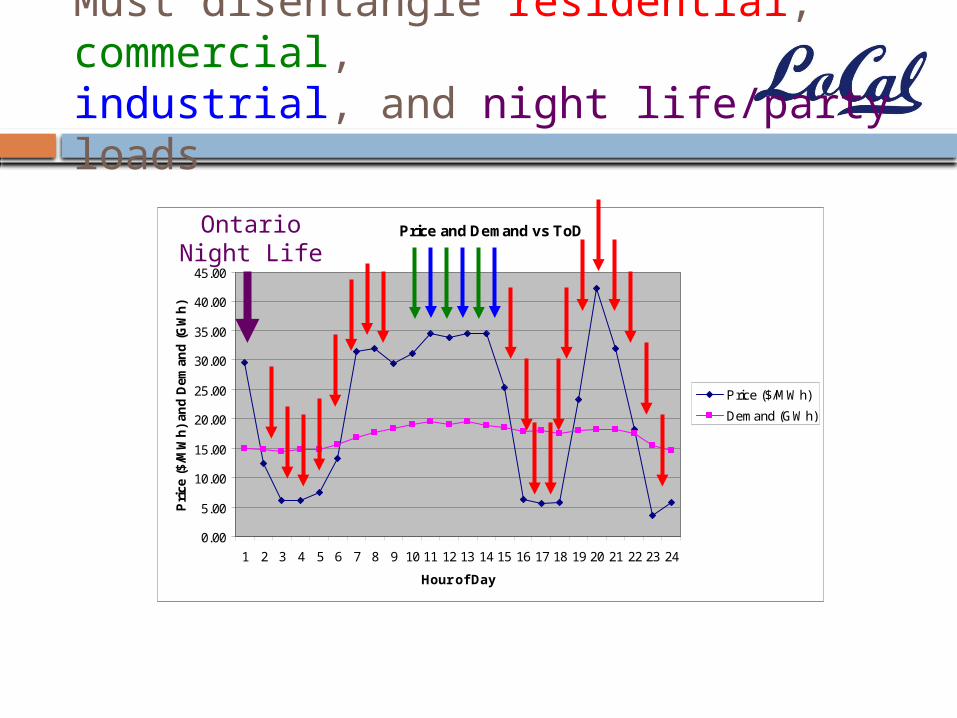
Must disentangle residential, commercial, industrial, and night life/party loads
Price and Demand vs ToD
0.00
5.00
10.00
15.00
20.00
25.00
30.00
35.00
40.00
45.00
1 2 3 4 5 6 7 8 9 10 11 12 13 14 15 16 17 18 19 20 21 22 23 24
Hour of Day
Pri
ce (
$/M
Wh
) an
d D
eman
d (
GW
h)
Price ($/MWh)
Demand (GWh)
OntarioNight Life
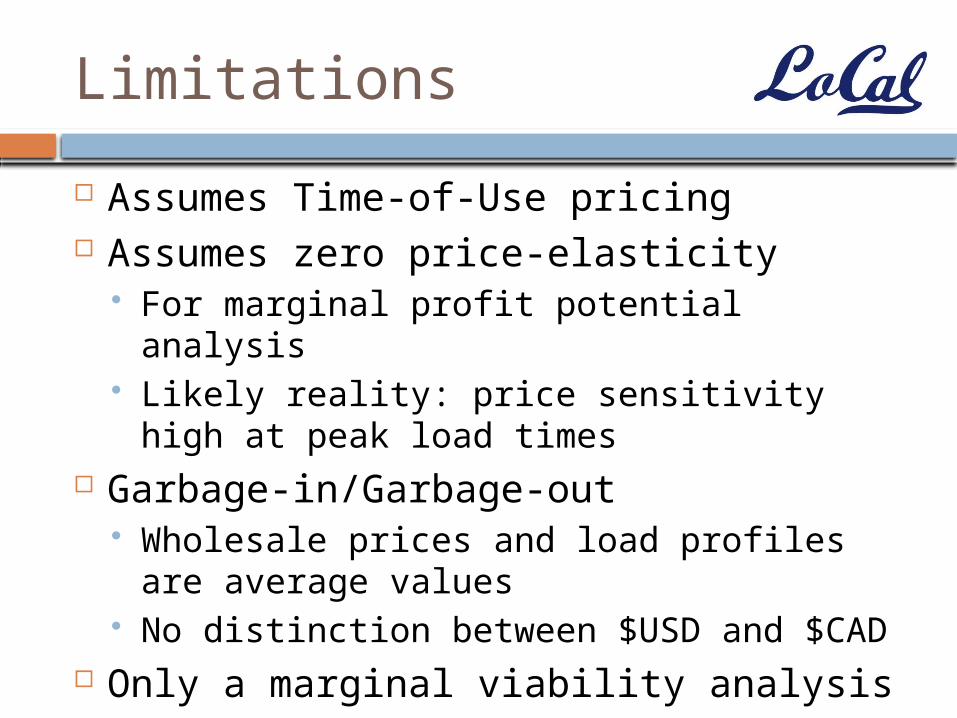
Limitations
Assumes Time-of-Use pricing Assumes zero price-elasticity
For marginal profit potential analysis Likely reality: price sensitivity high at peak
load times Garbage-in/Garbage-out
Wholesale prices and load profiles are average values
No distinction between $USD and $CAD Only a marginal viability analysis
Average-case viability much lower
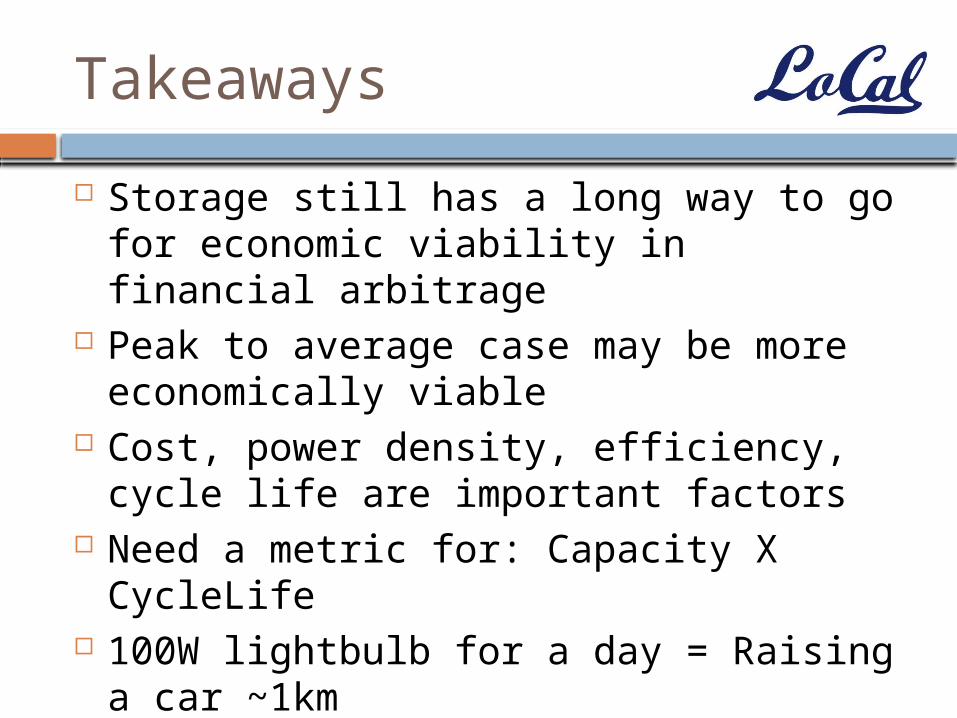
Takeaways
Storage still has a long way to go for economic viability in financial arbitrage
Peak to average case may be more economically viable
Cost, power density, efficiency, cycle life are important factors
Need a metric for: Capacity X CycleLife 100W lightbulb for a day = Raising a car
~1km