
Economics of Competing Crypto Currencies: Monetary Policy...
55
Economics of Competing Crypto Currencies: Monetary Policy, Miner Reward and Historical Evolution MSc Financial Computing 2013/2014 Author: Yiteng Zhang Supervisor: Dr. Nicolas T. Courtois Guangyan Song This report is submitted as part requirement for the MSc Degree in Financial Computing at University College London. It is substantially the result of my own work except where explicitly indicated in the text.
Transcript of Economics of Competing Crypto Currencies: Monetary Policy...
Economics of Competing Crypto
Currencies: Monetary Policy, Miner
Reward and Historical Evolution
MSc Financial Computing
2013/2014
Author: Yiteng Zhang
Supervisor: Dr. Nicolas T. Courtois
Guangyan Song
This report is submitted as part requirement for the MSc Degree in Financial
Computing at University College London. It is substantially the result of my own
work except where explicitly indicated in the text.
i
Content
Abstract ................................................................................................................................................ 1
Chapter 1 Introduction .......................................................................................................................... 2
1.1 Cryptocurrency Review .............................................................................................................. 2
1.1.1 Bitcoin review...................................................................................................................... 2
1.1.2 Altcoin ................................................................................................................................. 6
1.2 Motivation .................................................................................................................................. 9
Chapter 2 Technical Backgrounds ...................................................................................................... 11
2.1 Bitcoin Introduction .................................................................................................................. 11
2.1.1 Transaction ........................................................................................................................ 11
2.1.2 Mining ............................................................................................................................... 12
2.1.3 Block Chain ....................................................................................................................... 13
2.2 Altcoin Introduction ................................................................................................................. 14
Chapter 3 Monetary policy and Cryptocurrencies .............................................................................. 15
3.1 Monetary policy and money supply .......................................................................................... 15
3.1.1 Fiat Money vs. Commodity Money ................................................................................... 15
3.1.2 Cryptocurrency and Money Functions ............................................................................... 16
3.1.3 Macroeconomics and Monetary Policy .............................................................................. 17
3.2 Cryptocurrencies: Fixed Monetary Supply and Deflationary Monetary Policies ...................... 19
3.2.1 Modern Monetary Policy ................................................................................................... 19
3.2.2 Cryptocurrency Monetary Policy ....................................................................................... 20
Chapter 4 Case Study ......................................................................................................................... 22
4.1 Bitcoin ...................................................................................................................................... 22
4.2 Litecoin Case Study and Historical Evolution .......................................................................... 24
4.3 Dogecoin Case Study and Historical Evolution ........................................................................ 28
4.4 Reddcoin ................................................................................................................................... 33
Chapter 5 Conclusions and Further Research ..................................................................................... 38
5.1 Conclusions .............................................................................................................................. 38
5.2 Future Research ........................................................................................................................ 39
Reference............................................................................................................................................ 40
Appendix ............................................................................................................................................ 42
1
Abstract
Since bitcoin came to the world in 2009, numerous cryptocurrencies have been created.
Some thrive and enjoy their glorious moment but many more digital coins have faded into
darkness. Still, cryptocurrency has been treated as a great technological breakthrough, and
many papers have been published either to study and improve the algorithms behind it or to
discuss the fundamental flaw in its design.
However, not much research has been conducted from economic point of view on
cryptocurrency. This paper aims to cover this gap and to study cryptocurrency using
macroeconomic tools.
In this thesis, we reviewed historic evolution of bitcoin, litecoin, dogecoin and reddcoin and
reasons have been proposed to justify their market price fluctuation. We outlined the
relationship between miners reward and market price, and also studied the monetary policy
for each of these four cryptocurrencies. Future coin growth rates and projected total number
of coins in circulation are also calculated to help understand the monetary policy for them.
2
Chapter 1 Introduction
1.1 Cryptocurrency Review
1.1.1 Bitcoin review
Milton Friedman, a Nobel laureate, is an advocate of decentralised financial regulation
system1, and he once famously claimed in the last century that he preferred “abolishing the
Federal Reserve and replacing it with a computer”2.
It seemed that the foundation stone of his “ideal world” had been finally laid in 2009, neither
by any central banks nor by any well-known economists. In fact, it still remains mysterious
who “made the dream comes true”. The foundation stone mentioned earlier is bitcoin, and as
the oldest member in cryptocurrency bitcoin made the world stage debut in 20093. It was
tagged as the worlds “first decentralised digital currency” by many media and academics.1
Bitcoins were only circulated within the enthusiasts’ community in the early days. But on
18th
May 2010, user Laszlo posted that he would like to “pay 10,000 bitcoins for a couple of
pizzas” on bitcointalk.org9. Later evidence suggested that he successfully bought pizza with
bitcoins. This is the first recorded real-world transaction and it is the first time for bitcoin to
fulfil its function as medium of exchange like conventional money. Bitcoin price
experienced a slow but steady growth in 2012, but since early 2013, bitcoin saw a
dramatically rise in its price against US dollar, and the rally reached its peak on 29 Nov 2013
at $1120.40 per bitcoin.
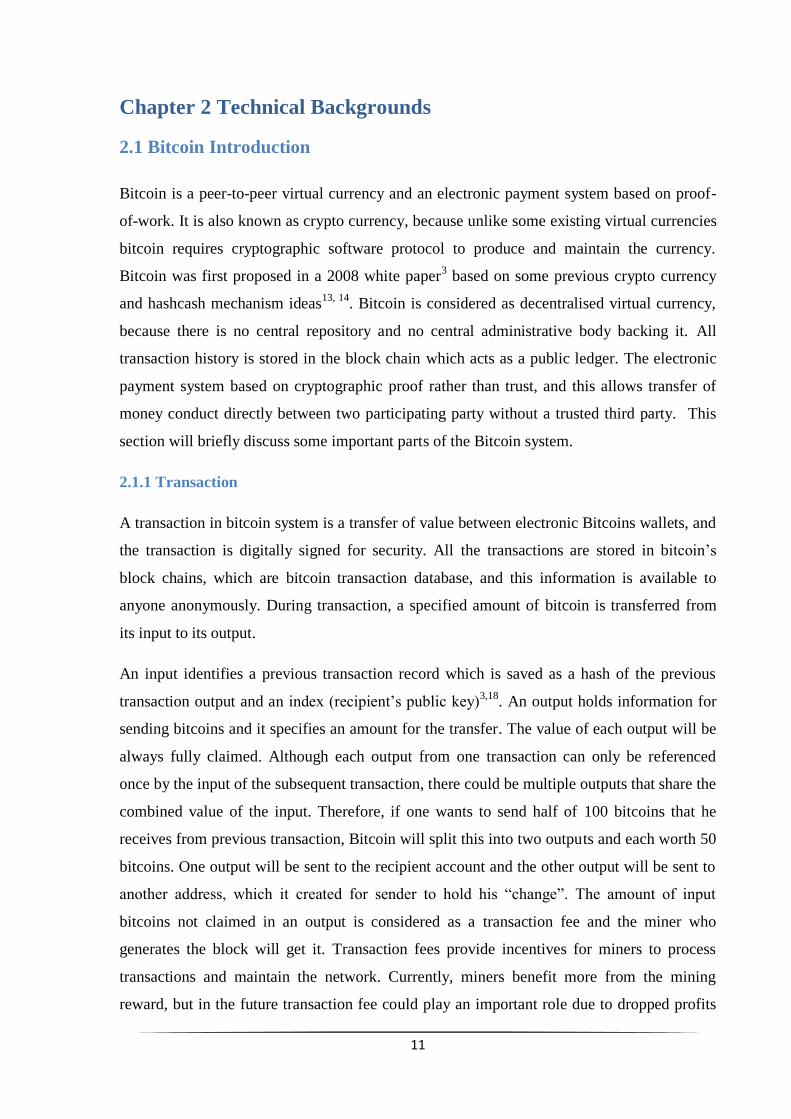
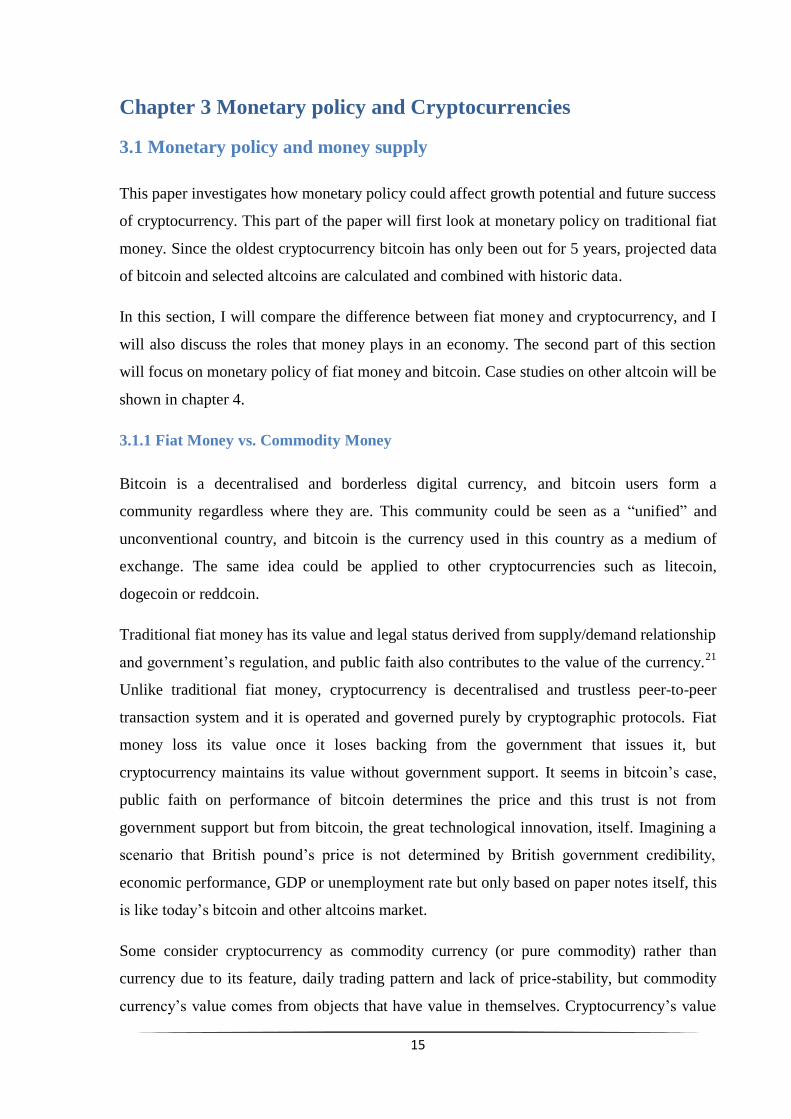
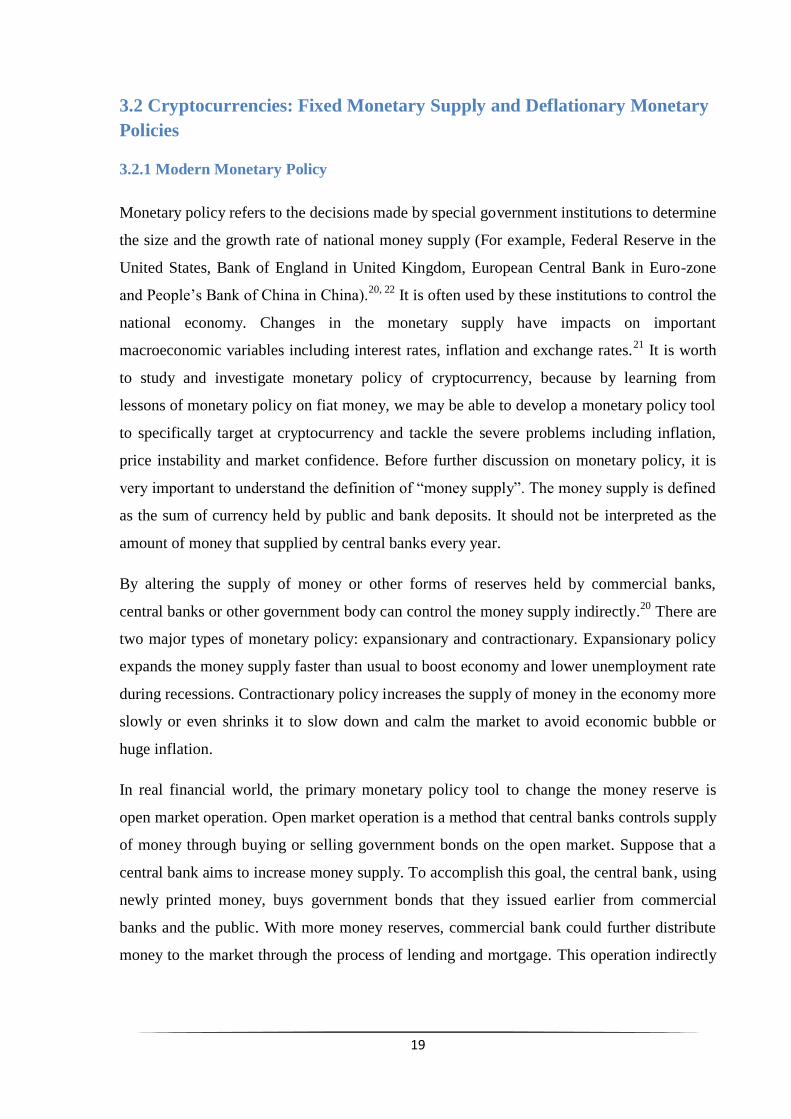
Since Cypriot Financial Crisis in 2013, the value of bitcoin has soared and it reached all-time
high on 29th
(Figure 1.1). The Cyprus crisis may not be the sole trigger of this, but it acted
like a detonate device that led to a spike in distrust of the government-backed currency. On
25th
March 2013, a €10 billion international bailout deal was struck to save Cyprus from a
disastrous national bankruptcy, and bitcoin price was increased radically since then. On 10th
Apr bitcoin hit $266 before plunging to $105, but the virtual currency was eventually
bouncing back to $130 on that day. The volatility did not put off traders and speculators, as
the bitcoin price still experienced a tenfold increase since the beginning of the year.
3
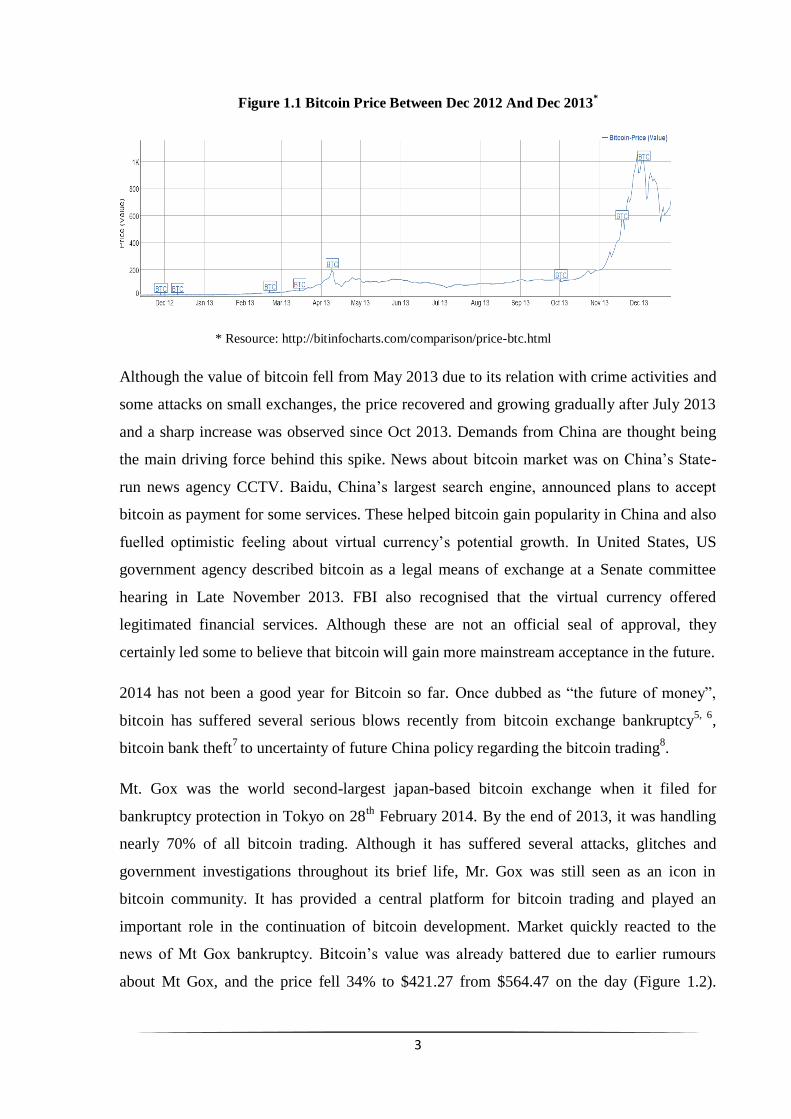
Figure 1.1 Bitcoin Price Between Dec 2012 And Dec 2013*
* Resource: http://bitinfocharts.com/comparison/price-btc.html
Although the value of bitcoin fell from May 2013 due to its relation with crime activities and
some attacks on small exchanges, the price recovered and growing gradually after July 2013
and a sharp increase was observed since Oct 2013. Demands from China are thought being
the main driving force behind this spike. News about bitcoin market was on China’s State-
run news agency CCTV. Baidu, China’s largest search engine, announced plans to accept
bitcoin as payment for some services. These helped bitcoin gain popularity in China and also
fuelled optimistic feeling about virtual currency’s potential growth. In United States, US
government agency described bitcoin as a legal means of exchange at a Senate committee
hearing in Late November 2013. FBI also recognised that the virtual currency offered
legitimated financial services. Although these are not an official seal of approval, they
certainly led some to believe that bitcoin will gain more mainstream acceptance in the future.
2014 has not been a good year for Bitcoin so far. Once dubbed as “the future of money”,
bitcoin has suffered several serious blows recently from bitcoin exchange bankruptcy5, 6
,
bitcoin bank theft7 to uncertainty of future China policy regarding the bitcoin trading
8.
Mt. Gox was the world second-largest japan-based bitcoin exchange when it filed for
bankruptcy protection in Tokyo on 28th
February 2014. By the end of 2013, it was handling
nearly 70% of all bitcoin trading. Although it has suffered several attacks, glitches and
government investigations throughout its brief life, Mr. Gox was still seen as an icon in
bitcoin community. It has provided a central platform for bitcoin trading and played an
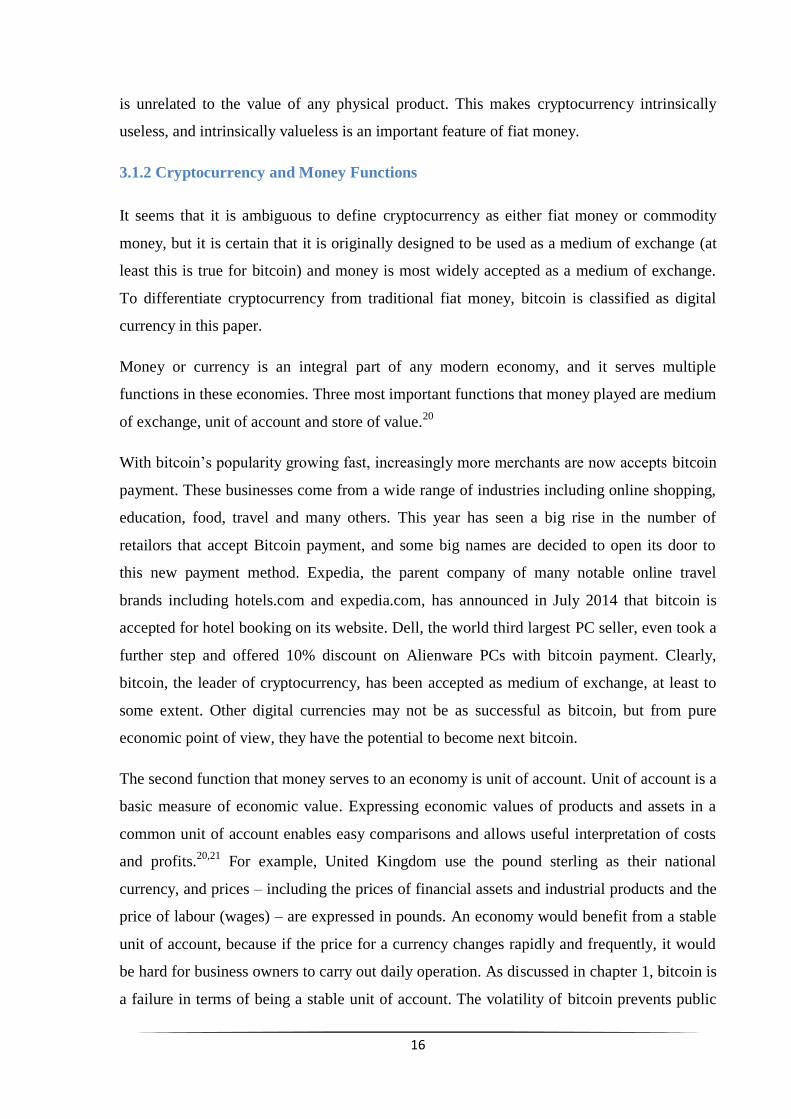
important role in the continuation of bitcoin development. Market quickly reacted to the
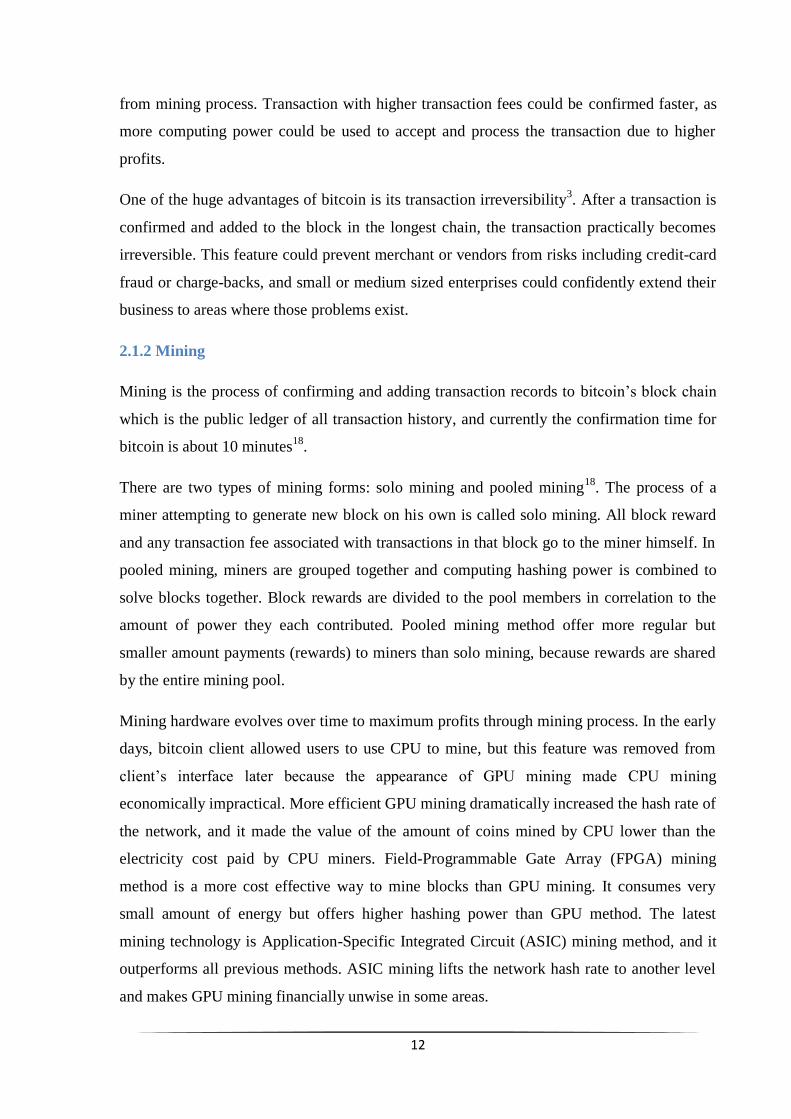
news of Mt Gox bankruptcy. Bitcoin’s value was already battered due to earlier rumours
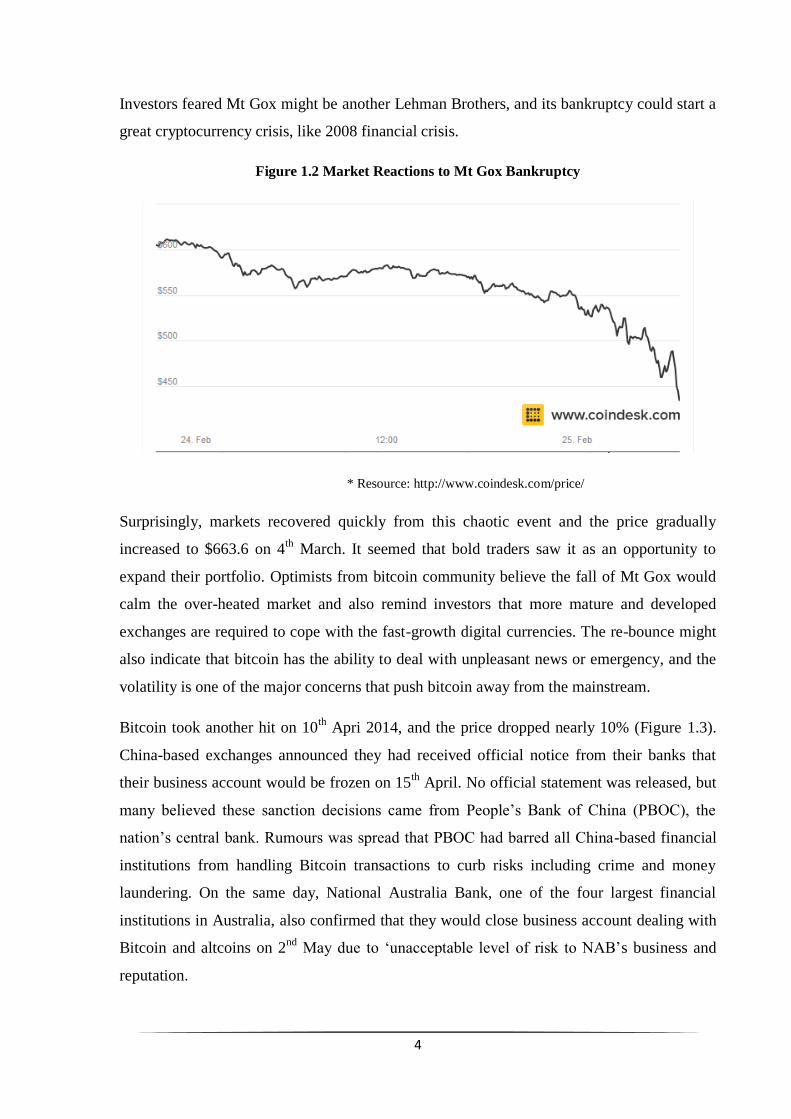
about Mt Gox, and the price fell 34% to $421.27 from $564.47 on the day (Figure 1.2).
4
Investors feared Mt Gox might be another Lehman Brothers, and its bankruptcy could start a
great cryptocurrency crisis, like 2008 financial crisis.
Figure 1.2 Market Reactions to Mt Gox Bankruptcy
* Resource: http://www.coindesk.com/price/
Surprisingly, markets recovered quickly from this chaotic event and the price gradually
increased to $663.6 on 4th
March. It seemed that bold traders saw it as an opportunity to
expand their portfolio. Optimists from bitcoin community believe the fall of Mt Gox would
calm the over-heated market and also remind investors that more mature and developed
exchanges are required to cope with the fast-growth digital currencies. The re-bounce might
also indicate that bitcoin has the ability to deal with unpleasant news or emergency, and the
volatility is one of the major concerns that push bitcoin away from the mainstream.
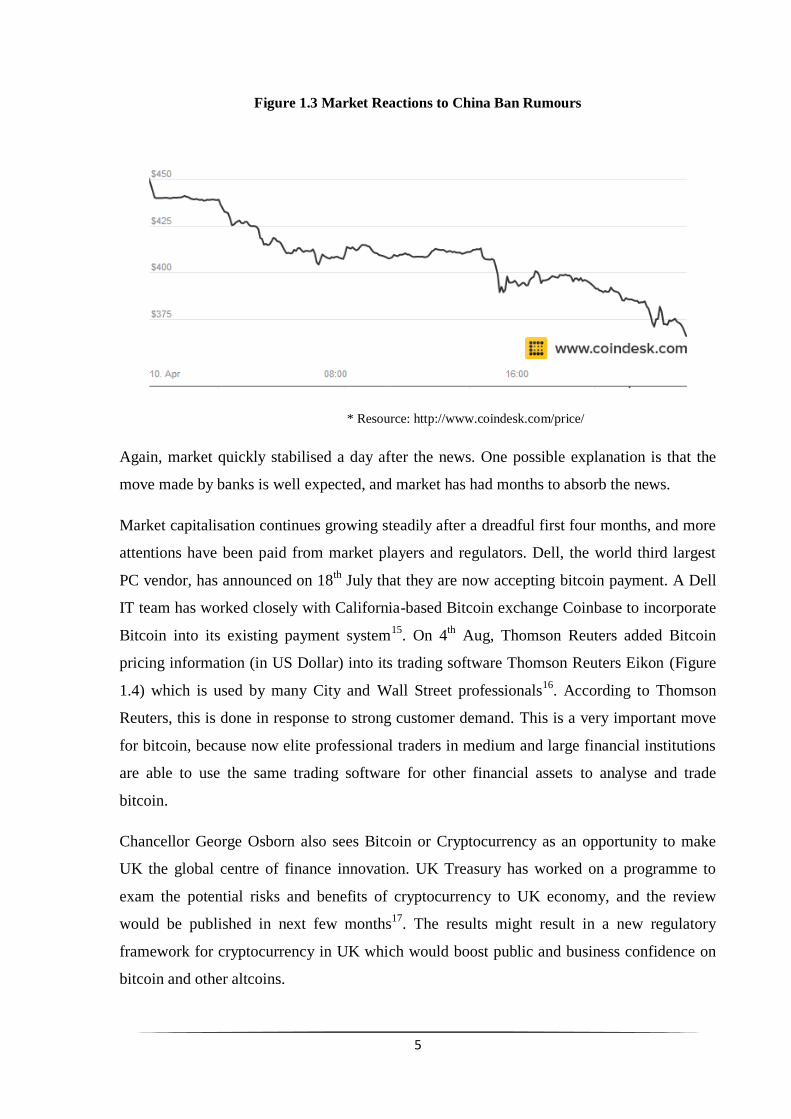
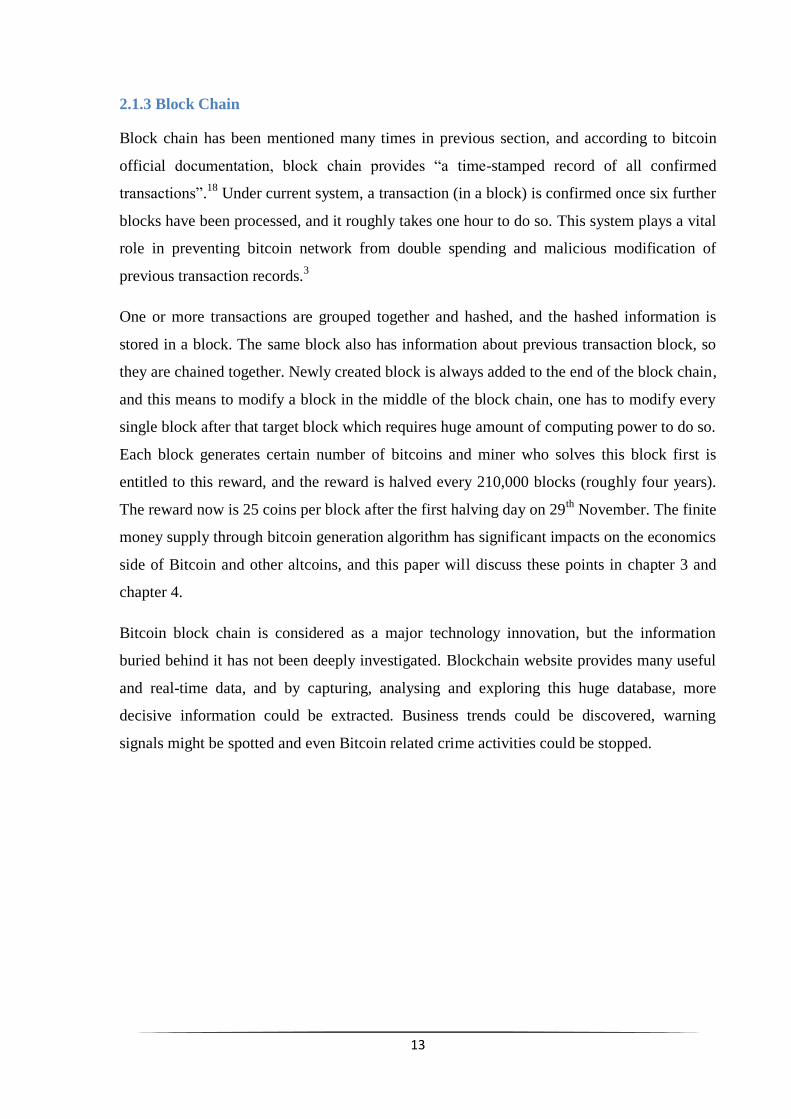
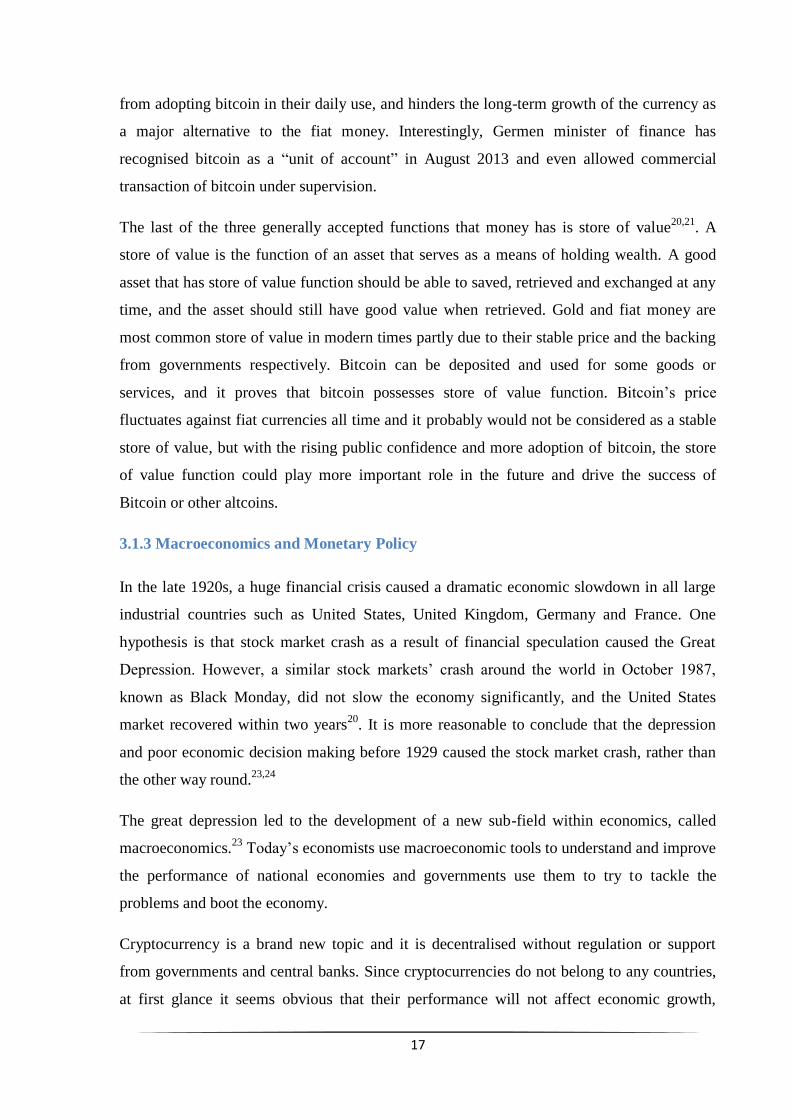
Bitcoin took another hit on 10th
Apri 2014, and the price dropped nearly 10% (Figure 1.3).
China-based exchanges announced they had received official notice from their banks that
their business account would be frozen on 15th
April. No official statement was released, but
many believed these sanction decisions came from People’s Bank of China (PBOC), the
nation’s central bank. Rumours was spread that PBOC had barred all China-based financial
institutions from handling Bitcoin transactions to curb risks including crime and money
laundering. On the same day, National Australia Bank, one of the four largest financial
institutions in Australia, also confirmed that they would close business account dealing with
Bitcoin and altcoins on 2nd
May due to ‘unacceptable level of risk to NAB’s business and
reputation.
5
Figure 1.3 Market Reactions to China Ban Rumours
* Resource: http://www.coindesk.com/price/
Again, market quickly stabilised a day after the news. One possible explanation is that the
move made by banks is well expected, and market has had months to absorb the news.
Market capitalisation continues growing steadily after a dreadful first four months, and more
attentions have been paid from market players and regulators. Dell, the world third largest
PC vendor, has announced on 18th July that they are now accepting bitcoin payment. A Dell
IT team has worked closely with California-based Bitcoin exchange Coinbase to incorporate
Bitcoin into its existing payment system15
. On 4th
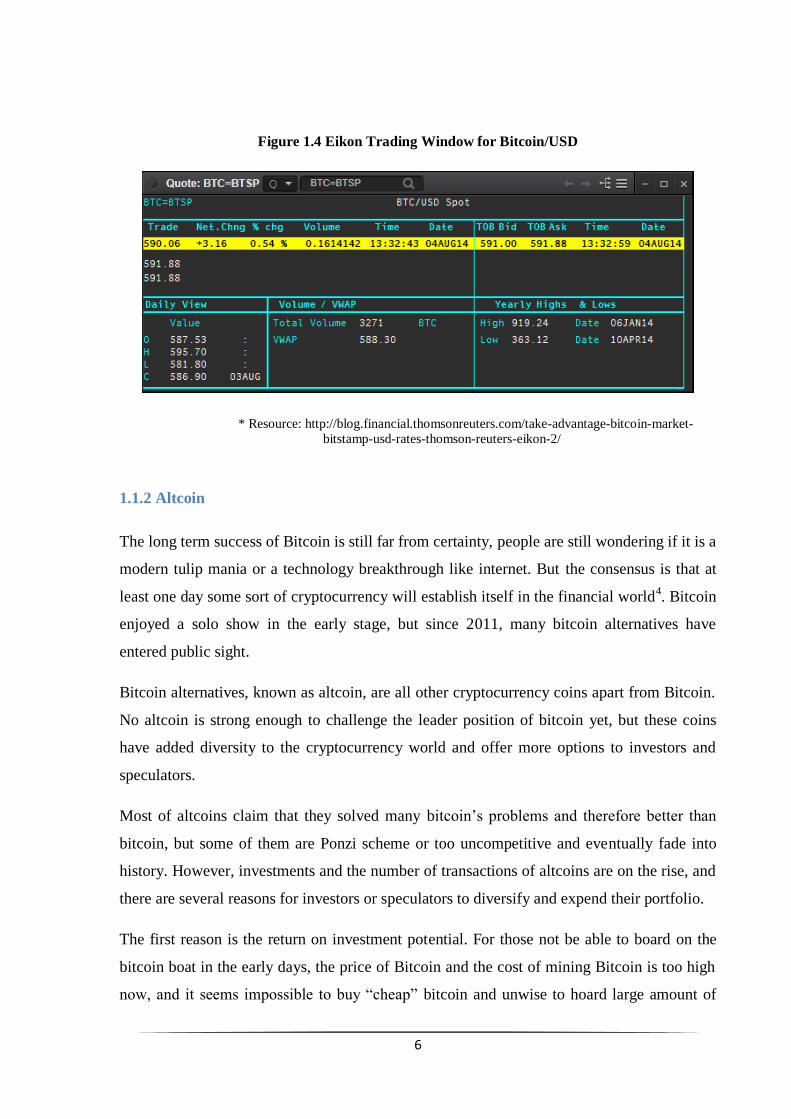
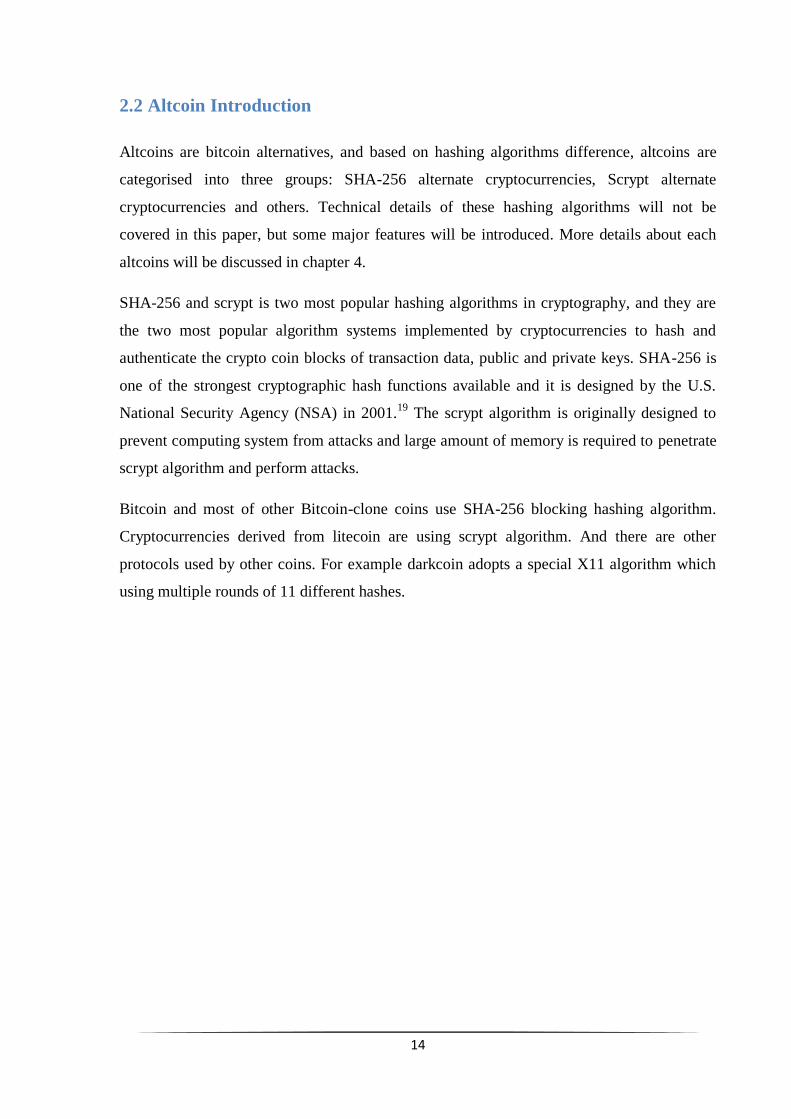
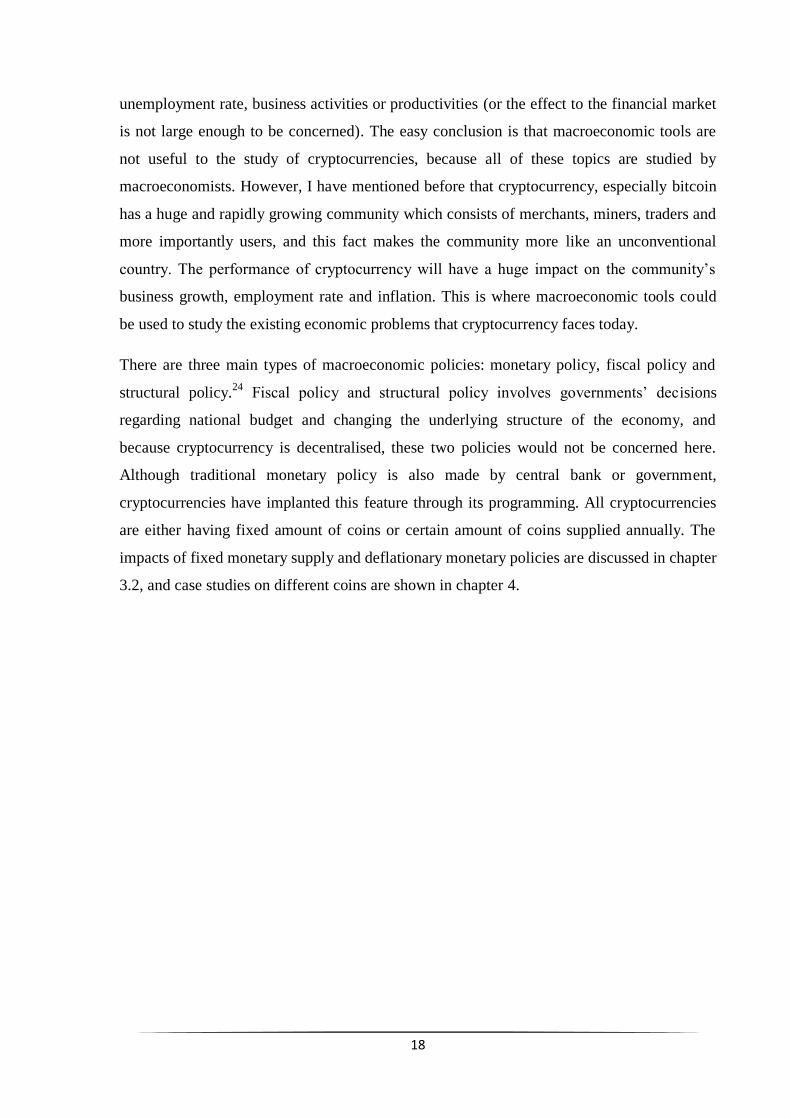
Aug, Thomson Reuters added Bitcoin
pricing information (in US Dollar) into its trading software Thomson Reuters Eikon (Figure
1.4) which is used by many City and Wall Street professionals16
. According to Thomson
Reuters, this is done in response to strong customer demand. This is a very important move
for bitcoin, because now elite professional traders in medium and large financial institutions
are able to use the same trading software for other financial assets to analyse and trade
bitcoin.
Chancellor George Osborn also sees Bitcoin or Cryptocurrency as an opportunity to make
UK the global centre of finance innovation. UK Treasury has worked on a programme to
exam the potential risks and benefits of cryptocurrency to UK economy, and the review
would be published in next few months17
. The results might result in a new regulatory
framework for cryptocurrency in UK which would boost public and business confidence on
bitcoin and other altcoins.
6
Figure 1.4 Eikon Trading Window for Bitcoin/USD
* Resource: http://blog.financial.thomsonreuters.com/take-advantage-bitcoin-market-
bitstamp-usd-rates-thomson-reuters-eikon-2/
1.1.2 Altcoin
The long term success of Bitcoin is still far from certainty, people are still wondering if it is a
modern tulip mania or a technology breakthrough like internet. But the consensus is that at
least one day some sort of cryptocurrency will establish itself in the financial world4. Bitcoin
enjoyed a solo show in the early stage, but since 2011, many bitcoin alternatives have
entered public sight.
Bitcoin alternatives, known as altcoin, are all other cryptocurrency coins apart from Bitcoin.
No altcoin is strong enough to challenge the leader position of bitcoin yet, but these coins
have added diversity to the cryptocurrency world and offer more options to investors and
speculators.
Most of altcoins claim that they solved many bitcoin’s problems and therefore better than
bitcoin, but some of them are Ponzi scheme or too uncompetitive and eventually fade into
history. However, investments and the number of transactions of altcoins are on the rise, and
there are several reasons for investors or speculators to diversify and expend their portfolio.
The first reason is the return on investment potential. For those not be able to board on the
bitcoin boat in the early days, the price of Bitcoin and the cost of mining Bitcoin is too high
now, and it seems impossible to buy “cheap” bitcoin and unwise to hoard large amount of
7
bitcoin for speculation. The profit potential has been outweighed by high price and cost.
Altcoins, having much lower price compared with Bitcoin (Table 1.1), are good alternative
investment or means to hedge risk although it should be considered as high risk investment
itself.
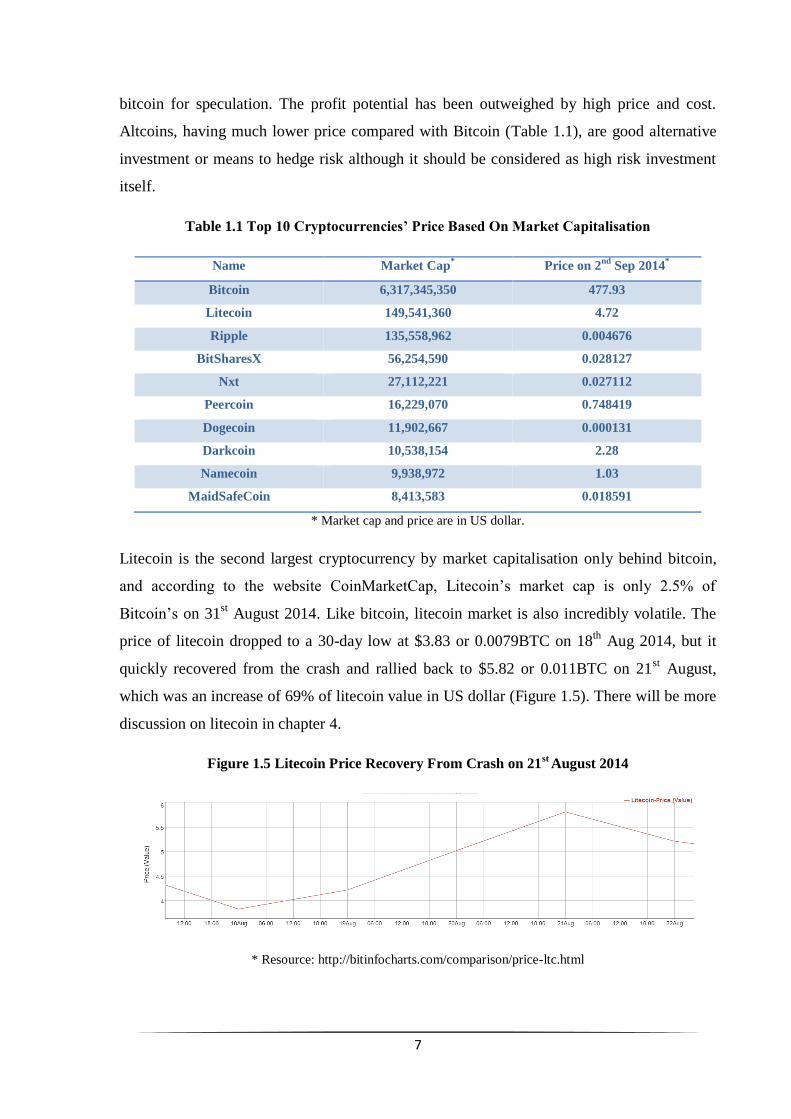
Table 1.1 Top 10 Cryptocurrencies’ Price Based On Market Capitalisation
Name Market Cap*
Price on 2nd
Sep 2014*
Bitcoin 6,317,345,350 477.93
Litecoin 149,541,360 4.72
Ripple 135,558,962 0.004676
BitSharesX 56,254,590 0.028127
Nxt 27,112,221 0.027112
Peercoin 16,229,070 0.748419
Dogecoin 11,902,667 0.000131
Darkcoin 10,538,154 2.28
Namecoin 9,938,972 1.03
MaidSafeCoin 8,413,583 0.018591
* Market cap and price are in US dollar.
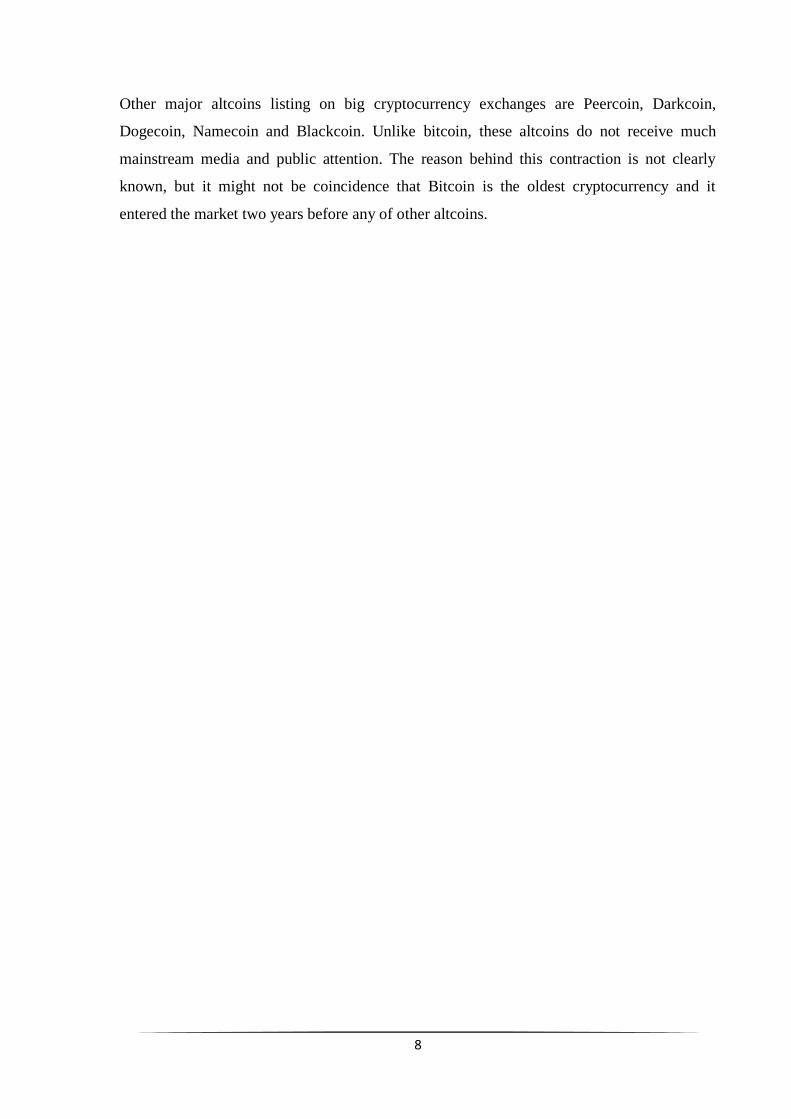
Litecoin is the second largest cryptocurrency by market capitalisation only behind bitcoin,
and according to the website CoinMarketCap, Litecoin’s market cap is only 2.5% of
Bitcoin’s on 31st August 2014. Like bitcoin, litecoin market is also incredibly volatile. The
price of litecoin dropped to a 30-day low at $3.83 or 0.0079BTC on 18th
Aug 2014, but it
quickly recovered from the crash and rallied back to $5.82 or 0.011BTC on 21st August,
which was an increase of 69% of litecoin value in US dollar (Figure 1.5). There will be more
discussion on litecoin in chapter 4.
Figure 1.5 Litecoin Price Recovery From Crash on 21st
August 2014
* Resource: http://bitinfocharts.com/comparison/price-ltc.html
8
Other major altcoins listing on big cryptocurrency exchanges are Peercoin, Darkcoin,
Dogecoin, Namecoin and Blackcoin. Unlike bitcoin, these altcoins do not receive much
mainstream media and public attention. The reason behind this contraction is not clearly
known, but it might not be coincidence that Bitcoin is the oldest cryptocurrency and it
entered the market two years before any of other altcoins.
9
1.2 Motivation
This project aims to study a selection of altcoins and use data-driven analysis to explain the
reasons behind the success and failure of different altcoins. Altcoins differ from bitcoin by
applying different hashing algorithms and mining mechanisms, starting with different
number of coins and adopting contrasting monetary policies, and it is the last factor that this
paper will discuss. Most of the published papers on cryptocurrency focus on the technical
background, while some discuss the future of the cryptocurrency but they are based on
current market trend and community confidence. This paper jumps out of the circle and
discuss the macroeconomics side of cryptocurrency, and the discussion will put monetary
policies, more specifically money supply for bitcoin and altcoins, at central point.
Money supply is an important instrument in any country’s economy, because the level of
money supply has impacts on inflation rate, price level and business cycle. Although
cryptocurrency economy is not constraint in a single nation, merchants, miners and spenders
form a huge community which could be considered as an ‘unconventional’ decentralised
country. Banking panic, speculative bubble or currency crisis that lead to financial crisis in
real world would definitely affect cryptocurrency world – perhaps they would pose larger
threats due to unregulated and decentralised nature of cryptocurrency.
Technological advances may solve some of the limitations that cryptocurrencies currently
face – such as attack on the coin network or double spending problem. However, to become
part of the main financial system, all digital currencies have to reduce volatility and provide
reasonable and flexible money supply.
Until now, not a single altcoin can challenge the leader position of Bitcoin due to its
reputation and supports from strong network of miners and investors community. However,
as described above, bitcoin is not flawless, and some of these problems might eventually
destroy bitcoin one day. This provides a chance for altcoins to squeeze into the spotlight. As
problems arising and profits dropping, inevitably people start looking at and trading altcoins
and speculating of which they think will be the next bitcoin.
There are currently around 800 known altcoins and it is likely that there are still many more
unaware of10
. It is still far from certain that how to define a successful cryptocurrency,
because there are too many factors needed to be considered and the database is not large and
accurate enough to be interpreted.
10
Here we investigate several popular or interesting altcoins and compare these different coins.
Reward per block and block mining rate is used to estimate future total accumulative number
of coins in circulation, assuming the average block mining rate is constant for each altcoin.
Initial studies focus on 24-year time span of each altcoin from their respective starting year.
Future research will combine these with other data like network hash rate and miners’
revenue to find out what impacts monetary policies could have on altcoins.
11
Chapter 2 Technical Backgrounds
2.1 Bitcoin Introduction
Bitcoin is a peer-to-peer virtual currency and an electronic payment system based on proof-
of-work. It is also known as crypto currency, because unlike some existing virtual currencies
bitcoin requires cryptographic software protocol to produce and maintain the currency.
Bitcoin was first proposed in a 2008 white paper3 based on some previous crypto currency
and hashcash mechanism ideas13, 14
. Bitcoin is considered as decentralised virtual currency,
because there is no central repository and no central administrative body backing it. All
transaction history is stored in the block chain which acts as a public ledger. The electronic
payment system based on cryptographic proof rather than trust, and this allows transfer of
money conduct directly between two participating party without a trusted third party. This
section will briefly discuss some important parts of the Bitcoin system.
2.1.1 Transaction
A transaction in bitcoin system is a transfer of value between electronic Bitcoins wallets, and
the transaction is digitally signed for security. All the transactions are stored in bitcoin’s
block chains, which are bitcoin transaction database, and this information is available to
anyone anonymously. During transaction, a specified amount of bitcoin is transferred from
its input to its output.
An input identifies a previous transaction record which is saved as a hash of the previous
transaction output and an index (recipient’s public key)3,18
. An output holds information for
sending bitcoins and it specifies an amount for the transfer. The value of each output will be
always fully claimed. Although each output from one transaction can only be referenced
once by the input of the subsequent transaction, there could be multiple outputs that share the
combined value of the input. Therefore, if one wants to send half of 100 bitcoins that he
receives from previous transaction, Bitcoin will split this into two outputs and each worth 50
bitcoins. One output will be sent to the recipient account and the other output will be sent to
another address, which it created for sender to hold his “change”. The amount of input
bitcoins not claimed in an output is considered as a transaction fee and the miner who
generates the block will get it. Transaction fees provide incentives for miners to process
transactions and maintain the network. Currently, miners benefit more from the mining
reward, but in the future transaction fee could play an important role due to dropped profits
12
from mining process. Transaction with higher transaction fees could be confirmed faster, as
more computing power could be used to accept and process the transaction due to higher
profits.
One of the huge advantages of bitcoin is its transaction irreversibility3. After a transaction is
confirmed and added to the block in the longest chain, the transaction practically becomes
irreversible. This feature could prevent merchant or vendors from risks including credit-card
fraud or charge-backs, and small or medium sized enterprises could confidently extend their
business to areas where those problems exist.
2.1.2 Mining
Mining is the process of confirming and adding transaction records to bitcoin’s block chain
which is the public ledger of all transaction history, and currently the confirmation time for
bitcoin is about 10 minutes18
.
There are two types of mining forms: solo mining and pooled mining18
. The process of a
miner attempting to generate new block on his own is called solo mining. All block reward
and any transaction fee associated with transactions in that block go to the miner himself. In
pooled mining, miners are grouped together and computing hashing power is combined to
solve blocks together. Block rewards are divided to the pool members in correlation to the
amount of power they each contributed. Pooled mining method offer more regular but
smaller amount payments (rewards) to miners than solo mining, because rewards are shared
by the entire mining pool.
Mining hardware evolves over time to maximum profits through mining process. In the early
days, bitcoin client allowed users to use CPU to mine, but this feature was removed from
client’s interface later because the appearance of GPU mining made CPU mining
economically impractical. More efficient GPU mining dramatically increased the hash rate of
the network, and it made the value of the amount of coins mined by CPU lower than the
electricity cost paid by CPU miners. Field-Programmable Gate Array (FPGA) mining
method is a more cost effective way to mine blocks than GPU mining. It consumes very
small amount of energy but offers higher hashing power than GPU method. The latest
mining technology is Application-Specific Integrated Circuit (ASIC) mining method, and it
outperforms all previous methods. ASIC mining lifts the network hash rate to another level
and makes GPU mining financially unwise in some areas.
13
2.1.3 Block Chain
Block chain has been mentioned many times in previous section, and according to bitcoin
official documentation, block chain provides “a time-stamped record of all confirmed
transactions”.18
Under current system, a transaction (in a block) is confirmed once six further
blocks have been processed, and it roughly takes one hour to do so. This system plays a vital
role in preventing bitcoin network from double spending and malicious modification of
previous transaction records.3
One or more transactions are grouped together and hashed, and the hashed information is
stored in a block. The same block also has information about previous transaction block, so
they are chained together. Newly created block is always added to the end of the block chain,
and this means to modify a block in the middle of the block chain, one has to modify every
single block after that target block which requires huge amount of computing power to do so.
Each block generates certain number of bitcoins and miner who solves this block first is
entitled to this reward, and the reward is halved every 210,000 blocks (roughly four years).
The reward now is 25 coins per block after the first halving day on 29th
November. The finite
money supply through bitcoin generation algorithm has significant impacts on the economics
side of Bitcoin and other altcoins, and this paper will discuss these points in chapter 3 and
chapter 4.
Bitcoin block chain is considered as a major technology innovation, but the information
buried behind it has not been deeply investigated. Blockchain website provides many useful
and real-time data, and by capturing, analysing and exploring this huge database, more
decisive information could be extracted. Business trends could be discovered, warning
signals might be spotted and even Bitcoin related crime activities could be stopped.
14
2.2 Altcoin Introduction
Altcoins are bitcoin alternatives, and based on hashing algorithms difference, altcoins are
categorised into three groups: SHA-256 alternate cryptocurrencies, Scrypt alternate
cryptocurrencies and others. Technical details of these hashing algorithms will not be
covered in this paper, but some major features will be introduced. More details about each
altcoins will be discussed in chapter 4.
SHA-256 and scrypt is two most popular hashing algorithms in cryptography, and they are
the two most popular algorithm systems implemented by cryptocurrencies to hash and
authenticate the crypto coin blocks of transaction data, public and private keys. SHA-256 is
one of the strongest cryptographic hash functions available and it is designed by the U.S.
National Security Agency (NSA) in 2001.19
The scrypt algorithm is originally designed to
prevent computing system from attacks and large amount of memory is required to penetrate
scrypt algorithm and perform attacks.
Bitcoin and most of other Bitcoin-clone coins use SHA-256 blocking hashing algorithm.
Cryptocurrencies derived from litecoin are using scrypt algorithm. And there are other
protocols used by other coins. For example darkcoin adopts a special X11 algorithm which
using multiple rounds of 11 different hashes.
15
Chapter 3 Monetary policy and Cryptocurrencies
3.1 Monetary policy and money supply
This paper investigates how monetary policy could affect growth potential and future success
of cryptocurrency. This part of the paper will first look at monetary policy on traditional fiat
money. Since the oldest cryptocurrency bitcoin has only been out for 5 years, projected data
of bitcoin and selected altcoins are calculated and combined with historic data.
In this section, I will compare the difference between fiat money and cryptocurrency, and I
will also discuss the roles that money plays in an economy. The second part of this section
will focus on monetary policy of fiat money and bitcoin. Case studies on other altcoin will be
shown in chapter 4.
3.1.1 Fiat Money vs. Commodity Money
Bitcoin is a decentralised and borderless digital currency, and bitcoin users form a
community regardless where they are. This community could be seen as a “unified” and
unconventional country, and bitcoin is the currency used in this country as a medium of
exchange. The same idea could be applied to other cryptocurrencies such as litecoin,
dogecoin or reddcoin.
Traditional fiat money has its value and legal status derived from supply/demand relationship
and government’s regulation, and public faith also contributes to the value of the currency.21
Unlike traditional fiat money, cryptocurrency is decentralised and trustless peer-to-peer
transaction system and it is operated and governed purely by cryptographic protocols. Fiat
money loss its value once it loses backing from the government that issues it, but
cryptocurrency maintains its value without government support. It seems in bitcoin’s case,
public faith on performance of bitcoin determines the price and this trust is not from
government support but from bitcoin, the great technological innovation, itself. Imagining a
scenario that British pound’s price is not determined by British government credibility,
economic performance, GDP or unemployment rate but only based on paper notes itself, this
is like today’s bitcoin and other altcoins market.
Some consider cryptocurrency as commodity currency (or pure commodity) rather than
currency due to its feature, daily trading pattern and lack of price-stability, but commodity
currency’s value comes from objects that have value in themselves. Cryptocurrency’s value
16
is unrelated to the value of any physical product. This makes cryptocurrency intrinsically
useless, and intrinsically valueless is an important feature of fiat money.
3.1.2 Cryptocurrency and Money Functions
It seems that it is ambiguous to define cryptocurrency as either fiat money or commodity
money, but it is certain that it is originally designed to be used as a medium of exchange (at
least this is true for bitcoin) and money is most widely accepted as a medium of exchange.
To differentiate cryptocurrency from traditional fiat money, bitcoin is classified as digital
currency in this paper.
Money or currency is an integral part of any modern economy, and it serves multiple
functions in these economies. Three most important functions that money played are medium
of exchange, unit of account and store of value.20
With bitcoin’s popularity growing fast, increasingly more merchants are now accepts bitcoin
payment. These businesses come from a wide range of industries including online shopping,
education, food, travel and many others. This year has seen a big rise in the number of
retailors that accept Bitcoin payment, and some big names are decided to open its door to
this new payment method. Expedia, the parent company of many notable online travel
brands including hotels.com and expedia.com, has announced in July 2014 that bitcoin is
accepted for hotel booking on its website. Dell, the world third largest PC seller, even took a
further step and offered 10% discount on Alienware PCs with bitcoin payment. Clearly,
bitcoin, the leader of cryptocurrency, has been accepted as medium of exchange, at least to
some extent. Other digital currencies may not be as successful as bitcoin, but from pure
economic point of view, they have the potential to become next bitcoin.
The second function that money serves to an economy is unit of account. Unit of account is a
basic measure of economic value. Expressing economic values of products and assets in a
common unit of account enables easy comparisons and allows useful interpretation of costs
and profits.20,21
For example, United Kingdom use the pound sterling as their national
currency, and prices – including the prices of financial assets and industrial products and the
price of labour (wages) – are expressed in pounds. An economy would benefit from a stable
unit of account, because if the price for a currency changes rapidly and frequently, it would
be hard for business owners to carry out daily operation. As discussed in chapter 1, bitcoin is
a failure in terms of being a stable unit of account. The volatility of bitcoin prevents public
17
from adopting bitcoin in their daily use, and hinders the long-term growth of the currency as
a major alternative to the fiat money. Interestingly, Germen minister of finance has
recognised bitcoin as a “unit of account” in August 2013 and even allowed commercial
transaction of bitcoin under supervision.
The last of the three generally accepted functions that money has is store of value20,21
. A
store of value is the function of an asset that serves as a means of holding wealth. A good
asset that has store of value function should be able to saved, retrieved and exchanged at any
time, and the asset should still have good value when retrieved. Gold and fiat money are
most common store of value in modern times partly due to their stable price and the backing
from governments respectively. Bitcoin can be deposited and used for some goods or
services, and it proves that bitcoin possesses store of value function. Bitcoin’s price
fluctuates against fiat currencies all time and it probably would not be considered as a stable
store of value, but with the rising public confidence and more adoption of bitcoin, the store
of value function could play more important role in the future and drive the success of
Bitcoin or other altcoins.
3.1.3 Macroeconomics and Monetary Policy
In the late 1920s, a huge financial crisis caused a dramatic economic slowdown in all large
industrial countries such as United States, United Kingdom, Germany and France. One
hypothesis is that stock market crash as a result of financial speculation caused the Great
Depression. However, a similar stock markets’ crash around the world in October 1987,
known as Black Monday, did not slow the economy significantly, and the United States
market recovered within two years20
. It is more reasonable to conclude that the depression
and poor economic decision making before 1929 caused the stock market crash, rather than
the other way round.23,24
The great depression led to the development of a new sub-field within economics, called
macroeconomics.23
Today’s economists use macroeconomic tools to understand and improve
the performance of national economies and governments use them to try to tackle the
problems and boot the economy.
Cryptocurrency is a brand new topic and it is decentralised without regulation or support
from governments and central banks. Since cryptocurrencies do not belong to any countries,
at first glance it seems obvious that their performance will not affect economic growth,
18
unemployment rate, business activities or productivities (or the effect to the financial market
is not large enough to be concerned). The easy conclusion is that macroeconomic tools are
not useful to the study of cryptocurrencies, because all of these topics are studied by
macroeconomists. However, I have mentioned before that cryptocurrency, especially bitcoin
has a huge and rapidly growing community which consists of merchants, miners, traders and
more importantly users, and this fact makes the community more like an unconventional
country. The performance of cryptocurrency will have a huge impact on the community’s
business growth, employment rate and inflation. This is where macroeconomic tools could
be used to study the existing economic problems that cryptocurrency faces today.
There are three main types of macroeconomic policies: monetary policy, fiscal policy and
structural policy.24
Fiscal policy and structural policy involves governments’ decisions
regarding national budget and changing the underlying structure of the economy, and
because cryptocurrency is decentralised, these two policies would not be concerned here.
Although traditional monetary policy is also made by central bank or government,
cryptocurrencies have implanted this feature through its programming. All cryptocurrencies
are either having fixed amount of coins or certain amount of coins supplied annually. The
impacts of fixed monetary supply and deflationary monetary policies are discussed in chapter
3.2, and case studies on different coins are shown in chapter 4.
19
3.2 Cryptocurrencies: Fixed Monetary Supply and Deflationary Monetary
Policies
3.2.1 Modern Monetary Policy
Monetary policy refers to the decisions made by special government institutions to determine
the size and the growth rate of national money supply (For example, Federal Reserve in the
United States, Bank of England in United Kingdom, European Central Bank in Euro-zone
and People’s Bank of China in China).20, 22
It is often used by these institutions to control the
national economy. Changes in the monetary supply have impacts on important
macroeconomic variables including interest rates, inflation and exchange rates.21
It is worth
to study and investigate monetary policy of cryptocurrency, because by learning from
lessons of monetary policy on fiat money, we may be able to develop a monetary policy tool
to specifically target at cryptocurrency and tackle the severe problems including inflation,
price instability and market confidence. Before further discussion on monetary policy, it is
very important to understand the definition of “money supply”. The money supply is defined
as the sum of currency held by public and bank deposits. It should not be interpreted as the
amount of money that supplied by central banks every year.
By altering the supply of money or other forms of reserves held by commercial banks,
central banks or other government body can control the money supply indirectly.20
There are
two major types of monetary policy: expansionary and contractionary. Expansionary policy
expands the money supply faster than usual to boost economy and lower unemployment rate
during recessions. Contractionary policy increases the supply of money in the economy more
slowly or even shrinks it to slow down and calm the market to avoid economic bubble or
huge inflation.
In real financial world, the primary monetary policy tool to change the money reserve is
open market operation. Open market operation is a method that central banks controls supply
of money through buying or selling government bonds on the open market. Suppose that a
central bank aims to increase money supply. To accomplish this goal, the central bank, using
newly printed money, buys government bonds that they issued earlier from commercial
banks and the public. With more money reserves, commercial bank could further distribute
money to the market through the process of lending and mortgage. This operation indirectly
20
increases money supply and the quantity of money in circulation. Opposite goal could be
achieved by selling the financial assets to the public.
Another unconventional monetary policy that used regularly after 2008 financial crisis is
quantitative easing (QE). QE is a type of expansionary policy, and it is used when traditional
expansionary policy loses its effectiveness. Quantitative easing quickly increase money base
and the amount of cash in circulation, and it could stimulate economy by direct cash
injection.
3.2.2 Cryptocurrency Monetary Policy
Unlike monetary policy for fiat money, all cryptocurrencies have rather inflexible monetary
policies. Central banks or government bodies could adjust their monetary policies over time
to cope with different situation faced by their economies, but cryptocurrencies are born with
a fixed monetary policy (In theory it could be changed, but it is complicated and often causes
troubles). It is implemented through the coding and it is part of their DNA.
All cryptocurrencies could be generally classified into two categories based on the difference
of monetary policy: deflationary coins and growth coins.12
The term “monetary policy” for
cryptocurrency should not be confused with the same name for fiat money. Since all digital
coins increase their money supply at certain rate per unit time (i.e. they cannot shrink the size
of the money supply or money in circulation on purpose, but coin loss due to loss of private
key or wallet could lead to a size decrease.), cryptocurrencies are all adopting an
expansionary policy. However, cryptocurrencies should be further differentiated based on
how they distributing coins.
Deflationary coins are those digital currencies in which the total number of coins in existence
is fixed. Bitcoin is the most famous example of this kind, and at most 21 million bitcoins will
be mined out eventually as a result of block processing algorithm and halving reward. Other
deflationary coins include litecoin, namecoin, vertcoin and darkcoin.
The only way for bitcoin and other deflationary coins to distribute new coins are through
block reward during block mining process. The rates of block generation time for different
digital currencies are different, but the number of coins generated per block is programmed
to decrease geometrically. Bitcoin has a 50% reduction rate per 21,000 blocks which takes
21
roughly four years. It is said that the rate is set because Bitcoin tries to mimic the gold
mining rate.
The other type of cryptocurrency is growth currency. There is no limit number of coins in
existence for growth coins, and instead the number of coins in circulation grows steadily
with a fixed coin supply rate. Famous growth coins include Dogecoin and Reddcoin.
22
Chapter 4 Case Study
This chapter will review bitcoin and some interesting altcoins. Historical evolutions for each
coin will be first discussed and money supply policies will also be reviewed and studied
individually.
4.1 Bitcoin
Bitcoin historical evolution has been reviewed and discussed extensively in previous
chapters, and in this part I will focus on bitcoin case study which is used to explain general
methodology. Same method is used to calculate and predict future coin production rate for
other altcoins which I will discuss later, and projected total coin number in circulation in the
future is calculated based on the coin growth rate. Some altcoins have special initial coin
production scheme, and these are considered and combined with my study to produce
database and graph.
The number of blocks processed every year is calculated as follows:
Number of Blocks Processed Annually = (60/Block Processing Time) * 24 * 365;*
* I assume that there are 365 days in each year and 24 hours in each day.
60/Block Processing Time calculates how many blocks could be mined out in one hour in the
ideal situation. The number of coins produced every hour times 24 to get the number of
blocks produced every day. The whole number then multiplied by 365 to calculate the total
number of block solved each year.
The number of blocks processed overall is calculated as follows:
Number of Blocks Processed Annually = (60/Block Processing Time) * 24 * 365 + Number of
Blocks Mined in Previous Years;
The number of coins mined every year is calculated as follows:
Number of Coins Produced Annually = (60/Block Processing Time) * 24 * 365 * Reward per
Block;
The number of blocks processed each year multiplied by reward per block to obtain the
number of coins mined every year.
23
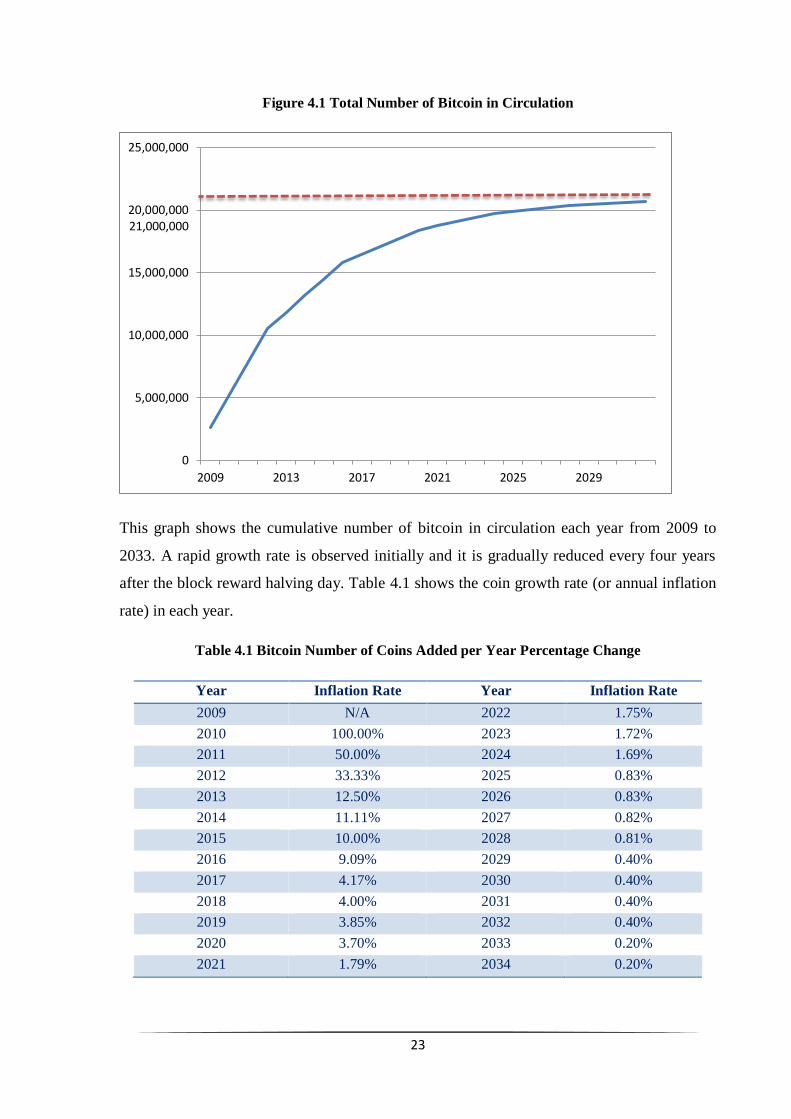
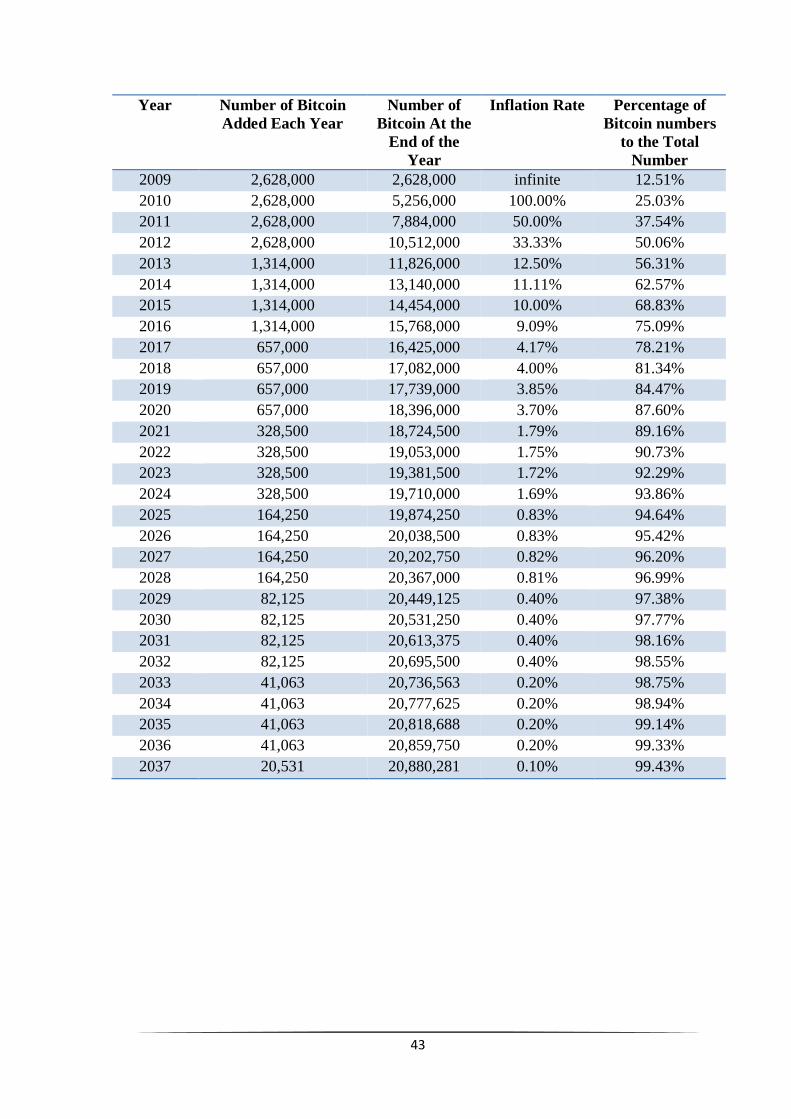
Figure 4.1 Total Number of Bitcoin in Circulation
This graph shows the cumulative number of bitcoin in circulation each year from 2009 to
2033. A rapid growth rate is observed initially and it is gradually reduced every four years
after the block reward halving day. Table 4.1 shows the coin growth rate (or annual inflation
rate) in each year.
Table 4.1 Bitcoin Number of Coins Added per Year Percentage Change
Year Inflation Rate Year Inflation Rate
2009 N/A 2022 1.75%
2010 100.00% 2023 1.72%
2011 50.00% 2024 1.69%
2012 33.33% 2025 0.83%
2013 12.50% 2026 0.83%
2014 11.11% 2027 0.82%
2015 10.00% 2028 0.81%
2016 9.09% 2029 0.40%
2017 4.17% 2030 0.40%
2018 4.00% 2031 0.40%
2019 3.85% 2032 0.40%
2020 3.70% 2033 0.20%
2021 1.79% 2034 0.20%
0
5,000,000
10,000,000
15,000,000
20,000,000
25,000,000
2009 2013 2017 2021 2025 2029
21,000,000
24
4.2 Litecoin Case Study and Historical Evolution
Litecoin was introduced in late 2011 and is currently the second largest cryptocurrency based
on Market capitalisation according to CoinMarketCap website. Many people view litecoin
“the silver” to bitcoin’s gold. Litecoin is based on the bitcoin protocol, but unlike bitcoin,
litecoin adopts scrypt algorithm to authenticate blocks of transaction data but it uses the same
Proof-Of-Work system as Bitcoin. Scrypt hashing prevents GPU, FPGA, ASIC mining of
litecoin in the early days, and it helps litecoin distribute to a bigger population rather than
few miners with larger computing power. The average block process time for litecoin is
approximately 2.5 minutes and it is three times faster than bitcoin. To limit the total number
of coins in circulation and mimic the generation trajectory of bitcoin, litecoin generation will
be halved every 840,000 coins and this makes the total number of litecoin around 84 million
coins. It makes litecoin more abundant than bitcoin. Litecoin development team claims that
litecoin provides faster transaction confirmation time, and this could benefit users and
smaller merchants and encourage more people adopting litecoin.11
Litecoin founder Charlie
Lee said in an interview that litecoin is not designed to replace bitcoin; instead it should
serve as a complimentary to bitcoin. In fact it is unwise to make an opposite claim, as bitcoin,
which entered market two years earlier than litecoin, has already established leader position
in the cryptocurrency market. However, litecoin, with appropriate monetary policies and
market positioning, could thrive in the future.
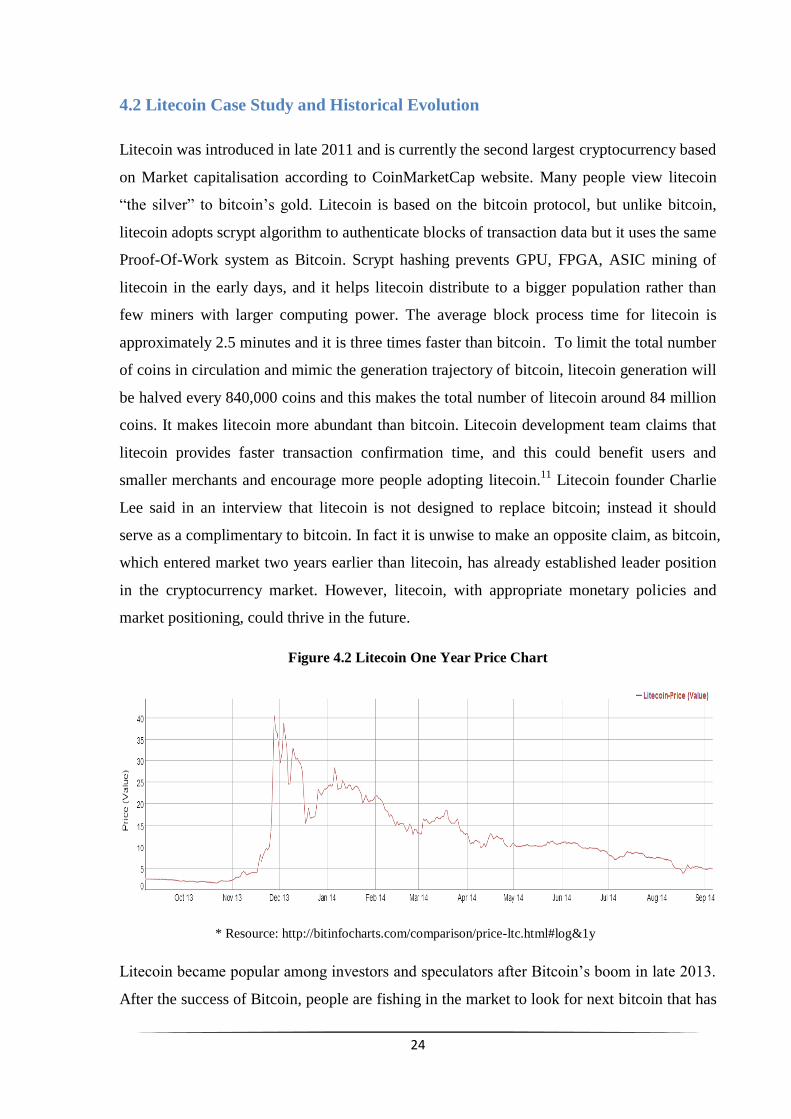
Figure 4.2 Litecoin One Year Price Chart
* Resource: http://bitinfocharts.com/comparison/price-ltc.html#log&1y
Litecoin became popular among investors and speculators after Bitcoin’s boom in late 2013.
After the success of Bitcoin, people are fishing in the market to look for next bitcoin that has
25
higher return on investment. Litecoin price rocketed to $40.61 on 28th
Nov 2013 from $2.08
a month earlier, and it was a dramatic 1852% increase. The huge increase in litecoin price
brought its market capitalisation to over one billion in US dollar for the first time, and the
only time. It is not the first time litecoin price made such big jump though. After one and half
year steady growth, litecoin price soared to $4.56 on 9th
April 2013 from $0.22 on 9th
March.
Both spikes are related to the bitcoin’s price rise. Some argues that investors who have
missed early opportunities to invest on bitcoin rushed to litecoin as a result of high
investment cost on bitcoin and promising future of litecoin. Others think late reaction from
cryptocurrency market lead to low exchange rates between bitcoin and litecoin, and bitcoin
holders who have benefited from the high return on investment of bitcoin were using their
bitcoin to buy litecoin, and hoping for another wealth booster.
The bubble did not stay long, and the price of litecoin quickly shrank to $15.58, one third of
its peak price less than a month earlier. Although its value quickly recovered, litecoin price
continuously decreased after that short recovery. The decline is not due to any flaw in
litecoin design, but because of the similar troubles suffered by bitcoin that we discussed in
chapter 1.
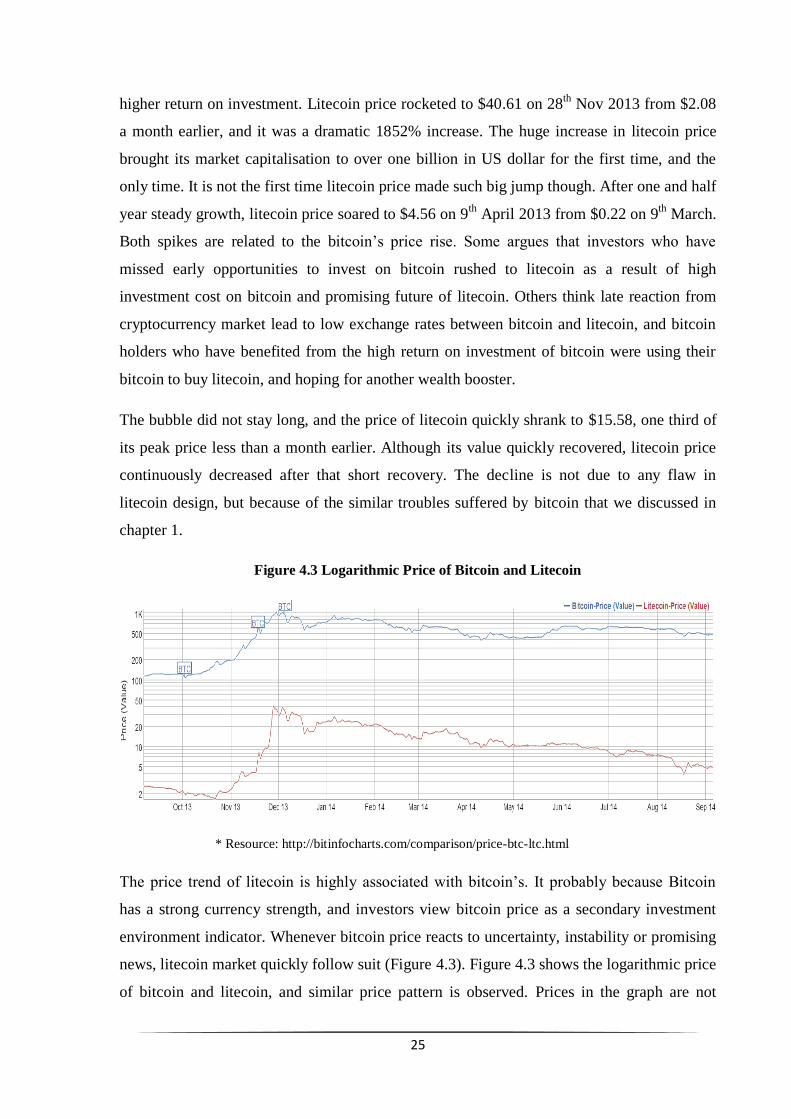
Figure 4.3 Logarithmic Price of Bitcoin and Litecoin
* Resource: http://bitinfocharts.com/comparison/price-btc-ltc.html
The price trend of litecoin is highly associated with bitcoin’s. It probably because Bitcoin
has a strong currency strength, and investors view bitcoin price as a secondary investment
environment indicator. Whenever bitcoin price reacts to uncertainty, instability or promising
news, litecoin market quickly follow suit (Figure 4.3). Figure 4.3 shows the logarithmic price
of bitcoin and litecoin, and similar price pattern is observed. Prices in the graph are not
26
equidistantly displayed, because it is clearer to indicate percentage change by using
logarithmic scale (Same percentage change in price are plotted as equal distance on the scale)
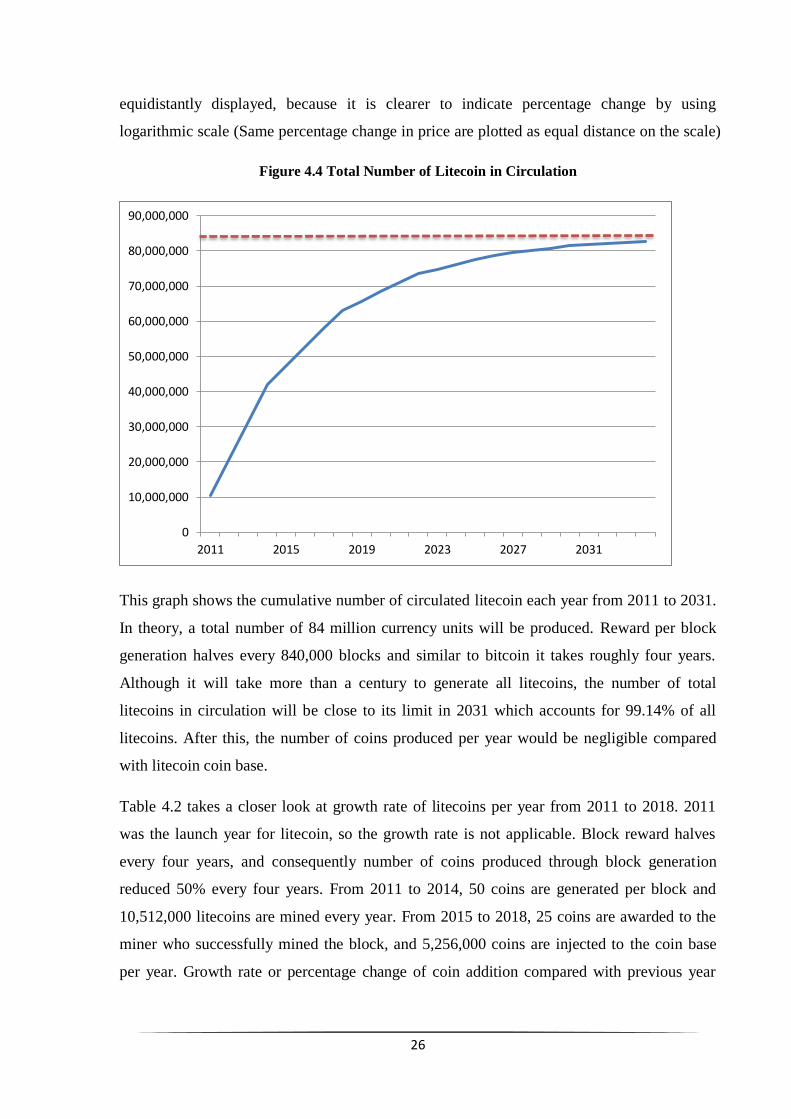
Figure 4.4 Total Number of Litecoin in Circulation
This graph shows the cumulative number of circulated litecoin each year from 2011 to 2031.
In theory, a total number of 84 million currency units will be produced. Reward per block
generation halves every 840,000 blocks and similar to bitcoin it takes roughly four years.
Although it will take more than a century to generate all litecoins, the number of total
litecoins in circulation will be close to its limit in 2031 which accounts for 99.14% of all
litecoins. After this, the number of coins produced per year would be negligible compared
with litecoin coin base.
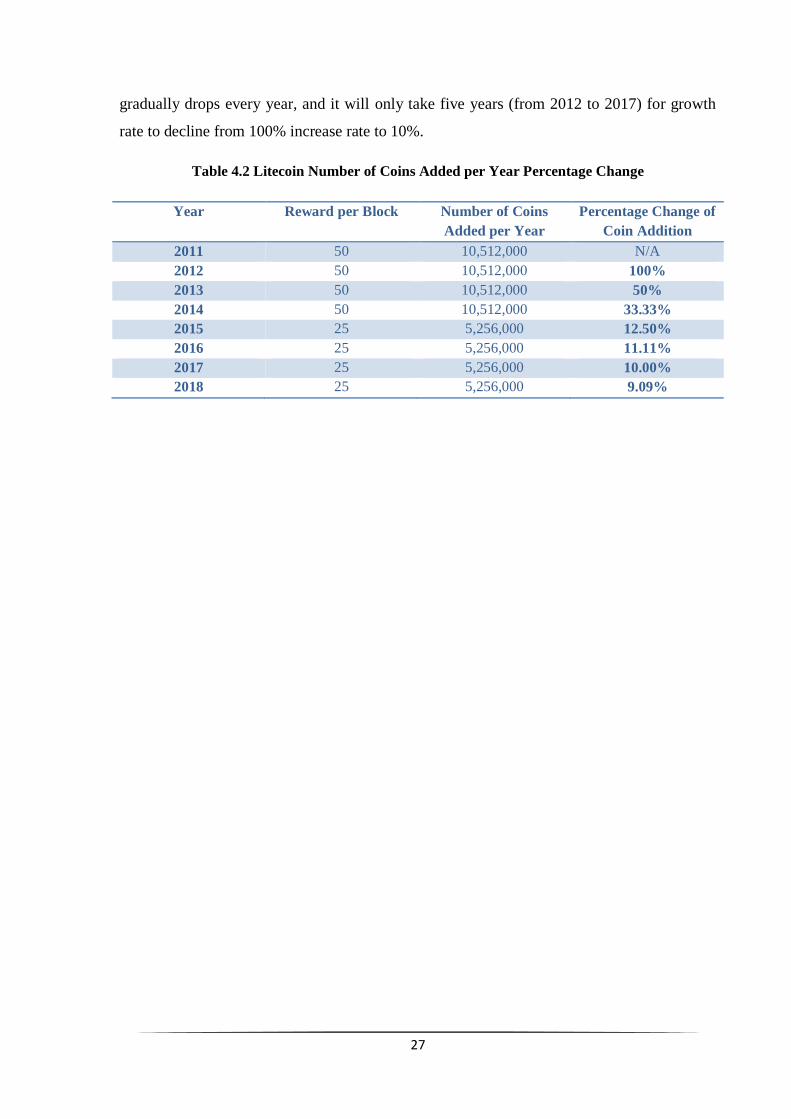
Table 4.2 takes a closer look at growth rate of litecoins per year from 2011 to 2018. 2011
was the launch year for litecoin, so the growth rate is not applicable. Block reward halves
every four years, and consequently number of coins produced through block generation
reduced 50% every four years. From 2011 to 2014, 50 coins are generated per block and
10,512,000 litecoins are mined every year. From 2015 to 2018, 25 coins are awarded to the
miner who successfully mined the block, and 5,256,000 coins are injected to the coin base
per year. Growth rate or percentage change of coin addition compared with previous year
0
10,000,000
20,000,000
30,000,000
40,000,000
50,000,000
60,000,000
70,000,000
80,000,000
90,000,000
2011 2015 2019 2023 2027 2031
27
gradually drops every year, and it will only take five years (from 2012 to 2017) for growth
rate to decline from 100% increase rate to 10%.
Table 4.2 Litecoin Number of Coins Added per Year Percentage Change
Year Reward per Block Number of Coins
Added per Year
Percentage Change of
Coin Addition
2011 50 10,512,000 N/A
2012 50 10,512,000 100%
2013 50 10,512,000 50%
2014 50 10,512,000 33.33%
2015 25 5,256,000 12.50%
2016 25 5,256,000 11.11%
2017 25 5,256,000 10.00%
2018 25 5,256,000 9.09%
28
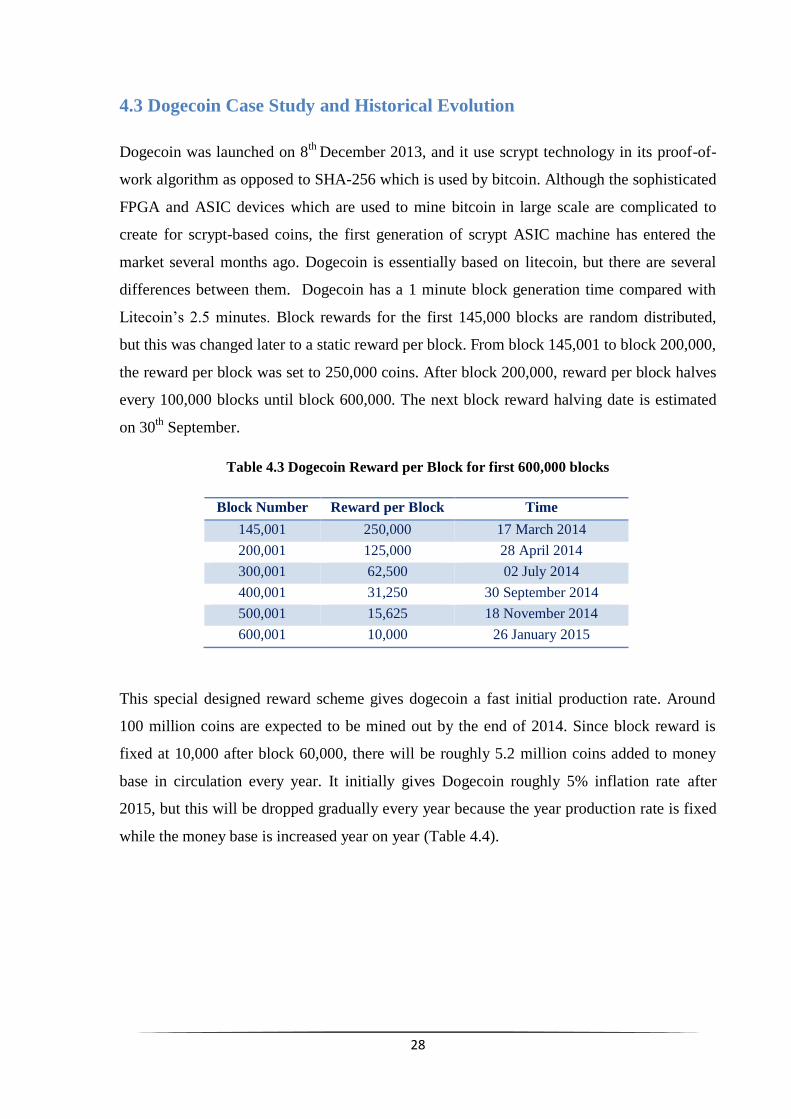
4.3 Dogecoin Case Study and Historical Evolution
Dogecoin was launched on 8th
December 2013, and it use scrypt technology in its proof-of-
work algorithm as opposed to SHA-256 which is used by bitcoin. Although the sophisticated
FPGA and ASIC devices which are used to mine bitcoin in large scale are complicated to
create for scrypt-based coins, the first generation of scrypt ASIC machine has entered the
market several months ago. Dogecoin is essentially based on litecoin, but there are several
differences between them. Dogecoin has a 1 minute block generation time compared with
Litecoin’s 2.5 minutes. Block rewards for the first 145,000 blocks are random distributed,
but this was changed later to a static reward per block. From block 145,001 to block 200,000,
the reward per block was set to 250,000 coins. After block 200,000, reward per block halves
every 100,000 blocks until block 600,000. The next block reward halving date is estimated
on 30th
September.
Table 4.3 Dogecoin Reward per Block for first 600,000 blocks
Block Number Reward per Block Time
145,001 250,000 17 March 2014
200,001 125,000 28 April 2014
300,001 62,500 02 July 2014
400,001 31,250 30 September 2014
500,001 15,625 18 November 2014
600,001 10,000 26 January 2015
This special designed reward scheme gives dogecoin a fast initial production rate. Around
100 million coins are expected to be mined out by the end of 2014. Since block reward is
fixed at 10,000 after block 60,000, there will be roughly 5.2 million coins added to money
base in circulation every year. It initially gives Dogecoin roughly 5% inflation rate after
2015, but this will be dropped gradually every year because the year production rate is fixed
while the money base is increased year on year (Table 4.4).
29
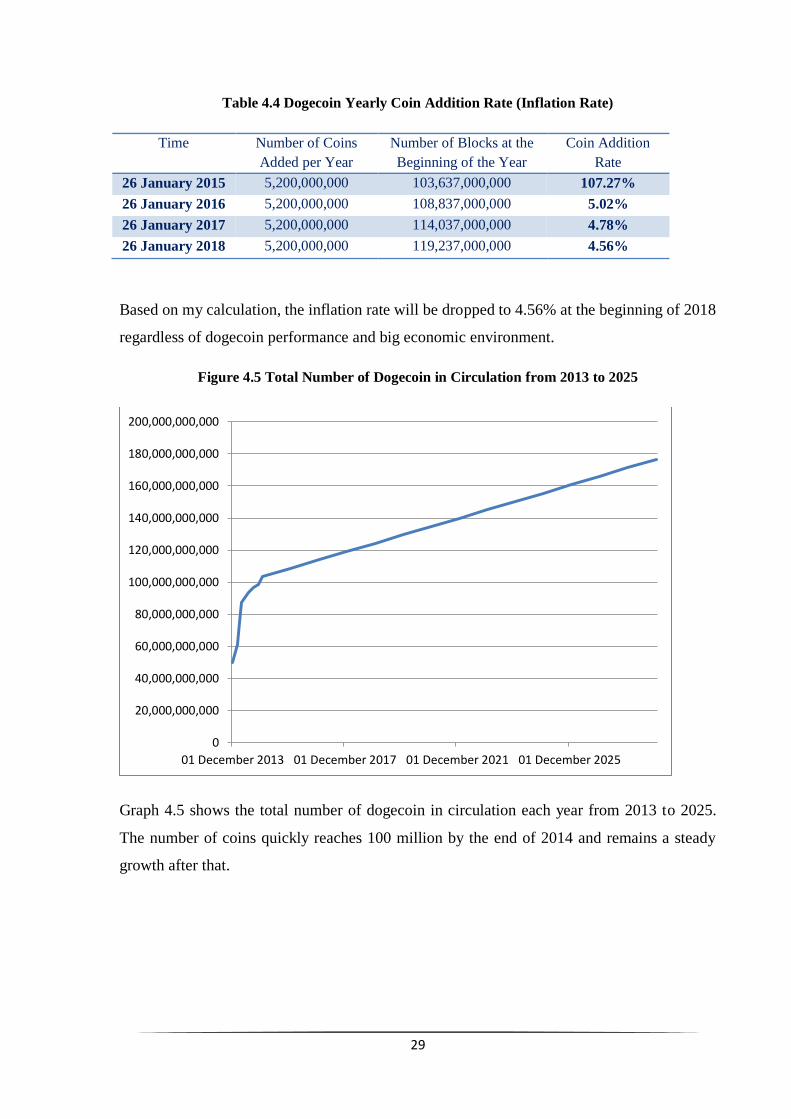
Table 4.4 Dogecoin Yearly Coin Addition Rate (Inflation Rate)
Time Number of Coins
Added per Year
Number of Blocks at the
Beginning of the Year
Coin Addition
Rate
26 January 2015 5,200,000,000 103,637,000,000 107.27%
26 January 2016 5,200,000,000 108,837,000,000 5.02%
26 January 2017 5,200,000,000 114,037,000,000 4.78%
26 January 2018 5,200,000,000 119,237,000,000 4.56%
Based on my calculation, the inflation rate will be dropped to 4.56% at the beginning of 2018
regardless of dogecoin performance and big economic environment.
Figure 4.5 Total Number of Dogecoin in Circulation from 2013 to 2025
Graph 4.5 shows the total number of dogecoin in circulation each year from 2013 to 2025.
The number of coins quickly reaches 100 million by the end of 2014 and remains a steady
growth after that.
0
20,000,000,000
40,000,000,000
60,000,000,000
80,000,000,000
100,000,000,000
120,000,000,000
140,000,000,000
160,000,000,000
180,000,000,000
200,000,000,000
01 December 2013 01 December 2017 01 December 2021 01 December 2025
30
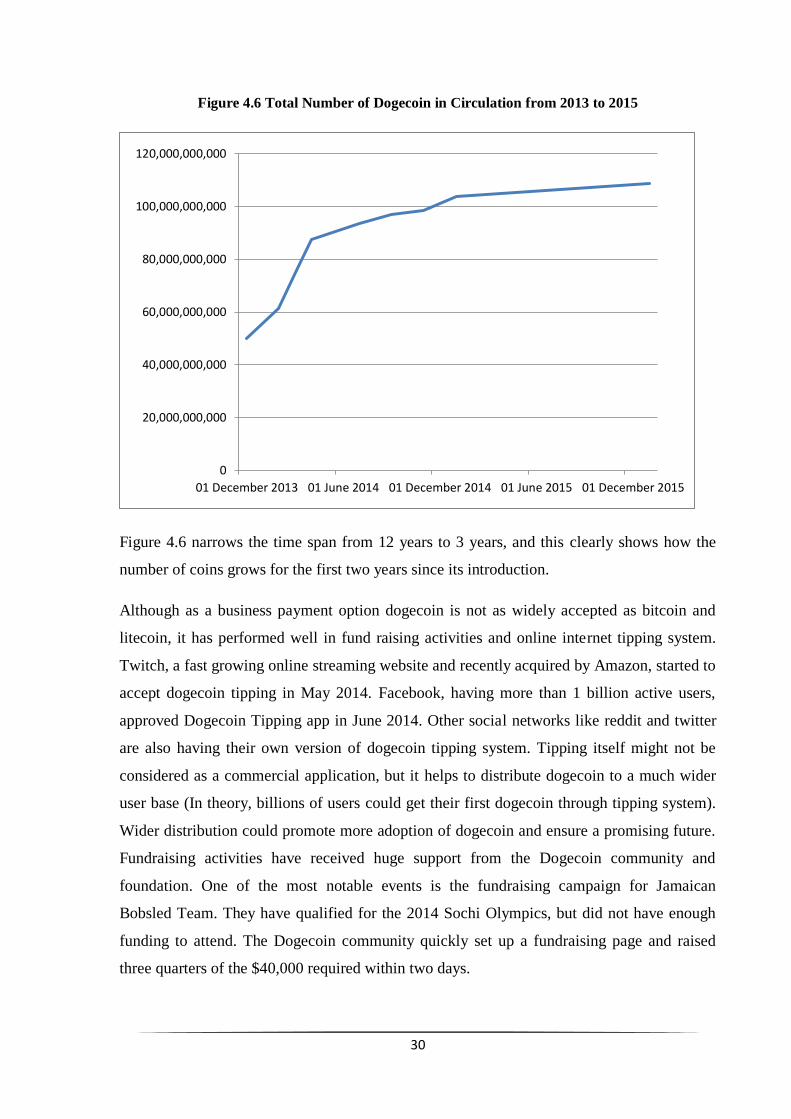
Figure 4.6 Total Number of Dogecoin in Circulation from 2013 to 2015
Figure 4.6 narrows the time span from 12 years to 3 years, and this clearly shows how the
number of coins grows for the first two years since its introduction.
Although as a business payment option dogecoin is not as widely accepted as bitcoin and
litecoin, it has performed well in fund raising activities and online internet tipping system.
Twitch, a fast growing online streaming website and recently acquired by Amazon, started to
accept dogecoin tipping in May 2014. Facebook, having more than 1 billion active users,
approved Dogecoin Tipping app in June 2014. Other social networks like reddit and twitter
are also having their own version of dogecoin tipping system. Tipping itself might not be
considered as a commercial application, but it helps to distribute dogecoin to a much wider
user base (In theory, billions of users could get their first dogecoin through tipping system).
Wider distribution could promote more adoption of dogecoin and ensure a promising future.
Fundraising activities have received huge support from the Dogecoin community and
foundation. One of the most notable events is the fundraising campaign for Jamaican
Bobsled Team. They have qualified for the 2014 Sochi Olympics, but did not have enough
funding to attend. The Dogecoin community quickly set up a fundraising page and raised
three quarters of the $40,000 required within two days.
0
20,000,000,000
40,000,000,000
60,000,000,000
80,000,000,000
100,000,000,000
120,000,000,000
01 December 2013 01 June 2014 01 December 2014 01 June 2015 01 December 2015
31
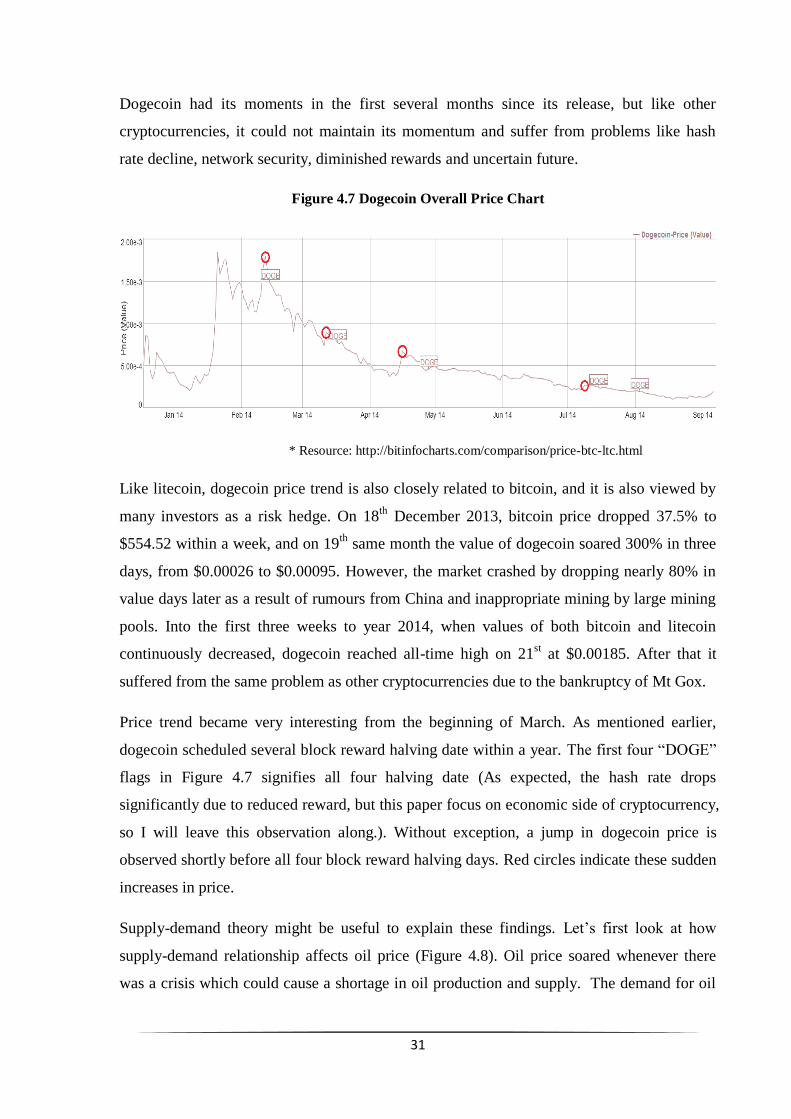
Dogecoin had its moments in the first several months since its release, but like other
cryptocurrencies, it could not maintain its momentum and suffer from problems like hash
rate decline, network security, diminished rewards and uncertain future.
Figure 4.7 Dogecoin Overall Price Chart
* Resource: http://bitinfocharts.com/comparison/price-btc-ltc.html
Like litecoin, dogecoin price trend is also closely related to bitcoin, and it is also viewed by
many investors as a risk hedge. On 18th
December 2013, bitcoin price dropped 37.5% to
$554.52 within a week, and on 19th
same month the value of dogecoin soared 300% in three
days, from $0.00026 to $0.00095. However, the market crashed by dropping nearly 80% in
value days later as a result of rumours from China and inappropriate mining by large mining
pools. Into the first three weeks to year 2014, when values of both bitcoin and litecoin
continuously decreased, dogecoin reached all-time high on 21st at $0.00185. After that it
suffered from the same problem as other cryptocurrencies due to the bankruptcy of Mt Gox.
Price trend became very interesting from the beginning of March. As mentioned earlier,
dogecoin scheduled several block reward halving date within a year. The first four “DOGE”
flags in Figure 4.7 signifies all four halving date (As expected, the hash rate drops
significantly due to reduced reward, but this paper focus on economic side of cryptocurrency,
so I will leave this observation along.). Without exception, a jump in dogecoin price is
observed shortly before all four block reward halving days. Red circles indicate these sudden
increases in price.
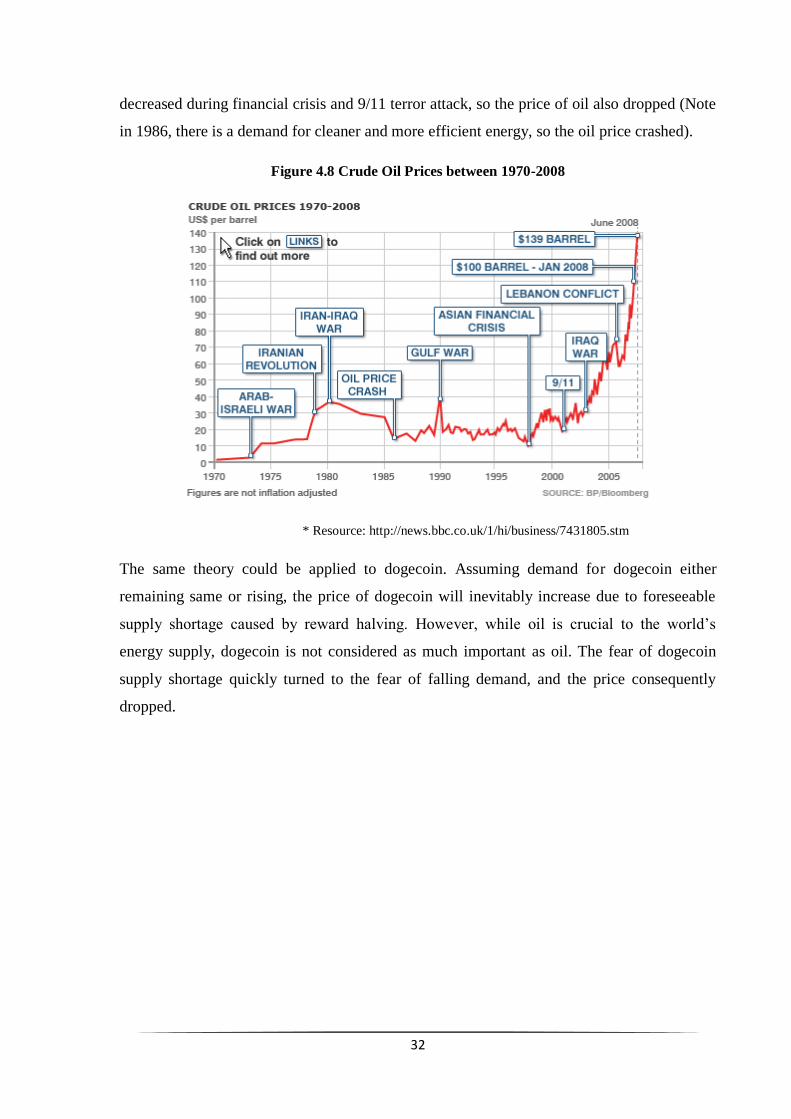
Supply-demand theory might be useful to explain these findings. Let’s first look at how
supply-demand relationship affects oil price (Figure 4.8). Oil price soared whenever there
was a crisis which could cause a shortage in oil production and supply. The demand for oil
32
decreased during financial crisis and 9/11 terror attack, so the price of oil also dropped (Note
in 1986, there is a demand for cleaner and more efficient energy, so the oil price crashed).
Figure 4.8 Crude Oil Prices between 1970-2008
* Resource: http://news.bbc.co.uk/1/hi/business/7431805.stm
The same theory could be applied to dogecoin. Assuming demand for dogecoin either
remaining same or rising, the price of dogecoin will inevitably increase due to foreseeable
supply shortage caused by reward halving. However, while oil is crucial to the world’s
energy supply, dogecoin is not considered as much important as oil. The fear of dogecoin
supply shortage quickly turned to the fear of falling demand, and the price consequently
dropped.
33
4.4 Reddcoin
Reddcoin was officially launched on 2nd
February 2014, and it was derived from litecoin.
Reddcoin has branded itself as “social currency” and it primarily targets at wider circulation
among social media users.
It used scrypt Proof-of-Work algorithm initially, but on 29th
April, Reddcoin team
announced Proof-of-Stake Velocity (PoSV) algorithm will be used to replace POW system.
On 2nd
August 2014, Reddcoin successfully switched to PoSV algorithm, two weeks after
third and final block reward halving day. PoSV is a variant version of Proof-of-Stake
algorithm which has gained popularity among new altcoins. It emphasises the ownership of
Reddcoin (Stake) and activity (velocity) rather than computing (hashing) power. Holding
larger amount of reddcoin would help miner finding a valid block and therefore receiving the
block reward. It is a growth coin, meaning there is no limit on the total amount of reddcoins.
It has an average of 60 seconds block processing time same as dogecoin and shorter than
litecoin. By the end of PoW era (2nd
Auguest), there are nearly 27 million coins circulated in
the market.
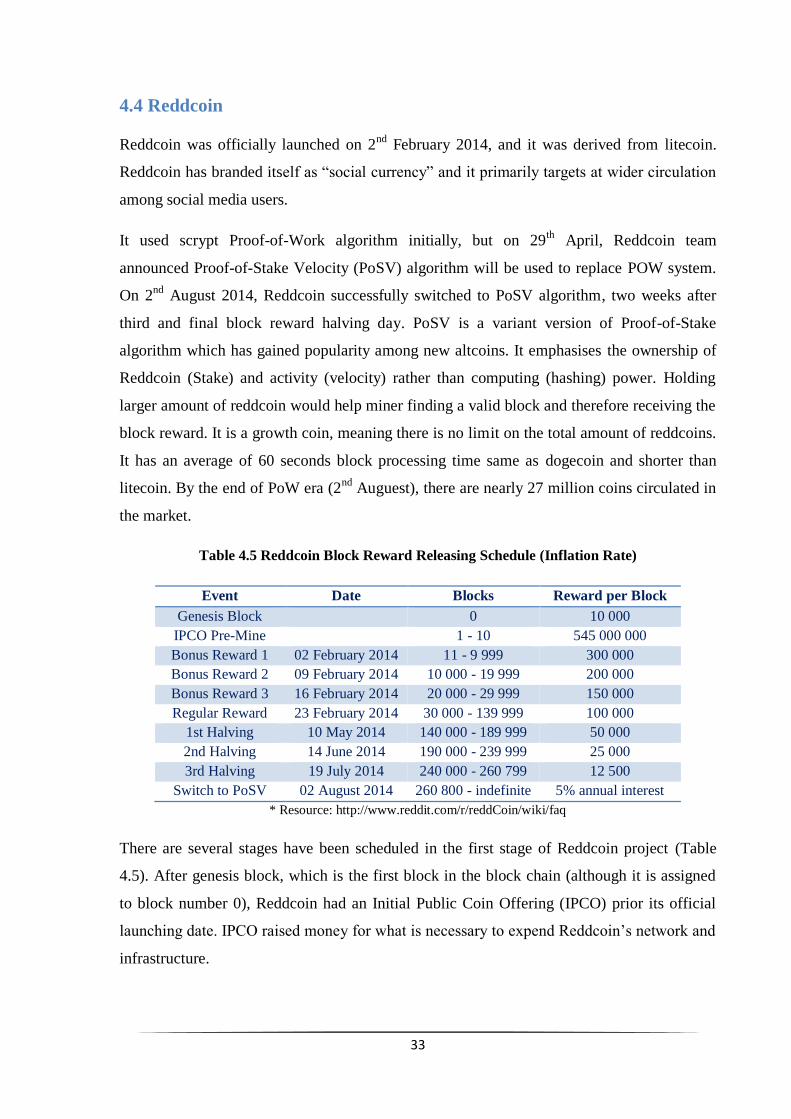
Table 4.5 Reddcoin Block Reward Releasing Schedule (Inflation Rate)
Event Date Blocks Reward per Block
Genesis Block 0 10 000
IPCO Pre-Mine 1 - 10 545 000 000
Bonus Reward 1 02 February 2014 11 - 9 999 300 000
Bonus Reward 2 09 February 2014 10 000 - 19 999 200 000
Bonus Reward 3 16 February 2014 20 000 - 29 999 150 000
Regular Reward 23 February 2014 30 000 - 139 999 100 000
1st Halving 10 May 2014 140 000 - 189 999 50 000
2nd Halving 14 June 2014 190 000 - 239 999 25 000
3rd Halving 19 July 2014 240 000 - 260 799 12 500
Switch to PoSV 02 August 2014 260 800 - indefinite 5% annual interest
* Resource: http://www.reddit.com/r/reddCoin/wiki/faq
There are several stages have been scheduled in the first stage of Reddcoin project (Table
4.5). After genesis block, which is the first block in the block chain (although it is assigned
to block number 0), Reddcoin had an Initial Public Coin Offering (IPCO) prior its official
launching date. IPCO raised money for what is necessary to expend Reddcoin’s network and
infrastructure.
34
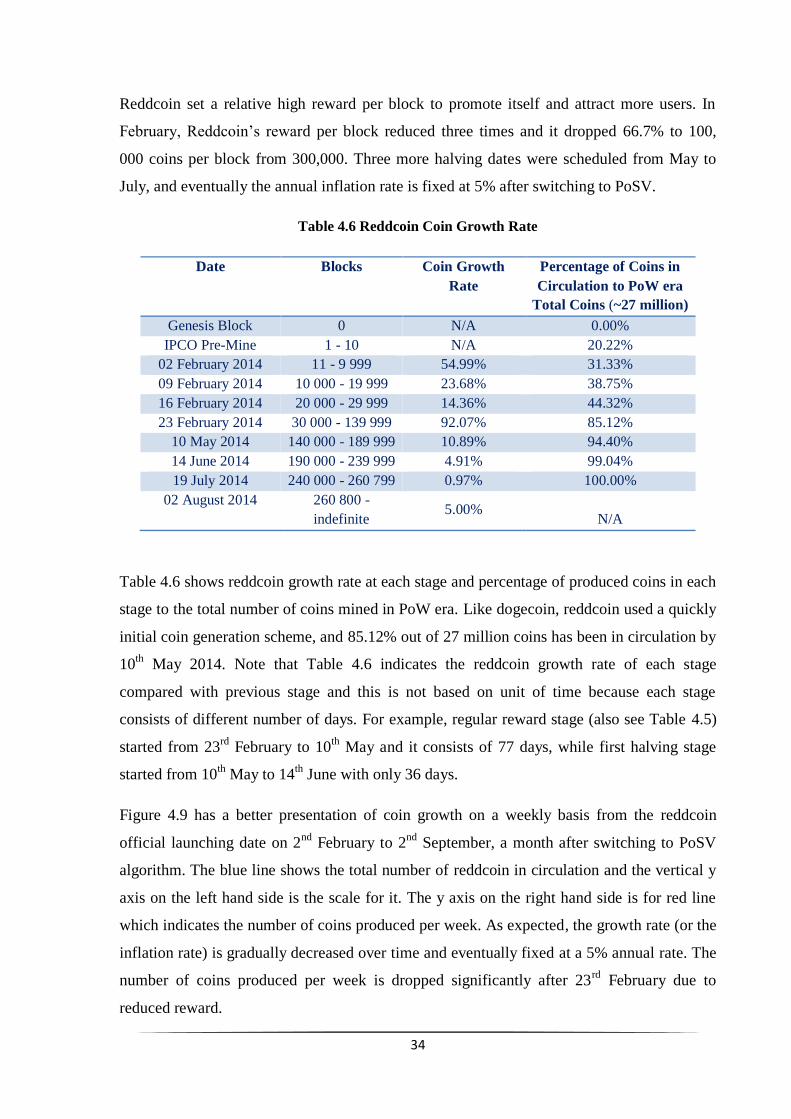
Reddcoin set a relative high reward per block to promote itself and attract more users. In
February, Reddcoin’s reward per block reduced three times and it dropped 66.7% to 100,
000 coins per block from 300,000. Three more halving dates were scheduled from May to
July, and eventually the annual inflation rate is fixed at 5% after switching to PoSV.
Table 4.6 Reddcoin Coin Growth Rate
Date Blocks Coin Growth
Rate
Percentage of Coins in
Circulation to PoW era
Total Coins (~27 million)
Genesis Block 0 N/A 0.00%
IPCO Pre-Mine 1 - 10 N/A 20.22%
02 February 2014 11 - 9 999 54.99% 31.33%
09 February 2014 10 000 - 19 999 23.68% 38.75%
16 February 2014 20 000 - 29 999 14.36% 44.32%
23 February 2014 30 000 - 139 999 92.07% 85.12%
10 May 2014 140 000 - 189 999 10.89% 94.40%
14 June 2014 190 000 - 239 999 4.91% 99.04%
19 July 2014 240 000 - 260 799 0.97% 100.00%
02 August 2014 260 800 -
indefinite 5.00%
N/A
Table 4.6 shows reddcoin growth rate at each stage and percentage of produced coins in each
stage to the total number of coins mined in PoW era. Like dogecoin, reddcoin used a quickly
initial coin generation scheme, and 85.12% out of 27 million coins has been in circulation by
10th
May 2014. Note that Table 4.6 indicates the reddcoin growth rate of each stage
compared with previous stage and this is not based on unit of time because each stage
consists of different number of days. For example, regular reward stage (also see Table 4.5)
started from 23rd
February to 10th
May and it consists of 77 days, while first halving stage
started from 10th
May to 14th
June with only 36 days.
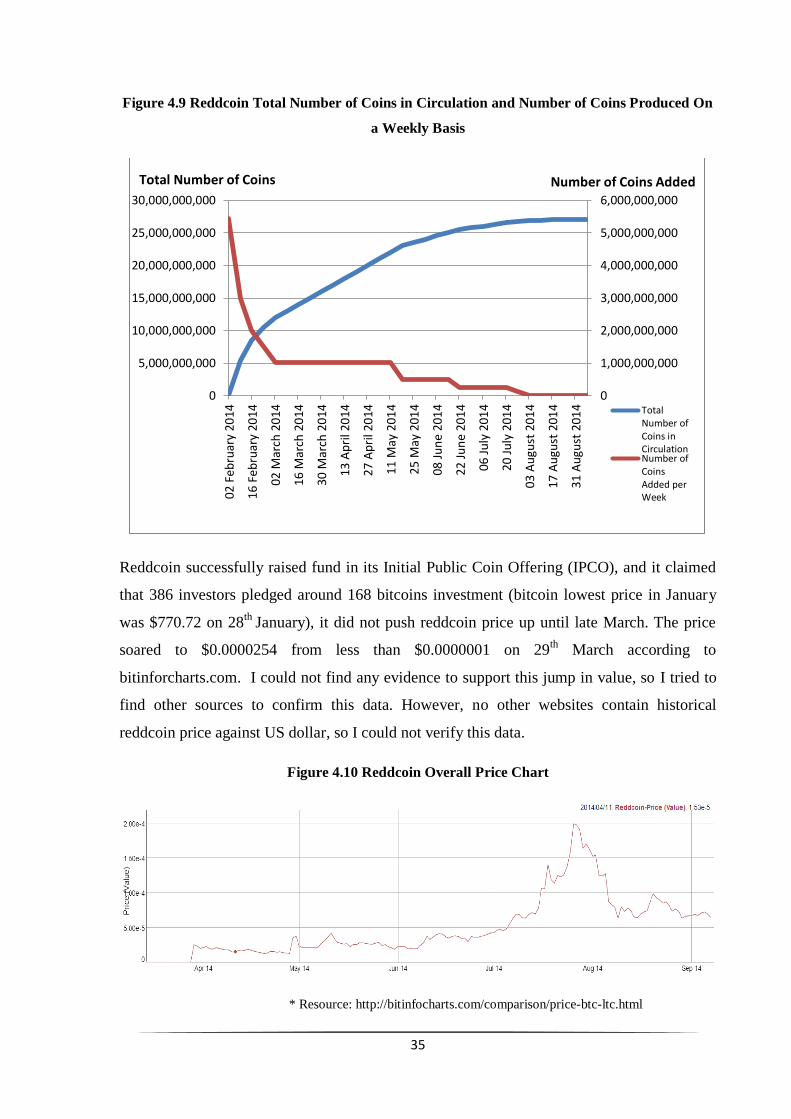
Figure 4.9 has a better presentation of coin growth on a weekly basis from the reddcoin
official launching date on 2nd
February to 2nd
September, a month after switching to PoSV
algorithm. The blue line shows the total number of reddcoin in circulation and the vertical y
axis on the left hand side is the scale for it. The y axis on the right hand side is for red line
which indicates the number of coins produced per week. As expected, the growth rate (or the
inflation rate) is gradually decreased over time and eventually fixed at a 5% annual rate. The
number of coins produced per week is dropped significantly after 23rd
February due to
reduced reward.
35
Figure 4.9 Reddcoin Total Number of Coins in Circulation and Number of Coins Produced On
a Weekly Basis
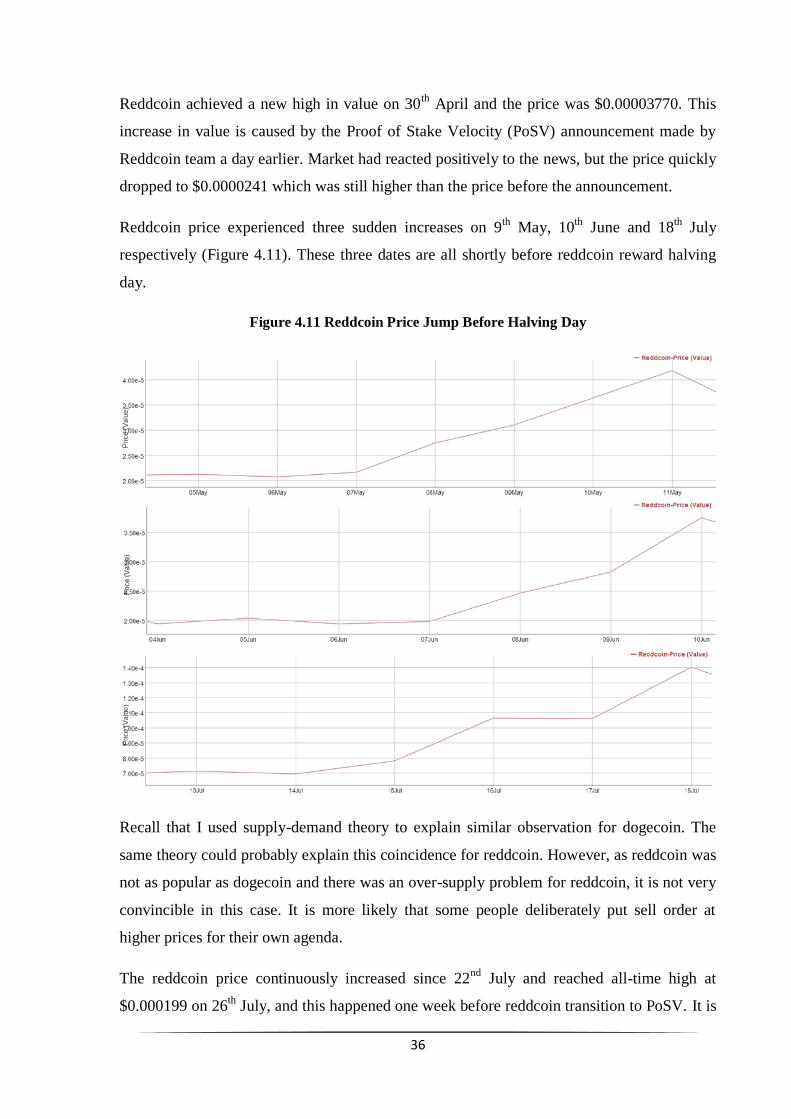
Reddcoin successfully raised fund in its Initial Public Coin Offering (IPCO), and it claimed
that 386 investors pledged around 168 bitcoins investment (bitcoin lowest price in January
was $770.72 on 28th
January), it did not push reddcoin price up until late March. The price
soared to $0.0000254 from less than $0.0000001 on 29th
March according to
bitinforcharts.com. I could not find any evidence to support this jump in value, so I tried to
find other sources to confirm this data. However, no other websites contain historical
reddcoin price against US dollar, so I could not verify this data.
Figure 4.10 Reddcoin Overall Price Chart
* Resource: http://bitinfocharts.com/comparison/price-btc-ltc.html
0
1,000,000,000
2,000,000,000
3,000,000,000
4,000,000,000
5,000,000,000
6,000,000,000
0
5,000,000,000
10,000,000,000
15,000,000,000
20,000,000,000
25,000,000,000
30,000,000,000
02 F
ebru
ary
2014
16 F
ebru
ary
2014
02 M
arch
20
14
16 M
arch
20
14
30 M
arch
20
14
13 A
pri
l 20
14
27 A
pri
l 20
14
11 M
ay 2
014
25 M
ay 2
014
08 J
un
e 20
14
22 J
un
e 20
14
06 J
uly
201
4
20 J
uly
201
4
03 A
ugu
st 2
014
17 A
ugu
st 2
014
31 A
ugu
st 2
014 Total
Number ofCoins inCirculationNumber ofCoinsAdded perWeek
Total Number of Coins Number of Coins Added
36
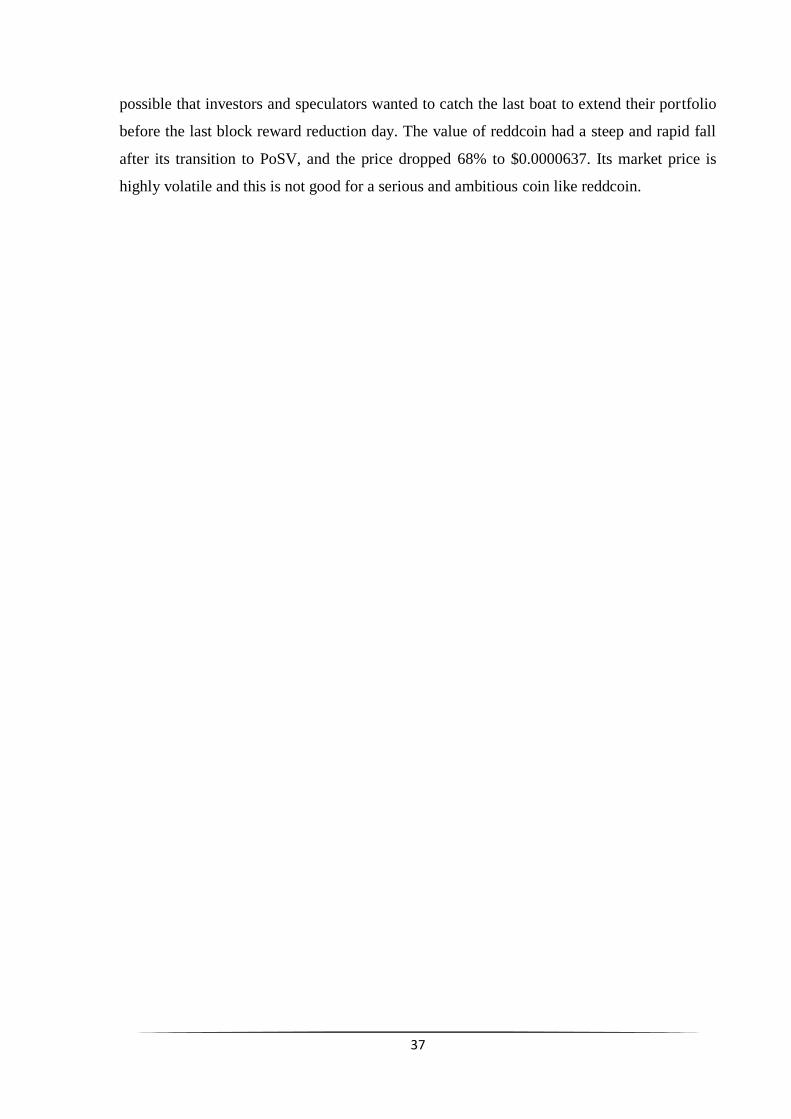
Reddcoin achieved a new high in value on 30th
April and the price was $0.00003770. This
increase in value is caused by the Proof of Stake Velocity (PoSV) announcement made by
Reddcoin team a day earlier. Market had reacted positively to the news, but the price quickly
dropped to $0.0000241 which was still higher than the price before the announcement.
Reddcoin price experienced three sudden increases on 9th
May, 10th
June and 18th
July
respectively (Figure 4.11). These three dates are all shortly before reddcoin reward halving
day.
Figure 4.11 Reddcoin Price Jump Before Halving Day
Recall that I used supply-demand theory to explain similar observation for dogecoin. The
same theory could probably explain this coincidence for reddcoin. However, as reddcoin was
not as popular as dogecoin and there was an over-supply problem for reddcoin, it is not very
convincible in this case. It is more likely that some people deliberately put sell order at
higher prices for their own agenda.
The reddcoin price continuously increased since 22nd
July and reached all-time high at
$0.000199 on 26th
July, and this happened one week before reddcoin transition to PoSV. It is
37
possible that investors and speculators wanted to catch the last boat to extend their portfolio
before the last block reward reduction day. The value of reddcoin had a steep and rapid fall
after its transition to PoSV, and the price dropped 68% to $0.0000637. Its market price is
highly volatile and this is not good for a serious and ambitious coin like reddcoin.
38
Chapter 5 Conclusions and Further Research
5.1 Conclusions
In this paper, we first reviewed historic evolution of bitcoin from economic point of view
and concluded that bitcoin has been seen as a market indicator for any other cryptocurrencies.
The performance of bitcoin will have a huge impact on overall cryptocurrency market, and
both investors and speculators are using other digital coins as a risk hedge.
Based on discussion and analysis on major governments’ policy towards bitcoin, we believe
bitcoin will be considered as an alternative to traditional fiat money in the future (In this
thesis, we assumed that technology flaw can be fixed before the destruction of a given
cryptocurrency). Cryptocurrency will become more mature and stable when the majority of
the public starts to realise its importance in daily use rather than simply appreciate its
innovative ideas.
Chapter 3 discussed the difference between fiat money and commodity money and provided
evidence to explain why cryptocurrency should not be considered as a commodity.
Cryptocurrency has no intrinsic value and its value is not related to any physical product.
Therefore, it could be seen as a financial instrument but not a commodity.
Macroeconomic theory was briefly introduced here and explanation on how and why
macroeconomic tools could be applied to analyse cryptocurrency was given. We proposed
that bitcoin community could be seen as an unconventional country, and macroeconomic
policy, or more precisely monetary policy, should be used to ensure the continuous growth of
the country.
Case study on bitcoin, litecoin, dogecoin and reddcoin is provided. We found litecoin market
price was highly related to bitcoin, and we believe it is unwise for litecoin to compete with
bitcoin directly. We made an interesting discovery on dogecoin price. We found that there
was a small price jump before each of the dogecoin halving date so far without any exception.
Supply and demand theory could be used to explain it, although it might also be caused by
speculating activities. It indicates that the market has be ability to anticipate the reward
halving events in time due to fear of supply shortage in the near future. Similar finding is
observed for reddcoin, but due to smaller user base and reddcoin over-supply issues, we
39
think there is a big possibility that its price was deliberately increased by putting many high
price selling orders in a short time.
5.2 Future Research
Cryptocurrency is a very new field and it is very hard to gather accurate data to conduct
research. Finding reliable data source for analysis should be a primary target.
Future study should consider the possibility of imposing a certain degree of regulation on
cryptocurrency. The regulation may help cryptocurrency defend itself from market violation.
The fall of the market of invisible hand could also be studied and be compared with
decentralised cryptocurrency and unregulated market.
40
Reference
1. "Bits and Bob." The Economist. The Economist Newspaper, 13 June 2011. Web.
http://www.economist.com/blogs/babbage/2011/06/virtual-currency
2. Greenspan Voices Concerns about Quality of Economic Statistics (9/97). N.p., n.d. Web.
http://news.stanford.edu/pr/97/970910greenspan.html
3. Satoshi Nakamoto: Bitcoin: A Peer-to-Peer Electronic Cash System,
https://bitcoin.org/bitcoin.pdf
4. "Mining Digital Gold." The Economist. The Economist Newspaper, 13 Apr. 2013. Web.
http://www.economist.com/news/finance-and-economics/21576149-even-if-it-crashes-
bitcoin-may-make-dent-financial-world-mining-digital
5. Mt Gox Announcemment:
https://www.mtgox.com/img/pdf/20140228-announcement_eng.pdf
6. Mt Gox Announcemment:
https://www.mtgox.com/img/pdf/20140314-announcement_chapter15.pdf
7. "Bitcoin Bank Closes down after $600,000 Hacker Theft." BBC News. BBC, 03 May 2014.
Web. http://www.bbc.co.uk/news/business-26446142
8. "Price of Bitcoin Falls Under $500 Amid Uncertainty in China." CoinDesk RSS. N.p., n.d
http://www.coindesk.com/price-bitcoin-remains-500-amid-china-uncertainty/
9. Bitcoin Forum bitcointalk https://bitcointalk.org/index.php?topic=137.0
10. "Crypto Coins List." List of All Traded Alternative Cryptocurrencies with Blocks,
Difficulty, Hashrate and Marketcap. N.p., n.d. Web.
http://www.cryptocoincharts.info/v2/coins/info
11. Bitcoin Forum bitcointalk https://bitcointalk.org/index.php?topic=47417.0
12. Nicolas T. Courtois: On the Longest Chain Rule and Programmed Self-Destruction of
Crypto Currencies, http://arxiv.org/abs/1405.0534
13. Adam Back: Hashcash – A Denial of Service Counter-Measure,
http://www.hashcash.org/papers/hashcash.pdf , August 2012
14. Wei Dai: B-Money Proposal, 1998, http://www.weidai.com/bmoney.txt
15. Dell Website Community Page: http://en.community.dell.com/dell-
blogs/direct2dell/b/direct2dell/archive/2014/07/18/we-re-now-accepting-bitcoin-on-dell-
com.aspx
16. "Take Advantage of the Bitcoin Market with Eikon." Blog. N.p., n.d. Web.
41
http://blog.financial.thomsonreuters.com/take-advantage-bitcoin-market-bitstamp-usd-rates-
thomson-reuters-eikon-2/
17. "George Osborne Unveils UK Plans to Explore Bitcoin." CoinDesk RSS. N.p., n.d.
http://www.coindesk.com/george-osborne-unveils-uk-plans-explore-bitcoin/
18. "Bitcoin Developer Guide." Developer Guide. N.p., n.d. Web.
https://bitcoin.org/en/developer-guide
19. Secure Hash Standard, National Institute of Standards and Technology, March 2012
http://csrc.nist.gov/publications/fips/fips180-4/fips-180-4.pdf
20. McDowell, Moore. Principles of Economics. London: McGraw-Hill, 2006. Print.
21. Fender, John. Monetary Policy. Hoboken, NJ: Wiley, 2012. Print.
22. Bofinger, Peter, ulian Reischle, and Andrea Sch chter. Monetary Policy: Goals,
Institutions, Strategies, and Instruments. Oxford: Oxford UP, 2001. Print.
23. Abel, Andrew B., and Ben Bernanke. Macroeconomics. Boston: Addison-Wesley, 2001.
Print.
24. Bradford, De Long J. Macroeconomics. Boston: McGraw-Hill Irwin, 2002. Print.
42
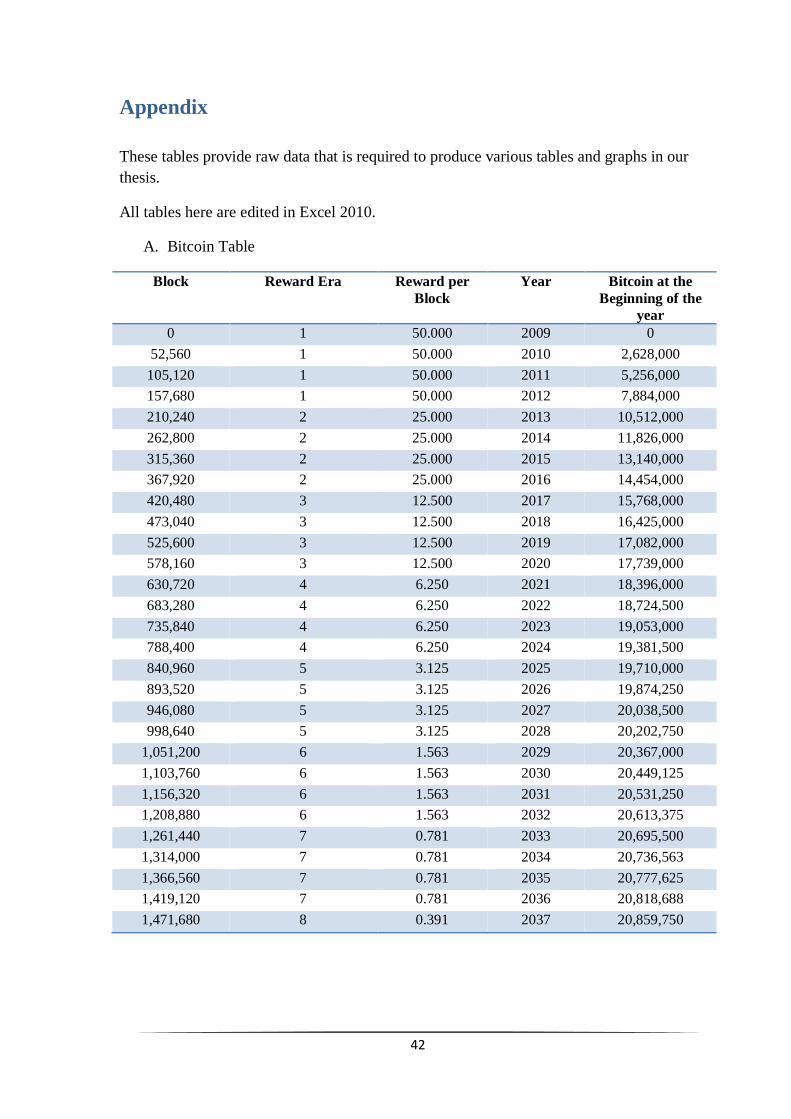
Appendix
These tables provide raw data that is required to produce various tables and graphs in our
thesis.
All tables here are edited in Excel 2010.
A. Bitcoin Table
Block Reward Era Reward per
Block
Year Bitcoin at the
Beginning of the
year
0 1 50.000 2009 0
52,560 1 50.000 2010 2,628,000
105,120 1 50.000 2011 5,256,000
157,680 1 50.000 2012 7,884,000
210,240 2 25.000 2013 10,512,000
262,800 2 25.000 2014 11,826,000
315,360 2 25.000 2015 13,140,000
367,920 2 25.000 2016 14,454,000
420,480 3 12.500 2017 15,768,000
473,040 3 12.500 2018 16,425,000
525,600 3 12.500 2019 17,082,000
578,160 3 12.500 2020 17,739,000
630,720 4 6.250 2021 18,396,000
683,280 4 6.250 2022 18,724,500
735,840 4 6.250 2023 19,053,000
788,400 4 6.250 2024 19,381,500
840,960 5 3.125 2025 19,710,000
893,520 5 3.125 2026 19,874,250
946,080 5 3.125 2027 20,038,500
998,640 5 3.125 2028 20,202,750
1,051,200 6 1.563 2029 20,367,000
1,103,760 6 1.563 2030 20,449,125
1,156,320 6 1.563 2031 20,531,250
1,208,880 6 1.563 2032 20,613,375
1,261,440 7 0.781 2033 20,695,500
1,314,000 7 0.781 2034 20,736,563
1,366,560 7 0.781 2035 20,777,625
1,419,120 7 0.781 2036 20,818,688
1,471,680 8 0.391 2037 20,859,750
43
Year Number of Bitcoin
Added Each Year
Number of
Bitcoin At the
End of the
Year
Inflation Rate Percentage of
Bitcoin numbers
to the Total
Number
2009 2,628,000 2,628,000 infinite 12.51%
2010 2,628,000 5,256,000 100.00% 25.03%
2011 2,628,000 7,884,000 50.00% 37.54%
2012 2,628,000 10,512,000 33.33% 50.06%
2013 1,314,000 11,826,000 12.50% 56.31%
2014 1,314,000 13,140,000 11.11% 62.57%
2015 1,314,000 14,454,000 10.00% 68.83%
2016 1,314,000 15,768,000 9.09% 75.09%
2017 657,000 16,425,000 4.17% 78.21%
2018 657,000 17,082,000 4.00% 81.34%
2019 657,000 17,739,000 3.85% 84.47%
2020 657,000 18,396,000 3.70% 87.60%
2021 328,500 18,724,500 1.79% 89.16%
2022 328,500 19,053,000 1.75% 90.73%
2023 328,500 19,381,500 1.72% 92.29%
2024 328,500 19,710,000 1.69% 93.86%
2025 164,250 19,874,250 0.83% 94.64%
2026 164,250 20,038,500 0.83% 95.42%
2027 164,250 20,202,750 0.82% 96.20%
2028 164,250 20,367,000 0.81% 96.99%
2029 82,125 20,449,125 0.40% 97.38%
2030 82,125 20,531,250 0.40% 97.77%
2031 82,125 20,613,375 0.40% 98.16%
2032 82,125 20,695,500 0.40% 98.55%
2033 41,063 20,736,563 0.20% 98.75%
2034 41,063 20,777,625 0.20% 98.94%
2035 41,063 20,818,688 0.20% 99.14%
2036 41,063 20,859,750 0.20% 99.33%
2037 20,531 20,880,281 0.10% 99.43%
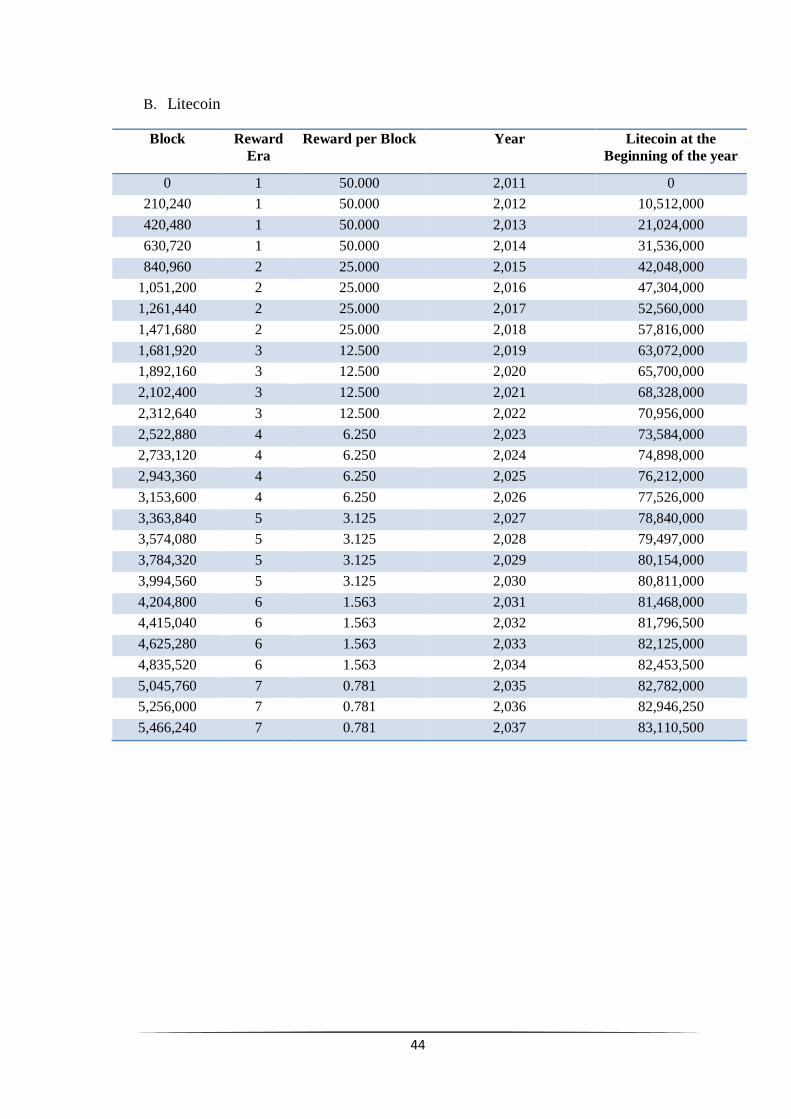
44
B. Litecoin
Block Reward
Era
Reward per Block Year Litecoin at the
Beginning of the year
0 1 50.000 2,011 0
210,240 1 50.000 2,012 10,512,000
420,480 1 50.000 2,013 21,024,000
630,720 1 50.000 2,014 31,536,000
840,960 2 25.000 2,015 42,048,000
1,051,200 2 25.000 2,016 47,304,000
1,261,440 2 25.000 2,017 52,560,000
1,471,680 2 25.000 2,018 57,816,000
1,681,920 3 12.500 2,019 63,072,000
1,892,160 3 12.500 2,020 65,700,000
2,102,400 3 12.500 2,021 68,328,000
2,312,640 3 12.500 2,022 70,956,000
2,522,880 4 6.250 2,023 73,584,000
2,733,120 4 6.250 2,024 74,898,000
2,943,360 4 6.250 2,025 76,212,000
3,153,600 4 6.250 2,026 77,526,000
3,363,840 5 3.125 2,027 78,840,000
3,574,080 5 3.125 2,028 79,497,000
3,784,320 5 3.125 2,029 80,154,000
3,994,560 5 3.125 2,030 80,811,000
4,204,800 6 1.563 2,031 81,468,000
4,415,040 6 1.563 2,032 81,796,500
4,625,280 6 1.563 2,033 82,125,000
4,835,520 6 1.563 2,034 82,453,500
5,045,760 7 0.781 2,035 82,782,000
5,256,000 7 0.781 2,036 82,946,250
5,466,240 7 0.781 2,037 83,110,500
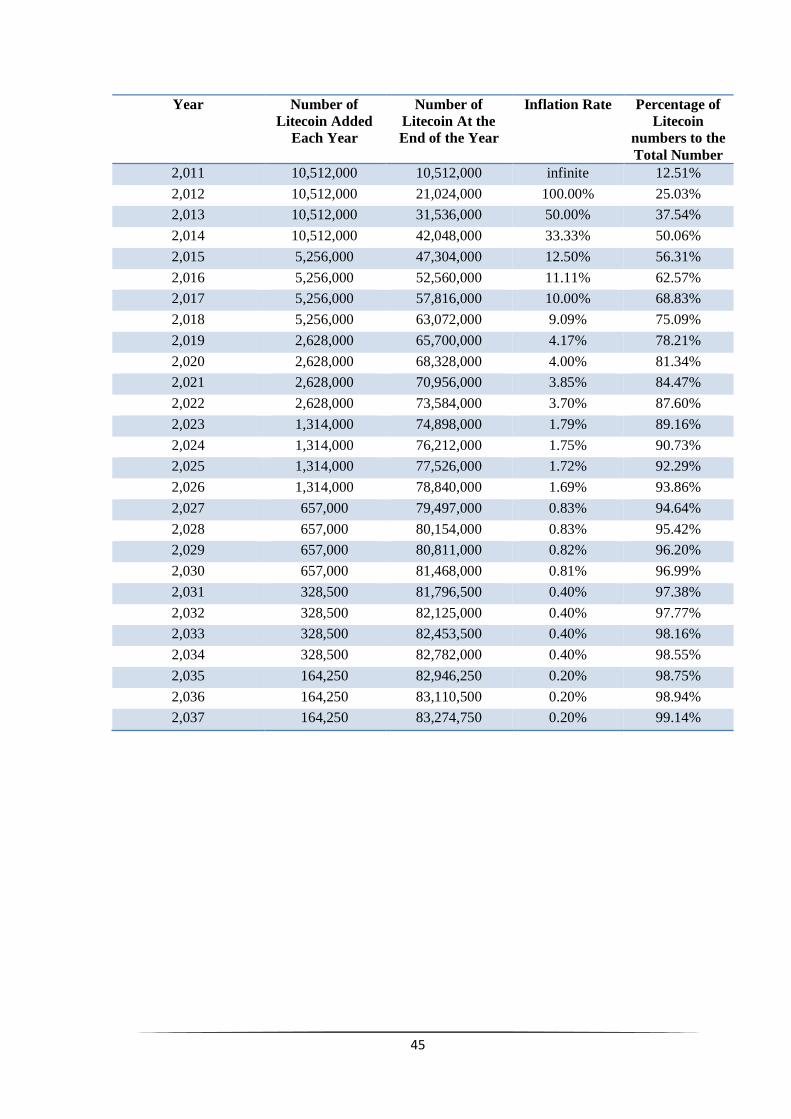
45
Year Number of
Litecoin Added
Each Year
Number of
Litecoin At the
End of the Year
Inflation Rate Percentage of
Litecoin
numbers to the
Total Number
2,011 10,512,000 10,512,000 infinite 12.51%
2,012 10,512,000 21,024,000 100.00% 25.03%
2,013 10,512,000 31,536,000 50.00% 37.54%
2,014 10,512,000 42,048,000 33.33% 50.06%
2,015 5,256,000 47,304,000 12.50% 56.31%
2,016 5,256,000 52,560,000 11.11% 62.57%
2,017 5,256,000 57,816,000 10.00% 68.83%
2,018 5,256,000 63,072,000 9.09% 75.09%
2,019 2,628,000 65,700,000 4.17% 78.21%
2,020 2,628,000 68,328,000 4.00% 81.34%
2,021 2,628,000 70,956,000 3.85% 84.47%
2,022 2,628,000 73,584,000 3.70% 87.60%
2,023 1,314,000 74,898,000 1.79% 89.16%
2,024 1,314,000 76,212,000 1.75% 90.73%
2,025 1,314,000 77,526,000 1.72% 92.29%
2,026 1,314,000 78,840,000 1.69% 93.86%
2,027 657,000 79,497,000 0.83% 94.64%
2,028 657,000 80,154,000 0.83% 95.42%
2,029 657,000 80,811,000 0.82% 96.20%
2,030 657,000 81,468,000 0.81% 96.99%
2,031 328,500 81,796,500 0.40% 97.38%
2,032 328,500 82,125,000 0.40% 97.77%
2,033 328,500 82,453,500 0.40% 98.16%
2,034 328,500 82,782,000 0.40% 98.55%
2,035 164,250 82,946,250 0.20% 98.75%
2,036 164,250 83,110,500 0.20% 98.94%
2,037 164,250 83,274,750 0.20% 99.14%
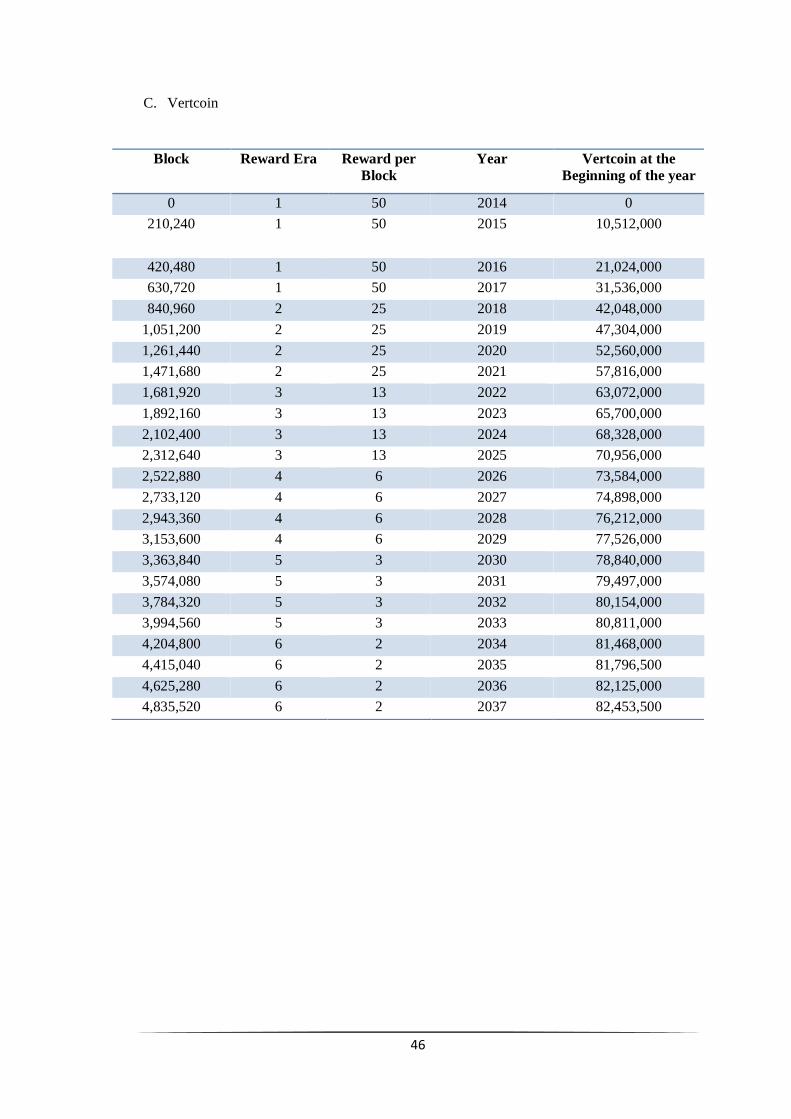
46
C. Vertcoin
Block Reward Era Reward per
Block
Year Vertcoin at the
Beginning of the year
0 1 50 2014 0
210,240 1 50 2015 10,512,000
420,480 1 50 2016 21,024,000
630,720 1 50 2017 31,536,000
840,960 2 25 2018 42,048,000
1,051,200 2 25 2019 47,304,000
1,261,440 2 25 2020 52,560,000
1,471,680 2 25 2021 57,816,000
1,681,920 3 13 2022 63,072,000
1,892,160 3 13 2023 65,700,000
2,102,400 3 13 2024 68,328,000
2,312,640 3 13 2025 70,956,000
2,522,880 4 6 2026 73,584,000
2,733,120 4 6 2027 74,898,000
2,943,360 4 6 2028 76,212,000
3,153,600 4 6 2029 77,526,000
3,363,840 5 3 2030 78,840,000
3,574,080 5 3 2031 79,497,000
3,784,320 5 3 2032 80,154,000
3,994,560 5 3 2033 80,811,000
4,204,800 6 2 2034 81,468,000
4,415,040 6 2 2035 81,796,500
4,625,280 6 2 2036 82,125,000
4,835,520 6 2 2037 82,453,500
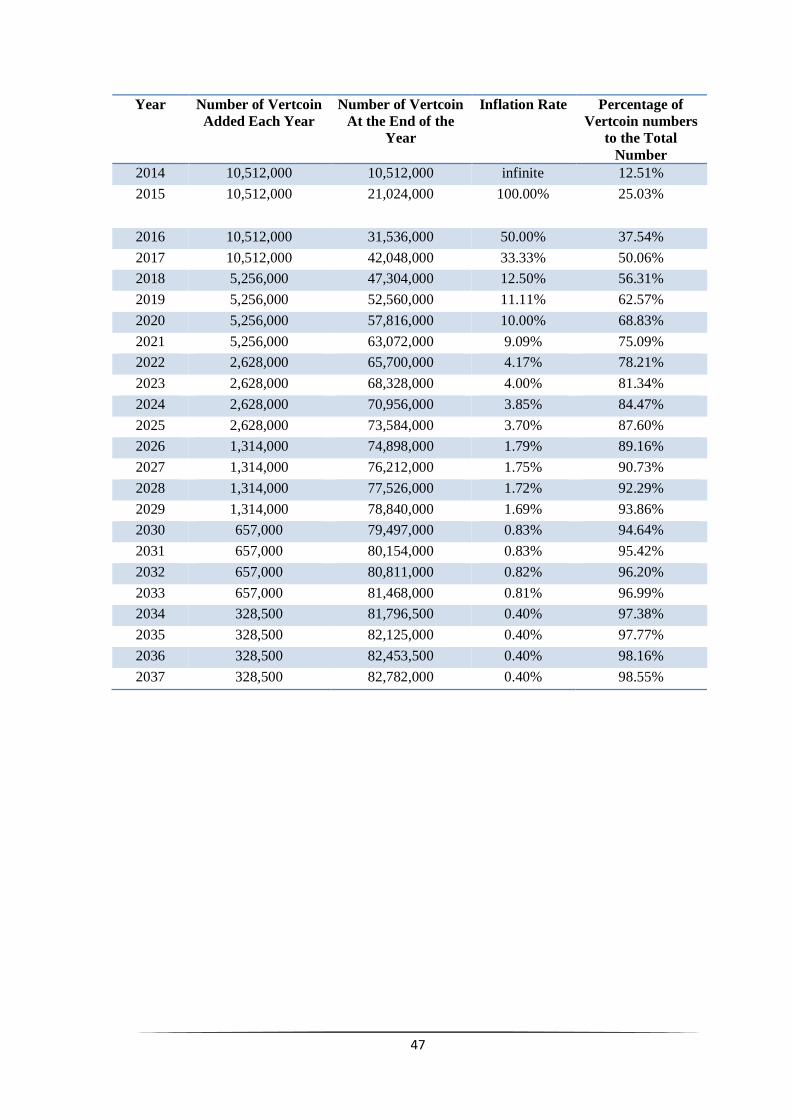
47
Year Number of Vertcoin
Added Each Year
Number of Vertcoin
At the End of the
Year
Inflation Rate Percentage of
Vertcoin numbers
to the Total
Number
2014 10,512,000 10,512,000 infinite 12.51%
2015 10,512,000 21,024,000 100.00% 25.03%
2016 10,512,000 31,536,000 50.00% 37.54%
2017 10,512,000 42,048,000 33.33% 50.06%
2018 5,256,000 47,304,000 12.50% 56.31%
2019 5,256,000 52,560,000 11.11% 62.57%
2020 5,256,000 57,816,000 10.00% 68.83%
2021 5,256,000 63,072,000 9.09% 75.09%
2022 2,628,000 65,700,000 4.17% 78.21%
2023 2,628,000 68,328,000 4.00% 81.34%
2024 2,628,000 70,956,000 3.85% 84.47%
2025 2,628,000 73,584,000 3.70% 87.60%
2026 1,314,000 74,898,000 1.79% 89.16%
2027 1,314,000 76,212,000 1.75% 90.73%
2028 1,314,000 77,526,000 1.72% 92.29%
2029 1,314,000 78,840,000 1.69% 93.86%
2030 657,000 79,497,000 0.83% 94.64%
2031 657,000 80,154,000 0.83% 95.42%
2032 657,000 80,811,000 0.82% 96.20%
2033 657,000 81,468,000 0.81% 96.99%
2034 328,500 81,796,500 0.40% 97.38%
2035 328,500 82,125,000 0.40% 97.77%
2036 328,500 82,453,500 0.40% 98.16%
2037 328,500 82,782,000 0.40% 98.55%
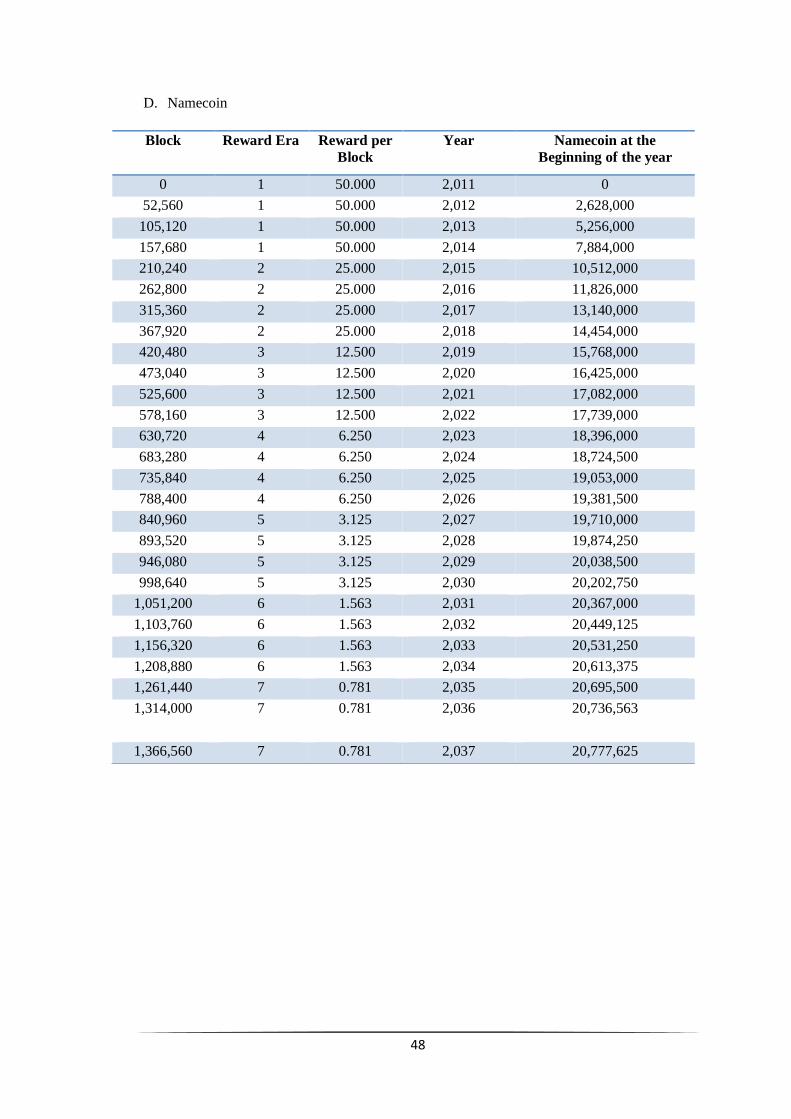
48
D. Namecoin
Block Reward Era Reward per
Block
Year Namecoin at the
Beginning of the year
0 1 50.000 2,011 0
52,560 1 50.000 2,012 2,628,000
105,120 1 50.000 2,013 5,256,000
157,680 1 50.000 2,014 7,884,000
210,240 2 25.000 2,015 10,512,000
262,800 2 25.000 2,016 11,826,000
315,360 2 25.000 2,017 13,140,000
367,920 2 25.000 2,018 14,454,000
420,480 3 12.500 2,019 15,768,000
473,040 3 12.500 2,020 16,425,000
525,600 3 12.500 2,021 17,082,000
578,160 3 12.500 2,022 17,739,000
630,720 4 6.250 2,023 18,396,000
683,280 4 6.250 2,024 18,724,500
735,840 4 6.250 2,025 19,053,000
788,400 4 6.250 2,026 19,381,500
840,960 5 3.125 2,027 19,710,000
893,520 5 3.125 2,028 19,874,250
946,080 5 3.125 2,029 20,038,500
998,640 5 3.125 2,030 20,202,750
1,051,200 6 1.563 2,031 20,367,000
1,103,760 6 1.563 2,032 20,449,125
1,156,320 6 1.563 2,033 20,531,250
1,208,880 6 1.563 2,034 20,613,375
1,261,440 7 0.781 2,035 20,695,500
1,314,000 7 0.781 2,036 20,736,563
1,366,560 7 0.781 2,037 20,777,625
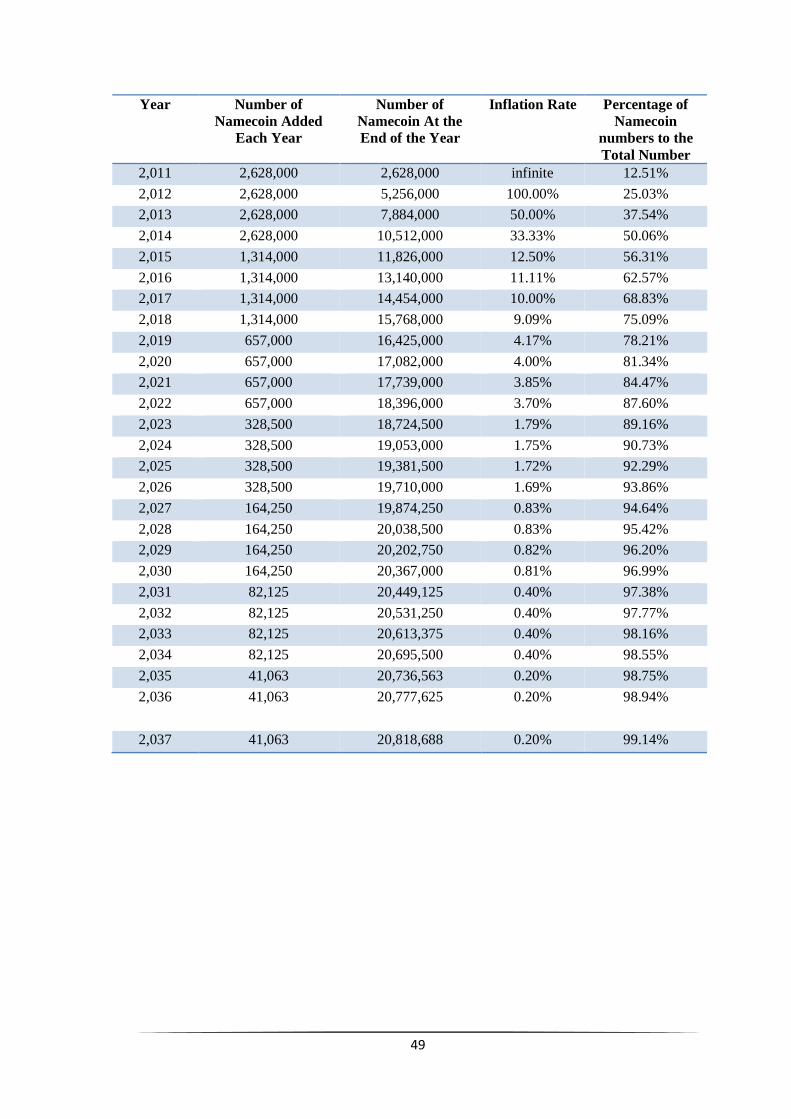
49
Year Number of
Namecoin Added
Each Year
Number of
Namecoin At the
End of the Year
Inflation Rate Percentage of
Namecoin
numbers to the
Total Number
2,011 2,628,000 2,628,000 infinite 12.51%
2,012 2,628,000 5,256,000 100.00% 25.03%
2,013 2,628,000 7,884,000 50.00% 37.54%
2,014 2,628,000 10,512,000 33.33% 50.06%
2,015 1,314,000 11,826,000 12.50% 56.31%
2,016 1,314,000 13,140,000 11.11% 62.57%
2,017 1,314,000 14,454,000 10.00% 68.83%
2,018 1,314,000 15,768,000 9.09% 75.09%
2,019 657,000 16,425,000 4.17% 78.21%
2,020 657,000 17,082,000 4.00% 81.34%
2,021 657,000 17,739,000 3.85% 84.47%
2,022 657,000 18,396,000 3.70% 87.60%
2,023 328,500 18,724,500 1.79% 89.16%
2,024 328,500 19,053,000 1.75% 90.73%
2,025 328,500 19,381,500 1.72% 92.29%
2,026 328,500 19,710,000 1.69% 93.86%
2,027 164,250 19,874,250 0.83% 94.64%
2,028 164,250 20,038,500 0.83% 95.42%
2,029 164,250 20,202,750 0.82% 96.20%
2,030 164,250 20,367,000 0.81% 96.99%
2,031 82,125 20,449,125 0.40% 97.38%
2,032 82,125 20,531,250 0.40% 97.77%
2,033 82,125 20,613,375 0.40% 98.16%
2,034 82,125 20,695,500 0.40% 98.55%
2,035 41,063 20,736,563 0.20% 98.75%
2,036 41,063 20,777,625 0.20% 98.94%
2,037 41,063 20,818,688 0.20% 99.14%
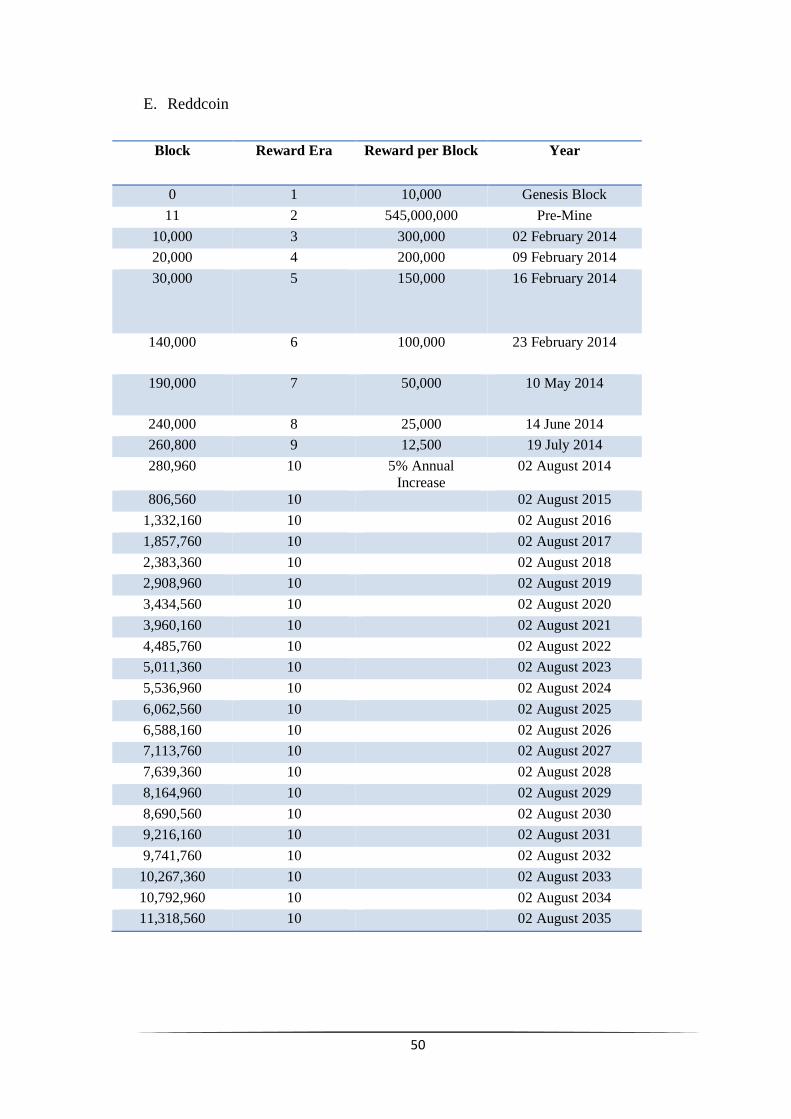
50
E. Reddcoin
Block Reward Era Reward per Block Year
0 1 10,000 Genesis Block
11 2 545,000,000 Pre-Mine
10,000 3 300,000 02 February 2014
20,000 4 200,000 09 February 2014
30,000 5 150,000 16 February 2014
140,000 6 100,000 23 February 2014
190,000 7 50,000 10 May 2014
240,000 8 25,000 14 June 2014
260,800 9 12,500 19 July 2014
280,960 10 5% Annual
Increase
02 August 2014
806,560 10 02 August 2015
1,332,160 10 02 August 2016
1,857,760 10 02 August 2017
2,383,360 10 02 August 2018
2,908,960 10 02 August 2019
3,434,560 10 02 August 2020
3,960,160 10 02 August 2021
4,485,760 10 02 August 2022
5,011,360 10 02 August 2023
5,536,960 10 02 August 2024
6,062,560 10 02 August 2025
6,588,160 10 02 August 2026
7,113,760 10 02 August 2027
7,639,360 10 02 August 2028
8,164,960 10 02 August 2029
8,690,560 10 02 August 2030
9,216,160 10 02 August 2031
9,741,760 10 02 August 2032
10,267,360 10 02 August 2033
10,792,960 10 02 August 2034
11,318,560 10 02 August 2035
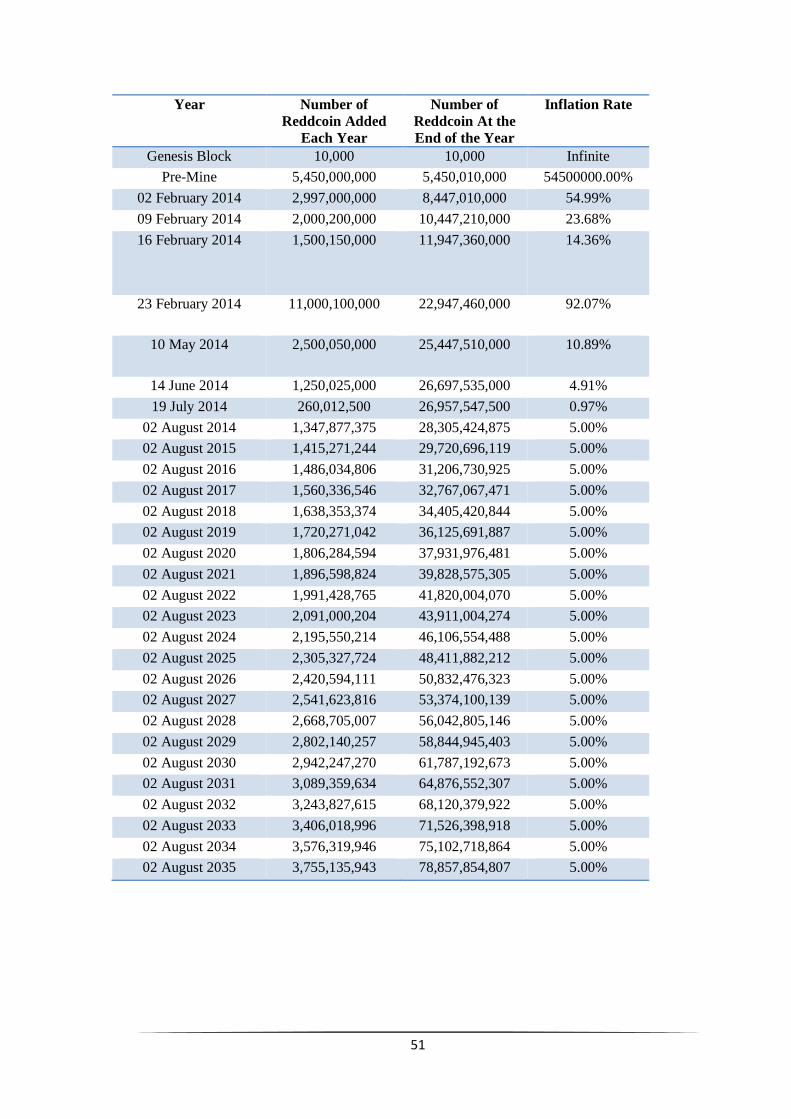
51
Year Number of
Reddcoin Added
Each Year
Number of
Reddcoin At the
End of the Year
Inflation Rate
Genesis Block 10,000 10,000 Infinite
Pre-Mine 5,450,000,000 5,450,010,000 54500000.00%
02 February 2014 2,997,000,000 8,447,010,000 54.99%
09 February 2014 2,000,200,000 10,447,210,000 23.68%
16 February 2014 1,500,150,000 11,947,360,000 14.36%
23 February 2014 11,000,100,000 22,947,460,000 92.07%
10 May 2014 2,500,050,000 25,447,510,000 10.89%
14 June 2014 1,250,025,000 26,697,535,000 4.91%
19 July 2014 260,012,500 26,957,547,500 0.97%
02 August 2014 1,347,877,375 28,305,424,875 5.00%
02 August 2015 1,415,271,244 29,720,696,119 5.00%
02 August 2016 1,486,034,806 31,206,730,925 5.00%
02 August 2017 1,560,336,546 32,767,067,471 5.00%
02 August 2018 1,638,353,374 34,405,420,844 5.00%
02 August 2019 1,720,271,042 36,125,691,887 5.00%
02 August 2020 1,806,284,594 37,931,976,481 5.00%
02 August 2021 1,896,598,824 39,828,575,305 5.00%
02 August 2022 1,991,428,765 41,820,004,070 5.00%
02 August 2023 2,091,000,204 43,911,004,274 5.00%
02 August 2024 2,195,550,214 46,106,554,488 5.00%
02 August 2025 2,305,327,724 48,411,882,212 5.00%
02 August 2026 2,420,594,111 50,832,476,323 5.00%
02 August 2027 2,541,623,816 53,374,100,139 5.00%
02 August 2028 2,668,705,007 56,042,805,146 5.00%
02 August 2029 2,802,140,257 58,844,945,403 5.00%
02 August 2030 2,942,247,270 61,787,192,673 5.00%
02 August 2031 3,089,359,634 64,876,552,307 5.00%
02 August 2032 3,243,827,615 68,120,379,922 5.00%
02 August 2033 3,406,018,996 71,526,398,918 5.00%
02 August 2034 3,576,319,946 75,102,718,864 5.00%
02 August 2035 3,755,135,943 78,857,854,807 5.00%
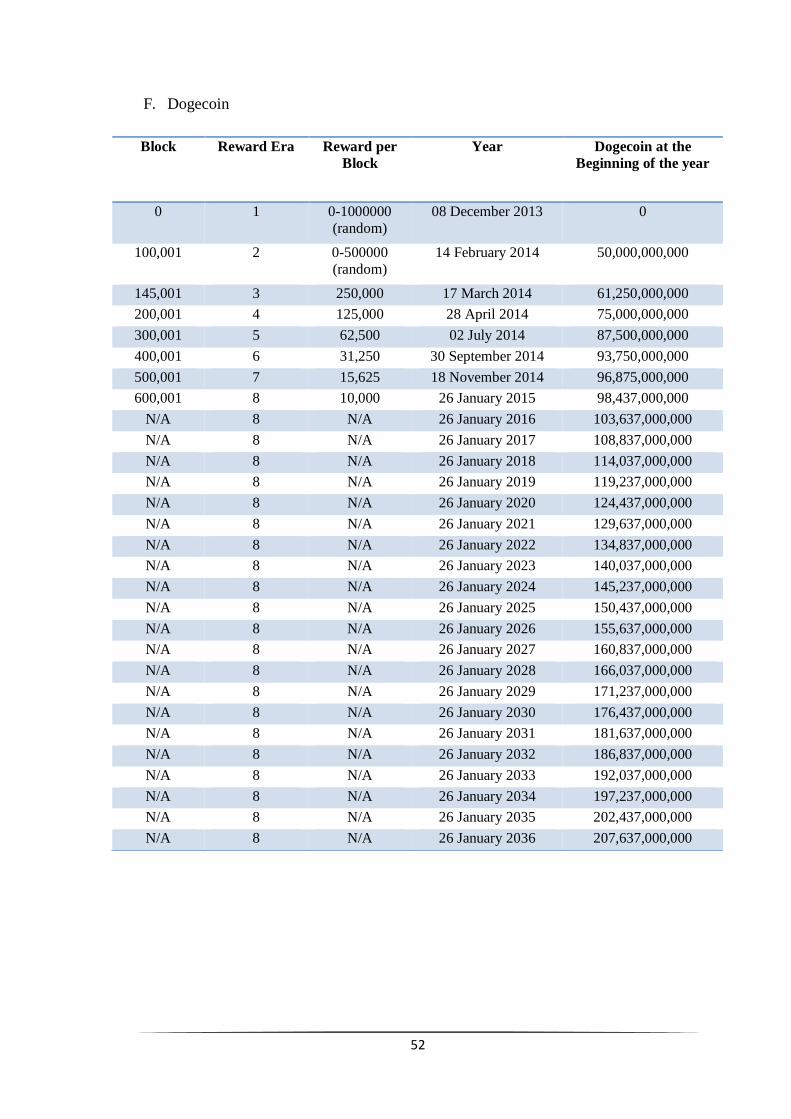
52
F. Dogecoin
Block Reward Era Reward per
Block
Year Dogecoin at the
Beginning of the year
0 1 0-1000000
(random)
08 December 2013 0
100,001 2 0-500000
(random)
14 February 2014 50,000,000,000
145,001 3 250,000 17 March 2014 61,250,000,000
200,001 4 125,000 28 April 2014 75,000,000,000
300,001 5 62,500 02 July 2014 87,500,000,000
400,001 6 31,250 30 September 2014 93,750,000,000
500,001 7 15,625 18 November 2014 96,875,000,000
600,001 8 10,000 26 January 2015 98,437,000,000
N/A 8 N/A 26 January 2016 103,637,000,000
N/A 8 N/A 26 January 2017 108,837,000,000
N/A 8 N/A 26 January 2018 114,037,000,000
N/A 8 N/A 26 January 2019 119,237,000,000
N/A 8 N/A 26 January 2020 124,437,000,000
N/A 8 N/A 26 January 2021 129,637,000,000
N/A 8 N/A 26 January 2022 134,837,000,000
N/A 8 N/A 26 January 2023 140,037,000,000
N/A 8 N/A 26 January 2024 145,237,000,000
N/A 8 N/A 26 January 2025 150,437,000,000
N/A 8 N/A 26 January 2026 155,637,000,000
N/A 8 N/A 26 January 2027 160,837,000,000
N/A 8 N/A 26 January 2028 166,037,000,000
N/A 8 N/A 26 January 2029 171,237,000,000
N/A 8 N/A 26 January 2030 176,437,000,000
N/A 8 N/A 26 January 2031 181,637,000,000
N/A 8 N/A 26 January 2032 186,837,000,000
N/A 8 N/A 26 January 2033 192,037,000,000
N/A 8 N/A 26 January 2034 197,237,000,000
N/A 8 N/A 26 January 2035 202,437,000,000
N/A 8 N/A 26 January 2036 207,637,000,000
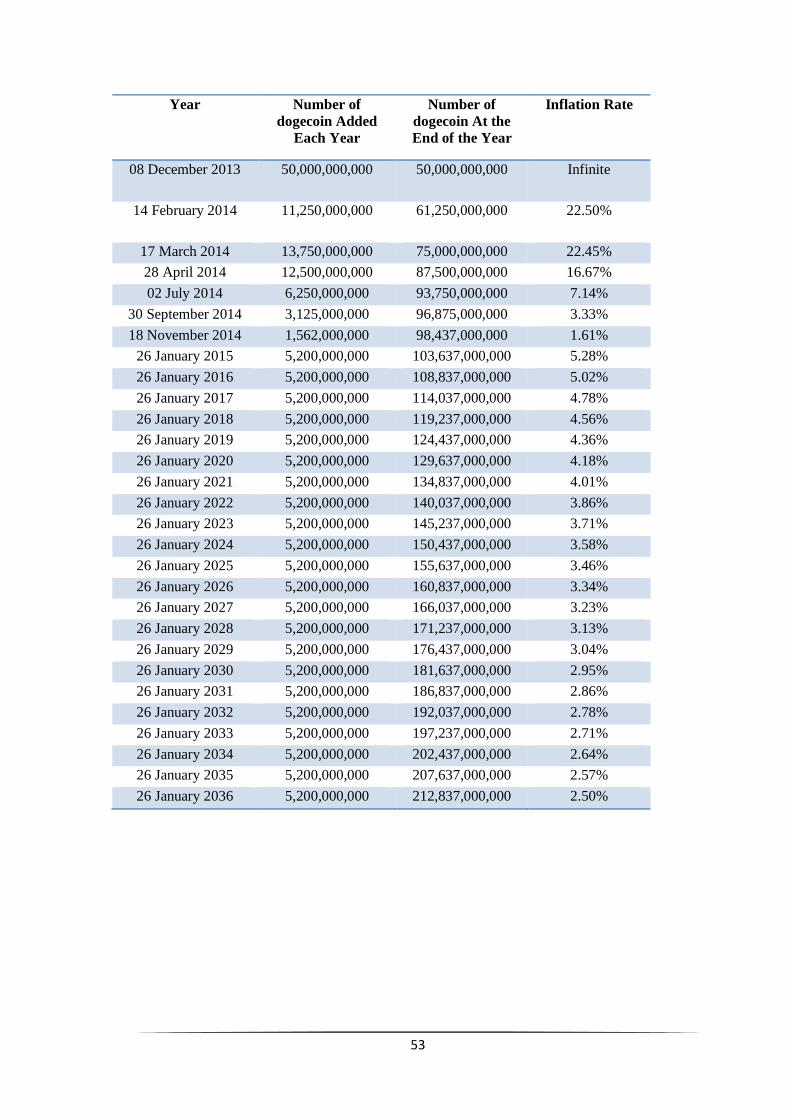
53
Year Number of
dogecoin Added
Each Year
Number of
dogecoin At the
End of the Year
Inflation Rate
08 December 2013 50,000,000,000 50,000,000,000 Infinite
14 February 2014 11,250,000,000 61,250,000,000 22.50%
17 March 2014 13,750,000,000 75,000,000,000 22.45%
28 April 2014 12,500,000,000 87,500,000,000 16.67%
02 July 2014 6,250,000,000 93,750,000,000 7.14%
30 September 2014 3,125,000,000 96,875,000,000 3.33%
18 November 2014 1,562,000,000 98,437,000,000 1.61%
26 January 2015 5,200,000,000 103,637,000,000 5.28%
26 January 2016 5,200,000,000 108,837,000,000 5.02%
26 January 2017 5,200,000,000 114,037,000,000 4.78%
26 January 2018 5,200,000,000 119,237,000,000 4.56%
26 January 2019 5,200,000,000 124,437,000,000 4.36%
26 January 2020 5,200,000,000 129,637,000,000 4.18%
26 January 2021 5,200,000,000 134,837,000,000 4.01%
26 January 2022 5,200,000,000 140,037,000,000 3.86%
26 January 2023 5,200,000,000 145,237,000,000 3.71%
26 January 2024 5,200,000,000 150,437,000,000 3.58%
26 January 2025 5,200,000,000 155,637,000,000 3.46%
26 January 2026 5,200,000,000 160,837,000,000 3.34%
26 January 2027 5,200,000,000 166,037,000,000 3.23%
26 January 2028 5,200,000,000 171,237,000,000 3.13%
26 January 2029 5,200,000,000 176,437,000,000 3.04%
26 January 2030 5,200,000,000 181,637,000,000 2.95%
26 January 2031 5,200,000,000 186,837,000,000 2.86%
26 January 2032 5,200,000,000 192,037,000,000 2.78%
26 January 2033 5,200,000,000 197,237,000,000 2.71%
26 January 2034 5,200,000,000 202,437,000,000 2.64%
26 January 2035 5,200,000,000 207,637,000,000 2.57%
26 January 2036 5,200,000,000 212,837,000,000 2.50%