Economics of California Agriculture: A Brief Overviewceventura.ucanr.edu/files/183174.pdf ·...
19
Economics of California Agriculture: A Brief Overview Rachael Goodhue
Transcript of Economics of California Agriculture: A Brief Overviewceventura.ucanr.edu/files/183174.pdf ·...

Economics of California Agriculture: A Brief Overview
Rachael Goodhue

KEY DRIVERS OF THE ECONOMICS OF CALIFORNIA AGRICULTURE

Economics of California Agriculture • Geography and climate • Infrastructure
– transportation, power, water
• Technology • Access to inputs, including competition from urban uses
– Water – Labor – Land – Human capital – Energy
• Pests and pest management techniques • Markets for output
– Competing suppliers – Demand- population growth, income growth
• Regulation – Social – Environmental

EVOLUTION OVER TIME

Epochs in California Agriculture Johnston and McCalla (2004)
• 1769-1821 Spanish Mission Period
• 1821-1848 Mexican Period
• 1848-1860s Gold, Statehood, Cattle and Growth
• 1860s-1890s Sheep, Wheat & Early Horticulture
• 1890-1930 Transformation to Intensive Agriculture
• 1930-1949 External Shocks: Depression & War
• 1950-1970 Big Water, Growth, Relocation and Diversification
• 1970-2000 Increased Instability, Internationalization & Intensification
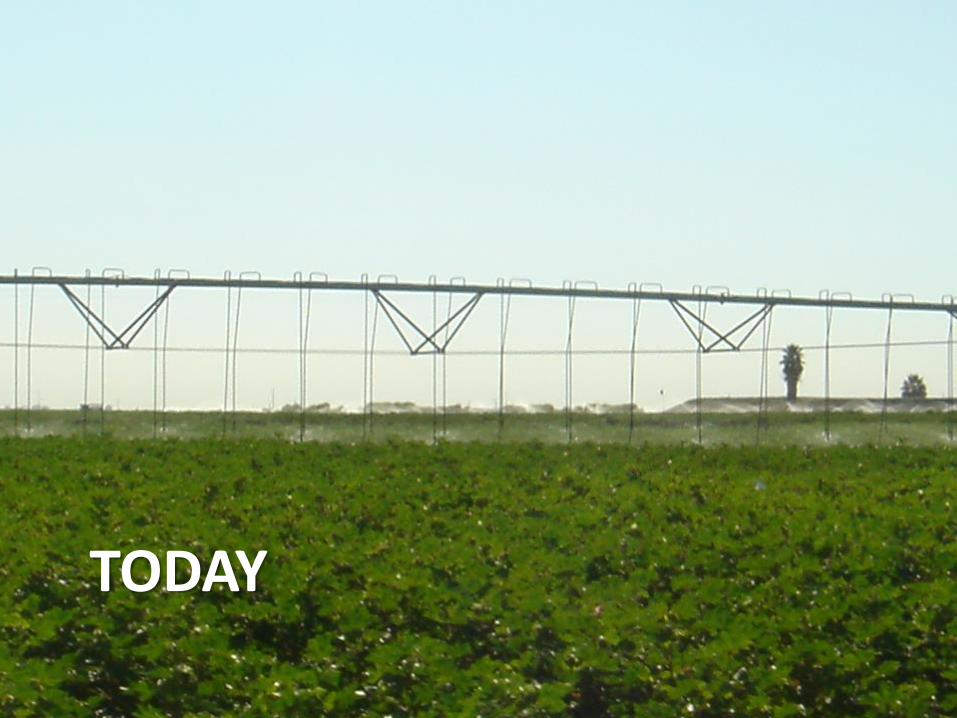
TODAY
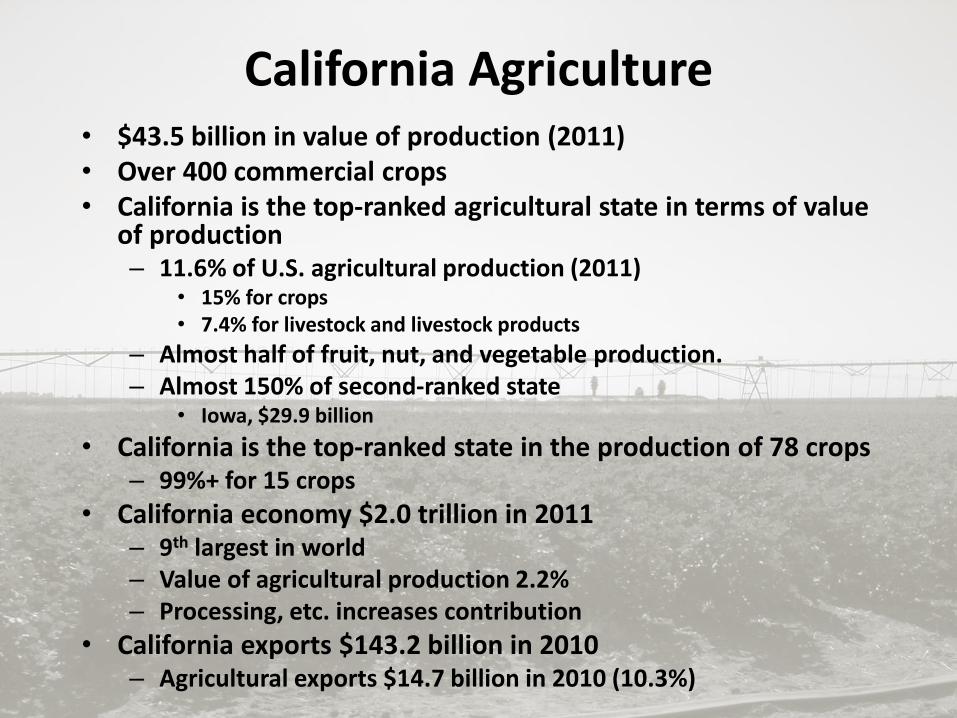
California Agriculture • $43.5 billion in value of production (2011) • Over 400 commercial crops • California is the top-ranked agricultural state in terms of value
of production – 11.6% of U.S. agricultural production (2011)
• 15% for crops • 7.4% for livestock and livestock products
– Almost half of fruit, nut, and vegetable production. – Almost 150% of second-ranked state
• Iowa, $29.9 billion
• California is the top-ranked state in the production of 78 crops – 99%+ for 15 crops
• California economy $2.0 trillion in 2011 – 9th largest in world – Value of agricultural production 2.2% – Processing, etc. increases contribution
• California exports $143.2 billion in 2010 – Agricultural exports $14.7 billion in 2010 (10.3%)

Top Agricultural Counties (2011) County Value
($billion) Major Commodities
Fresno 6.9 Almonds, Milk, Livestock, Raisin Grapes, Proc. Tomatoes
Tulare 5.6 Milk, Cattle & Calves, Navel Oranges, Table Grapes, Corn Silage
Kern 5.4 Milk, Almonds, Table Grapes, Vegetables, Pistachios
Monterey 3.9 Berries and Strawberries, Romaine Lettuce, Head Lettuce, Leaf Lettuce, Broccoli
Merced 3.3 Milk, Almonds, Cattle & Calves, Chickens, Sweet Potatoes
Stanislaus 3.1 Milk, Almonds, Chickens, English Walnuts, Corn Silage
San Joaquin
2.2 Milk, Wine Grapes, English Walnuts, Almonds, Sweet Cherries
Kings 2.2 Milk, Pima Cotton Lint, Cattle & Calves, Proc. Tomatoes, Alfalfa Hay
Imperial 2.0 Cattle Heifers and Steers, Leaf Lettuce, Alfalfa Hay, Head Lettuce, Broccoli
Ventura 1.8 Berries and Strawberries, Raspberries, Lemons, Celery, Tomatoes

Value of Production by Category: 2011, in Billions of Dollars
Vegetable & Melon (7.24)
Fruit & Nut (15.32)
Field Crops (4.93)
Greenhouse, Nursery, &
Floriculture (3.69)
Livestock & Poultry
(12.36)

Top-producing Counties for Top 10 Crops (2011)
Crop Top Counties
Milk and Cream Not reported
Almonds Fresno, Kern, Stanislaus, Merced, Madera
Grapes (all) Fresno, Kern, Tulare, Napa, Sonoma
Cattle and calves Not reported
Nursery San Diego, Monterey, Riverside, Ventura, Los Angeles
Strawberries Monterey, Ventura, Santa Barbara, Santa Cruz, San Luis Obispo
Hay Kern, Imperial, Tulare, Merced, Fresno
Lettuce (all) Monterey, Imperial, Fresno, Santa Barbara, San Benito
Walnuts San Joaquin, Butte, Stanislaus, Sutter, Tulare
Tomatoes Fresh: Fresno, San Diego, Merced, San Joaquin, Stanislaus Processed: Fresno, Kings, Yolo, San Joaquin, Stanislaus

California Farms: 2007 Census of Agriculture
• 81,033 farms in 2007 – 87,991 farms in 1997 – 79,631 farms in 2002
• Average farm size 313 acres – 327 acres in 1997 – 346 acres in 2002 – 418 acres for US in 2007
• Average value of production $418,164/farm – $264,574 in 1997 – $323,205 in 2002. – $134,807 for US in 2007
• Following slides also use 2007 Census of Agriculture

Farm Size (Acres)
California U.S.
1 to 9 10 to 49 50 to 179
180 to 499 500 to 999 1000 to 1999
2000 or more
1 to 9 10 to 49 50 to 179
180 to 499 500 to 999 1000 to 1999
2000 or more
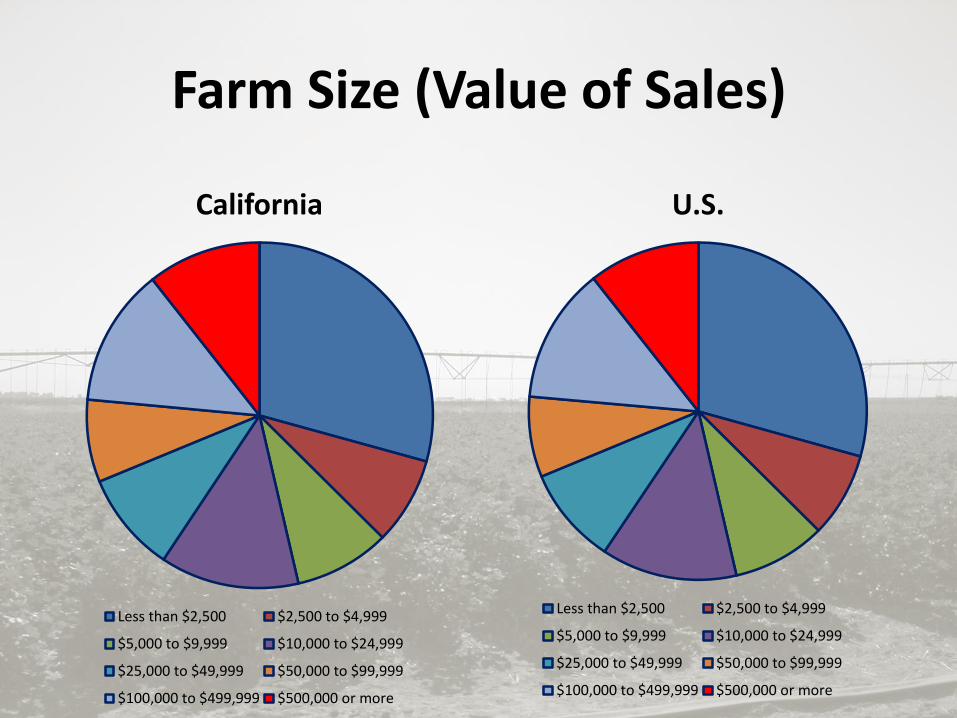
Farm Size (Value of Sales)
California U.S.
Less than $2,500 $2,500 to $4,999
$5,000 to $9,999 $10,000 to $24,999
$25,000 to $49,999 $50,000 to $99,999
$100,000 to $499,999 $500,000 or more
Less than $2,500 $2,500 to $4,999
$5,000 to $9,999 $10,000 to $24,999
$25,000 to $49,999 $50,000 to $99,999
$100,000 to $499,999 $500,000 or more

Total Sales by Farm Sales Category
California U.S.
Less than $2,499 $2,500 to $4,999
$5,000 to $9,999 $10,000 to $24,999
$25,000 to $49,999 $50,000 to $99,999
$100,000 to $499,999 $500,000 or more
Less than $2,500 $2,500 to $4,999
$5,000 to $9,999 $10,000 to $24,999
$25,000 to $49,999 $50,000 to $99,999
$100,000 to $499,999 $500,000 or more
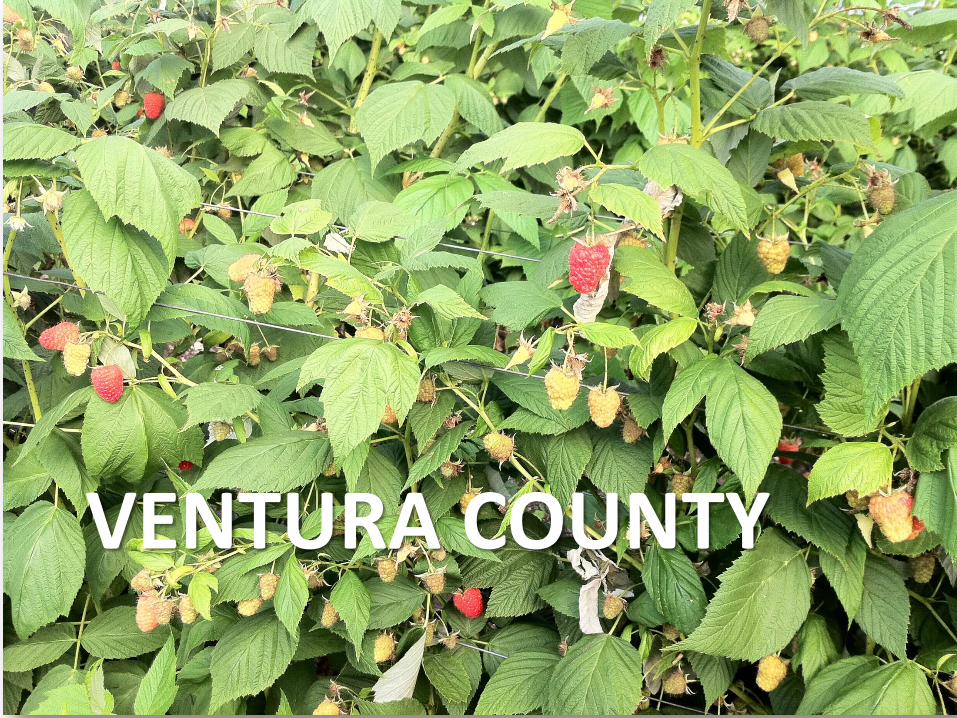
VENTURA COUNTY

Farm Size (Acres) 2007 Census of Agriculture
California Ventura County
1 to 9 10 to 49 50 to 179
180 to 499 500 to 999 1000 to 1999
2000 or more
1 to 9 10 to 49 50 to 179
180 to 499 500 to 999 1000 or more

Farm Size (Value of Sales) 2007 Census of Agriculture
California Ventura County
Less than $2,500 $2,500 to $4,999
$5,000 to $9,999 $10,000 to $24,999
$25,000 to $49,999 $50,000 to $99,999
$100,000 to $499,999 $500,000 or more
Less than $2,500 $2,500 to $4,999
$5,000 to $9,999 $10,000 to $24,999
$25,000 to $49,999 $50,000 to $99,999
$100,000 to 500,000 $500,000 or more

Total Sales by Farm Sales Category 2007 Census of Agriculture
California Ventura County
Less than $2,500 $2,500 to $4,999
$5,000 to $9,999 $10,000 to $24,999
$25,000 to $49,999 $50,000 to $99,999
$100,000 to $499,999 $500,000 or more
Less than $2,500 $2,500 to $4,999
$5,000 to $9,999 $10,000 to $24,999
$25,000 to $49,999 $50,000 to $99,999
$100,000 to 500,000 $500,000 or more

THANK YOU