Economics AS Level Notes - StudyWise Revision … AS Level Notes Economics Definition – The study...
29
Economics AS Level Notes Economics Definition – The study of how to allocate scarce resources in the most effective way Economic Problem Definition – How to allocate scarce resources among alternative uses Household Definition – A group of people whose spending decisions are connected Microeconomics Definition – The study of how households and firms make decisions in markets Macroeconomics Definition – The study of issues that affect economies as a whole The Basic Economic Problem The fact that resources are scarce compared to the unlimited wants → Choices having to be made Goods Definition – Tangible products, i.e. products that can be seen and touched, such as cars, food and washing machines Services Definition – Intangible Products, i.e. products that cannot be seen or touched, such as banking, beauty therapy and insurance Factors of Production Factors of Production Definition – The resource inputs that are available in an economy for the production of goods and services The Four Factors: Land – This is a natural resource. Things such as oil, coal, rivers and the land itself. Labour – This is the human resource that is available in any economy / The quantity and quality of human resources Some economies (generally poor countries) have large populations but lack a skilled workforce and for other countries like Germany with declining populations, they depend on immigrant workers to do both skilled and unskilled jobs. Quality of labour is essential for economic progress. Capital - Man-made aids for production / Goods used to make other goods It is combined with Land and Labour MERC - Machines, Equipment, Robots and Computers Entrepreneurship - The willingness of an entrepreneur to take risks and organise production. Entrepreneur Definition - Someone who bears the risks of businesses and who organises production.
Transcript of Economics AS Level Notes - StudyWise Revision … AS Level Notes Economics Definition – The study...
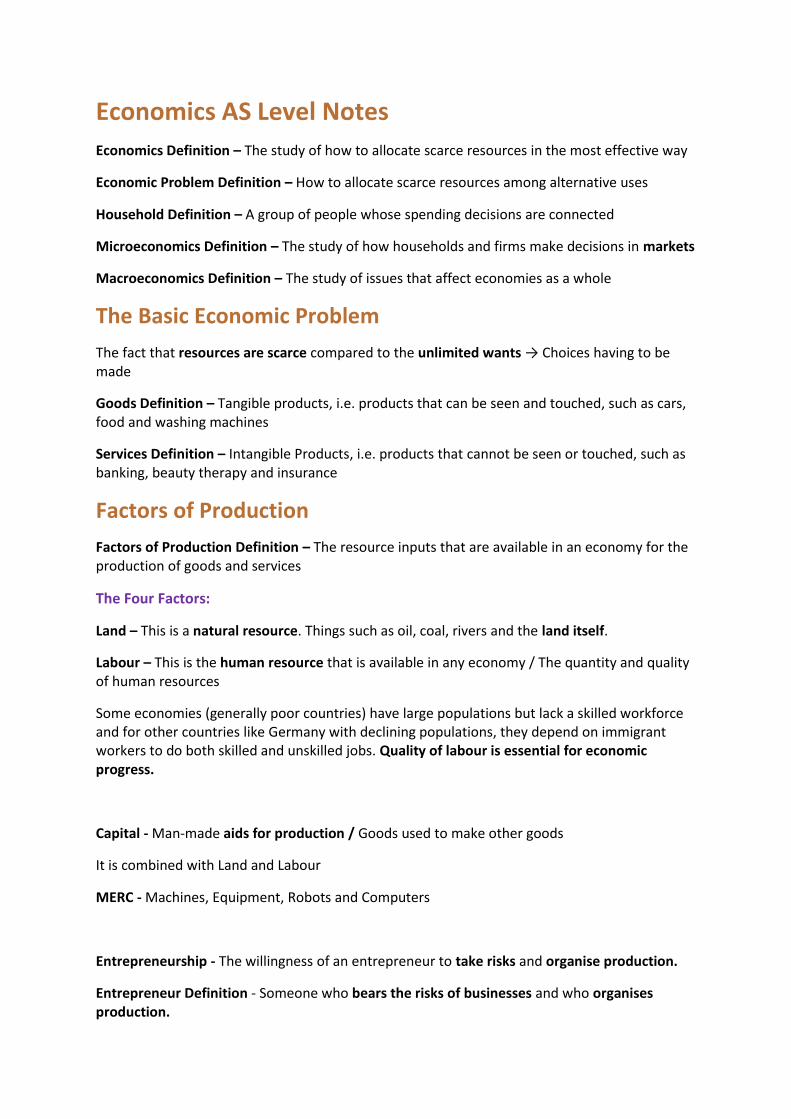
Economics AS Level Notes
Economics Definition – The study of how to allocate scarce resources in the most effective way
Economic Problem Definition – How to allocate scarce resources among alternative uses
Household Definition – A group of people whose spending decisions are connected
Microeconomics Definition – The study of how households and firms make decisions in markets
Macroeconomics Definition – The study of issues that affect economies as a whole
The Basic Economic Problem
The fact that resources are scarce compared to the unlimited wants → Choices having to be made
Goods Definition – Tangible products, i.e. products that can be seen and touched, such as cars, food and washing machines
Services Definition – Intangible Products, i.e. products that cannot be seen or touched, such as banking, beauty therapy and insurance
Factors of Production
Factors of Production Definition – The resource inputs that are available in an economy for the production of goods and services
The Four Factors:
Land – This is a natural resource. Things such as oil, coal, rivers and the land itself.
Labour – This is the human resource that is available in any economy / The quantity and quality of human resources
Some economies (generally poor countries) have large populations but lack a skilled workforce and for other countries like Germany with declining populations, they depend on immigrant workers to do both skilled and unskilled jobs. Quality of labour is essential for economic progress.
Capital - Man-made aids for production / Goods used to make other goods
It is combined with Land and Labour
MERC - Machines, Equipment, Robots and Computers
Entrepreneurship - The willingness of an entrepreneur to take risks and organise production.
Entrepreneur Definition - Someone who bears the risks of businesses and who organises production.
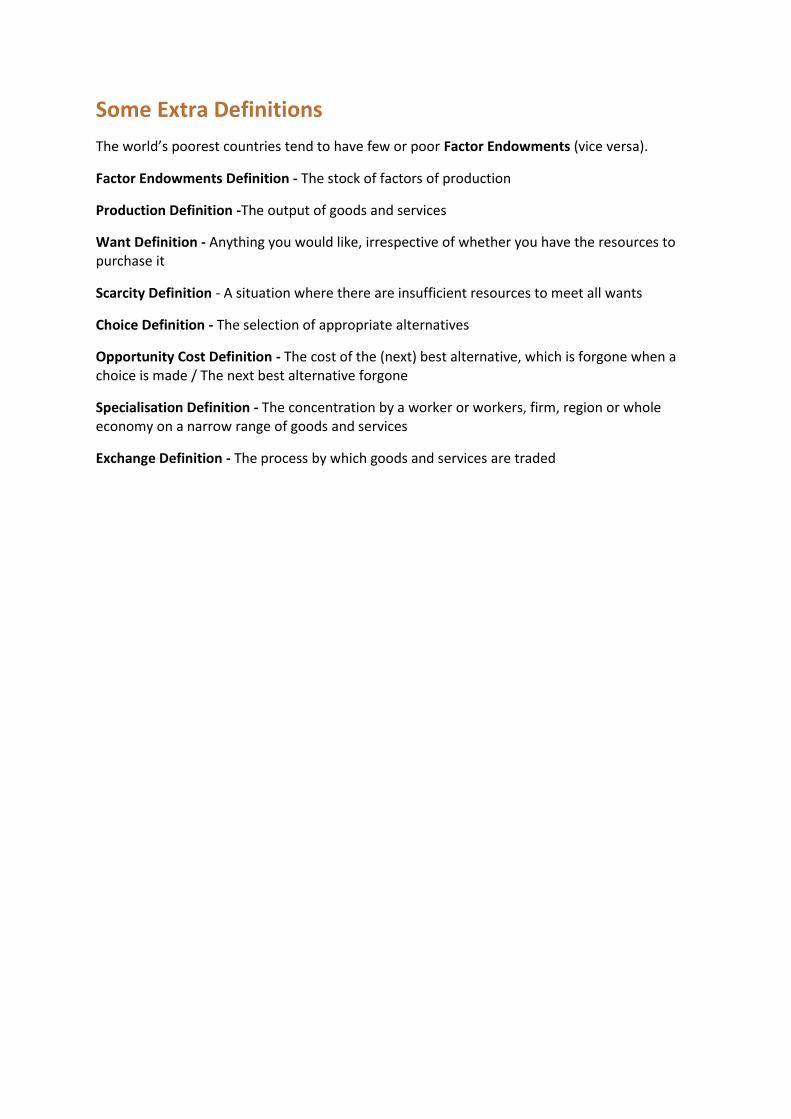
Some Extra Definitions
The world’s poorest countries tend to have few or poor Factor Endowments (vice versa).
Factor Endowments Definition - The stock of factors of production
Production Definition -The output of goods and services
Want Definition - Anything you would like, irrespective of whether you have the resources to purchase it
Scarcity Definition - A situation where there are insufficient resources to meet all wants
Choice Definition - The selection of appropriate alternatives
Opportunity Cost Definition - The cost of the (next) best alternative, which is forgone when a choice is made / The next best alternative forgone
Specialisation Definition - The concentration by a worker or workers, firm, region or whole economy on a narrow range of goods and services
Exchange Definition - The process by which goods and services are traded
International Specialisation
The Advantages of International Specialisation (ORE):
An increase in the output of goods and services - In comparison to what they could achieve on their own
A widening of the range of goods that are available in an economy
Increased exchange between developed and developing economies
The Disadvantages of International Specialisation (WIFT):
Bad weather – It can wipe out a whole years crops
De-industrialisation – Due to cheap imported goods displacing workers
Finite Resources – If they run out trouble will ensue, unless the income gained from it has been wisely invested in the future
Tastes or needs of consumers may change – Hardship among those producing goods that are no longer wanted / needed is inevitable
Productivity Definition – Output, or production of a good or service, per worker per period of time
Production Possibility Curve
Production Possibility Curve (Firm) – This shows the maximum quantities of different combinations of output of two products, given current resources and the state of technology
Production Possibility Curve (Country) – This shows the maximum quantities of different combinations of output of capital and consumer goods, given current resources and the state of technology
Developed Economy – An economy with a high level income per head
Developing Economy - An economy with a relatively low level of income per head
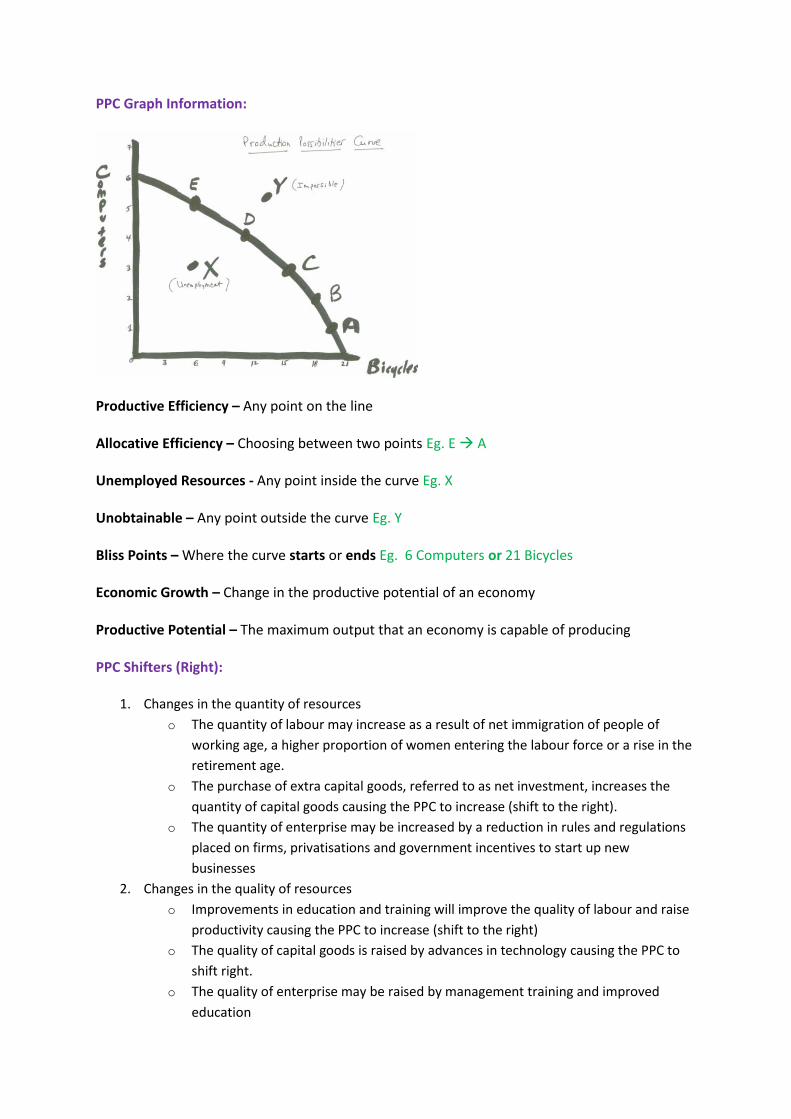
PPC Graph Information:
Productive Efficiency – Any point on the line
Allocative Efficiency – Choosing between two points Eg. E A
Unemployed Resources - Any point inside the curve Eg. X
Unobtainable – Any point outside the curve Eg. Y
Bliss Points – Where the curve starts or ends Eg. 6 Computers or 21 Bicycles
Economic Growth – Change in the productive potential of an economy
Productive Potential – The maximum output that an economy is capable of producing
PPC Shifters (Right):
1. Changes in the quantity of resources
o The quantity of labour may increase as a result of net immigration of people of
working age, a higher proportion of women entering the labour force or a rise in the
retirement age.
o The purchase of extra capital goods, referred to as net investment, increases the
quantity of capital goods causing the PPC to increase (shift to the right).
o The quantity of enterprise may be increased by a reduction in rules and regulations
placed on firms, privatisations and government incentives to start up new
businesses
2. Changes in the quality of resources
o Improvements in education and training will improve the quality of labour and raise
productivity causing the PPC to increase (shift to the right)
o The quality of capital goods is raised by advances in technology causing the PPC to
shift right.
o The quality of enterprise may be raised by management training and improved
education

NOTE – The fact that the line isn’t straight for any of the diagrams is because they are imperfect substitutes
PPC Shifter Right (Graph):
PPC Shifters (Left):
- Natural Disaster (Less resources Less of each product can be produced)
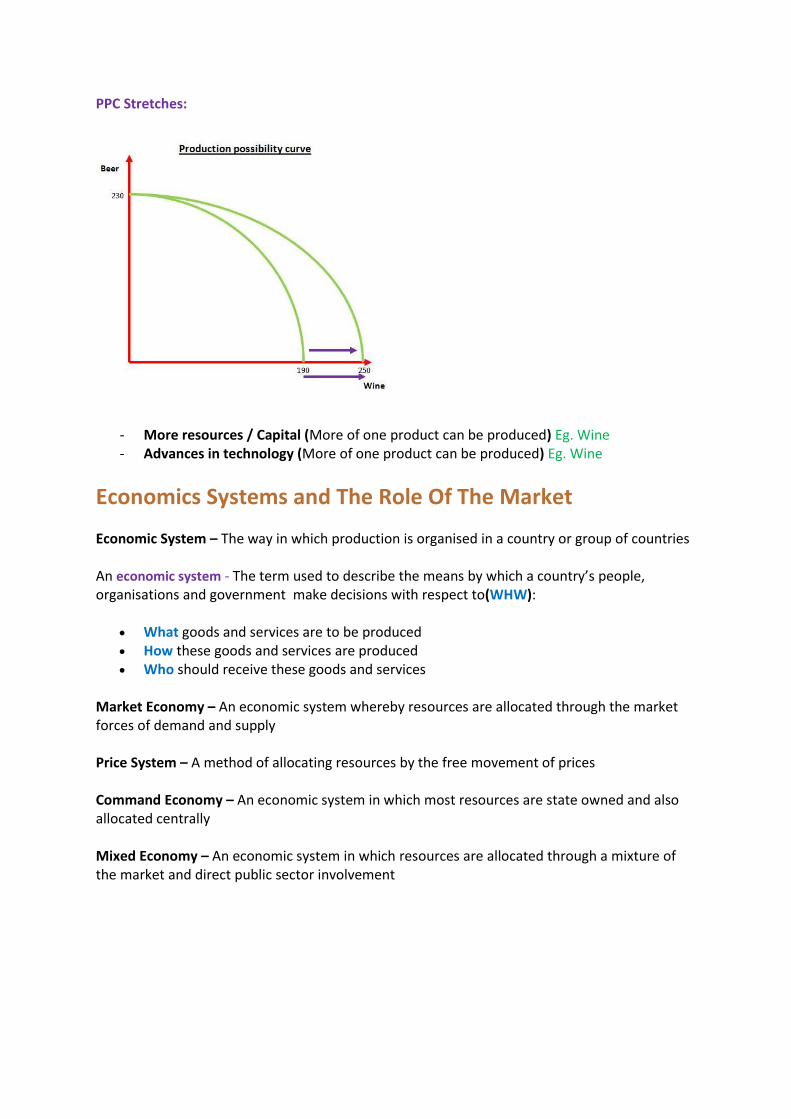
PPC Stretches:
- More resources / Capital (More of one product can be produced) Eg. Wine - Advances in technology (More of one product can be produced) Eg. Wine
Economics Systems and The Role Of The Market
Economic System – The way in which production is organised in a country or group of countries
An economic system - The term used to describe the means by which a country’s people, organisations and government make decisions with respect to(WHW):
What goods and services are to be produced How these goods and services are produced Who should receive these goods and services
Market Economy – An economic system whereby resources are allocated through the market forces of demand and supply
Price System – A method of allocating resources by the free movement of prices
Command Economy – An economic system in which most resources are state owned and also allocated centrally
Mixed Economy – An economic system in which resources are allocated through a mixture of the market and direct public sector involvement

The advantages of a free market economy / The disadvantages of command economies(CIGE):
Choice – Firms will produce whatever consumers are prepared to buy and there is no restriction on what they produce in the FM. Planners are more concerned that there are enough essentials goods to go around rather than allocating resources efficiently between all goods
Innovation – Firms will look to produce something new in order to be competitive. Because of property rights(intellectual property rights through patents) there are incentives for innovation and producing better quality products. Planners do not have this incentive, they are happy just producing essentials.
Higher Economic Growth Rates – Countries with economic systems closer to the free market tend to have higher economic growth.
Efficiency – Free markets are very competitive. Most of their industries are assumed to be perfectly competitive and so allocative and productive efficiency occur. This is because decisions about what to produce are made by the consumers rather than by planners
The advantages of command economy / The disadvantages of free market economies(PmdIE):
Public, Merit and Demerit Goods - Public goods cannot be provided in the private sector. Merit goods are likely to be under consumed in the free market and demerit goods over consumed. In a command economy demerit goods are likely to be banned or heavily taxed and public goods and merit goods will be provided at high levels.
Unequal Distribution of Income – Benefits will be low and health service and school unaffordable for a lot. Those who are poor are likely to fall to destitution. A command economy may not allow the successful to make millions but it will at least try to make sure the poor are not left to destitution so the economy is fairer
Environment – Free market economies are likely to produce more pollution. Command economies will attempt to make sure that the level of output is the socially optimal level of output through things such as taxes and pollution permits although pollution does tend to still be high
Specialisation / Division of Labour
Division of Labour Definition – The specialisation of labour where the production process is broken down into separate tasks
NOTE – Some extra explanation of each of the mark scheme points will most likely be necessary
The Advantages of Specialisation / Division of Labour to Firm (From Mark Scheme):
Increased output o With improvement in efficiency and use of machinery output is increased
More innovation Improved quality Increased productivity
o Specialised machinery can be used which further increases the productivity. Developing and maintaining a brand image Economies of scale
The Disadvantages of Specialisation / Division of Labour to Firm (From Mark Scheme):
Reliance on a narrow range of products Specialist factor inputs are more expensive per unit Limited market size Reliance on one specialist resources / suppliers or factor immobility Reduced flexibility Boredom of workers / demotivation
Extra
The Advantages of Specialisation / Division of Labour – TO THE FIRM:
Specialist workers become quicker at producing goods o Production becomes cheaper per good because of this o Production levels are increased
Each worker can concentrate on what they are good at and build up their expertise
The Advantages of Specialisation / Division of Labour – TO THE WORKER:
Increased productivity Higher pay for specialised work
o Improved skills at that job
The Disadvantages of Specialisation / Division of Labour – TO THE FIRM:
Greater cost of training workers Quality of products may suffer if workers become bored by the lack of variety in their
jobs
The Disadvantages of Specialisation / Division of Labour – TO THE WORKER:
Boredom as they do the same job Their quality and skills may suffer May eventually be replaced by machinery
Competitive Markets and How They Work
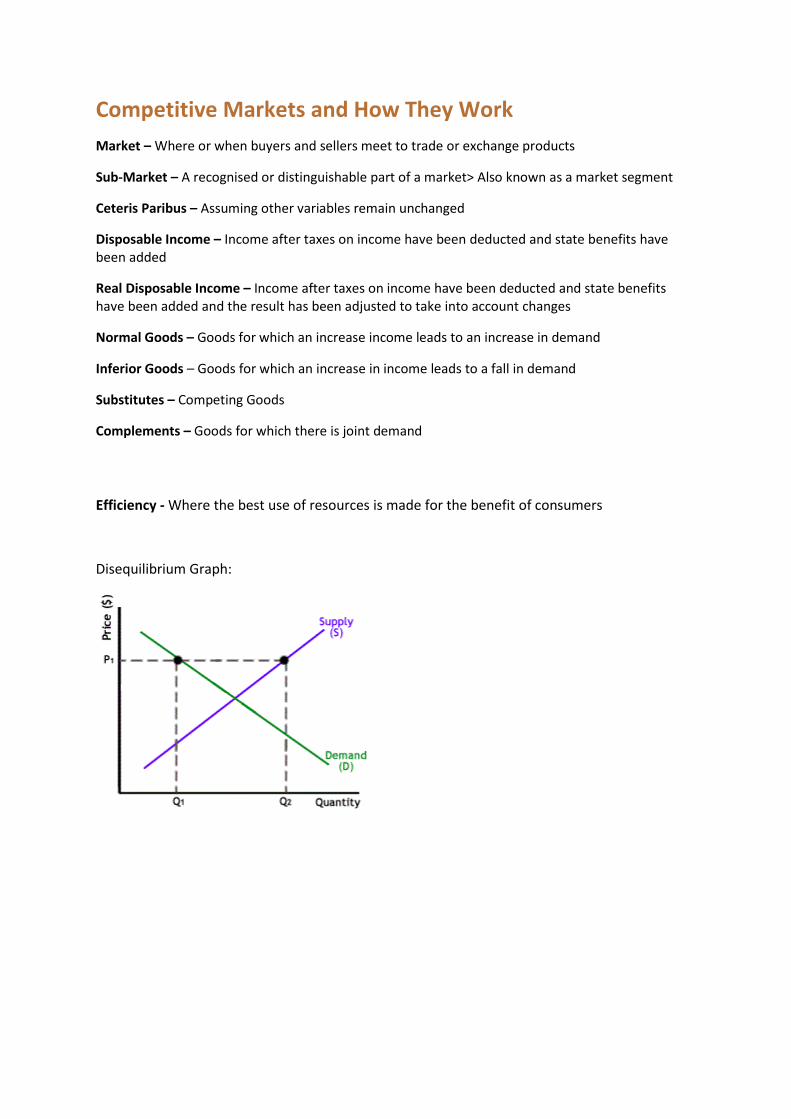
Market – Where or when buyers and sellers meet to trade or exchange products
Sub-Market – A recognised or distinguishable part of a market> Also known as a market segment
Ceteris Paribus – Assuming other variables remain unchanged
Disposable Income – Income after taxes on income have been deducted and state benefits have been added
Real Disposable Income – Income after taxes on income have been deducted and state benefits have been added and the result has been adjusted to take into account changes
Normal Goods – Goods for which an increase income leads to an increase in demand
Inferior Goods – Goods for which an increase in income leads to a fall in demand
Substitutes – Competing Goods
Complements – Goods for which there is joint demand
Efficiency - Where the best use of resources is made for the benefit of consumers
Disequilibrium Graph:
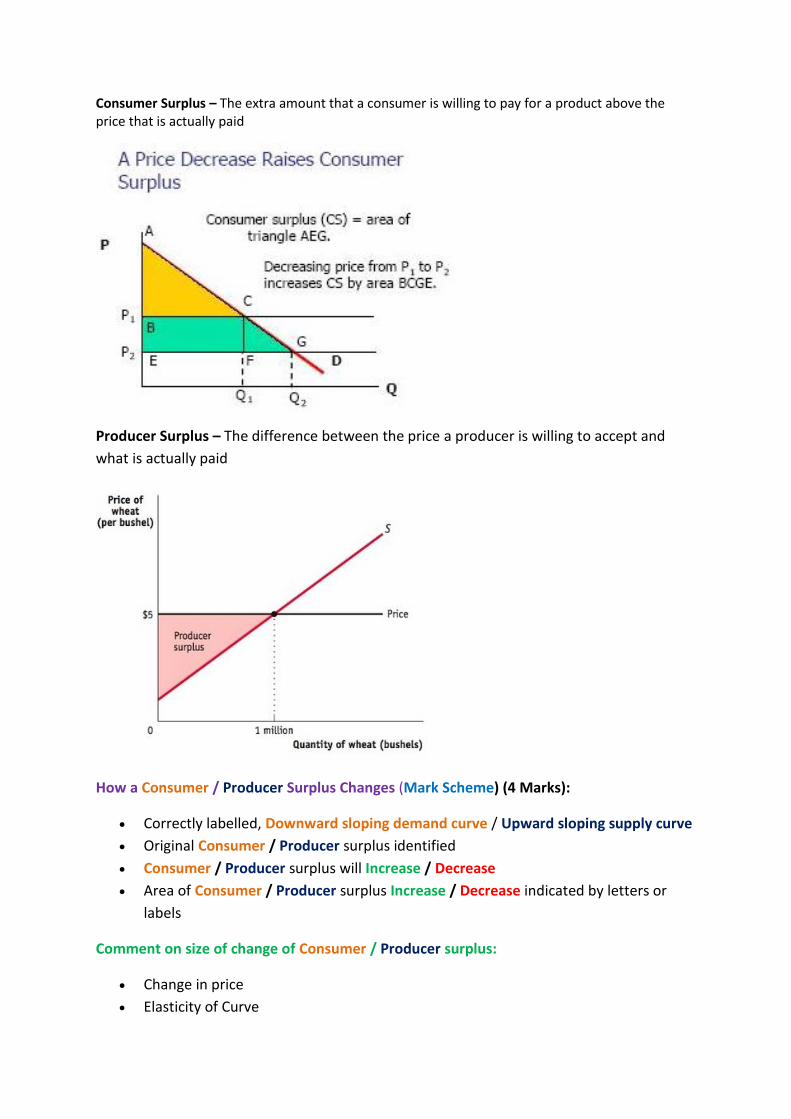
Consumer Surplus – The extra amount that a consumer is willing to pay for a product above the price that is actually paid
Producer Surplus – The difference between the price a producer is willing to accept and
what is actually paid
How a Consumer / Producer Surplus Changes (Mark Scheme) (4 Marks):
Correctly labelled, Downward sloping demand curve / Upward sloping supply curve
Original Consumer / Producer surplus identified
Consumer / Producer surplus will Increase / Decrease
Area of Consumer / Producer surplus Increase / Decrease indicated by letters or
labels
Comment on size of change of Consumer / Producer surplus:
Change in price
Elasticity of Curve
Demand
Demand – The quantity of a product that consumers are able and willing to purchase at various prices over a period of time
Notional Demand – The desire for a product
Effective Demand – The willingness and ability to buy a product
Demand Curve - This shows the relationship between the quantity demanded and the price of a product
Demand Schedule – The data that is used to draw the demand curve for a product
Movement Along The Demand Curve – This is in response to a change in the price of a product
Change In Demand – This is where a change in a non-price leads to an increase or decrease in demand for a product
ILAPTIMERS(Demand shifters / Determinants):
I – Income – Increase in Income Increase in D
L – Legislation – Eg. Motorcycle Helmet Law Introduced Increase in D for Motorcycle Helmets
A – Advertising – Increase in Advertising stimulates demand Increase in D
P – Population – Increase in Population Increase in D
T – Tastes – Consumer Taste changes to 3D TVs Increase In D for TVs
I – Interest Rates – Decrease Interest Rates Increase in D
M – Market Size – Increase in Market Size Increase in D (Not 100% sure about this one)
E – Expectations of Future Prices – Price expected to increase D increases now
R – Related Goods – Increase in price of Substitutes Increase in D for original product
S – Seasons – Christmas is coming Increase in D for Santa Costumes
Income Substitution Effect For A Price Increase – Why The Demand Curve Is Downwards Sloping:
- If the price of a good increases, then there will be two effects: 1. Substitution Effect
o The good is relatively more expensive than alternative goods and people can switch to other goods.
2. Income Effect o The increase in price decreases one’s purchasing power and so one’s real disposable
income decreases. This lower income is likely to reduce demand for normal goods but increase demand for inferior ones.
Supply
Supply – The quantity of a product that produces are willing and able to provide at different market prices over a period of time
Profit – The difference between the total revenue (sales revenue) of a producer and total cost
Supply Curve – This shows the relationship between the quantity supplied and the price of a product
Supply Schedule – The data used to draw the supply curve of a product
Change In Supply – Occurs when a change in a non-price influence leads to an increase or decrease in the willingness of a producer to supply a product
PRATNESTS(Supply shifters / Determinants):
P – Productivity – Increase in productivity Increased S
R – Resource Cost – Decrease in Resource Cost Increase in S
A – Alternative Output – Alternative product selling for higher price Increase S of alternative
T – Technology – Better / More Technology Increased productivity Increase in S
N – Number Of Suppliers – Increased Number Of Suppliers Increase in S
E – Expectations of Future Prices – Price expected to rise Increase in S later
S – Subsidies – Increase in amount of SubsidyDecrease in Cost of Production Increase in S
T – Taxes – Taxes Increased Increase in Cost of ProductionD increases now
S – Seasons – Winter is coming Decrease in S of crops
Price – The amount of money that is paid for a given amount of a particular good or service
Equilibrium Price – The price where demand and supply are equal
Clearing Price – Same as equilibrium price
Disequilibrium – Any position in the market where demand and supply are not equal
Surplus – An excess of supply over demand
Shortage – An excess of demand over supply
Comment on how overall impact of shift in D or S depends on (Generally worth 2 marks):
Size of Shift/s (1 mark) + elaborated with reference to effect on price or quantity (1 mark)
Elasticity of curve not shifting or elasticity of both curves (1 mark) + elaborated with
reference to effect on price or quantity (1 mark)
There are other factors that affect demand and/ or supply (up to 2 marks)
Elasticity
Elasticity:
Is a numerical estimate Measures the response to a change in price or to a change in any other factors that
determine the demand or supply of a product
Elasticity Definition – The extent to which buyers and sellers respond to a change in market conditions
Price Elasticity (PED)
Price Elastic Definition – Where the percentage change in the quantity demanded is sensitive to a change in price of the product {Greater than 1 or Less than -1} / Further away from 0
Price Inelastic Definition – Where the percentage change in the quantity demanded is insensitive to a change in price of the product {Less than 1 or Greater than -1} / Closer to 0
Price Unit Elastic Definition - Where the percentage change in the quantity demanded is equal to a change in price of the product {Equal to 1}
Price Elasticity Of Demand (PED) Definition – The responsiveness of the quantity demanded to a change in the price of the product
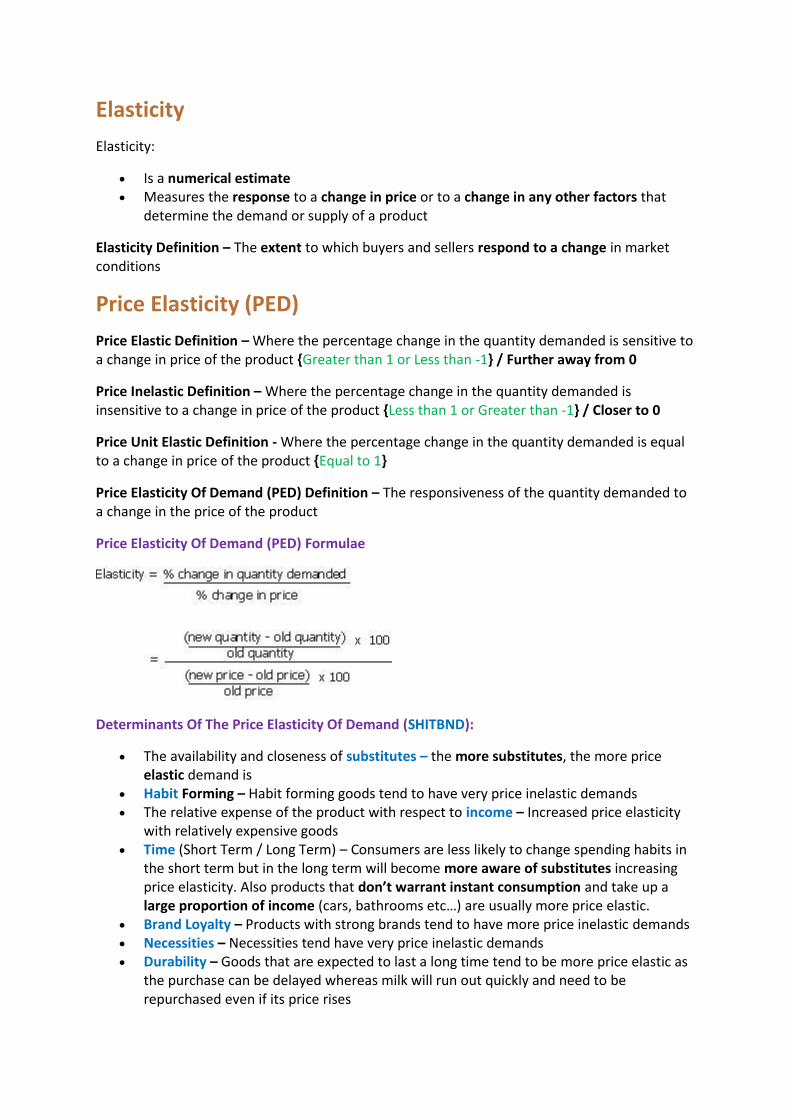
Price Elasticity Of Demand (PED) Formulae
Determinants Of The Price Elasticity Of Demand (SHITBND):
The availability and closeness of substitutes – the more substitutes, the more price elastic demand is
Habit Forming – Habit forming goods tend to have very price inelastic demands The relative expense of the product with respect to income – Increased price elasticity
with relatively expensive goods Time (Short Term / Long Term) – Consumers are less likely to change spending habits in
the short term but in the long term will become more aware of substitutes increasing price elasticity. Also products that don’t warrant instant consumption and take up a large proportion of income (cars, bathrooms etc…) are usually more price elastic.
Brand Loyalty – Products with strong brands tend to have more price inelastic demands Necessities – Necessities tend have very price inelastic demands Durability – Goods that are expected to last a long time tend to be more price elastic as
the purchase can be delayed whereas milk will run out quickly and need to be repurchased even if its price rises

Income Elasticity Of Demand (YED)
Income Elasticity Of Demand Definition - The responsiveness of demand to a change in income
Income Elastic Definition – Goods for which a change in income produces a greater proportionate change in demand
Income Inelastic Definition – Goods for which a change in income produces a less than proportionate change in demand
Normal Good Definition – Goods for which an increase in income leads to an increase in demand / Goods with a positive income elasticity of demand YED > 0
Normal Necessity – YED = 0.1 - 0.4
Pure Normal – YED = 0.6 - 0.9
Superior Good Definition – Goods for which an increase in income leads to a relatively large increase in demand / Goods with a relatively large positive income elasticity of demand YED > 1
Inferior Good Definition – Goods for which an increase in income leads to a fall in demand / Goods with a negative income elasticity of demand YED < 0
Giffen Good – YED < -2
Income Elasticity Of Demand (YED) Formulae
Comment on Income Elasticity of Demand:
1. YED Coefficient – What type of good is it? + Its Elasticity
2. 10% Example – YED = 1.5 Income goes up 10% Demand goes up 15%
3. Does the YED correspond with economic theory? e.g. A TV can’t be an inferior good
4. These are estimates + They may also be unreliable
5. These estimates can change over time
6. Assumes ceteris paribus which may not apply (Usually accepted)

Cross Elasticity Of Demand (XED)
Cross Elasticity Of Demand (XED) Definition – The responsiveness of demand for one product in relation to a change in the price of another product
A positive XED indicates two substitutes PS+ --- Positive Substitute
A negative XED indicates two complements CNN --- Complement Negative Number
A zero XED indicates that the two products have no real relation in terms of Price affecting D
(Zero XED would be a vertical line)
Cross Elasticity Of Demand (XED) Formulae
Comment on Cross Elasticity of Demand:
1. XED Coefficient – Substitute or Complement + Its Elasticity
2. 10% Example – XED = 1.5 Product X goes up 10% Product Y goes up 15%
3. Does the XED correspond with economic theory? PS and Xbox aren’t complements
4. These are estimates + They may also be unreliable
5. These estimates can change over time
6. Assumes ceteris paribus which may not apply (Usually accepted)
Price Elasticity Of Supply (PES)
Price Elasticity Of Supply (PES) Definition – The responsiveness of the quantity supplied to a change in the price of the product
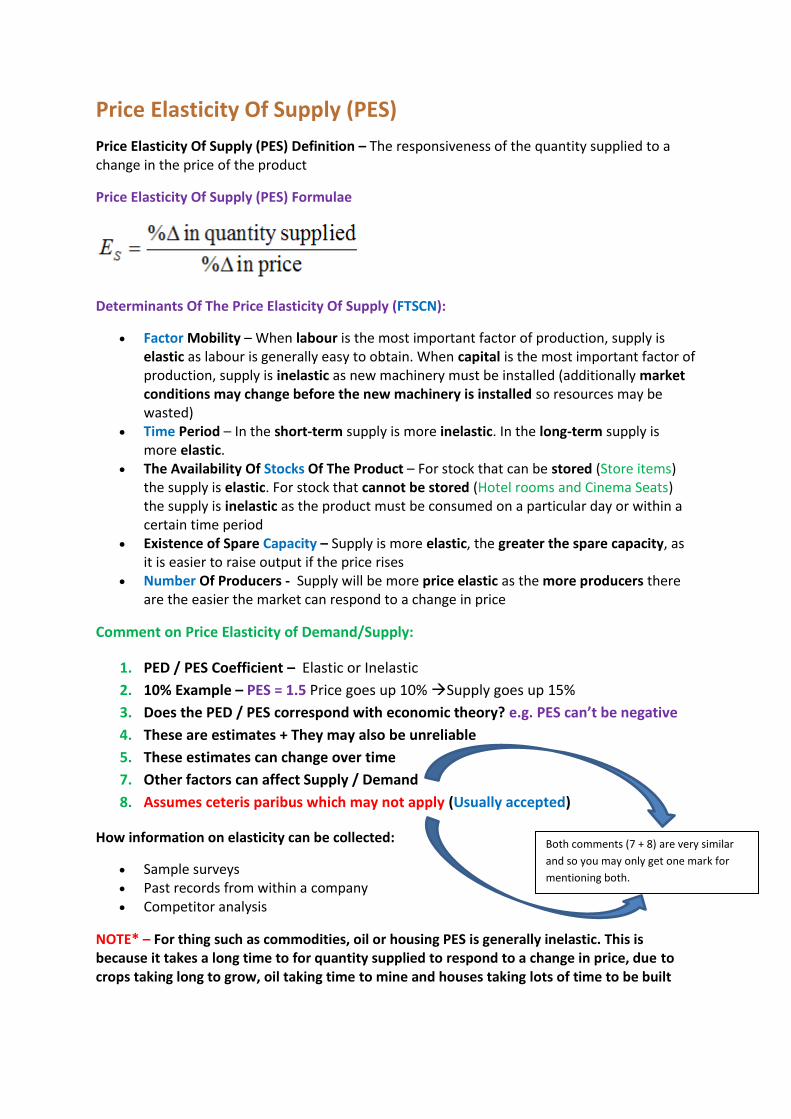
Price Elasticity Of Supply (PES) Formulae
Determinants Of The Price Elasticity Of Supply (FTSCN):
Factor Mobility – When labour is the most important factor of production, supply is elastic as labour is generally easy to obtain. When capital is the most important factor of production, supply is inelastic as new machinery must be installed (additionally market conditions may change before the new machinery is installed so resources may be wasted)
Time Period – In the short-term supply is more inelastic. In the long-term supply is more elastic.
The Availability Of Stocks Of The Product – For stock that can be stored (Store items) the supply is elastic. For stock that cannot be stored (Hotel rooms and Cinema Seats) the supply is inelastic as the product must be consumed on a particular day or within a certain time period
Existence of Spare Capacity – Supply is more elastic, the greater the spare capacity, as it is easier to raise output if the price rises
Number Of Producers - Supply will be more price elastic as the more producers there are the easier the market can respond to a change in price
Comment on Price Elasticity of Demand/Supply:
1. PED / PES Coefficient – Elastic or Inelastic
2. 10% Example – PES = 1.5 Price goes up 10% Supply goes up 15%
3. Does the PED / PES correspond with economic theory? e.g. PES can’t be negative
4. These are estimates + They may also be unreliable
5. These estimates can change over time
7. Other factors can affect Supply / Demand
8. Assumes ceteris paribus which may not apply (Usually accepted)
How information on elasticity can be collected:
Sample surveys Past records from within a company Competitor analysis
NOTE* – For thing such as commodities, oil or housing PES is generally inelastic. This is because it takes a long time to for quantity supplied to respond to a change in price, due to crops taking long to grow, oil taking time to mine and houses taking lots of time to be built
Both comments (7 + 8) are very similar
and so you may only get one mark for
mentioning both.

Market Failure and Government Intervention
Market Failure – When the free market fails to achieve allocative efficiency
Allocative Efficiency – When resources are used to produce the goods and services that consumers want and in such a way that consumer welfare is maximised
Productive Efficiency – Where production takes place using the least amount of scarce resources
Economic Efficiency – Where both allocative and productive efficiency are achieved
Inefficiency – Any situation where economic efficiency is not achieved
Free Market Mechanism – The system by which the market forces of demand and supply determine prices and the decisions made by consumers and firms
Regulations – Consists of laws/ restrictions imposed by the government
Government Failure – Government failure is a situation where government intervention in the economy to correct a market failure creates inefficiency and leads to a misallocation of scarce resources
Information Failure
Information Failure – A lack of information resulting in consumers and producers making decisions that do not maximise welfare
Asymmetric Information – Information not equally shared between two parties
Examples of Information Failure:
When consumers are not aware of the benefits or the harmful effects of consuming a particular product
When advertising over stimulates demand Overconsumption Inaccurate or misleading claims on product packaging
Examples of Asymmetric Failure Information Failure:
Health Care – You are forced to rely on the doctor’s experience and competence. They have more knowledge than you
Environment – We know less about our negative effects on the environment than environmental experts.
Consumer Purchases – Eg. Mobile phones – The seller is likely on commission and has more knowledge than the buyer leading them to make a bad choice potentially.
Insurance – You know more about your circumstances than the company selling you a policy. They are relying on your honesty and integrity.
NOTE - Information failure distorts how the market allocates resources. It causes the market to fail.
Externalities, Social Costs and Benefits
Externality – A cost imposed or benefit felt by a third party (a party not involved in the economic decision)
Private Costs – The costs incurred by those taking a particular action
Private Benefits – The benefits accruing to those taking a particular action
External Costs – The costs that are the consequence of externalities to third parties
External Benefits – The benefits that accrue as a consequence of externalities to third parties
Social Costs – Private Costs + External Costs
Social Benefits – Private Benefits + External Benefits
Negative Externality – This exists where the social cost of an activity is greater than the private cost
Positive Externality – This exists where the social benefit of an activity is greater than the private benefit
Positive Externalities:
Inoculation / Medicine – External Benefit = Less likely for other people to catch the disease Cross rail – External Benefit – Reduced road traffic congestion Education and Training – External Benefits – Better qualified employees for firms and
enhanced longer-term for the economy as a whole
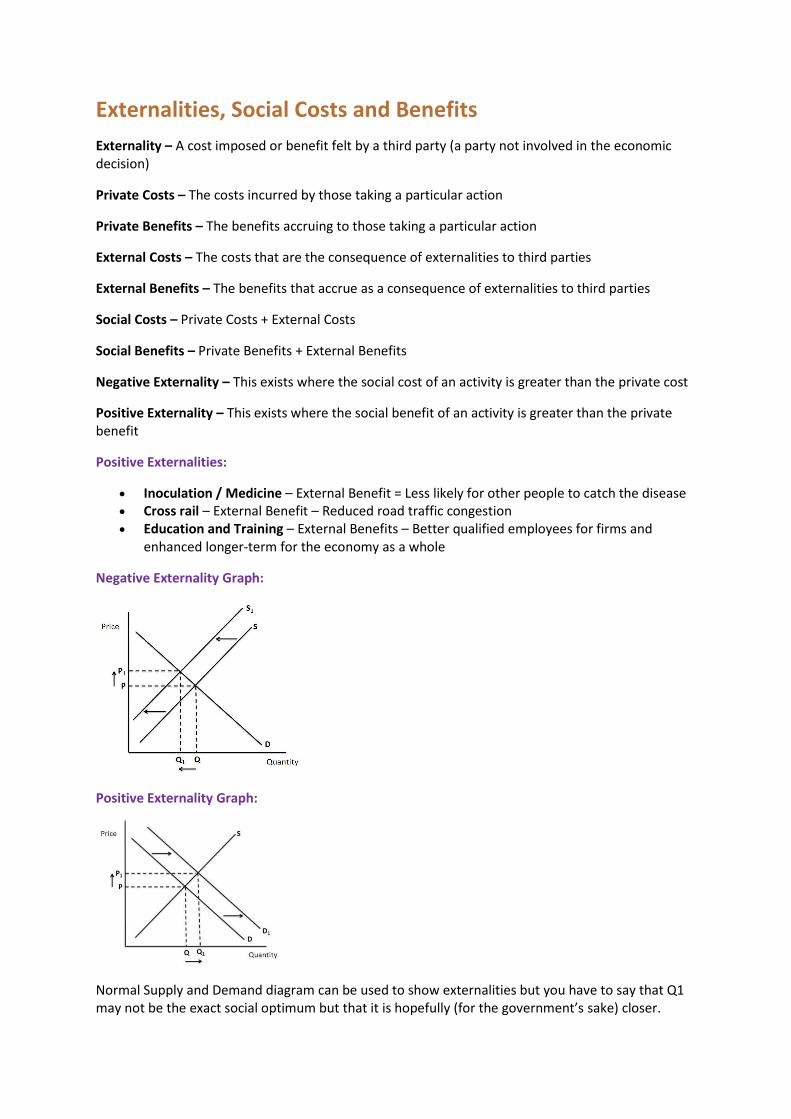
Negative Externality Graph:
Positive Externality Graph:
Normal Supply and Demand diagram can be used to show externalities but you have to say that Q1 may not be the exact social optimum but that it is hopefully (for the government’s sake) closer.
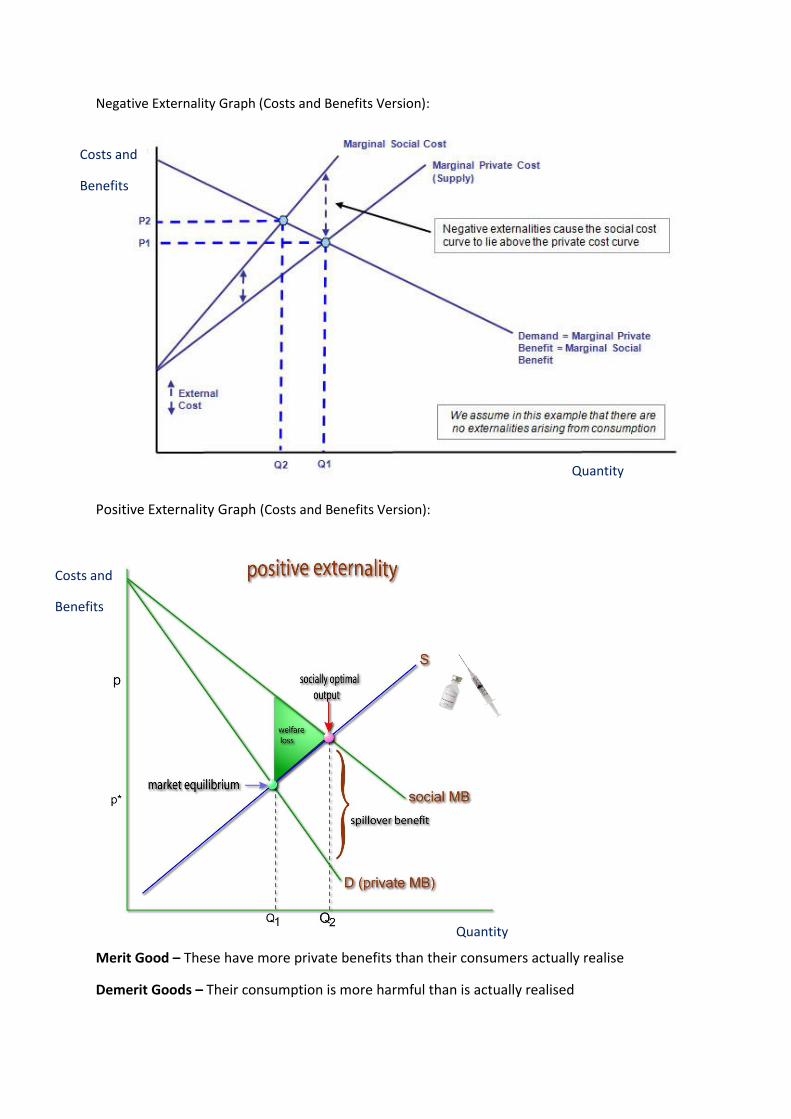
Negative Externality Graph (Costs and Benefits Version):
Positive Externality Graph (Costs and Benefits Version):
Merit Good – These have more private benefits than their consumers actually realise
Demerit Goods – Their consumption is more harmful than is actually realised
Costs and
Benefits
Quantity
Costs and
Benefits
Quantity
Public Goods
Public Goods – Goods that are collectively consumed and have the characteristics of non-excludability and non-rivalry
Non-Excludability – Situation existing where individual consumers cannot be excluded from consumption
Non-Rejectable – Situation existing where individual consumers cannot reject consumption
Non-Rivalry – Situation existing where consumption by one person does not affect the consumption of all others
Free Riders – Someone who directly benefits from the consumption of a public good but who does not contribute towards its provision
Quasi-Public Goods – Goods having some but not all of the characteristics of a public good
Direct Tax – One that taxes the income of people and firms and that cannot be avoided
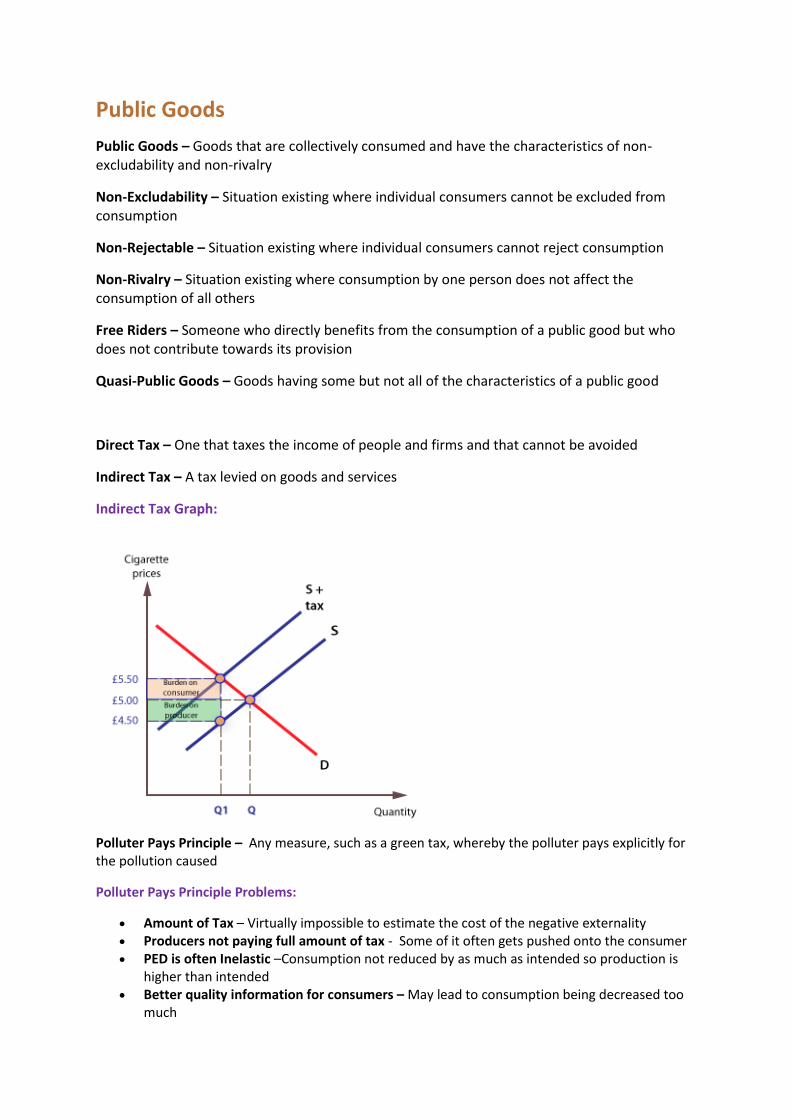
Indirect Tax – A tax levied on goods and services
Indirect Tax Graph:
Polluter Pays Principle – Any measure, such as a green tax, whereby the polluter pays explicitly for the pollution caused
Polluter Pays Principle Problems:
Amount of Tax – Virtually impossible to estimate the cost of the negative externality Producers not paying full amount of tax - Some of it often gets pushed onto the consumer PED is often Inelastic –Consumption not reduced by as much as intended so production is
higher than intended Better quality information for consumers – May lead to consumption being decreased too
much
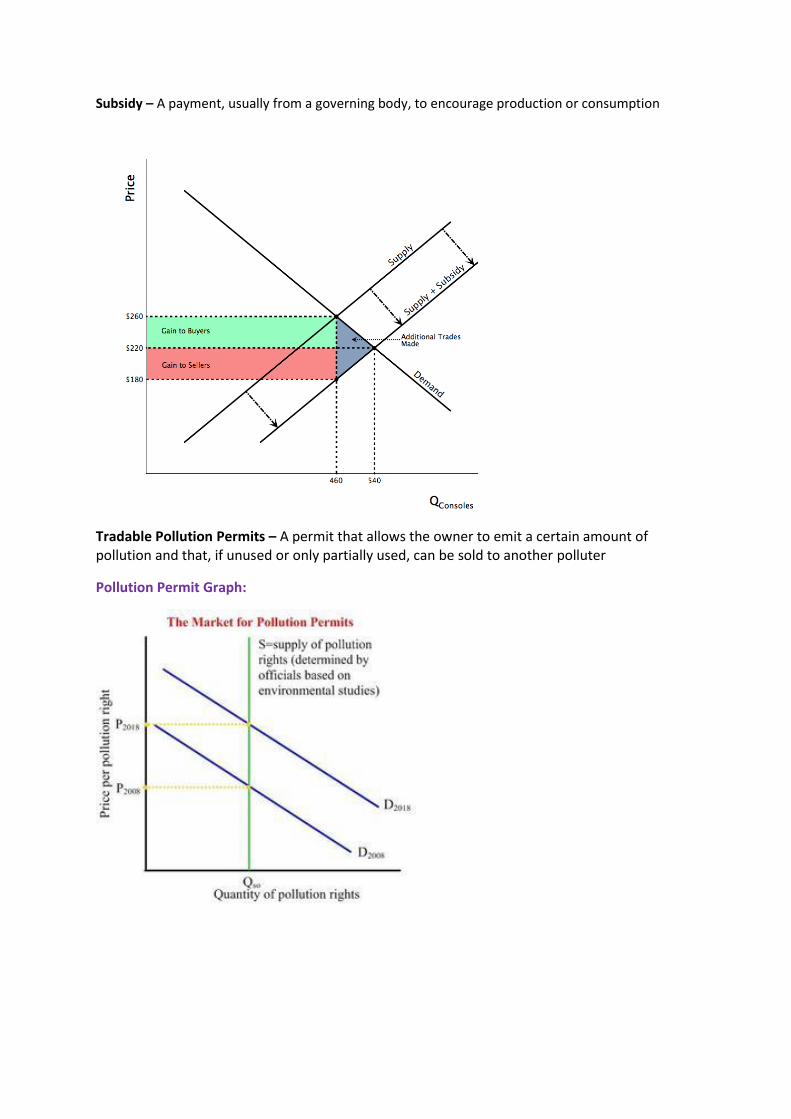
Subsidy – A payment, usually from a governing body, to encourage production or consumption
Tradable Pollution Permits – A permit that allows the owner to emit a certain amount of pollution and that, if unused or only partially used, can be sold to another polluter
Pollution Permit Graph:

Discuss whether indirect taxation is the most effective policy measure to correct the market failure arising from the negative externalities of production (Mark Scheme + Model Answer):
Level 1 KNOWLEDGE (1–4 marks)
Example(s) of indirect tax, e.g. VAT
Indirect tax raises the cost of production
Market failure is where the free market fails to achieve allocative efficiency
Non-applied market failure diagram (Will be included as part of analysis)
Definition of negative externalities / indirect taxation
Level 2 APPLICATION (5–8 marks)
Candidate must show application either to negative externalities of production, e.g. pollution, global warming, or to an indirect tax and its effect on the market
Indirect Tax will decrease supply
Indirect taxation will shift supply to the left
Indirect tax will raise the price of products
Level 3 Band 1 ANALYSIS (9-10 marks)
Supply curve shifts to the left because indirect taxes effectively increase producer costs
Price rises from P to P1
Quantity falls from Q to Q1
You don’t actually have to show
the burden on consumer or the
burden on the producer, it is
your choice but I just wouldn’t
bother unless the question is
suggesting that it should be
mentioned. + Ignore Cigarette
prices, just write Price instead.
Also you can just write S1
instead of S + tax
18 Markers
Level 3 Band 2 ANALYSIS (11-12 marks)
The market becomes more allocatively efficient
This solves / reduces overproduction
An explanation of how negative externalities are reduced
Connecting leftwards shift of supply with correcting “negative externalities of production” – how this works
Level 4 EVALUATION (13-15 marks)
If included, effectiveness of alternative solutions must be compared that of indirect tax:
Outright ban
Output restrictions
Pollution permits
Do not credit information provision as this relates to a leftward shift in demand
Case for an indirect tax could include:
Reduces the volume of output and so reduces negative externalities
Deters production by raising costs of production
It will lead to a shift to the left of supply meaning that less is supplied and consumed at a higher price
It has a greater effect if the PED is elastic
Case against an indirect tax could include:
It would make Chinese firms less internationally competitive
The correct value of the tax is difficult to determine Government failure
Costs of policing / collecting
Deters consumption
May be absorbed by the firm rather than causing output to reduce
Will not reduce output by much if PED is inelastic
May reduce positive externalities of production and consumption
EE ANSWER TO QUESTION + CONCLUSION (16 –18 marks)
Stated or elaborated judgement
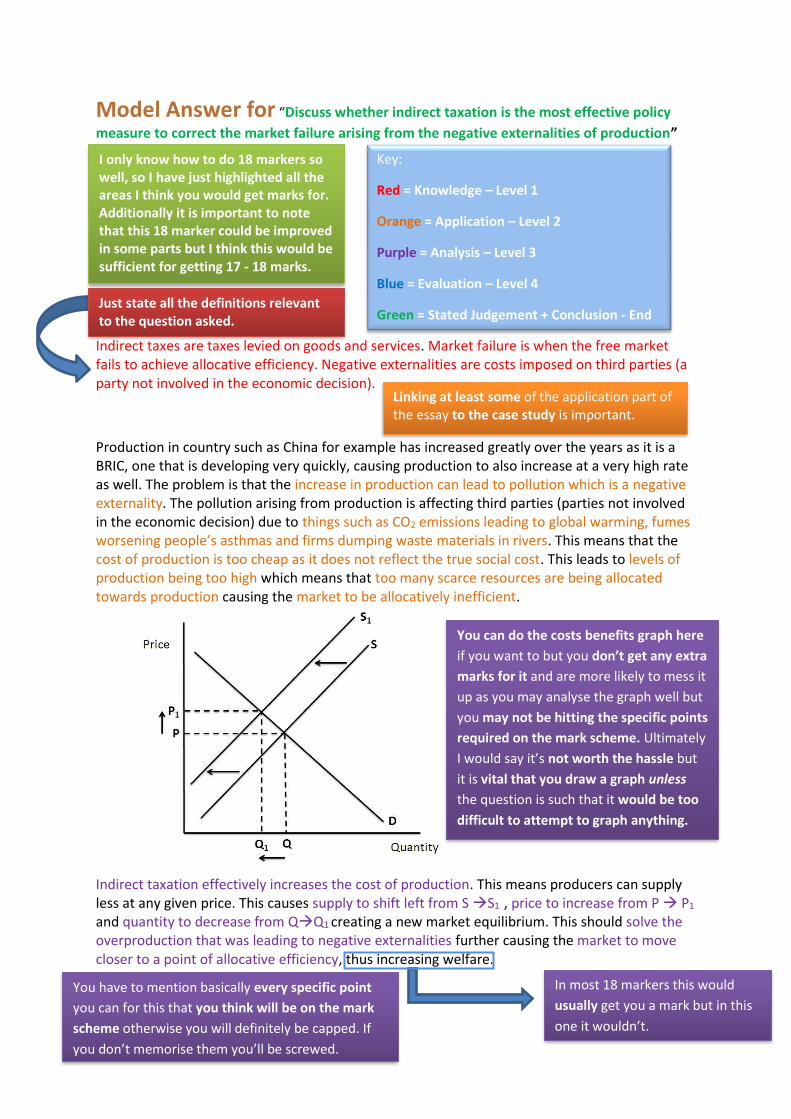
Model Answer for “Discuss whether indirect taxation is the most effective policy
measure to correct the market failure arising from the negative externalities of production”
Indirect taxes are taxes levied on goods and services. Market failure is when the free market fails to achieve allocative efficiency. Negative externalities are costs imposed on third parties (a party not involved in the economic decision).
Production in country such as China for example has increased greatly over the years as it is a BRIC, one that is developing very quickly, causing production to also increase at a very high rate as well. The problem is that the increase in production can lead to pollution which is a negative externality. The pollution arising from production is affecting third parties (parties not involved in the economic decision) due to things such as CO2 emissions leading to global warming, fumes worsening people’s asthmas and firms dumping waste materials in rivers. This means that the cost of production is too cheap as it does not reflect the true social cost. This leads to levels of production being too high which means that too many scarce resources are being allocated towards production causing the market to be allocatively inefficient.
Indirect taxation effectively increases the cost of production. This means producers can supply less at any given price. This causes supply to shift left from S S1 , price to increase from P P1
and quantity to decrease from QQ1 creating a new market equilibrium. This should solve the overproduction that was leading to negative externalities further causing the market to move closer to a point of allocative efficiency, thus increasing welfare.
Key:
Red = Knowledge – Level 1
Orange = Application – Level 2
Purple = Analysis – Level 3
Blue = Evaluation – Level 4
Green = Stated Judgement + Conclusion - End
Linking at least some of the application part of the essay to the case study is important.
In most 18 markers this would
usually get you a mark but in this
one it wouldn’t.
You have to mention basically every specific point
you can for this that you think will be on the mark
scheme otherwise you will definitely be capped. If
you don’t memorise them you’ll be screwed.
I only know how to do 18 markers so well, so I have just highlighted all the areas I think you would get marks for. Additionally it is important to note that this 18 marker could be improved in some parts but I think this would be sufficient for getting 17 - 18 marks.
You can do the costs benefits graph here
if you want to but you don’t get any extra
marks for it and are more likely to mess it
up as you may analyse the graph well but
you may not be hitting the specific points
required on the mark scheme. Ultimately
I would say it’s not worth the hassle but
it is vital that you draw a graph unless
the question is such that it would be too
difficult to attempt to graph anything.
Just state all the definitions relevant to the question asked.
There are cases for and against indirect taxation and there are also alternative policies to indirect taxation as well. One case for indirect taxation is that it deters production by raising the cost of production. This will reduce the level of output thus reducing the amount of negative externalities as there will be less of things such as CO2 emissions so in this regard indirect taxation would be an effective policy.
A case against indirect taxation would be that if PED is inelastic then it is likely we will see the producer push on more of the tax onto the consumer as the price increase would have little effect on a consumer’s decision on whether or not to buy the product. This would mean demand would not decrease as much as intended further meaning that production would be higher than intended. This leads onto another point about whether or not the government will set the right amount of indirect tax. The fact that it is virtually impossible to measure negative externalities it is likely that government failure will occur. Government failure is when government intervention to correct market failure leads to inefficiency and a misallocation of resources which would be a large negative of indirect taxation.
A pollution permit is an example of an alternative policy that could be used. A pollution permit is a permit that allows the owner to emit a certain amount of pollution and that, if unused or only partially used, can be sold to another polluter. This would allow the government to release an amount of permits they feel is acceptable although the issue of not being able to measure negative externalities would arise again potentially leading to government failure.
All in all I think that indirect taxation IS the most effective policy measure to correct market failure arising from the negative externalities of production.
I think this because although both indirect taxation and pollution permits have the same issue such as measuring negative externalities and the same advantage of increasing the likelihood of decreasing production leading to less negative externalities, pollution permits are more difficult to change. This is because if the level of pollution permits released was too high, then it will be too cheap pollute, so they would need to be taken out of circulation and it would be more difficult and more costly to remove them from circulation whereas with indirect taxation if the level of indirect taxation is too high it would be far less costly to change it and also much easier to do so as well.
The specific points on the mark scheme are the basic core of what
your answer needs to be but you have to expand on them and
make them developed otherwise you may get capped.
Assuming you haven’t been capped at any earlier stage in the
essay then by just basically re writing the original question
and inserting a word or two you should get the 16th mark.
The rest is just you justifying the statement you made
via a conclusion. Whether or not you get 17 or 18
marks is most likely dependent on how much your
conclusion makes sense / whether or not something
you said in your conclusion is incorrect or not.
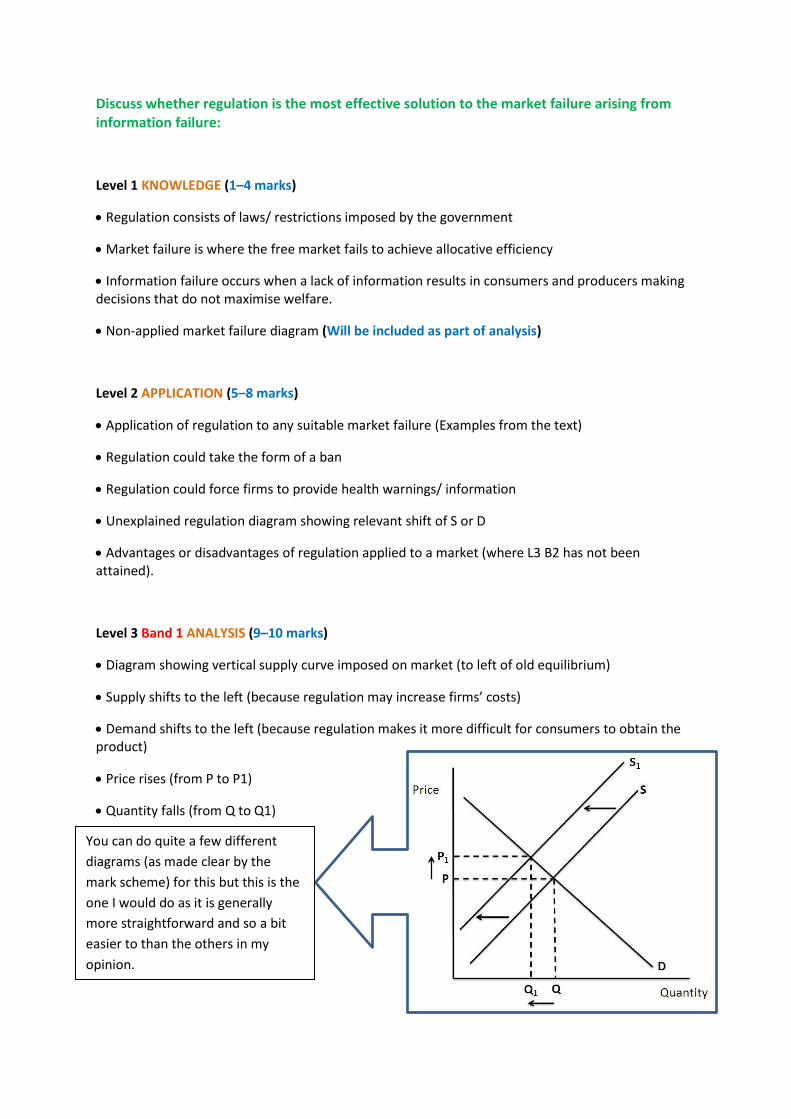
Discuss whether regulation is the most effective solution to the market failure arising from information failure:
Level 1 KNOWLEDGE (1–4 marks)
Regulation consists of laws/ restrictions imposed by the government
Market failure is where the free market fails to achieve allocative efficiency
Information failure occurs when a lack of information results in consumers and producers making decisions that do not maximise welfare.
Non-applied market failure diagram (Will be included as part of analysis)
Level 2 APPLICATION (5–8 marks)
Application of regulation to any suitable market failure (Examples from the text)
Regulation could take the form of a ban
Regulation could force firms to provide health warnings/ information
Unexplained regulation diagram showing relevant shift of S or D
Advantages or disadvantages of regulation applied to a market (where L3 B2 has not been attained).
Level 3 Band 1 ANALYSIS (9–10 marks)
Diagram showing vertical supply curve imposed on market (to left of old equilibrium)
Supply shifts to the left (because regulation may increase firms’ costs)
Demand shifts to the left (because regulation makes it more difficult for consumers to obtain the product)
Price rises (from P to P1)
Quantity falls (from Q to Q1)
You can do quite a few different
diagrams (as made clear by the
mark scheme) for this but this is the
one I would do as it is generally
more straightforward and so a bit
easier to than the others in my
opinion.
Level 3 Band 2 ANALYSIS (11–12 marks)
This solves overconsumption/ reduces consumption which corrects market failure
Moves market (closer) to allocative efficiency
Welfare is increased
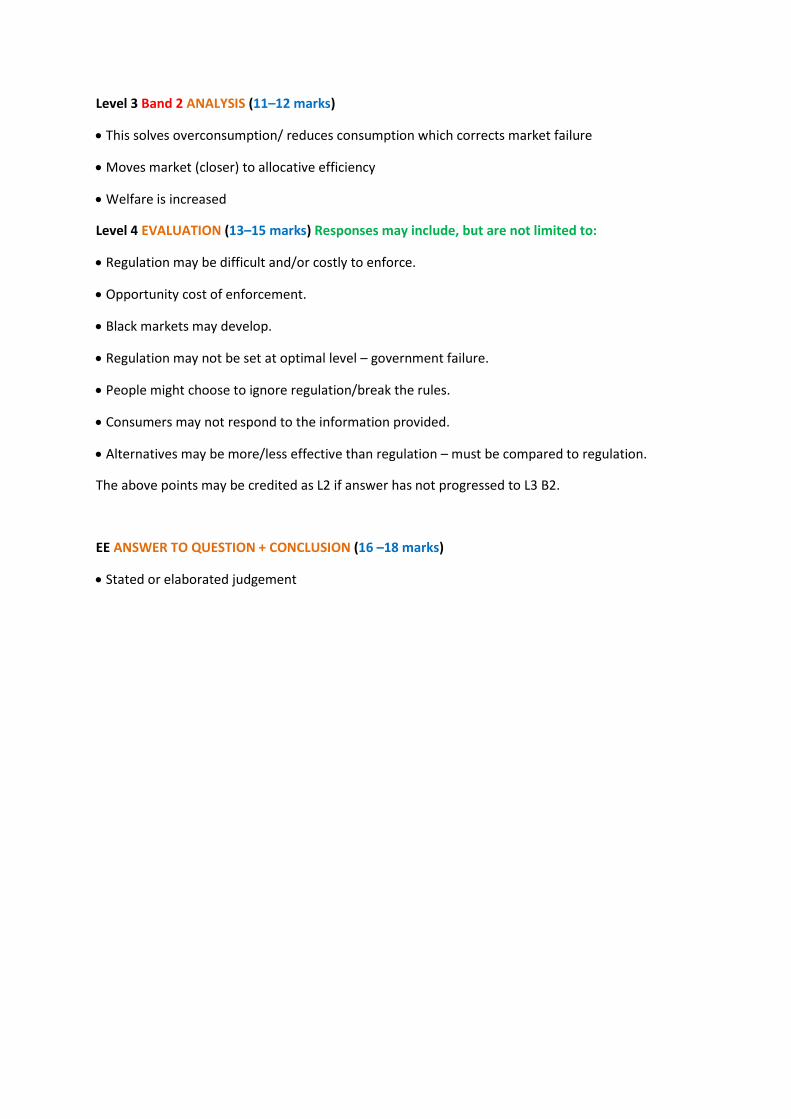
Level 4 EVALUATION (13–15 marks) Responses may include, but are not limited to:
Regulation may be difficult and/or costly to enforce.
Opportunity cost of enforcement.
Black markets may develop.
Regulation may not be set at optimal level – government failure.
People might choose to ignore regulation/break the rules.
Consumers may not respond to the information provided.
Alternatives may be more/less effective than regulation – must be compared to regulation.
The above points may be credited as L2 if answer has not progressed to L3 B2.
EE ANSWER TO QUESTION + CONCLUSION (16 –18 marks)
Stated or elaborated judgement
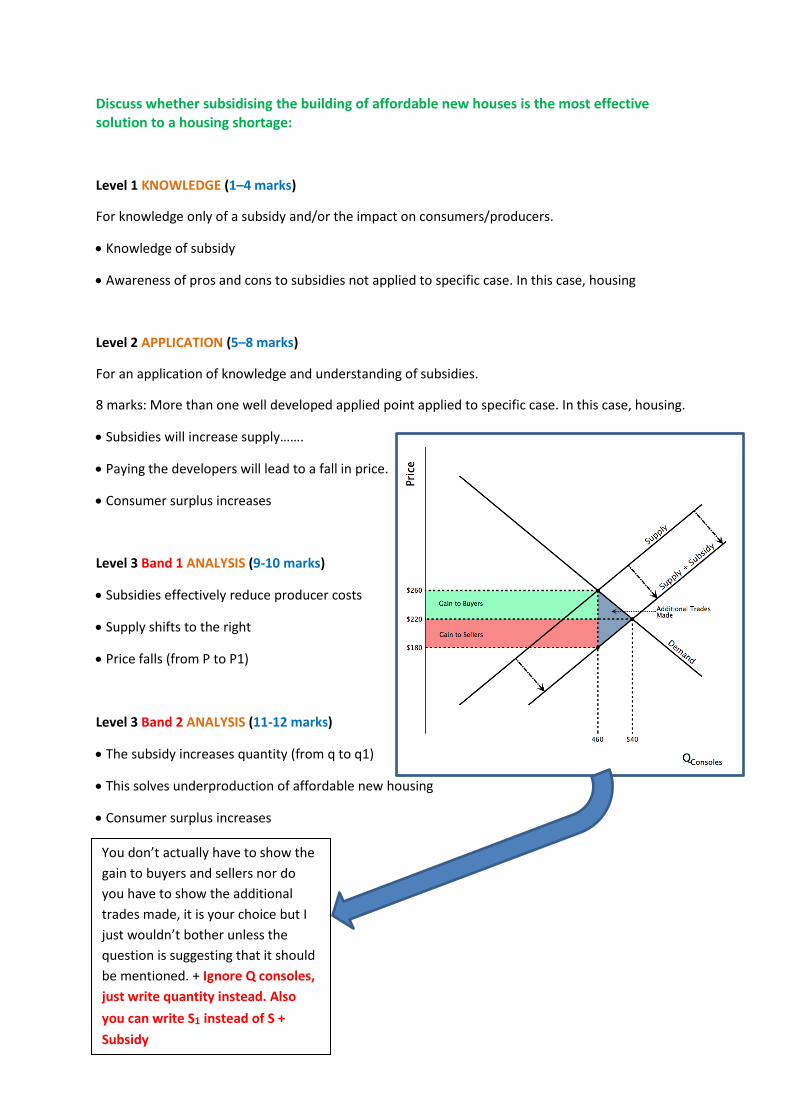
Discuss whether subsidising the building of affordable new houses is the most effective solution to a housing shortage:
Level 1 KNOWLEDGE (1–4 marks)
For knowledge only of a subsidy and/or the impact on consumers/producers.
Knowledge of subsidy
Awareness of pros and cons to subsidies not applied to specific case. In this case, housing
Level 2 APPLICATION (5–8 marks)
For an application of knowledge and understanding of subsidies.
8 marks: More than one well developed applied point applied to specific case. In this case, housing.
Subsidies will increase supply…….
Paying the developers will lead to a fall in price.
Consumer surplus increases
Level 3 Band 1 ANALYSIS (9-10 marks)
Subsidies effectively reduce producer costs
Supply shifts to the right
Price falls (from P to P1)
Level 3 Band 2 ANALYSIS (11-12 marks)
The subsidy increases quantity (from q to q1)
This solves underproduction of affordable new housing
Consumer surplus increases
You don’t actually have to show the
gain to buyers and sellers nor do
you have to show the additional
trades made, it is your choice but I
just wouldn’t bother unless the
question is suggesting that it should
be mentioned. + Ignore Q consoles,
just write quantity instead. Also
you can write S1 instead of S +
Subsidy
Level 4 EVALUATION (13-15 marks)
Case for a subsidy with respect to supply could include:
Incentive for producers to increase supply
Lowers the cost of housing - potentially lowering price
Helps people to get onto the property ladder.
Case against a subsidy for could include:
Difficult to decide on the quantity of subsidy/government failure
Opportunity cost to local authorities
Impact depends on suppliers’ reactions
Other factors influence supply
EE ANSWER TO QUESTION + CONCLUSION (16 –18 marks)
Stated or elaborated judgement