Economics and the Conservation of- Global …documents.worldbank.org/.../pdf/multi-page.pdfof...
92
GLOBAL ENVIRONMENT 12566 FACILITY NOV. 1993 Economics and the Conservation of-Global -Biological Diversity KatrinaBrown David Pearce CharlesPerrings TimothySwanson Working Paper Number 2 UNEP THE WORLD BANK Public Disclosure Authorized Public Disclosure Authorized Public Disclosure Authorized Public Disclosure Authorized Public Disclosure Authorized Public Disclosure Authorized Public Disclosure Authorized Public Disclosure Authorized
Transcript of Economics and the Conservation of- Global …documents.worldbank.org/.../pdf/multi-page.pdfof...

GLOBALENVIRONMENT 12566
FACILITY NOV. 1993
Economics and theConservation of- Global -Biological Diversity
Katrina Brown
David Pearce
Charles Perrings
Timothy Swanson
Working PaperNumber 2
UNEP
THE WORLD BANK
Pub
lic D
iscl
osur
e A
utho
rized
Pub
lic D
iscl
osur
e A
utho
rized
Pub
lic D
iscl
osur
e A
utho
rized
Pub
lic D
iscl
osur
e A
utho
rized
Pub
lic D
iscl
osur
e A
utho
rized
Pub
lic D
iscl
osur
e A
utho
rized
Pub
lic D
iscl
osur
e A
utho
rized
Pub
lic D
iscl
osur
e A
utho
rized

GEF Documentation
The Global Environment Facility (GEF) assists developing countries to protectthe global environment in four areas: global warming, pollution of international waters,destruction o- biodiversity, and depletion of the ozone layer. The GEF is jointly implemenitedbythe United Nations Development Programme, the United Nations Environment Programme,and the World Bank.
GEF Workiing Papers - identified by the burgundy band on their covers - providegeneral information on the Facility's workand more specific information on methodologicalapproaches: scientific and technical issues; and policy and strategic matters.
GEF Proje,ct Documents - identified by a green band - provide extended project-specific inforrnation. The implementing agency responsible for each project is identified byits logo on the cover of the document.
Reports by the Chairman - identified by a blue band -are prepared by the Office ofthe GEF Administrator in collaboration with the three GEF implementing agencies for thebiannual Participants' Meetings.
GLOBALENVIRONMENT
FACILITY
Economics and theConservation of Global Biological Diversity
Katrina Brown
David Pearce
Charles Perrings
Timothy Swanson
Working PaperNumber 2
UNEP
THE WORLD BANK

© 1993The Global Environment Facility1818 H Street, NWWashington, DC 20433 USA
All rights reservedlManufactured in the United States of AmericaFirst printing November 1993
The views expressed in this paper are not necessarily those ofthe Global Environment Facility or its associated agencies.
ISBN 1-884122-01-9ISSN 1020-0894
Economics and the Conservation of Global Biological Diversity
This paper explores the relationship between economics and biodiversity conservation with minimalrecourse to jargon, making the issue accessible even to the non-economist. It deals with the concepts of costand benefit as they apply to biodiversity. Since biodiversity is an area where no clear measure of benefitsexists, the process of project selection for a financial mechanism such as the Global Environment Facility(GEF) becomes especially complex.
The paperreviews concepts and measures of biodiversity, assesses what is currently known aboutextinctionr ates and species loss, and looks at efforts to place a value on biodiversity. It also investigates the questionof why biodiversity is being eroded, and argues that the main economic causes of biodiversity erosion arethe pressures exerted by population growth to convert available land, and under-investment in biodiversity.it recommends policies that reduce the returns on land conversion by eliminating subsidies and othereconomic policy distortions; and policies that aim to increase the returns on biodiversity conservation, fore xample, by conferring and enforcing property rights on those who sustainably manage resources, and byinstituting mechanisms to capture the global benefits of sustainable land use. Finally, the paper considersways in which the GEF might alleviate the problem of under-investment in biodiversity.
David Pearce is Professor of Environmental Economics and Director of the Centre for Social and EconomicResearch on the Global Environment (CSERGE), University College, London, and University of EastAnglia, United Kingdom. Katrina Brown is Senior Research Associate at CSERGE. Charles Perrings isPlrofessor of Environmental Economics and Environmental Management, University of York, and TimothySwanson is Lecturer in Economics at the University of Cambridge, United Kingdom.
iii


Contents
Introduction I
Concepts and Measures of Biological Diversity 3
2 Placing a Value on Biological Diversity 10
3 The Economic Causes of Biodiversity Erosion 25
4 Reversing the Decline 36
5 SSummary and Conclusions 47
Tables in text
1.1 Estimates of species extinction 72.1 Total economic value and tropical forests 122.2 Summary of studies on the economic value of biodiversity 162.3 Preference valuations for endangered species and prized habitats 202.4 Implicit global willingness to pay in international transfers: debt-for-nature swaps 212.5 Carbon storage in different uses of tropical forests 232.6 Changes in carbon with land-use conversion 233.1 Rate of conversion of land 283.2 Econometric studies of deforestation 293,3 Producer subsidies as a percentage of producer prices in agriculture 333A4 Two sources of subsidy to agriculture 344. 1 Cost recovery in irrigation schemes 444.2 Economic subsidies to energy use in selected countries 455.1 Economic value classification 47
Figures in text
5.1 Schematic summary of factors affecting global biological diversity 50
Appendix I: A Survey of the Results of Econometric Studies on Deforestation 52
Appendix II: Resource Franchise Agreements 58
Appendix III: Incremental Costs 59
Bibliography 61
v
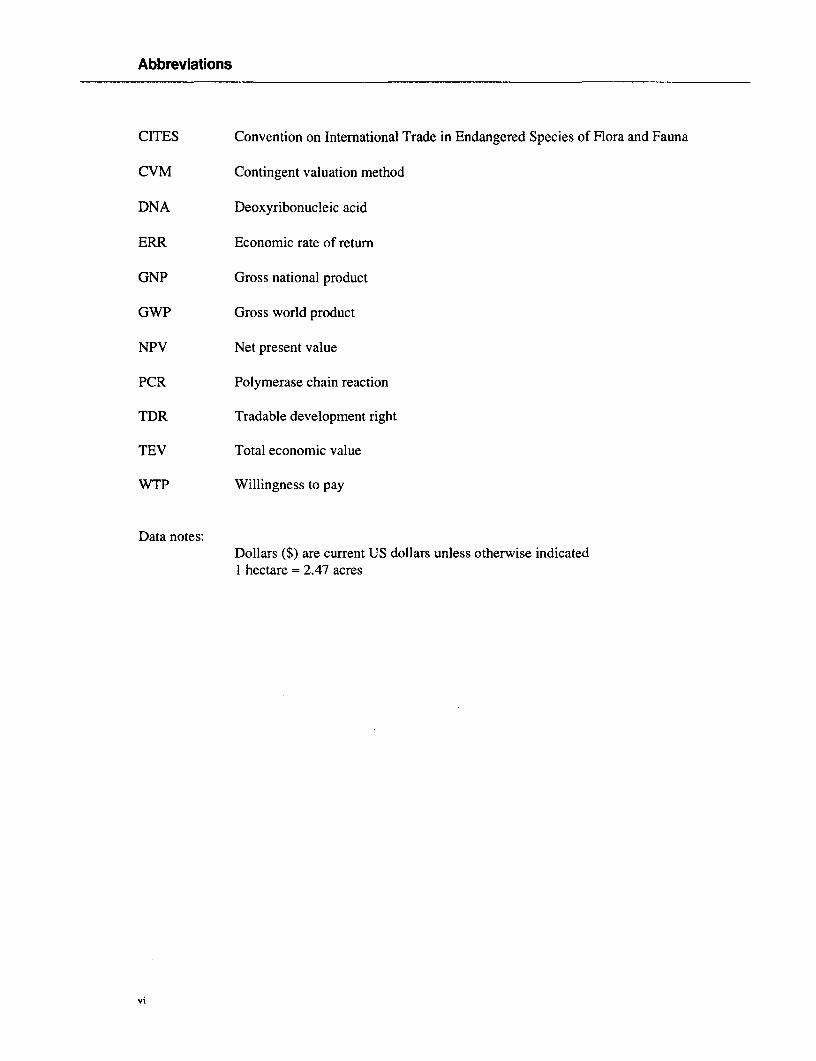
Abbreviations
CITES Convention on International Trade in Endangered Species of Flora and Fauna
CVM Contingent valuation method
DNA Deoxyribonucleic acid
ERR Economic rate of return
GNP Gross national product
GWP Gross world product
NPV Net present value
PCR Polymerase chain reaction
TDR Tradable development right
TEV Total economic value
WTP Willingness to pay
Data notes:Dollars ($) are current US dollars unless otherwise indicated1 hectare = 2.47 acres
vi

Introduction
The Global Environment Facility (GEF) was estab- but which have ample rationale when considered inlished in 1990 for a Pilot Phase of three years. Its the context of global costs and benefits. Examplespurpose is to channel investment and technical of the problems posed include:assistance funds to developing nations to assistthem with their role in reducing four major global * How best to choose between projects that areenvironmental problems: the depletion of the ozone innovative but more costly compared with otherslayer, the threat of global warming, the degradation that may be more traditional but yield moreof international waters, and the loss of biological immediate, sizable reductions in local pollutiondiversity. The GEF will continue into an operation- * How to measure the benefit of biodiversity con-al phase, GEF II, in which it will consolidate its servation, and hence how to choose betweenlearning experience and disburse funds to the four competing conservation projects.focal areas, and toward solving problems of deser-tification and tropical deforestation insofar as they Because the GEF is charged in its operational phaserelate to the original four areas of concern. The with assuring the "cost-effectiveness of its activities inmodified GEF will be the interim funding instru- addressing the targeted global environmental issues"ment to achieve the goals of the two international (GEF 1992, Principle IV), the measurement of costconventions-the Framework Convention on Cli- and effectiveness is a focal concern. Cost-effective-mate Change and the Convention on Biological ness has long been the concern of economics as aDiversity-agreed at the Earth Summit in Rio de discipline, and the time seems right for some reflec-Jane3iro in June 1992. tions on the way that economics can contribute to
achieving the GEF's global objectives.The disciplines needed for the efficient working ofthe GEF embrace science and social science. The This paper is intended as a contribution to this process.need to think of global solutions and global costs It focuses very much on the perspective of the econo-and benefits has set a challenge for these disci- mist, but without (we hope) suggesting that econom-plines, and the Pilot Phase of the GEF has been ics is the only relevant discipline. It clearly is not. Thecharacterized by a productive questioning of the paper also focuses only on biodiversity, for two rea-techniques and procedures whereby investments sons. First, the GEF has already commissioned workare usually appraised to see how they are best in the area of cost-effectiveness and greenhouse gasmodified, if at all, in the global context. The reason reduction (Mintzer 1992). The second is that biodiver-for this reappraisal is that the GEF exists in the main sity represents a major challenge to cost-effectivenessto fund those investments which have limited or no thinking: it will take a good deal more collaborativerationale in terms of net gains to the host country, and interdisciplinary thinking to develop the kinds of

evaluative tools that are needed for this purpose. Rath- Economists, like scientists, have a habit of usinger, we have set out to say, broadly, what is known about jargon. We have tried to minimize its use to makethe contribution of economics to biodiversity conser- the paper comprehensible to the largest possiblevation, and to suggest some ways in which this "state audience. In so doing we are conscious that theof the art" impinges on GEF concerns. As such, we go professional economist may feel we have oversim-beyond the immediate issues of measuring costs and plified or failed to qualify statements sufficiently.effectiveness of conservation to investigate also why We feel that the increase in communicability is abiodiversity is being eroded, for only by analyzing price worth paying for this oversimplification.causes can we ultimately secure truly cost-effectivepolicies.
2

Concepts and Measuresof Biological Diversity
The term biological diversity, often shortened to and micro-organisms. Each species is the reposito-biodiversity, is commonly used to describe the ry of an immense amount of genetic information.number, variety, and variability of living organ- The number of genes ranges from about 1,000 inisms. Biodiversity therefore embraces the whole of bacteria to more than 400,000 in many flowering"Life on Earth." Decline in biodiversity includes all plants. Each species consists of many organisms,those changes that have to do with reducing or and virtually no two members of the same speciessimplifying biological heterogeneity-from indi- are genetically identical. Thus, even if an endan-viduals members of a species to regional ecosys- gered species is saved from extinction, it probablytems. has lost much of its internal diversity. Consequent-
ly, when populations expand again, they becomeThis chapter explains some of the key concepts of more genetically uniform than their ancestors. Forbiodiversity, and approaches to the measurement of example, the bison herds of today do not have thebiodiversity and its components. Some estimates of same genetic diversity as the bison herds of therates of extinction are presented, and the problems early eighteenth century (McClenagham et al.in deriving such figures highlighted. The develop- 1990).merit of indicators to assess and monitor biodiversi-ty that aid in the formulation of effective conservation Population geneticists have developed mathemati-strategies, are briefly described. The chapter stress- cal formulas to express a genetically effective pop-es the range of measures of diversity from different ulation size. These explain the genetic effects onscientific perspectives. The different conceptual- populations that have passed through the bottleneckizatitons of biodiversity lead to different policy of a small population size, such as the North Amer-prescriptions, and require different indicators for ican bison or African cheetah (World Conservationmonitoring and assessment. Monitoring Centre 1992). Subsequent inbreeding
may result in reduced fertility, increased suscepti-The meaning of biological diversity bility to disease, and other negative effects that areBiodiversity may be described in terms of genes, termed "inbreeding depression." These effects de-species, and ecosystems, corresponding to three pend on the breeding system of the species and thefundamental and hierarchically related levels of duration of the bottleneck. If the bottleneck lasts forbiological organization. many generations, or population recovery is ex-
tremely slow, much variation can be lost. Converse-Genetic diversity ly, "outbreeding depression" occurs when speciesGenetic diversity is the sum of genetic information become genetically differentiated across their range,contained in the genes of individual plants, animals and individuals from different parts of the range
3

breed. Genetic differentiation within species oc- The exact number of species on earth is not known,curs as a result of either sexual reproduction, in not even to the nearest order ofmagnitude. Wilsonwhich genetic differences from individuals may be (1988) estimates that the absolute number of spe-combined in their offs,pring to produce new combi- cies falls between 5 million to 30 million, althoughnations of genes, or ifrom mutations, which cause some scientists have put forward estimates of up tochanges in the deoxyribonucleic acid (DNA). 50 million. At present, approximately 1.4 million
living species have been described. The best cata-The significance of genetic diversity is often high- logued groups are vertebrates and flowering plants.lighted with reference to global agriculture and Such groups as lichens, bacteria, fungi, and round-food security. This stresses the dependence of the worms are relatively under-researched. Likewise,majority of the world's human population on a few some habitats are better researched than others.staple food species. These staple species have been Coral reefs, the ocean floor, and tropical soils areimproved by tapping genes from their wild relatives not well studied. As we shall see, this lack ofto foster new characzteristics, for example, to im- knowledge has considerable implications for theprove resistance to pests and disease (Cooper et al. economics of biodiversity conservation.1992).
The most obvious pattern in the global distributionSpecies diversity of species is that overall species richness increasesSpecies are populations within which gene flows with decreasing latitude. Not only does this apply asoccur under natural conditions. Within a species, a general rule, it also holds within the great majorityall normal individuals are capable of breeding with of higher taxa, at order level or higher. However,other individuals of tlhe opposite sex, or at least of this overall pattern masks several minor trends.being genetically linked with them through chains Species richness in particular taxonomic groups, orof other breeding individuals. By definition, mem- in particular habitats, may show no significant lat-bers of one species do not breed freely with mem- itudinal variation, or may actually decrease withbers of another species. Although this definition decreasing latitudes. In addition, in terrestrial eco-works well for many animal and plant species, it is systems, diversity generally decreases with increas-more difficult to delineate species in populations ing altitude. This phenomenon is most apparent atwhere hybridization, self-fertilization or partheno- extremes of altitude, with the highest regions at allgenesis occur. Scientists often disagree about where latitudes having extremely low species diversity.the necessary arbitrary divisions must be made. However, these areas also tend to be relatively
small, which may be a factor that results in lowerNew species may be established through polyp- species numbers. In marine systems, depth is theloidy, the multiplication of the number of gene- analogue of altitude in terrestrial systems, and biodi-bearing chromosomes. More commonly, new versity tends to be negatively correlated with depth.species result from geographic speciation, the pro- Gradients and changes in species richness are alsocess by which isolated populations diverge through noticeably correlated to precipitation, nutrient lev-evolution by being subjected to different environ- els, and salinity, as well as other climatic variationsmental conditions. Over a long period, differences and available energy.between populations may become great enough toreduce interbreeding. Eventually populations may Ecosystem diversitybe able to co-exist as newly formed, separate Ecosystem diversity relates to the variety of habitats,species. biotic communities, and ecological processes in the
biosphere, as well as to the diversity within ecosys-Within the hierarchical system used by scientists to tems. Diversity can be described at a number ofclassify organisms, species represent the lowest different levels and scales. Functional diversity is thelevel of classification. In ascending order, the main relative abundance of functionally different kinds ofcategories, or taxa, of living things are: species, organisms. Community diversity comprises the size,genus, family, order, class, phylum, and kingdom. number, and spatial distribution of communities, and
4

is sornetimes referred to as patchiness. Landscape include keystone species, whose loss would trans-diversity is the diversity of scales of patchiness. form or undermine the ecological processes, or
fundamentally change the species compositionNo sirnple relationship exists between the diversity of the community.of an ecosystem and such ecological processes asproductivity, hydrology, and soil generation. Nor Biodiversity is thus a complex and all embracingdoes (diversity neatly correlate with ecosystem sta- concept that can be analyzed and interpreted onbility, its resistance to disturbance, or its speed of many levels and scales.recovery. There is also no simple relationship with-in any ecosystem between a change in its diversity Measurement of biodiversityand the resulting change in its component process- Biodiversity can be better understood when wees. On the one hand, the loss of a species from a examine exactly what we measure to assess biolog-particular area or region (local extinction or extirpa- ical diversity. However, this also serves to highlighttion) may have little or no effect on net primary further the range of interpretations, and the impor-productivity if competitors take its place in the tance placed on different hierarchical levels ofcomrnunity. On the other hand, there can be cases biodiversity, by scholars of different disciplineswhere the converse is true. For example, if zebra and by policy-makers. Reid et al. (1992) haveand wildebeest are removed from the African sa- commented on the continuing lack of a clear con-vannah, net primary productivity of the ecosystem sensus about how biodiversity should be measured.would decrease. Indeed, debates on measurement have comprised a
substantial part of the ecological literature since theDespite these anomalies, Reid and Miller (1989) 1950s. This lack of consensus also has importantsuggest six general rules of ecosystem dynamics implications for the economics of biodiversity con-that link environmental changes, biodiversity, and servation. At its most basic level, any measure ofecosystem processes. These rules are: cost-effectiveness used to guide investments in
conservation must have some index, or set of index-* The mix of species making up communities and es, of change in biodiversity.
ecosystems changes continually.* Species diversity increases as environmental het- Measurement of genetic diversity
erogeneity or the patchiness of a habitat does, but The analysis and conceptualization of differencesincreasing patchiness does not necessarily result within and among populations is in principle iden-in increased species richness. tical, regardless of whether one is considering a
* Habitat patchiness influences not only the com- population to be a local collection of individuals, aposition of species in an ecosystem, but also the geographical race, a subspecies, species, or higherinlteractions among species. taxonomic group. Genetic differences can be mea-
* Periodic disturbances play an important role in sured in terms of phenotypic traits, allelic frequen-creating the patchy environments that foster high cies, or DNA sequence.species richness. They help to keep an array of Phenetic diversity. This is based on measures ofhabitat patches in various successional states. phenotypes, which are individuals that share the
* Both size and isolation of habitat patches can same characteristics. The method avoids exami-influence species richness, as can the extent of nation of the underlying allelic structure. It istransition zones between habitats. These transi- usually concemed with measurement of the var-tional zones, or "ecotones," support species that ance of a particular trait, and often involveswould not occur in continuous habitats. In tem- readily measurable morphological and physio-perate zones, ecotones are often more species logical characteristics. Phenetic traits can berich than continuous habitats, although the re- easily measured, and their ecological or practical
verse may be true in tropical forests. utility is either obvious or can be readily inferred.* Certain species have disproportionate influences H t g
on the characteristics of an ecosystem. These sHowever, their genetic basis s often difficult toassess, and standardized comparisons are diffi-

cult when populations or taxa are measured for In its ideal form, species richness would consist of aqualitatively different traits. complete catalogue of all species occurring in the
* Allelic diversity. I'he same gene can exist in a area under consideration, but this is not usuallynumber of variants and these variants are called possible unless it is a very small area. Species rich-alleles. Measures of allelic diversity require ness measures in practice therefore tend to be basedknowledge of the allelic composition at individ- on samples. Such samples consist of a completeual loci on a chrornosome. This information is catalogue of all organisms within a taxa found in agenerally obtainedl using protein electrophore- particular area. Alternatively, species richness mightses, which analyzes the migration of enzymes be a measure of species density in a given sampleunder the influence of an electric field. Allelic plot, or a numerical species richness defined as thediversity may be measured at the individual number of species per specified number of individ-level or at the population level. In general, the uals, or as a unit of biomass.more alleles, the more equitable their frequen-cies; and the more loci that are polymorphic, the A more informative measure of diversity would alsogreater the genetic diversity. Average expected incorporate the "relatedness" of the species involvedheterozygosity (the probability that two alleles (Reid et al. 1992). Using a measure of taxonomicsampled at randorn will be different) is com- richness would imply that a region containing manymonly used as an overall measure. Several dif- closely related species would rank lower than oneferent indexes and coefficients can be applied to containing the equivalent number of distantly relat-the measurements to assess genetic distance ed species. However, as measures which could be(see Antonovic 1990). The advantage of the applied to a range of different organisms have yet todetection of allelic variation by electrophorese be developed (but see Weitzman 1991 a, 1991 b), theis that it can be precisely quantified to provide richness of genera or families may provide a morecomparative measures of genetic variation. accurate assessment of species diversity than simpleHowever, the disadvantages are that it may not measurements of species richness.be representative of variation in the genome asa whole, and does not take account of functional Measurement of community diversitysignificance or the selective importance of par- Many environmentalists and ecologists stress theticular alleles. importance of conservation of biodiversity at the
* Sequence variation. This involves sequencing a community level. However, several factors makeportion of DNA using the polymerase chain measurement and assessment of diversity at thisreaction (PCR) teclnique. This technique means level more nebulous and problematic. Many differ-that only a minute amount of material, perhaps ent "units" of diversity are involved at the supra-one cell, is required to obtain the DNA sequence species level, including:data, so that only a drop of blood or a single hairis required as a sarnple. Closely related species * Pattern of habitats in the communitymay share 95 percent or more of their nuclear * Relative abundance of speciesDNA sequences, implying a great similarity in * Age structure of populationsthe overall genetic information. * Patterns of communities on the landscape
* Trophic structureMeasurement of species diversity * Patch dynamics.Species diversity is a function of the distributionand abundance of species. Often, species richness- At these levels, unambiguous boundaries delineat-the number of species within a region or given ing units of biodiversity do not exist. By conservingarea-is used almost synonymously with species biodiversity at the ecosystem level, not only are thediversity. Technically, however, species diversity constituent species preserved, but the ecosystemincludes some consideration of evenness of species functions and services are also protected. Theseabundances. Let us first consider species richness as include pollutant cycling, nutrient cycling, climatea proxy measure of species diversity. control, as well as non-consumptive recreation, sci-
6
entific, and aesthetic values (see forexample, Norton pollution also contribute. Global warming is ex-and Ulanowicz 1992). pected to exacerbate the loss and degradation of
biodiversity by increasing the rate of species extinc-Given the complexities of defining biodiversity at tion, by modifying the composition of habitats andcommunity and at ecosystem levels, a range of ecosystems, and by altering their geographic areasmeasurement approaches exist. As Reid et al. (Peters and Lovejoy 1992).(1992) explain, many community attributes arecomponents of biodiversity and might deserve Traditionally, from the Darwinian perspective, ex-monitoring for specific objectives. For example, tinction is the fate of species that lose the strugglegeneric measures of community-level diversity in- for survival. Taken to its logical conclusion, thisclude biogeographical realms or provinces based on view implies that extinction is a constructive pro-the distribution of species, and eco-regions or eco- cess, eliminating obsolete species. It is now widelyzones based on physical attributes such as soils and recognized, however, that this is not the case, sinceclimate. These definitions may differ according to human intervention distorts the natural process.scale. For example, the world has been divided into Many extinctions are non-constructive, and a spe-biogeographical provinces, which are the more finely cies' ultimate demise is not a reflection of its "good-grained classifications that might be useful for ness" as a biological organism.policy-making. More policy-oriented measures in-clude the definition of hotspots (based on the num- No precise estimate of the number of species beingber of endemic species) and the delineation of lost can be made, because the present number is notmegadiversity states. These concepts will be dis- known. The vast majority of species is not moni-cussed in the context of using indicators for assess- tored. However, there is no doubt that extinction ising and monitoring biodiversity. proceeding faster than it did before 1800. It seems
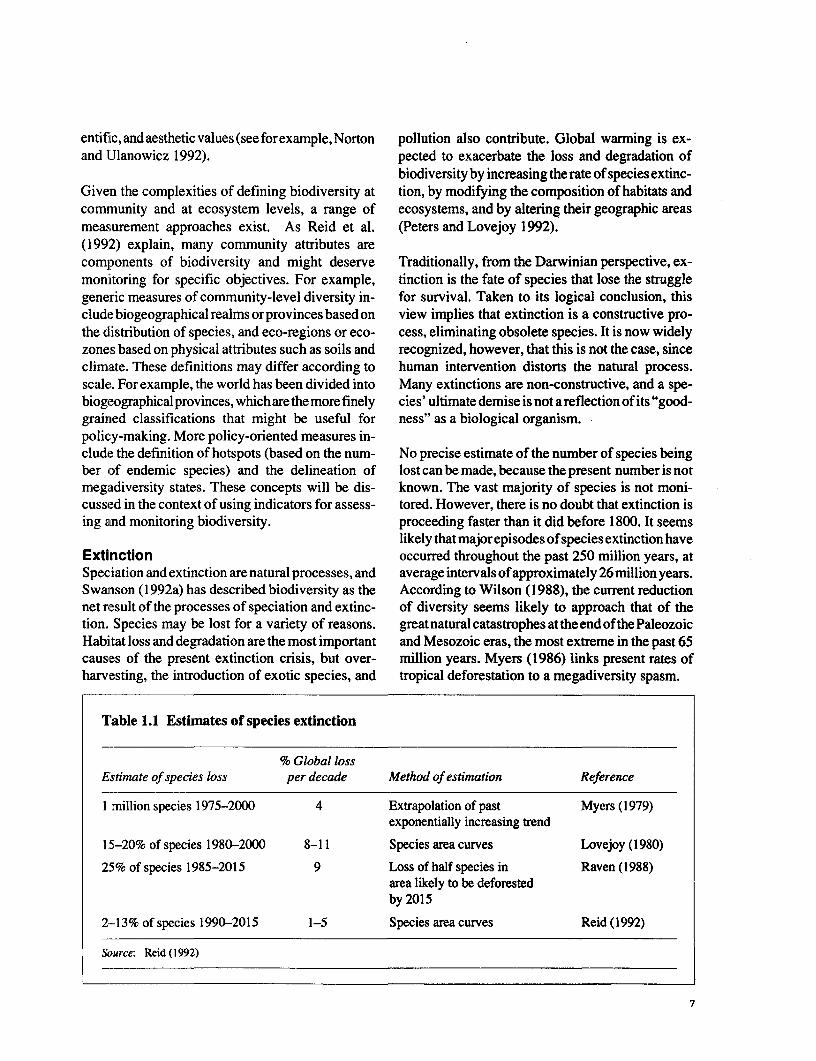
likely that major episodes of species extinction haveExtinction occurred throughout the past 250 million years, atSpeciation and extinction are natural processes, and average intervals of approximately 26 million years.Swanson (I 992a) has described biodiversity as the According to Wilson (1988), the current reductionnet result of the processes of speciation and extinc- of diversity seems likely to approach that of thetion. Species may be lost for a variety of reasons. great natural catastrophes at the end of the PaleozoicHabitat loss and degradation are the most important and Mesozoic eras, the most extreme in the past 65causes of the present extinction crisis, but over- million years. Myers (1986) links present rates ofharvesting, the introduction of exotic species, and tropical deforestation to a megadiversity spasm.
l'able 1.1 Estimates of species extinction
% Global lossEstimate of species loss per decade Method of estimation Reference
I million species 1975-2000 4 Extrapolation of past Myers (1979)exponentially increasing trend
15-20% of species 1980-2000 8-11 Species area curves Lovejoy (1980)
25% of species 1985-2015 9 Loss of half species in Raven (1988)area likely to be deforestedby 2015
2-13% of species 1990-2015 1-5 Species area curves Reid (1992)
Source: Reid (12992)
7

Table 1.1 shows some recent estimates of extinction argues that such a technique may be more appropri-rates. Many are based on estimates of habitat loss. ate for assessing conservation options than just aThe procedure estimates potential losses of species conventional taxonomic approach. This alternativeby extrapolation of rates of habitat destruction and approach focuses on the aspects of biodiversity thatcalculation of associated extinctions using species are critical for maintaining the resilience of ecosys-area curves. It is based on principles of island tems. Resilience is the capacity of an ecosystem tobiogeography, and recognizes a relationship be- maintain its characteristic patterns and rates oftween the number of species present and the area of processes such as primary productivity and nutrienta given habitat (MacArthur and Wilson 1967). Due cycling in response to variable environmental con-to several problems alssociated with the use of this ditions. At the other extreme, Eiswerth and Haneyrather over-simplified equation for the calculation (1992) argue that environmental economists andof extinction, figures calculated in this way might policy-makers tend to focus on the importance ofunderestimate the exjpected extinction rate. species in isolation to one another, and on the
number of species (species richness) in naturalAssessing and monitoring biodiversity areas, to the exclusion of genetic and ecosystemfor conservation diversity. They propose the use of estimates ofFor the assessment and monitoring of biodiversity inter-species genetic distance (originating in DNA-as an aid to conservation policy, Noss et al. (1992) DNAhybridization)asameasureofgeneticdistinc-suggest a number of indicators. Useful indicators at tiveness which should be considered in decidingthe species level include monitoring of keystone conservation policy.species-those speciles of pivotal importance intheir ecosystems upon which the diversity of the In biodiversity, as in other areas, economic andcommunity as a whole strongly depends; and um- political factors rather than biological expedientsbrella species (relatively wide-ranging species, such often dictate the policies that are enacted. Soberonas large carnivores, whose protection would assure (1992) highlights the gaps between conservationadequate amounts of habitat for many other spe- theory and practice. For example, reserve sites arecies). Five categories of species have been used to proposed for reasons of historical biogeography:justify special conservation efforts: ecological indi- richness of selected taxa, number and kinds ofcator, keystone, umbrella, flagship (charismatic), endemism, and other indexes that can be quantified.and vulnerable species. However, in practice, the size and shape of reserves
are chosen as a result of political and economicAt a community level, taxonomic groups that are considerations.relatively easy to monitor or that are particularlysensitive to environmental stress (for example, Conclusionsamphibians, fish, predatory birds, and butterflies) The design and implementation of conservationmay be monitored for changes in abundance, spe- policies will depend on what we want to conserve,cies richness, or guild (a group of organisms that how we define biodiversity, and how we measure itshares a common food source) proportions. Bibby in practice. It is clear that what we measure and howet al. (1992) advocate the use of endemic bird we choose to measure it affects our judgement andspecies for identifying areas for conservation. At a our ability to formulate and enact effective policy.landscape level, environmental changes such as From a conservation standpoint, it must be remem-changes in land use (say deforestation), human bered that regions rich in some species are notpopulations, demography, and even gross national necessarily rich in others. For example, in terms ofproduct (GNP), may be used as indicators. species per unit area, Central America is more
species rich than northern South America, but north-Increasingly, scientists argue that a species focus is ern South America has more plant species. On thenot the best approachi to the conservation of biodi- African continent, the species richness of butter-versity. For example, Walker (1992) presents a flies is greater in west Africa just north of thefunctional approach to analyzing biodiversity. He equator, while the diversity of passerine birds, pri-
8

mates, and ungulates is greatest in central and east scientists argue that this cannot be done effectivelyAfrica, and plant diversity is greatest just north and without more accurate data on existing species.south of the equator in west Africa. Mares (1992) Wilson (1988) has drawn attention to the declininghas recently drawn attention to the incongruity in number of taxonomists worldwide, the dwindlingconcentrating on Amazonia as the center of biodi- financial resources for their work, and the need toversity. The drylands in South America are habitat conserve this endangered species.to 53 percent more endemic mammalian species,and 440 percent more endemic genera than the Biodiversity can be interpreted and measured onAmazonian lowlands. On the basis of Mares' find- different levels of biological organization. Ourings, if a single macro-habitat were chosen in which knowledge is far from complete in many areas ofto preserve the greatest mammalian diversity in genetics, in terms of total species and their distribu-South America, it would be the largely continuous tion, and an ecological functions and processes.deserts, scrublands and grasslands. This is exactly There is no scientific consensus on how best tothe converse of the funding, research, and conserva- measure biodiversity, but a number of indicatorstion strategies that have been employed to date. have been developed to inform conservation policy.
Research is required on a number of fronts, includ-The gaps in our knowledge of global biodiversity ing inventory, classification, mapping distribution,are significant, and basic work on inventories and and monitoring. The implications for the econom-systernatics is still required. Noss et al. (1992) ics of biodiversity conservation are potentially for-highlight the need for biodiversity inventories, which midable. If we do not know what we are conservingthey visualize as a series of filters designed to and no reasonable consensus exists on how tocapture elements of biodiversity at various levels of measure biodiversity, how can effective policy beorganization. At a national level, biodiversity in- designed? While conservation policy may thus ap-ventories are best focused on the species, commu- pear to be very much a hit-and-miss affair-and itnity (ecosystem), and landscape levels. While Erwin does tend to be so for many reasons in addition to(1991) also acknowledges these gaps in knowledge, scientific uncertainty, as we shall see-it is impor-he highlights the potential pitfalls in attempting to tant that policy goes in the right direction, even if anestimate all the species on earth. Knowledge of the optimal policy is not apparent. However, beforeprecise number of species might not be as important investigating what that direction is, the importanceas recognizing the present rate of extinction due to of biological diversity needs to be established. Thishuman intervention, and devising policies to mini- may seem odd, but it is the failure to establish whymize it. This view implies that research efforts biodiversity is important that explains why so muchshould be channeled into conservation and preser- economics appears to proceed on the assumptionvation of those species that we do have. Some that it is not important.
9
Placing a'Value2 on Biological Diversity
Ethics and econDmics life itself. It is commonplace to find references toEconomists approach the issue of measuring impor- the value of life. Economists are apt to speak of thetance in a particular way. The essence of their environment as a commodity, which leaves themapproach is that imrportance is measured by peo- open-perhaps justifiably-to charges that this isple's preferences. In turn, preferences are measured all the environment is worth. All these terminolo-by looking at an individual's willingness to pay gies generate an unfortunate image of what eco-(WTP) for something. Economic value is then mea- nomic valuation involves. What is being valued issured by the summation of many individuals' will- not the "environment" or "life," but people's pref-ingness-to-pay. So economic valuation in the erences for changes in the state of their environ-environment context is about measuring the prefer- ment, and their preferences for changes in the levelences of people for an environmental good (biodi- of risk to their lives. There is no dispute that peopleversity) or against an environmental "bad" (loss of have preferences for and against environmentalbiodiversity). Valuation is therefore of preferences change. There is no dispute that people are willingheld by people. The valuation process is anthropo- to pay to prevent or secure change: donations tocentric. The resulting valuations are in money terms conservation societies alone demonstrate this. Thebecause preference revelation isdeterminedthrough problem arises when this WTP is taken as the valuepeople's WTP, or by inferring their WTP through of the environmental change. Many people believeother means. Moreover, the use of money as the that there are intrinsic values in environmentalmeasuring rod perrnits the comparison that is re- assets. They are of value in themselves and are notquired between enviironmental values and develop- "of' human beings, values that exist not just be-ment values. The latter are expressed in money cause individual human beings have preferences forterms, either in a dollar amount or an economic rate them. There is no reason to reject the idea ofof return. Using other units to measure environmen- intrinsic values because the idea of measuring pref-tal values would not permit the comparison with erences is adopted. What is being assessed are twodevelopment values. different things: the value of preferences of people
for or against environmental change (economicThe language of economic valuation is often mis- values) and the value that intrinsically resides inleading. Studies speak of valuing or pricing the environmental assets (intrinsic values).environment. Similarly, changes in the environ-ment affect health so it is necessary to find some Economic valuation is essentially about discover-valuations of changes in health status, with the ing the demand curve for environmental goods andultimate change, of course, being the cessation of services: the values of human beings for the envi-
10

ronment. This is another way of talking about find- discussion of rights and intrinsic values into theing willingness to pay.' The use of money as the policy dialogue can be counterproductive in con-measuringrodisaconvenience: WTPhappenstobe texts where the conflict is between conservationone of the limited number of ways in which people and, say, converting land to food production forexpress preferences. Once it is accepted that both immediate needs. If, on the other hand, conservationforms of value exist, the issue becomes one of which and the sustainable use of resources can be shown tovalues should inform and guide the process of be of economic value, then the dialogue betweenmaking public choices. The answer is that since developer and conservationist may be viewed dif-both values are legitimate, both are relevant to ferently, not as one of necessary opposites, but ofdecision-making. Making decisions on the basis of potential complements or alternative land uses thateconomic values alone neither describes real world compete on an equal footing. The remaining stagedecision-making, nor would be appropriate given rests on finding ways for the developing world tothat governments and other agents involved in the capture or appropriate the conservation benefits. Ifdevelopment process have multiple goals. But one environmentalists in richcountries perceive value indilfference between the economic and intrinsic val- conserving a rainforest in a poor country, this is ofue approach is that economic values can, in princi- little consequence to the poor country unless there isple, be measured. Intrinsic values cannot. If a potential cash flow or technology transfer to bedecision-makers do not feel the need for quantified obtained. Economic valuation is therefore a two-assessments of gains and losses, then lack of quan- part process in which it is necessary to:tification may not be an obstacle to decision-mak-ing. Otherwise it will often prove difficult to make * Demonstrate and measure the economic value ofchoices between competing projects or alternative environmental assets-what we will call the dem-policies with differing environmental impacts. onstration process
Find ways to capture the value-the appropria-The practical problem with economic valuation is tion process.one of deriving credible estimates of that value incontexts where there are either no apparent markets Total economic valueor very imperfect markets. If it is possible to derive The economic value of environmental assets can besuch values, then it may well be that some measures broken down into a set of component parts. This canof individuals' preferences will, in any event, cap- be illustrated in the context of decisions about alter-ture at least part of what might be called intrinsic native land uses for a tropical forest, but the examplevalue. This will be so if the people expressing values can be generalized. According to a benefit-cost rule,for the environmental change in question them- decisions to "convert" a tropical forest, for sayselves possess some concept of the intrinsic value of agricultural development, would have to be justifiedthings. They may then bepartly valuing"on behalf' by showing that the net benefits from agricultureof the environment as an entity in itself. exceed the net benefits from conservation. Conser-
vation could have two dimensions: preservation,Many of the environmental assets that people gen- whichwouldbeformally equivalentto outrightnon-erally feel are very important are in the developing use of the resource; and conservation, which wouldworld. Notable examples include the tropical rain- involve limited uses of the forest consistent withforests, ecologically precious wetlands and moun- retention of natural forest. The definitions are neces-tain regions, and many of the world's endangered sarily imprecise. Some people would argue, forspecies. Many people feel these environmental as- example, that ecotourism is not consistent withsets have intrinsic value. They may express that sustainable conservation, while others may say thatview by speaking of the immorality of activities it could be. Accepting the lack of precise lines ofwhich degrade these resources, and of the "rights" differentiation, the benefit-cost rule would be toto existence of trees and animal species. Bringing convert the forest land only if the development
Strictly, the demand curve traces out the willingness to pay for extra (or marginal) amounts of something. So the demand curve is amarginal willingness to pay schedule.
II

benefits minus the development costs are greater clearance, cannot consume the non-marketed ben-than the benefits of conservation minus the costs of efits. This asymmetry of values imparts a consider-conservation. able bias in favor of the land-use conversion option.
As we shall see, these non-market benefits also haveTypically, the benefits and costs accruing to the two spatial dimensions: benefits within the nationconverted land use can be fairly readily calculated that possesses the resource, and benefits to otherbecause there are attendant cash flows. Timber nations. Thus, the benefits of the tropical forest inproduction, for example, tends to be for commercial nation A include such things as the watershedmarkets and market prices are observable. Conser- protection functions that the forest may have. Thevation benefits, on the other hand, are a mix of benefits to country B of A's forest includes theassociated cash flows and non-market benefits. contribution that the forest makes to global climateThis fact imparts two biases. The first is that the stability, and the benefits reflected in B's willing-components with associated cash flows are made to ness to pay to conserve the forest habitat because ofappear more "real" than those without such cash its biodiversity. We shall refer to these differentflows. There is a certain misplaced concreteness: spatial benefits as domestic (or host country) bene-decisions are likely to be biased in favor of the fits, and global benefits respectively.development option because conservation benefitsare not readily calculable. The second bias follows Conservation benefits are included in total econom-from the first. Unless incentives are devised where- ic value (TEV). Total economic value for a tropicalby the non-market benefits are internalized into the forest is explained in Table 2. 1. This value compris-land-use choice mechanism, conservation benefits es use and non-use values. Conservation is consis-will automatically be downgraded. Those who stand tent with some sustainable uses of the forest,to gain from, say, timber extraction or agricultural including sustainable timber harvesting.
Table 2.1 Total economic value and tropical forests
Total Economic Value = Use value + Non-use value
(1) (2) (3) (4)
Direct + Indirect + Option + Existencevalue value value value
Sustainabletimber
Non-timber Nutrient Future uses Forests as ofproducts cycling as per intrinsic value,
(1) + (2) as a gift toothers, asresponsibilityand stewardship
Recreation Watershedprotection
Medicine Air pollutionreduction
Plant genetics Microclimate
Education
Humanl habitat
12

Direct use values value, obtained through questionnaire approachesSuch values are fairly straightforward in concept (the contingent valuation method), suggest thatbut are not necessarily easy to measure in economic existence value can be a substantial component oftenns. Thus minor forest products output (such as total economic value. This finding is even morenuts, rattan and latex) should be measurable from pronounced where the asset is unique, suggestingmarket and survey data, but the value of medicinal high potential existence values for unique ecosys-plants for the world at large is more difficult to tems. Some analysts like to add bequest value as ameasure, although estimates exist (see Pearce and separate category of economic value. Others regardPuroshothaman, 1992). it as part of existence value. In empirical terms they
would be hard to differentiate.Indirect use valuesThese values correspond to the ecologist's concept Total economic value can be expressed as:of ecological functions. A tropical forest might helpprotect watersheds, for example, so that removing TEV = Direct use value + Indirect use value +forest cover may result in water pollution, siltation, Option value + Existence valuefloods and droughts, depending on the alternativeuse to which that forest land is put. Similarly, The usefulness of this classification is in practicetropical forests store carbon dioxide (CO2). When debatable. Most contingent valuation studies distin-they are burned for clearance much of the stored guish use values from "non-use" values, but do notCCO2 is released into the atmosphere, contributing to attempt to break down the component parts of non-greenhouse gas atmospheric warming. Tropical use value (or "passive use" value, as some recentforests also store many species which in turn may literature calls it-see Arrow et al. 1993). Othershaave a wide range of ecological functions. deny that existence value is relevant to economic
valuation since it may be representing counter-Option values preferential values based on moral concern, obliga-These relate to the amount that individuals would be tion, duty, altruism, and so on. But if we take thewilling to pay to conserve a tropical forest for purpose of benefit measurement to be one of dem-possible future use. Option value is thus like an onstrating economic value, however it may be mo-insurance premium to ensure the supply of some- tivated, many of these problems disappear.thing the availability of which would otherwise be Nonetheless, it is as well to be aware that theuncertain. While there can be no presumption that underlying principles and procedures for economicoption value is positive, it is likely to be so in a valuation are still debated.context where the resource is in demand for itsenvironmental qualities and its supply is threatened Is Total Economic Value really total?by deforestation. It may be tempting to think that economists have
captured all there is to know about economic valueExistence value in the concept of TEV. But this is obviously incor-This relates to valuations of the environmental asset rect. First, recall that they are not claiming to havethat are unrelated either to current or optional use. captured all values, merely economic values. Sec-Its intuitive basis is easy to understand because a ond, many ecologists say that total economic valuegreat many people reveal their willingness to pay is still not the whole economic story. There are somefor the existence of environmental assets through underlying functions of ecological systems whichwildlife and other environmental charities despite are prior to the ecological functions that we havenot taking part in the direct use of the wildlife been discussing (such as watershed protection).throughrecreation.Tosomeextent,thiswillingness Turner (1992) calls them "primary values." Theyto pay may represent "vicarious" consumption are essentially the system characteristics uponthrough wildlife videos and TV programs, but stud- which all ecological functions are contingent. Thereies suggest that this is a weak explanation for cannot be a watershed protection function butexitstence value. Empirical measures of existence for the underlying value of the system as a whole.
13

There is, in some sense, a "glue" that holds every- Domestic costs (Cd) > Domestic benefits (Bd)thing together and that glue has economic value. If andthis is true, then there is a total value to an ecosystem Global benefits (Bg) > Domestic costs (Cd)or ecological process which exceeds the sum of thevalues of the individual functions. The rationale for focusing on Type II projects as the
prime focus for the GEF is straightforward. Type IThe discussion suggests three reasons for the im- projects are essentially development projects. If coun-portance of biological diversity. The first reason is tries were not to achieve an excess of domestic benefitsbased on the concept of economic value. If biodi- over costs, then investment would be inefficient andversity is economically important we would expect would not contribute to the developmental process.this to show up in an expressed willingness to pay GEF is not part of official development assistance andfor its conservation. Shoirtly, we will show that this is focused on global, not domestic, problems. Hence itsis indeed the case. The second reason is that eco- concern is mainly with Type II, not Type I projects.nomic value measurement will understate "true" Nonetheless, there will be circumstances in whicheconomic value because of the probable failure to some Type I projects will be eligible. This will be themeasure primary life support functions. This kind case when global benefits (Bg) are judged to be largeof economic value is difficult to observe because it and the beneficiary could legitimately be expected tois unlikely to be recognized until some disastrous pay; and when recipient countries are clearly con-event has happened: landslides consequent upon strained by capital shortages.deforestation, loss of fishing grounds due to pollu-tion, and so on. The third reason is that economic The magnitude (Cd - Bd) is one interpretation, at itsvalue does not capture--nor is it designed to cap- simplest level, of the concept of incremental cost.ture-intrinsic value. Acceptance of Type II projects thus requires that
global benefits exceed incremental cost, or:Global and domestic economic values inthe GEF context Bg > (Cd - Bd)The distinction between domestic and global eco-nomic values is of fundarnental importance for two On rearrangement this rule is a simple cost-benefitreasons: rule, expressed as:
- The rationale for intervention by the Global (Bg + Bd) > CdEnvironment Facility is to capture the globalvaluesof conservingbiodiversity,reducinggreen- In general contexts, there are two ways in which thehouse gas, preventing the pollution of intema- cost-benefit rule can be derived. The first is totional waters, and protecting the ozone layer estimate the monetary value of benefits. This means
* Failure to appropriate global values of biodiver- finding the willingness to pay of the host nation forsity conservation distorts the relative rates of biodiversity conservation (Bd), as well as the will-return between conservation and "developmen- ingness to pay of the rest of the world for conserva-tal" land use. tion-theglobal values (Bg). The secondis tomeasure
the effectiveness of the GEF intervention in terms ofThis section addresses the former issue, and the next some index of the change in biodiversity that comessection looks at the issue of the rate of return to about because of the investment, typically the differ-conservation. ence in some index of biodiversity with and without
the project. The procedure then is to relate the cost ofThe GEF is primarily concerned with projects which, the project to the index to produce a cost-effective-while not likely to yield net economic gains to the ness measure.country in question, will yield net global benefits.These are termed Type II projects and are character- There are many problems with the cost-effectivenessized by the following conditions: approach. Chapter I observed that there is no current
14
agreement on how to derive the relevant biodiversity Generalizing about these valuations is fraught withindicators. Even if indicators can be found, there are danger. We cannot, forexample, extrapolate values ofproblems in comparing different kinds of biodiversi- minor forest products to whole forests. Distance andty, no matter what unit of account (such as ecosystem limits of the market for the products will preclude this.or species) is chosen. These are issues to be addressed The examples are illustrative rather than conclusive.by the GEF and others. But the evidence does suggest that local values are
often higher than the price of land, or the net returnsIs it possible to obtain monetary values for biodiver- from "developmental" uses such as forestry and agri-sity conservation? The science of monetization has culture.2
certainly advanced greatly and there is a significantbody of work which bears on the issue (Pearce et al. Global economic values1992; Pearce 1993). Typically, what is being valued in Investigations into global economic values are com-these monetization exercises is not biodiversity per se, paratively few. They can be expected to increase as thebut usually some habitat such as a wetland or forest, or demand for such valuations increases. In turn, thisa patticular species. The following sections consider demand will increase as it becomes necessary toexamples of such economic values. In practice, some estimate the scale of international resource transferscombination of indicators and monetized benefits is under the various conventions agreed at the Earthlikely to be relevant to the evaluation of biodiversity Summit in Rio in 1992. However, early evidenceconservation measures. already suggests that such values could be substantial.
Various approaches to estimating global values areDomestic economic values possible.Biodiversity will tend to be conserved through habitatconservation. If it is possible to measure the domestic Contingent valuationbenefits of that conservation, then it is possible to The first is to use the "contingent valuation method"construe those benefits as reflecting the benefits of (CVM) to find out what people in any one country arebiodiiversity. This relationship between habitat values willing to pay to conserve biodiversity in anotherand biodiversity values is not very precise: it may be country. The CVM functions through sophisticatedpossible for some biodiversity to be reduced in a given questionnaires which ask people their willingness tohabitat without economic values being impaired. But pay. Global CVMs of this kind do not yet exist.3 Tablethe values that arise from conserved and sustainably- 2.3 assembles the results of some CVMs in severalused habitats will to some extent reflect the biodiver- countries. These report WTP for species and habitatsity in the habitat, since it is that diversity which conservation in the respondents' own country.contributes the economic value by providing, forexample, a range of medicinal plants, a variety of Debt-for-nature swapsminor products, or food. In a debt-for-nature swap an indebted country ex-
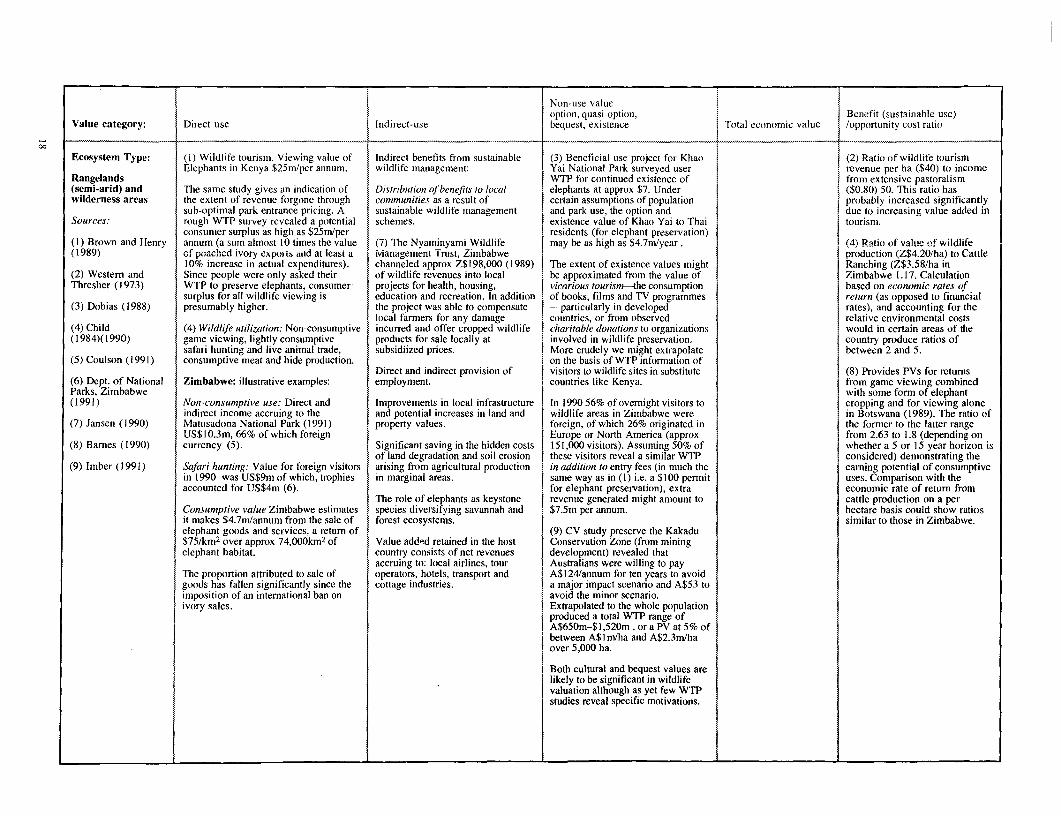
changes foreign debt for a newly created obligation,Table 2.2, taken from Pearce et al. (1992), summarizes on which payments in domestic currency are used tomany of the studies of economic value of biodiversity fund an agreed conservation ("nature") program. Theas initerpreted above. These values can be significant. foreign debt is acquired at the substantial discount atExamples of market value of sustainable products are which the debt is traded. Debt-servicing payments onthe estimate of some $6,800 per hectare (present the new domestic obligation are typically paid into avalue) for forest products in the Peruvian Amazon, fund that finances the conservation activities. Theand over $3,000 per hectare for local medicinal plants. price paid for the secondary debt can therefore beAn example of the non-market value is the $1,250 per thought of as a willingness to pay to conserve thehectare ecotourist values for Costa Rican forest, a resource in question (Ruitenbeek 1992). Table 2.4value which accrues in the form of inferred willing- assembles available data on debt-for-nature swaps toness to pay over and above what is actually paid. see what the implicit price might be.2 The price of land should be related to the benefits of developing the land. More formally, the price of land is the present value of theflow of profits from the land. In practice, however, land prices often have a significant and speculative element.
A global CVM is being carried out by the World Bank with respect to Madagascar's rainforests.
15

Table 2.2 Summary of studies on the economic value of biodiveristy
Non-use valuesoption, quasi-option, Benefit (sustainable use)
Value category: Direct use Indirect use bequest, existence Total economic value /opportunity cost ratio
Ecosystem type: (1) Sustainable harvesting in I hectare (3) Arising from sustained use of the Lower bound option value may be (2)Brazilian Amazon: (1), Implicit ratios of 6.82, 2.14of Peruvian Amazon, (timber, fruit and Korup forest: inferred from the current market ($1991) or 2.3 depending on alternative
Tropical forest latex 1987$). NPV hectarel $6,820 Existence of Watershed functions value or foreign exchange earning Direct Use $15b use, but subject to qualifications(local market values) relative to a net affording protecton to Nigerian and potential of plant based pharma- Indirect $46b regarding local elasticity of
Sources: revenue $1,000 h' from clear-felling Cameroonian fisheries: NPV ceuticals, (See Appendix I) Existence $30b demand for harvested forestwhich risks uncertain regeneration, (1989£) £3.8m (approx $6.8m) or Total $91b/year products. A similar exercise (12)
(I) Peters, Gentry and $3,184hal plantations for timber and $54ha, assuming that the benefit Attempts to gauge existence values in another area of PeruvianMendlesohn (1989) pulpwood or $2,960hal from cattle starts to accrue in 2010 and beyond in other contexts, rely on CVM to NPV (using Krutilla & Amazon contradicts these
ranching. (2010 represents the time horizon by report WTP/willingness to accent Fisher) $1 j296b estimates with a ratio of about 3f(2) Gutierrez and which the continued use of the forest compensation (WTA). To date only in favour of logging and rotationPearce (1992) (2) Estimated contribution of direct use resources (in the absence of one study relating directly to tropical (10) CVM survey of cropping.
to Brazilian GNP-$15b protection) would start to exhaust forests is available (10), although villagers' WTA, to(3) Ruitenbeek resources. The imputed benefit this does not report any foreign forego use benefits in (2) Total present value $1296bn(I 989a) (3) Medicinalgenetic Net Present Value stream therefore represents the (explicitly non-use) WTP. However the newly created over 3.6b ha-$360/ha relative to
$7/ha over 126,000 ha (park area) or continued existence of resources. (2) set the existence value for the Mantadia National Park a net revenue from clear felling(4) Mendelsohn and 426,000ha (with the additional buffer Brazilian Amazon at $30b, calcu- (Madagascar). of $1000/ha. The implied ratioTobias (1991) zone) This represents a minimum An imputed value of the expected lated using an arbitrary WTP figure Implicitly their of 0.36 will not be strictly
expected genetic value. Estimates loss from flooding resulting from (observed from various CVM valuation will reflect a representative since the(5) Pearce (199Id) depend on i) the probability of an area alternative land use from 2010 on- studies), aggregated across the total economic value of calculation of Total economic
yielding a drug base ii) the method of wards: NPV of expected value of OECD adult population. the resource foregone. value is not necessarily based on(6) Schneider et al. valuation iii) an assumed extent of rent loss by 2040 is £1.6m ($2.84m) or The survey revealed a the assumption of sustainable(1991) capture by local authority. $23 ha Donations to charitable funds may per household sum of use.
be one possibility to place CV $13.91 per annum,(7) Mendelsohn and Under certain assumptions the genetic/ Soil fertility maintenance. Benefit evaluations in context; however, which is aggregated (4) Implied for Costa Rica 12.5Balick (1992) medicinal NPV of tropical forest could imputed based on crop productivity adichotomy exists between the over the affected which is the ratio of recreation
be as high as $420 ha (See Appendix 1). decline from soil loss which would observed reason for giving and number of households value per hectare of protected(8) Pearce (1990) take effect from 2010 onwards (the actual use of funds. Problem of (347) to give $4,827 per area to the highest estimated
(4) Travel cost valuation of tourist trips without project scenario) NPV identifying organizations involved annum PV (assuming price of land outside the park.(9) Watson (1988) to Costa Rica's Monteverde Cloud forest. £532,000 ($958,000) or $8ha. uniquely in forest protection. payments for 20 years
Average visitor valuation $35 (1988), and discounted at 5%) (7) On the basis of local(10) Kramer et al. producing a present value for trips (5) (6) Valuing Carbon (3) Value of debt-for-nature swaps $60,141 or $6/ha over medicinal plant harvesting only,(1992) assuming constant flows of $2.5m or sequestration; crediting standing may provide an estimation of a 10,000 ha of park. the implied ratio of 1.04
extrapolating for foreign visitors, forest with damage avoided from WTP, reflecting a non-use value.(II) Guttierez and $12.5m. This gives a value per hectare adverse climate change: $1.2b- Varying implicit valuation of (9) Determination of marketPearce (1992) in the reserve of $1,250 relative to the $3.9b/year, depending on different sites is reflected in the prices in this study is uncertain
market price of local non-reserve land assumptions of: i) Damage estimate price paid by conservation bodies (ie world or local) implied ratio(12) Pinedo-Vasquez of $30-$100/ha. per tonne carbon estimated range involved. Some swap transactions 11.3et al. (1992) $5-13 tonne. ii) amount released, have aimed to preserve tropical
(7) Sustainable harvesting of medicinal itself dependant on assumptions of forest ecosystems,(see Appendix 3). (3) 1.07 total project ratio or(13) Solorzano and plants in Belize (local market values per hectare sequestration and annual 1.94 from the perspective ofGuerrero (1988) alone) NPV $3,327per ha compared to deforestation rates. (10) Foreign visitor's WTP for the Cameroon when indirect project
$3,184 from plantation fo)restry with creation of the Mantadia National adjustments are included. These(14) Schneider (1992) rotation felling. (8)(14) Carbon storage $1,300- Park (1991). Bids ranged $75-$1 18 include figures for project
5,700/ha/year p.a., with sums being additional to related aid flows and value for(9) Forest production (Malaysia) existing prices paid. Multiplying uncaptured genetic and$2,455/ha compared with $217/ha from (11) Total carbon storage value these sums by the number of annual watershed values.intensive agriculture. Brazilian Amazon $46b foreign visitor s to a neighbouring
park (3,900) resulted in an annual (13) Implied ratio of 2(3) Tourism value from the Korup (13) Rio Macho Preserve, Costa WTP of $292,500-460,000, a PV of$19/ha Rica. Evaluates the replacement cost $3.64m-$5.73m (at 5% and 20
in terms of water services and ener- years) or $364-573/ha (10,00Oha).(10) Annual value of fuelwood to gy generation resulting from reserve These sums might represent useMalagasy households about $39 per conversion to agricultural use. values as tourists were actually inannum the area.

| I Non-use values 1option, quasi-option, Benefit (sustainable use)
Value categorYv Direc!t ui-se Indirect use bequest, existence Total economic value /opportunity cost ratio
Ecosystem Type: (1) NPV per acre ($1990) from the (1) Ground water recharge function Significant option values fom future (7) Bintuni Bay (I) Benefit/cost ratio expressedpreservation of the Hadejia-Jama'are for surrounding areas, potentially tourism, educational and scientific mangrove ecosystem, in terms the relative benefits
Wetlands floodplain, Nigeria measurable by either WTP or using uses. existence values of wetland Irian Jaya. accruing from alternative water
(Floodplains, costs of ground water depletion on wildlife probably high although no NPV of whole system use: $45 per 1,000m3 of water
Coastal wetlands, Agriculture $41 local agriculture-ie a production explicit studies exist. ($1991 discount rate maintained in the floodplain as
Wet meadows, Fishing $15 function approach-as a minimum 7.5%) opposed to 4 cents per 1,000m3
Peatlands) Fuelwood $ 7 benefit approximation. (2) Some non-use values for wildlife $961-$1,495m, of from diverted water.Discounted at 8% (CVM estimates) which direct-use
Sources: Other floodplain benefits: Other important functions: 1990$/annum/person: probably $152-534m. (4) From a similar analysis of thelivestock and grazing This value does not Ichkeul National Park, Tunisia,
(1) Barbier, Adams non-timber forest products Flood Control and Storm Protection brown bear, wolf, account for the high direct-use benefits amounted to
and Kimmage (1991) tourism, recreation, (including hunting), can in theory be approximated wolverine (Norway) 15 cultural value placed on $134 per 1 ,00OM3 compared toeducational and scientific benefits estimating altemative preventative bald eagle (US) 12.4 the bay by the Irarutu negative returns from
(2) Semples et al. (genetic and information value) expenditure or replacement costs for emerald shiner 4.5 tribe (10). diversionary use.
(1986) sea defences and dykes. In Malaysia grizzly bear 18.5(3) Louisiana. WTP PV at 8% ($1990) the cost of rock escarpments to bighom sheep 8.6 Given the difficulty of
(3) Costanza et al. per acre. replace eroded mangrove fringe is whooping crane 1.2 generalizing with respect to
(1989) Commercial fishery $400 typically around $300,000/km blue whale 9.3 alternative uses for wetlandFur trapping $190 ($1990) (I1). The same study quotes bottlenose dolphin 7.0 areas, informative cost-benefit
(4) Thomas et al. Recreation $ 57 a 1987 E.C. estimate of the califomia sea otter 8.1 ratios are difficult to provide.
(1990) Storm protection $2,400 "inherent" value of mangrove Where non-use values haveTotal $3,047 protection to Guyana as $4bn, been inferred from costs of
(5) Bergstrom et al. though there is no indication of how (9) Revealed WTP (CVM) for imposing or agreeing land use
(1990) (5) Louisiana. WTP PV at 8% ($1990) the figure is derived. preservation benefits of blanket bog constraints (the cost of whichper acre area in Scotland (1990) (once and- represent a discounted future
(6) Thibodeau and Recreation $103 Nutrient cycling will normally have for-all payment) PV £164.68/ha benefit stream), the implicit
Ostro (1981) a measurable effect on fishing and (approx. $296.50/ha) implicitly cost-benefit ratio will normally(6) Charles River, Massachusetts agricultural yields (in deltaic areas) representing the discounted future be at least 1, because the
(7) Ruitenbeek (1991) PV (1990$) per acre at 8%. the value of which might also be stream of user and non-user compensatory payment from theRecreation $3400 approximated by replacement benefits. As such the value is recipient's perspective will have
(8) Hamilton and Water supply $80,000 expenditures on nutrients and interpreted as an option value. (See to be at least equal to the
Snedaker (eds.) compensating technologies. Smith [1987]) perceived opportunity cost.(1984) (8) Present Value per acre (at 8%) of
Mangrove systems. Direct use from The value of wildlife habitats and (12) An average annual amount(9) Hanley and Craig fisheries, forestry and recreation. life support functions will be ($343/acre) paid (by the US Fish(1991) Trinidad $15,000 reflected in the value placed on the and Wildfowl Service in 1980) to
Fiji $11,000 continued existence of dependant owners of wetlands in Massachusetts(10) Van Diepen and Puerto Rico $13,000 species, (see under Existence values for preservation easements, can beFiselier (1990) for some estimates) taken to represent a minimum option
Value for the ecosystem in an(11) Fiselier (1990a) (14) Sustainable charcoal production unaltered state. SimiIaLconclusions
from mangrove (Thailand) could be inferred by looking at the(12) Danielson and generates an annual national income average value of managementLeitch (1986) of approx. $22.4m Net profits are agreements negotiated between
nearly $4,000/ha for forests with conservation bodies and land owners(13) Tumer and average productivity of 230m3/ha. in the UK. Such an alternative costBrooke (1988) approach has revealed a value of
£70/ha/per annum for coastal marsh(14) Mcneely and and.Dobias (1991)
-J
Non-use valueoption, quasi-option, Benefit (sustainable use)
Value category: Direct use Indirect-use bequest, existence Total economic value /opportunity cost ratio
800
Ecosystem Type: (I) Wildlife tourism. Viewing value of Indirect benefits from sustainable (3) Beneficial use project for Kbao (2) Ratio of wildlife tourismElephants in Kenya $25m/per annum. wildlife management: Yai National Park surveyed user revenue per ha ($40) to income
Rangelands WTP for continued existence of from extensive pastoralism(semi-arid) and The same study gives an indication of Distribution of benejits to local elephants at approx $7. Under ($0.80) 50. This ratio haswilderness areas the extent of revenue forgone through communities as a result of certain assumptions of population probably increased significantly
sub-optimal park entrance pricing. A sustainable wildlife management and park use, the option and due to increasing value added inSources: rough WTP survey revealed a potential schemes. existence value of Khao Yai to Thai tourism.
consumer surplus as high as $25m/per residents (for elephant preservation)(1) Brown and Henry annum (a sum almost 10 times the value (7) The Nyaminyami Wildlife may be as high as $4.7miyear . (4) Ratio of value of i!lif(1989) J of poachcd ivory exports and at least a Management Trust, Zimbabwe production (Z$4.20/ha) to Cattle
10% increase in actual expenditures). channeled approx Z$198,000 (1989) The extent of existence values might Ranching (Z$3.58/ha in(2) Westem and Since people were only asked their of wildlife revenues into local be approximated from the value of Zimbabwe 1 .17. CalculationThresher (1973) WTP to preserve elephants, consumer projects for health, housing, vicarious tourisnthe consumption based on economic rates of
surplus for all wildlife viewing is education and recreation. In addition of books, films and TV programmes return (as opposed to financial(3) Dobias (1988) presumably higher. the project was able to compensate -particularly in developed rates), and accounting for the
local farmers for any damage countries, or from observed relative environmental costs(4) Child (4) Wildlift utilization: Non-consumptive incurred and offer cropped wildlife charitable donations to organizations would in certain areas of the(1984)(1990) game viewing, lightly consumptive products for sale locally at involved in wildlife preservation. country produce ratios of
safari hunting and live animal trade, subsidiized prices. More crudely we might extrapolate between 2 and 5.(5) Coulson (1991) consumptive meat and hide production. on the basis of WTP information of
Direct and indirect provision of visitors to wildlife sites in substitute (8) Provides PVs for retums(6) Dept. of National Zimbabwe: illustrative examples: employment. countries like Kenya. from game viewing combinedParks, Zimbabwe with some form of elephant(1991) Non-consumptive use: Direct and Improvements in local infrastructure In 1990 56% of ovemight visitors to cropping and for viewing alone
indirect income accruing to the and potential increases in land and wildlife areas in Zimbabwe were in Botswana (1989). The ratio of(7) Jansen (1990) Matusadona National Park (1991) property values. foreign, of which 26% originated in the former to the latter range
US$10.3m, 66% of which foreign Europe or North America (approx from 2.63 to 1.8 (depending on(8) Barnes (1990) currency (5). Significant saving in the hidden costs 151,000 visitors). Assuming 50% of whether a 5 or 15 year horizon is
of land degradation and soil erosion these visitors reveal a similar WTP considered) demonstrating the(9) Imber (1991) Safari hunting: Value for foreign visitors arising from agricultural production in addition to entry fees (in much the earning potential of consumptive
in 1990 was US$9m of which, trophies in marginal areas. same way as in (1) i.e. a $100 permit uses. Comparison with theaccounted for US$4m (6). for elephant preservation), extra economic rate of return from
The role of elephants as keystone revenue generated might amount to cattle production on a perConsumptive value Zimbabwe estimates species diversifying savannah and $7.5m per annum. hectare basis could show ratiosit makes $4.7m/annum from the sale of forest ecosystems. similar to those in Zimbabwe.elephant goods and services, a return of (9) CV study preserve the Kakadu$75/km2 over approx 74,OOOkm2 of Value added retained in the host Conservation Zone (from miningelephant habitat. country consists of net revenues development) revealed that
accruing to: local airlines, tour Australians were willing to payThe proportion attributed to sale of operators, hotels, transport and A$124/annum for ten years to avoidgoods has fallen significantly since the cottage industries, a major impact scenario and A$53 toimposition of an intemational ban on avoid the minor scenario.ivory sales. Extrapolated to the whole population
produced a total WTP range ofA$650m-$1,520m, or a PV at 5% ofbetween A$1 r/ha and A$2.3m/haover 5,000 ha.
Both cultural and bequest values arelikely to be significant in wildlifevaluation although as yet few WTPstudies reveal specific motivations.
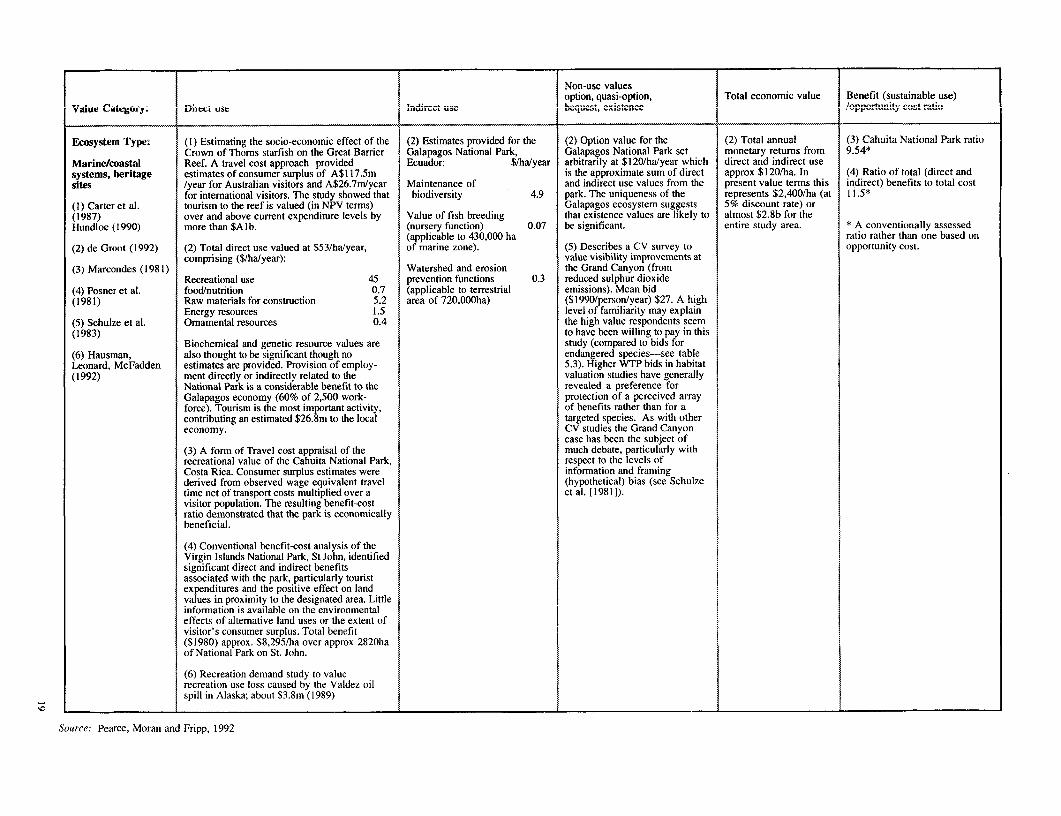
l l | ~~~~~~~~~~~~~ ~ ~ ~~~Non-use values lloption, quasi-option, Total economic value Benefit (sustainable use)
Value Categu9 '. Direct use Ir.direc; usc bequest, existence !opportunP.y cost ratio
Ecosystem Type: (1) Estimating the socio-economic effect of the (2) Estimates provided for the (2) Option value for the (2) Total annual (3) Cahuita National Park ratioCrown of Thoms starfish on the Great Barrier Galapagos National Park, Galapagos National Park set monetary returns from 9.54*
Marine/coastal Reef. A travel cost approach provided Ecuador: $/ha/year arbitrarily at $120/ha/year which direct and indirect usesystems, heritage estimates of consumer surplus of A$117.5m is the approximate sum of direct approx $120/ha. In (4) Ratio of total (direct andsites /year for Australian visitors and A$26.7m/year Maintenance of and indirect use values from the present value terms this indirect) benefits to total cost
for international visitors. The study showed that biodiversity 4.9 park. The uniqueness of the represents $2,400/ha (at 11.5*(1) Carter et al. tourism to the reef is valued (in NPV terms) Galapagos ecosystem suggests 5% discount rate) or(1987) over and above current expenditure levels by Value of fish breeding that existence values are likely to almost $2.8b for theHundloe (1990) more than $Alb. (nursery function) 0.07 be significant. entire study area. * A conventionally assessed
(applicable to 430,000 ha ratio rather than one based on(2) de Groot (1992) (2) Total direct use valued at $53/ha/year, of marine zone). (5) Describes a CV survey to opportunity cost.
comprising ($/ha/year): value visibility improvements at(3) Marcondes (1981) Watershed and erosion the Grand Canyon (from
Recreational use 45 prevention functions 0.3 reduced sulphur dioxide(4) Posner et al. food/nutrition 0.7 (applicable to terrestrial emissions). Mean bid(1981) Raw materials for construction 5.2 area of 720,000ha) ($1990/person/year) $27. A high
Energy resources 1.5 level of familiarity may explain(5) Schulze et al. Ornamental resources 0.4 the high value respondents seem(1983) to have been willing to pay in this
Biochemical and genetic resource values are study (compared to bids for(6) Hausman, also thought to be significant though no endangered species-see tableLeonard, McFadden estimates are provided. Provision of employ- 5.3). Higher WTP bids in habitat(1992) ment directly or indirectly related to the valuation studies have generally
National Park is a considerable benefit to the revealed a preference forGalapagos economy (60% of 2,500 work- protection of a perceived arrayforce). Tourism is the most important activity, of benefits rather than for acontributing an estimated $26.8m to the local targeted species. As with othereconomy. CV studies the Grand Canyon
case has been the subject of(3) A form of Travel cost appraisal of the much debate, particularly withrecreational value of the Cahuita National Park, respect to the levels ofCosta Rica. Consumer surplus estimates were information and framingderived from observed wage equivalent travel (hypothetical) bias (see Schulzetime net of transport costs multiplied over a et al. [1981]).visitor population. The resulting benefit-costratio demonstrated that the park is economicallybeneficial.
(4) Conventional benefit-cost analysis of theVirgin Islands National Park, St John, identifiedsignificant direct and indirect benefitsassociated with the park, particularly touristexpenditures and the positive effect on landvalues in proximity to the designated area. Littleinformation is available on the environmentaleffects of altemative land uses or the extent ofvisitor's consumer surplus. Total benefit($1980) approx. $8,295/ha over approx 2820haof National Park on St. John.
(6) Recreation demand study to valuerecreation use loss caused by the Valdez oilspill in Alaska; about $3.8m (1989)
Source: Pearce, Moran and Fripp, 1992

Table 2.3 Preference valuations for endangered species and prized habitats
(US 1990 $ p.a. per person)
Species
Norway: Brown bear, wolf and wolverine 15.0
USA: Bald eagle 12.4Emerald shiner 4.5Grizzly bear 18.5Bighom sheep 8.6Whooping crane 1.2Blue whale 9.3Bottlenose dolphin 7.0Califonia sea otter 8.1Northem elephant seal 8.1Humpback whales' 40-48 (without information)
49-64 (with information)
Other kabitat
USA: Grand Canyon (visibility) 27.0
Colorado wilderness 9.3-21.2Australia:
Nadgee NatureReserve NSW 28.1Kakadu Conservation 40.0 (minor damage)Zone, NT2 93.0 (major damage)
UK: Nature reserves3 40.0 ('experts' only)
Norway: Conservation of 59.0-107.0rivers againsthydroelectricdevelopment
Notes: (1) respondents divided into two groups one of which was given video information; (2) two scenarios ofmining development damage were given to respondents; (3) survey of informed individuals only.
Sources: Norway--Dahle et al. (1987) (in Norwegian), Hervik et al. (1986); USA-Boyle and Bishop (1985),Brookshire et al. (1983), Stoll and Johnson (1984), Hageman (1985), Samples et al. (1986), Schulze et al.(1983), Walsh et al. (1984); Australia-4mber et aL (1991), Bennett (1982); United Kingdom--Willis andJ.Benson (1988).
Implicit global willingness to pay in education and training as well. Moreover, eachinternational transfers hectare of land does not secure the same degree ofNumerous debt-for-nature swaps have been agreed. "protection" and the same area may be covered byThe table below sets out the available information different swaps. We have also arbitrarily chosen aand computes the implicit prices. It is not possible ten-year horizon in order to compute present val-to be precise with respect to the implicit prices since ues, whereas the swaps in practice have variablethe swaps tend to cover not just protected areas but levels of annual commitment.
20

Ignoring the outlier (Monteverde Cloud Forest, Costa costs of protected land, although if these implicit pricesRica) the range of implicit values is from around I cent mean anything, they are capturing only part of the richper hectare to just over $4 per hectare. Ruitenbeek world's existence values for these assets. That is, the(1992) secures a range of some 18 cents to $11 per values reflect only part of the total economiic value.hectare (ignoring Monteverde), but he has severaldiflerent areas for some of the swaps, and also com- Finding a benchmark from such an analysis is haz-putes a present value of outlays for the swaps. But ardous, but something of the order of $5 per hectareeither range is very small compared to the opportunity may be appropriate.
Table 2.4 Implicit global willingness to pay (WTP) in international transfers:,debt-for-nature swaps
Payment Area WTPlha NotesCountry Year (1990$) m.ha PV 1990$
Bolivia 8/87 112,000 12.00 0.01 I
Ecuador 12/87 354,000 } 22.00 0.06 24/89 1,068,750)}
Costa Rica2/88 918,000 1.15 0.80 37/88 5,000,000
4 parks 1/89 784,0004/89 3,500,000 0.81 4.32 4
La Amistad 3/90 1,953,473 1.40 1.40 5Monteverde 1/91 360,000 0.014 25.70 6
Dominican Republic 3/90 116,400
Guatemala 10/91 75,000
Jamaica 11/91 300,000
Philippines 1/89 200,000 } 9.86 0.06 78/90 438,750 }2/92 5,000,000
Madagascar 7/89 950,000 0.47 2.95 88/90 445,891 }1/91 59,377 9
Mexico 2/91 180,000
Nigeria 7/91 64,788Zambia 8/89 454,000 10
Poland 1/90 11,500 unrelated to area purchase
Nigeria 1989 1,060,000 1.84 0.58 11
Notes:1. A discount rate of 6% is used, together with a time horizon of 10 years. The sum of discountfactorsfor 10 years isthen 7.36.
21

I. The Beni "parlc" is 334,000 acres and the storage. All forests store carbon so that, if clearedsurrounding buffer zones are some 3.7 mil- for agriculture, there will be a release of CO2 whichlion acres, making 1.63 million hectares (ha.) will contribute to the accelerated greenhouse effectin all (I hectare = 2.47 acres). 1.63 x 7.36 = 12 and therefore to global warming. In order to derivemillion hectares in present value (PV) terms. a value for the "carbon credit" that should be as-
2. Covers six areas: Cayembe Coca Reserve at cribed to a tropical forest, we need to know two403,000 ha.; Cotacachi-Cayapas at 204,000 things: the net carbon released when forests areha.; Sangay National Park at 370,000 ha.; converted to other uses, and the economic value ofPodocarpus National Park at 146,280 ha.; one tonne of carbon released to the atmosphere.Cuyabeno Wildlife Reserve at 254,760 ha.;Yasuni National Park-no area stated; Gal- Carbon will be released at different rates accordingapagos National Park at 691,2000 ha.; Paso- to the method of clearance and subsequent land use.choa near Quitci at 800 ha. The total without With burning there will be an immediate release ofYasuni is therefore 2.07 m.ha. Inspection of CO2into the atmosphere, and some of the remainingmaps suggests that Yasuni is about three carbon will be locked in ash and charcoal which istimes the area of Sangay, say 1 m.ha. This resistant to decay. The slash not converted by firewould make the grand total some 3 m.ha. The into CO2 or charcoal and ash decays over time,PV of this over ten years is then 22 m.ha. This releasing most of its carbon to the atmosphereis more than twice the comparable figure within ten to twenty years. Studies of tropical for-quoted in Ruitenbeek (1992). ests indicate that significant amounts of cleared
3. Covers Corvocado at 41,788 ha.; Guanacaste vegetation become lumber, slash, charcoal and ash.at 110,000 ha.; Monteverde Cloud Forest at The proportion differs for closed and open forests;3,600 ha., to give 156,600 ha. in all, or a PV the smaller stature and drier climate of open forestsof land area of 1.15 m.ha. Initially, $5.4 result in the combustion of a higher proportion ofmillion at face value, purchased for $912,000, the vegetation.revalued here to 1990 prices.
4. Guanacaste at 110,000 ha., to give a PV of If tropical forested land is converted to pasture or0.81 m.ha. permanent agriculture, then the amount of carbon
5. LaAmistadat 1'90,000ha.,togiveaPVof 1.4 stored in secondary vegetation is equivalent to them.ha. carbon content of the biomass of crops planted, or
6. Monteverde Cloud Forest at 2023 ha. x 7.36 the grass grown on the pasture. If a secondary forest= 14,900 ha. is allowed to grow, then carbon will accumulate,
7. Area "protected" is 5,753 ha. of St. Paul andmaximumbiomassdensitywillbeattainedafterSubterranean River National Park, and 1.33 a relatively short time (forty-five years, accordingm. ha. of El Nido National Marine Park. This to German Bundestag, 1990). Table 2.5 summariesgives a PV of land of 9.86 m.ha. the carbon content of soils and biomass in the
8. Focus on Adringitra and Marojejy reserves at relevant land uses.31,160 ha. and 60,150 ha. respectively. Thisgives a PV of 474,000 ha. These data can be used to calculate the total changes
9. Covers four reserve areas: Zahamena, Mi- in biomass and soil carbon as a result of land-usedongy-Sud, Manongarivo and Namoroko. changes, as shown in Table 2.6. This table illus-
10. CoversKafueFlatsandBangweuluwetlands. trates the net carbon storage effects of land-use11. Oban Park, protecting 250,000 ha. or 1.84 m. conversion from tropical forests-closed primary,
ha. in PV terms. See Ruitenbeek (1992). closed secondary, or open forests-to shifting cul-tivation, permanent agriculture, or pasture. The
Carbon storage negative figures represent emissions of carbon, forBiodiversity conservatilon may often be an inciden- example, conversion from closed primary forest total effect, or "joint product" of some other environ- shifting agriculture results in a net loss of 194 tC/ha.mentally beneficial activity. An example is carbon The greatest loss of carbon involves change of land
22
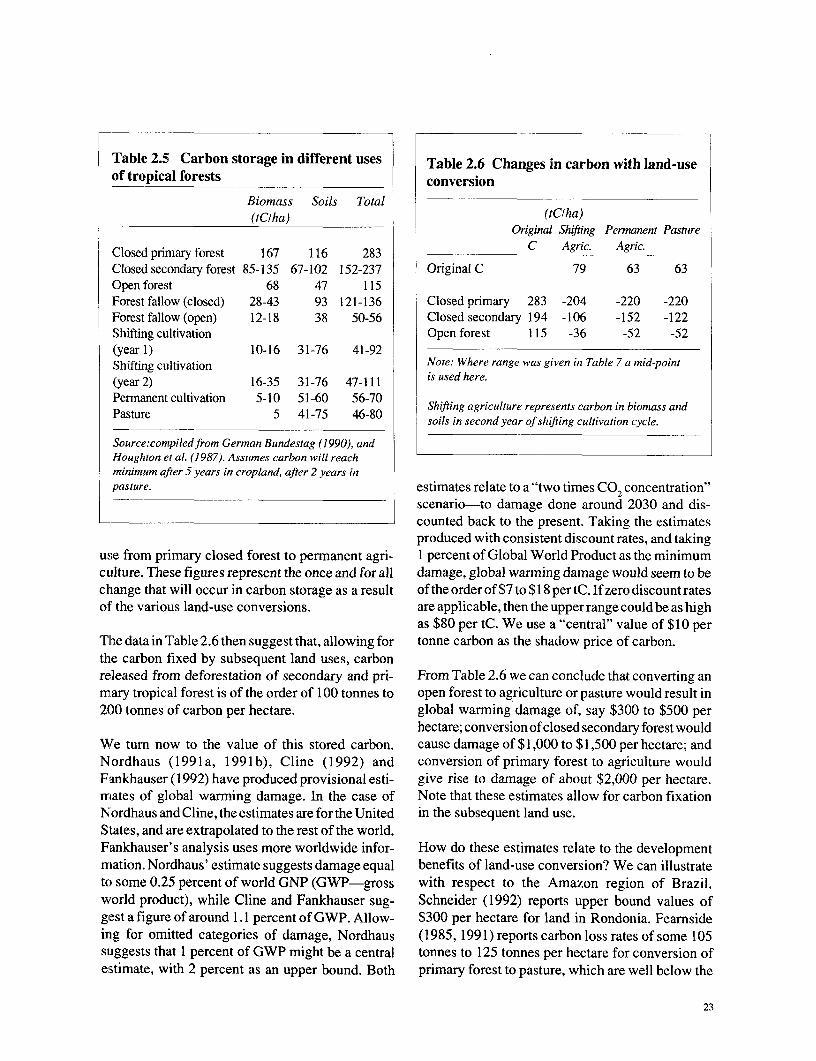
Table 2.5 Carbon storage in different uses Table 2.6 Changes in carbon with land-useof tropical forests conversion
Biomass Soils Total(tClha) (tClha)
Original Shifting Pennanent Pasture
Closed primary forest 167 116 283 C Agric. Agric.Closed secondary forest 85-135 67-102 152-237 Oniginal C 79 63 63Open forest 68 47 115Forest fallow (closed) 28-43 93 121-136 Closed primary 283 -204 -220 -220Forest fallow (open) 12-18 38 50-56 Closed secondary 194 -106 -152 -122Shifting cultivation Open forest 115 -36 -52 -52(year 1) 10-16 31-76 41-92Shifting cultivation Note: Where range was given in Table 7 a mid-point(year 2) 16-35 31-76 47-111 is used here.Permanent cultivation 5-10 51-60 56-70 . .Pasture 5 41-75 46-80 EShiftng agriculture represents carbon in biomass andsoils in second year of shifting cultivation cycle.
Source:compiledfrom German Bundestag (1990), andHoughton et al. (1987). Assumes carbon will reachminimum after 5 years in cropland, after 2 years inpasture. estimates relate to a "two times CO2 concentration"
I scenario-to damage done around 2030 and dis-counted back to the present. Taking the estimatesproduced with consistent discount rates, and taking
use from primary closed forest to permanent agri- 1 percent of Global World Product as the minimumculture. These figures represent the once and for all damage, global warming damage would seem to bechange that will occur in carbon storage as a result of the order of $7 to $18 per tC. If zero discountratesof the various land-use conversions. are applicable, then the upper range could be as high
as $80 per tC. We use a "central" value of $10 perThe data in Table 2.6 then suggest that, allowing for tonne carbon as the shadow price of carbon.the carbon fixed by subsequent land uses, carbonreleased from deforestation of secondary and pri- From Table 2.6 we can conclude that converting anmary tropical forest is of the order of 100 tonnes to open forest to agriculture or pasture would result in200 tonnes of carbon per hectare. global warming damage of, say $300 to $500 per
hectare; conversion of closed secondary forest wouldWe turn now to the value of this stored carbon. cause damage of $1,000 to $1,500 per hectare; andNordhaus (199Ia, 1991b), Cline (1992) and conversion of primary forest to agriculture wouldFankhauser (1992) have produced provisional esti- give rise to damage of about $2,000 per hectare.mates of global warming damage. In the case of Note that these estimates allow for carbon fixationNordhaus and Cline, the estimates are for the United in the subsequent land use.States, and are extrapolated to the rest of the world.Fankhauser's analysis uses more worldwide infor- How do these estimates relate to the developmentmation. Nordhaus' estimate suggests damage equal benefits of land-use conversion? We can illustrateto some 0.25 percent of world GNP (GWP-gross with respect to the Amazon region of Brazil.world product), while Cline and Fankhauser sug- Schneider (1992) reports upper bound values ofgest a figure of around 1.1 percent of GWP. Allow- $300 per hectare for land in Rondonia. FearnsideiTlg for omitted categories of damage, Nordhaus (1985, 1991) reports carbon loss rates of some 105suggests that 1 percent of GWP might be a central tonnes to 125 tonnes per hectare for conversion ofestimate, with 2 percent as an upper bound. Both primary forest to pasture, which are well below the
23
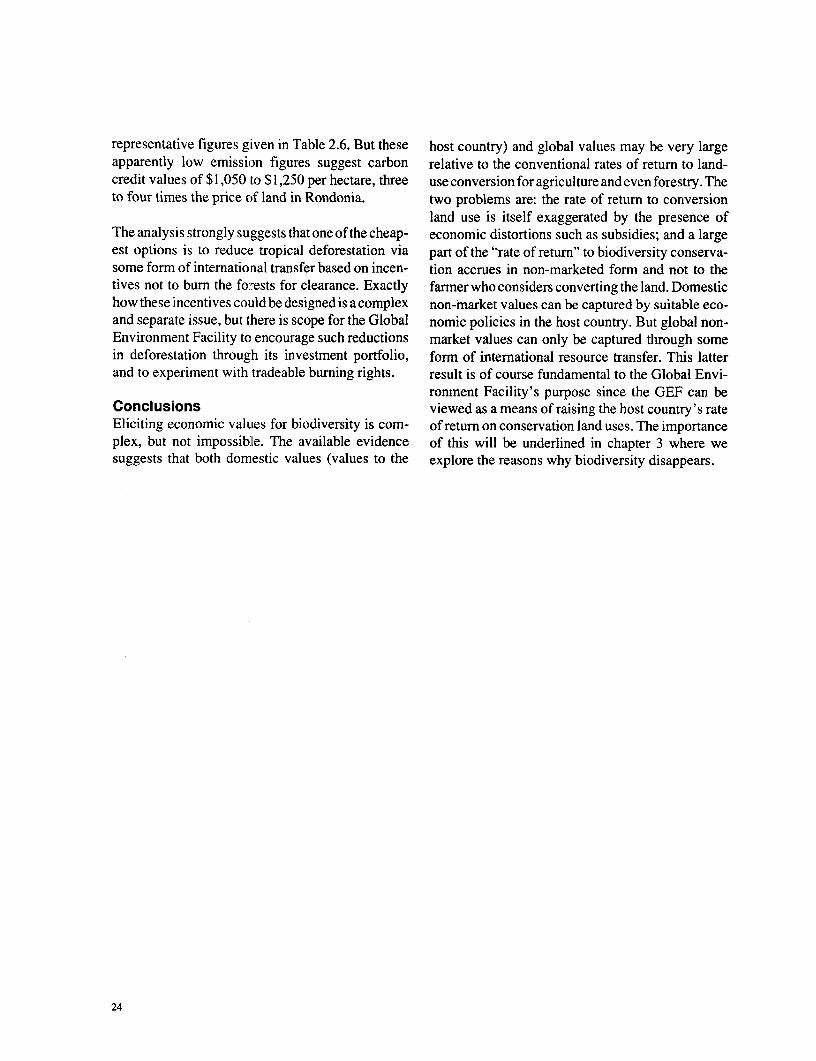
representative figures given in Table 2.6. But these host country) and global values may be very largeapparently low emission figures suggest carbon relative to the conventional rates of return to land-credit values of $1,050 to $1,250 per hectare, three use conversion for agriculture and even forestry. Theto four times the price of land in Rondonia. two problems are: the rate of return to conversion
land use is itself exaggerated by the presence ofThe analysis strongly suggests that one of the cheap- economic distortions such as subsidies; and a largeest options is to reduce tropical deforestation via part of the "rate of return" to biodiversity conserva-some form of international transfer based on incen- tion accrues in non-marketed form and not to thetives not to burn the forests for clearance. Exactly farmer who considers converting the land. Domestichow these incentives could be designed is a complex non-market values can be captured by suitable eco-and separate issue, but there is scope for the Global nomic policies in the host country. But global non-Environment Facility to encourage such reductions market values can only be captured through somein deforestation through its investment portfolio, form of international resource transfer. This latterand to experiment with tradeable burning rights. result is of course fundamental to the Global Envi-
ronment Facility's purpose since the GEF can beConclusions viewed as a means of raising the host country's rateEliciting economic values for biodiversity is com- of return on conservation land uses. The importanceplex, but not impossible. The available evidence of this will be underlined in chapter 3 where wesuggests that both domestic values (values to the explore the reasons why biodiversity disappears.
24

The Economic Causes3 Dof Biodiversity Erosion
In this chapter we focus on the economic causes of Over-exploitation and extinctionbiodiversity loss. By economic cause we mean In all of these cases it was over-exploitation that wasfactors at work in the way that modem economies the cause of the species' decline, since fishing andare organized and, perhaps more fundamentally, hunting pressures were occurring, with regard tofactors in the very evolution of modem economies. many oceanic species, at levels that were unsustain-The basic proposition is that it is in the workings of able. Therefore the initial focus of the economicthe economy that we will find most of the factors study of extinctions concerned the deleterious im-explaining the decline not just in biodiversity, but in pacts of human hunting and fishing on variousenvironmental capital generally, whether it is the resources (Gordon 1954).ozone layer, the carbon cycle, tropical forests orcoastal waters. Looking at economic causes does The study of over-exploitation was the first attemptnot mean we neglect more general factors such as at an economic analysis of the interface betweenpopulation growth, for population growth is itself human society and the remainder of the biologicalifrequently to be explained in economic terms. world. This resulted in the development of so-called
bioeconomic models: models analyzing the interac-]First it is necessary to look at the way economists tion between human harvesting pressures and bio-have traditionally tried to explain the extinction logical resource regeneration. The questionsprocess, or what we will call biodiversity erosion. addressed in these models concerned the character-
istics of a resource and resource management sys-lExtinction in the context of marine tem that rendered them incompatible, so that theresources resource was incapable of sustaining the systemic'The economic analysis of extinction was initially pressures placed upon it by human society.developed in the context of marine resources. Thiswas the case because many of the earliest examples Economic analysis gave a short and simple answerof modem species' endangerment occurred within to these questions. In the context of marine resourc-that context. The Pacific fur seals suffered near es, exploitation of a resource was likely to beextinction in the late nineteenth century due to over- unsustainable if:exploitation. The blue whale experienced a severedecline in the same period. During the twentieth (a) The ratio of the price of the harvested re-century the analysis focused on the decline of var- source to the cost of harvesting was "high;"ious fisheries, as the advance of technology made it andpossible to overfish entire stocks of various oceanic (b) The natural growth rate of the resource wasspecies. low" (Clark 1976, 1990).
25

These two conditions determined the ultimate im- system of incentives based solely upon first appro-pact of human harvesting pressures on a species. priation, and this implies that no individual harvest-The intuition behind these conditions is simple. er has any incentive to discontinue harvesting theCondition (a) determines the incentives for human resource, because any of the resource that oneharvesting; a species with a high price relative to the harvester leaves behind will simply be captured bycost of harvest is potentially very profitable, and another.therefore attracts substantial harvesting pressure.Condition (b) determines the capability of a species In the context of an open access regime, extinctionto sustain these pressures; a species with a low is a possibility if there are incentives to harvest thenatural growth rate cannot regenerate itself at a rate resource which exceed its capacity to replace itself.sufficient to withstand substantial harvesting This is precisely what the bioeconomic models ofpressure. extinction (in the context of marine resources) have
demonstrated: open access regimes are a primaryTherefore the economic analysis of extinction in contributing force to extinctions.the context of marine resources is quite straightfor-ward; the existence of financial incentives for Extinction in the context of terrestrialsignificant harvesting pressures applied to slow- resourcesgrowing resources implies unsustainability. This As the elephant and rhinoceros examples suggest-explains the decline of such species as the great ed, it is tempting to apply the same bioeconomicwhale. Its high values as the provider of important models to land-based resources. But the economicoil products (in the nineteenth century) combined analysis of extinction in the context of terrestrialwith its naturally slow growth rate meant that pop- resources is in fact very different from the analysisulation declines were the likely result of the uncon- regarding marine resources. This is attributable totrolled harvest, and this is the pattern that was in fact two fundamental differences, one on the societalobserved. Much the same could be thought to apply side and one on the biological side of the bioeco-to land-based resources such as the African ele- nomic model. These two features are:phant and the rhinoceros. Both are comparativelyeasy to hunt, especially with the advent of high * The existence of nation states in the terrestrialvelocity rifles (low cost), and both have high value contextproducts (ivory and rhinoceros horn). We will soon * Competition for land-based "niches."discuss how far this transfer of extinction econom-ics from sea to land is justified. "Optimal" open access regimes
First, there is no reason why the assumption of openOpen access as a cause of over-exploitation access management should be carried over from theIn the marine context, however, the emphasis must marine context to be applied to terrestrial resources,be placed on the uncontrolled nature of all marine even to wildlife species. With regard to oceanicharvesting activity. Over-exploitation has often resources, the choice of the management systemoccurred in the context of the oceans precisely was not an option, because these resources lay in thebecause the harvesting activities in this environ- international domain. However, on land there is ament have been so pooily controlled. Until very nation that has the designated responsibility forrecently, the oceans have been non-sovereign terri- making management decisions with regard to thetory, and their resources have been subject to appro- resources associated with any piece of territory; thispriation on a first-come-first-serve basis (Swanson is the economic meaning to be given to the legal1991). concept of national territorial sovereignty, meaning
that there are "owner-states."This form of resource management is known ineconomics as an open access regime. No one owns If a terrestrial resource is managed by an openthe resource and no one can effectively be prevented access form of regime, this is because some owner-from making use of it. Such a regime installs a state has chosen to apply this manner of manage-
26

ment to this resource. An owner-state may in fact crucial difference between the different forms ofchoose to apply a management regime selected management regimes listed above is the aggregatefrom a wide range of different forms of institutions amount of societal investment (by the group ofto terrestrial resource management. For example, harvesters) that results. For example, as describedthere are various forms of common resource man- above, an open access regime creates incentives notagement (such as communally managed pastures to invest in the resources subjected to it; the harvest-and forests), private property rights (exclusive to a ers of the resource will not view the resources assingle individual), and national ownership (such as being worthy of investment because others willnational parks and forests). Any one of these capture mostof thebenefits of theirinvestments. Onresource management regimes may be the "best" in the other hand, if the state were to institute anothera given context and locality. institution (such as a property rights regime), then
the harvesters would see some individual benefit toParadoxically, even an open access regime can be investing in the resources. In either case, the owner-an optimal choice (from an owner-state's perspec- state determines the ground-level investment in-tive), even though it will always result in the ineffi- centives by its choice of management institutionscient over-exploitation of the resources subjected to for a particular region or resource.it. This is because there are two potentially conflict-ing objectives at issue: the objective of maximizing Despite the fact that it has the power to choose thethe efficiency of the management of a particular "efficient" management regime, it is sometimesresource (or group of resources), versus the objec- optimal (from the state's perspective) to allow opentive of maximizing the efficiency of the manage- access regimes to continue in place. This is becausement of the totality of a society's resources (natural, another important difference between these differ-human and man-made). The efficient pursuit of the ent management regimes (such as open access.latter objective will imply the necessity of some common property, private property and nationaltrade-offs in regard to the pursuit of the former. property) is the differential amounts of state re-Then it may be the case that inefficient forms of sources that they require for their implementation.resource management are optimal from the owner- In general, the creation and implementation of statestate's perspective. institutions for protecting rights and monitoring
production are costly affairs. The one exception isIn order to explain this concept clearly, it is neces- that the institution of an open access regime costssary to understand that all state-level decisions the owner-state nothing (in the form of state spend-concerning the regulation of natural resources are ing requirements); other forms of state managementinvestment decisions, and the state is deciding im- regimes will require more significant commitmentsplicitly whether the particular resource or region is of state funding.worthy of an allocation of scarce societal invest-ment funds. Efficient management of a given bio- A zero-level of state spending with regard to thelogical resource will require the regulation of management of a particular resource or habitat mayharvesting activities with regard to a biological be optimal from a state's more general perspectiveresource, in order to allow some amount of the because of the competing claims for national invest-existing stock of a species to remain for the purpose ments within a developing state. In short, it cannotof generating future growth. be assumed that full and effective institutions will
be warranted for the protection and production of allThis capacity for growth is the reason that econo- existing natural resources. The state must select itsmists refer to a natural resource as natural capital. A investments carefully, and allocate its scarce fundsnatural resource is capable of generating a return to those resources and regions that it believes willjust as with investments in any other form of asset. use them most productively.Investing in management regimes for a particularnatural resource is the state's means for inducing Therefore, although an open access regime is theinvestments in that resource. In other words, the embodiment of an inefficient resource management
27

regime, it will be the optimal choice for many states ture includes both crops and livestock. Table 3.1in the context of severe scarcity of investment funds illustrates the changes in land area in selected coun-for institutional development. This implies that the tries. The table shows clearly that major increasesfundamental cause of many land-based extinctions, have occurred in the areas of cropland in Southespecially those resulting from over-exploitation, is America, Oceania and Africa, and significant in-not the existence of open access institutions. In- creases in pasture-land have occurred in Central andstead, the fundamental cause is the existence of South America. These broad aggregates concealincentives in these developing states not to invest in some major changes which are shown for selectedthe necessary management institutions in some re- separate countries.gions of the country or in regard to some resources.
With regard to these various forms of competitionNiche competition for land use, the danger to species is that they will beThe second important difference between oceanic undercut rather than over-exploited. That is, theseand terrestrial resources is the extent of the niche are resources that will lose their capacity to surviveavailable to the species. With regard to oceanic not because humans place too much pressure onspecies, the size of the niche is exogenously deter- their stocks but because humans convert their hab-mined; that is, the niche available to a species is itats to other uses. Part of the reason that suchdetermined by the carrying capacity of its natural conversions take place is because the economicenvironment. The species will be able to expand to value of biodiversity is nottransparent in the marketthe limits of its niche, as determined by its capacity place. This may be because there is insufficientto compete with other species (other fish, sea mam-mals, and so on) for the reSDurces within that envi- 0
ronment. Table 3.1 Rate of conversion of land (late1970s to late 1980s)
For terrestrial species, the arnount of basic resources (percentage rate of increase)
available to sustain a given species is no longerdetermined by a natural equilibrium of this sort, but Region Cropland Pasture Forestby human choice. That is, the important difference Africa 4.4 -0.5 -3.6between marine and terrestrial resources is the num- N and C America 1.1 3.1 1.0ber of competing uses that humans have for their S America 10.9 4.1 -4.6respective habitats. The main avenue by which hu- Asia 0.8 -0.3 -5.3mans interact with oceanic species is through har- Europe -1.3 -4.0 1.1vesting and pollution; however, with regard to ex-USSR -0.2 -0.6 1.7terrestrial species, the nature of the interaction is Oceania 11.6 -3.1 -0.6much more multi-faceted.
Country
A terrestrial species will compete with humans (for B-Faso 27.5 0.0 -8.2the use of its habitat) in a multitude of different CBte d'lvoire 20.8 0.0 24,1ways. Humans may consi(der making use of the Uganda 20.0 0.0 -8.1habitat for purposes of agricultural production, and Brazil 17.1 6.3 -4.2therefore the naturally-occurring species will have Paraguay 46.7 32.6 -27.7to be competitive with these in order to retain their Suriname 53.4 11.1 -0.3lands. Alternatively, humans may consider using theland for purposes completely unrelated to the bio- Bangladesh 1.5 0.0 -10.4sphere (such as residences or factories), and then the Malaysia 2.5 0.0 -11.0species must compete with these land uses as well. Pakistan 3.3 0.0 17.3
The main habitat-displacing activity in the develop- Source: World Resources Institute (1992)
ing world is agricultural expansion, where agricul-
28

information about the benefits of biodiversity con- Niche competition: statistical testsservation (see chapter 2) or because there has been If niche competition contributes to biodiversity lossunder-investment in conservation (see above). we would expect this to be a testable proposition.
Table 3.2 Econometric studies of deforestation
A minus sign means that an increase in the variable leads to a decrease in deforestation. A plus sign means an increaseleads to an increase in deforestation. Blank entries mean either not statistically significant or not testedfor.
Deforestation Rate ofsignificantly population Population Agricultural Internationalrelated to growth density Income productivity indebtedness
Allen and +Barnes 1985
Burgess 1992 +
Burgess 1991 a) - + +b) +
Capistrano a) +and Kiker b) +1990 c) + +
Constantino and +Ingram 1991
Kahn andMcDonald 1990 +
Katila 1992 + +
Kummer andSham 1991 +
Lugo, Schmidtand Braun 1981 +
Panayotou and +Sungsuwan 1989
Palo, Mery +and Salmi 1987
Perrings 1992 a) + + + +b) +
Reis and +Guzman 1992
Rudel 1989 + +
Strafik 1992
Southgate 1991 +
Southgate, Sierra +and Brown 1989
29

Table 3.2 reports the results of various analyses of disinvestment, management resources diversion,the statistical relationship between the destruction and base resource conversion.of habitat (a proxy for biodiversity loss), and demo-graphic and economic variables such as population Stock disinvestmentgrowth, population density, per capita GNP and As in the bioeconomic model applied to marineinternational indebtedness. Appendix I shows the species, these are resources with high price/costresults in more detail. ratios but low growth. In that case, there are incen-
tives to harvest the entirety of the resource (for itsThe studies surveyed in Table 3.2 suggest, first, high value) and invest the funds in other assets (forthat there is no absolutely conclusive link between their greater growth rates) (Clark 1973).any of the selected variables and deforestation.However, cautious conclusions might be: An example of this force in action is the deforesta-
tion of the tropical hardwood forests. These trees(a) The balance of evidence favors the niche represent substantial amounts of standing value, but
competition hypothesis if that is expressed they have very low growth potential. It is econom-in terms of the influence of population growth ically rational to "cash in" the hardwoods and investon deforestation. the returns in other, more productive assets so long
(b) Population density is clearly linked to de- as the economic value of conservation is either notforestation rates. known (the information problem) or is not appropri-
(c) Income growth is fairly clearly linked to able (the "global benefit capture" problem of chap-rates of deforestation, suggesting that defor- ter 2).estation has more to do with growth ofincomes than with poverty-a result that Management resources diversionruns counter to the popular interpreta- These are resources of "medium" value but relative-tions of the causes of environmental degra- ly low growth. Since they are slow-growing re-dation. sources, they make little sense as assets; society has
(d) The evidence on the role of agricultural no incentive to invest in their growth capacity. Inproductivity change is finely balanced. One addition, on account of their relatively low value,would expect growth in productivity to less- they do not justify a commitment of substantialen the pressure on colonization of forests amounts of national resources for the management(the coefficient of association should be of the exploitation process. Then, the nation willnegative). The two studies finding this asso- allow these resources to be depleted through un-ciation are for South America and Indone- managed exploitation.sia. The two studies finding the oppositeassociation are for Thailand (Katila) and the Examples of this process include the depletion ofBrazilian Amazon (Reis). many of the large land mammals, such as the Afri-
(e) The link between indlebtedness and defores- can elephant. During the 1 980s, sub-Saharan Africatation is also fairly clear. Perrings finds a lost half of its elephantpopulation (from 1.3 millionpositive link for tropical moist forests but to 0.6 million). However, on closer inspection ofnot for other forests. Kahn finds a positive the national population statistics, it appears thatlink, but Capistranci's models do not find four countries alone (Sudan, the Central Africansuch a link. Again, this ambivalence is at Republic, Tanzania and Zambia) lost 600,000 thou-odds with the popular interpretations of the sand elephants between them. It is clear how thesecauses of environmental degradation. elephants were lost. These four countries fell at the
bottom of the tables of African park and protectionThree routes to extinction spending (averaging about $15 per square kilome-To summarize, there are three alternative routes to ter) (Swanson 1993). The decline of the Africanextinction for terrestrial species (as opposed to the elephant in the 1 980s was the result of these tacitsingle route for marine species). These are stock open access regimes.
30

Base resource conversion a management institution (for example, private prop-These are resources that are of little or no known erty rights with some state enforcement) are put intoindividual value to humans. These biological re- place when the land is deforested, enclosed andsources are not over-exploited but undercut. They converted to agriculture. This indicates the unwill-are lost because humans find alternative uses for the ingness of the state to invest in management regimeslands on which they rely. Those alternative uses for the slate of diverse resources that naturally existreflect simple human need for food (the growing there (and the willingness to introduce these regimespopulation problem) or the failure to appropriate the with the introduction of different assets in those"true" economic value of conservation, or the exist- regions). Therefore the fundamental basis for anyence of perverse economic incentives to convert land-based species' decline is a state's determina-land for biodiversity-friendly uses to uses inconsis- tion, implicit or explicit, not to invest in that partic-tent with biodiversity maintenance. ular species (or, equally, its habitat). In order to
regulate extinction, it will be necessary to operateAn example of this process is the depletion of many through the perceptions of these states, affecting thetypes of virtually unknown life forms when land is determination of which resources are investment-deforested and converted to other forms of use, such worthy. Information about the economic value ofas cattle ranching. This branch of the force for biodiversity will help. It will also help to demon-extinction is generally termed the ibiodiversity strate that the relative economic rates of return toproblem." land conversion are distorted, for example, by subsi-
dies, the removal of which would confer net benefitsRegulating extinction: correcting to the state in general. Procedures for capturinginvestment incentives global economic value would also help restore aThe framework that these three forces imply focus- level playing field between conservation uses andes on the investment-worthiness of the resource. In land conversion uses. But the underlying force foressence, in the context of owner-states, all questions making the conversions in the first place remains theof extinction and species decline are based in the need to produce food to meet growing human popu-incentives for under-investment. The fundamental lations and, to some extent, the political requirementproblem is that the owner-states do not invest in of establishing nationally loyal communities in bor-their diverse species (in terms of stocks, manage- der areas.ment and habitat). It is the failure of a state toprovide for these requirements for a terrestrial spe- Niche appropriation and the specialized speciescies that inevitably results in its decline. One very important reason for the continuing under-
investment in diverse resources and diverse habitatsThe decision to withhold these investments in re- is the bias towards investment in the specializedgard to a given area of habitat implicitly derives species. These are the domesticated (animal) andfrom a determination that the naturally existing cultivated (plant) species that have been selected byresources do not warrant the required investments. humans to receive the vast majority of investmentIn regard to the developing tropical countries (where for purposes of meeting human consumption needs.most diversity now exists), these are usually deci- They represent a minute proportion of the world'ssions not to invest in managing the forested frontier, diversity, but they constitute the vast majority of thethereby allowing wholesale over-exploitation of food consumed by humans. Only twenty speciesthe diverse resources and encouraging widespread produce the vast majority of the world's food. Theconversion to the traditional agricultural commod- four carbohydrate crops (wheat, rice, maize andities (which are perceived as more productive). potatoes) feed more people than the next twenty-six
crops combined (Wilson 1988).For example, in the Amazon region, it is often thecase that the owner-state refuses to engage in re- The specialized species are of special importancesource management on the frontier region before because their mere existence indicates the nature ofthe conversions occur. Usually, the first vestiges of the underlying problem. These species are so prev-
31

alent because they are monopolizing the invest- It is estimated that the human population on earthments of human societies in biological production. ten thousand years ago (before specialized agricul-In a world where human investments are now nec- ture) was approximately 10 million individuals.essary for species survival, these natural monopo- The advance of this particular technological fron-lies in a handful of species imply non-investment in tier left much greater human population densities inliterally millions of others, and non-investment its wake, first in the developed countries and nowequates with extinction. increasingly (with the Green Revolution) in the
developing world.The extent to which this process of conversionunderlies the process of extinction is indicated by The human population will reach 10 billion in thethe rates and locations of recent land-use conver- coming century. The movement to this much highersions. During the twenty years 1960-1980, the whole population level necessarily implies the capture ofof the developing world saw the proportion of its many other species' niches; the human species (oneland area dedicated to the specialized species in- of five or ten million) now appropriates about 40crease by 37.5 percent, while that same proportion percent of all available photosynthetic product on theremained constant in the developed world (where planet (Vitousek et al. 1984). This expansion has beenthe conversion process is complete; see Repetto and occasioned largely through the instrument of conver-Gillis 1988). At the "forest frontier"-countries sions of land area to the use of the human-selectedwhere colonization of forest land is significant- specialized species. It is the substitution of the special-these rates of conversion are even greater than the ized for the diverse on a global scale that is the mostaverage, and continue to be so. For example, during fundamental force for extinction.the 1 980s, Paraguay (72 percent), Niger (32 per-cent), Mongolia (32 percent) and Brazil (23 per- Investment distortionscent) have all experienced significant rates of Nations under-invest in biodiversity because its rateconversion of lands to specialized crops; while of return appears to be less than that from alterna-Ecuador (62 percent), Costa Rica (34 percent), tive, competing uses of the land. But these rates ofThailand (32 percent) and the Philippines (26 per- return to alternative land uses are themselves dis-cent) have all experienced significant conversions torted: biodiversity uses have to be compared withof lands to specialized livestock (World Resources two alternatives: (a) land uses in which inputs andInstitute 1990). outputs are "correctly" valued; and (b) the actual
situation in which the value of inputs and outputsFinally, it is important to note that the motivation for are distorted. These might be referred to as the levelexpanding the ranges of these few, specialized playing field comparison and the "unlevel" playingspecies is one of human niche expansion. These field comparison. Of course, this assumes that biodi-specialized species are mere instruments for the versity uses are not themselves subject to subsidiescapture of photosynthetic product by human societ- and distortions. Typically, however, the bias is veryies. The diverse biological communities are cleared, much towards distortions in conventional land use.and these homogeneous ones installed, in order toconvert the land to more beneficial production from Such distortions are widespread. Table 3.3 showsthe human perspective. The conversion of lands one set of subsidies to agriculture in selected coun-between biological assets (firom diverse to special- tries for 1987. While some countries tax theirized) is simply another manner in which humans agricultural sectors (these show up as negativebenefit from adjusting their societal asset portfolio numbers in Table 3.3) most subsidize agriculture.(Solow 1974). The subsidies shown, however, are recorded as
sums received by farmers in addition to the produc-An indicator that this has been a successful strategy er price. What has to be remembered is that thefor the human species is the phenomenal expansion producer price may itself be artificial in that it isof the human niche (as measured by the population controlled by government. As an example, rice andof this species) sincethe introduction of agriculture. cereal prices paid to farmers in Japan were six to
32

seven times the border price. In addition, farmers rudimentary but instructive. In Bangladesh, for exam-received subsidies in excess of 100 percent of the ple, the subsidy structure to wheat makes little differ-producer price. Table 3.3 shows that the countries ence to what producers would get if border priceswhich subsidize over and above producer prices ruled. The same is true for Indonesian rice. In China,tend to be the developed economies of Canada, the the effect of the subsidy structure is in fact to taxEuropean Community, Japan and the United States, farmers so that Chinese producer incomes per hectaretogether with the newly industrializing countries of are actually below borderprices. But in Japan (wheat)South Korea and Taiwan. But subsidies are perva- and South Korea (rice) it can be seen that not only issive, as the table shows. the producer price well above the border price (seven
and four times respectively, but further subsidies ofTable 3.4 shows the magnitude of distortion arising around 100 percent are paid in addition to the borderfrom the level of producer prices as well as the price. The effect is to make the returns to a hectare ofsubsidies granted (shown in Table 3.3). Only a few wheat production in Japan around fourteen times whatselected countries are shown. Once again, the data are it would be without subsidies and without adminis-
Table 3.3 Producer subsidies as a percentage of producer prices in agriculture 1987:selected countries(%)
Rice Corn Sorgh. Soya Wheat Beef Sugar Other
Argentina -23 -42 -10 6Australia 4 4 16Bangladesh 35 -1Brazil 95 5 -9 59 1Canada 37 22 51 10 54Chile 20 44 50Colombia 63 21 coffee -35Egypt -126 15 4 45EC 56 56 46 50 40 41India 4 4 -10 I1 7Indonesia 8Japan 97 59 108 72 70Kenya -7 13 coffee -31
tea -41Mexico 75 59 52 20 18 cotton 60Nigeria 49 6 64 cotton 83Pakistan -1 and
-128* -18 -17 11Poland 54 36 29South Korea 84 77 85 47Taiwan 46 82 83 72 79 22 28Thailand 5Turkey 19 42 4USA 49 46 43 8 63 10 60
Source: Adaptedfrom Webb, Lopez and Penn (1990). Note that these subsidies are in addition to producer priceswhich may themselves be higher than border prices - see Table 3.4.* Different types of rice.
33
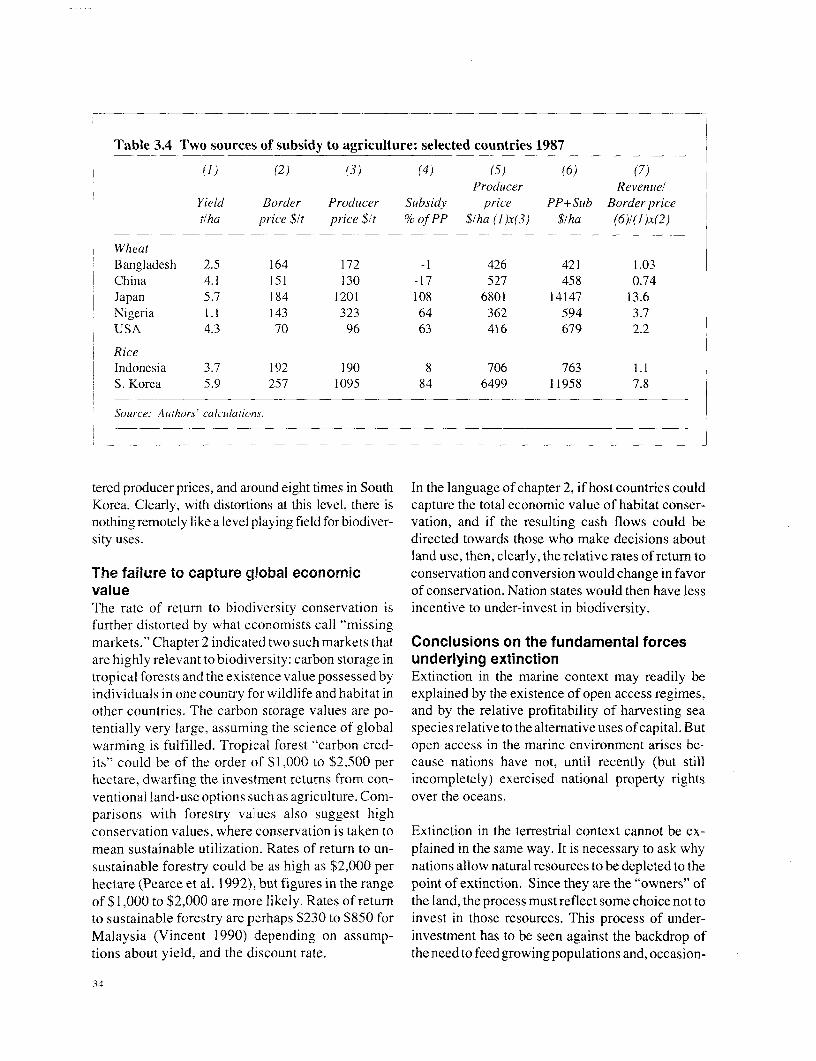
Table 3.4 Two sources of subsidy to agriculture: selected countries 1987
(1) (2) (3) (4) (5) (6) (7)Producer Revenuel
Yield Border Producer Subsidy price PP+Sub Border pricetiha price $It price $It % of PP $1ha (1)x(3) $1ha (6)1(1)x(2)
WheatBangladesh 2.5 164 172 -1 426 421 1.03China 4.1 151 130 -17 527 458 0.74Japan 5.7 184 1201 108 6801 14147 13.6Nigeria 1.1 143 323 64 362 594 3.7USA 4.3 70 96 63 416 679 2.2
RiceIndonesia 3.7 192 190 8 706 763 1.1S. Korea 5.9 257 1095 84 6499 11958 7.8
Source: Authors' calculations.
tered producer prices, and around eight times in South In the language of chapter 2, if host countries couldKorea. Clearly, with distortions at this level, there is capture the total economic value of habitat conser-nothing remotely like a level playing field for biodiver- vation, and if the resulting cash flows could besity uses. directed towards those who make decisions about
land use, then, clearly, the relative rates of return toThe failure to capture global economic conservation and conversion would change in favorvalue of conservation. Nation states would then have lessThe rate of return to biodiversity conservation is incentive to under-invest in biodiversity.further distorted by what economists call "missingmarkets." Chapter 2 indicated two such markets that Conclusions on the fundamental forcesare highly relevant to biodiversity: carbon storage in underlying extinctiontropical forests and the existence value possessed by Extinction in the marine context may readily beindividuals in one country for wildlife and habitat in explained by the existence of open access regimes,other countries. The carbon storage values are po- and by the relative profitability of harvesting seatentially very large, assuming the science of global species relative to the alternative uses of capital. Butwarming is fulfilled. Tropical forest "carbon cred- open access in the marine environment arises be-its" could be of the order of $1,000 to $2,500 per cause nations have not, until recently (but stillhectare, dwarfing the investment returns from con- incompletely) exercised national property rightsventional land-use options such as agriculture. Com- over the oceans.parisons with forestry values also suggest highconservation values, where conservation is taken to Extinction in the terrestrial context cannot be ex-mean sustainable utilization. Rates of return to un- plained in the same way. It is necessary to ask whysustainable forestry could be as high as $2,000 per nations allow natural resources to be depleted to thehectare (Pearce et al. 1992), but figures in the range point of extinction. Since they are the "owners" ofof $1 ,000 to $2,000 are more likely. Rates of return the land, the process must reflect some choice not toto sustainable forestry are perhaps $230 to $850 for invest in those resources. This process of under-Malaysia (Vincent 1990) depending on assump- investment has to be seen against the backdrop oftions about yield, and the discount rate. theneedtofeedgrowingpopulationsand,occasion-
34

ally, political objectives with respect to the settle- resolve the problem of biodiversity loss, but toment of land. But the rate of land conversion is contribute to a slowing down process. If one mainaccelerated further by (a) lack of information about force explaining the losses is population growth,the economic value of conservation; (b) deliberate then GEF can expect to have a limited role to playpolicies which encourage land conversion-such in conservation since it has no powers nor any remitas subsidies; and (c) "missing markets"-the in- to change that fundamental process. But GEF doesability of nation states to capture the global eco- address the second issue of under-investment. Es-nomic benefits of conservation. It is arguable then sentially, GEF' s funding of the incremental cost ofthat, while niche competition remains a fundamen- projects (see chapter 2) raises the rate of return total cause of biodiversity loss, the rate of conversion conservation projects in the host country. And itwould be slowed if the information, distortionary does this by focusing on one of the "failures" in thepolicy, and missing marketproblems were resolved. way the competition between conservation and landMoreover, as the statistical analysis showed, there conversion works-the failure to appropriate glo-are other forces at work as well. bal benefit. Nor should the low level of funding of
GEF be too disadvantageous provided it can use itsWhat relevance has such a view for the Global limited funds to lever private sector capital, an issueEnvironment Facility? First, it helps to put the GEF discussed briefly in chapter 5.activity in context. GEF was not established to
35
Reversing4 the Decline
From the discussion of the nature of the extinction sions of the world. It was also the initial rationaleproblem in chapter three, it is apparent that there are underlying the International Whaling Convention.two different spheres to be considered, marine and Most of these international treaties functioned throughterrestrial. These spheres are distinct biologically, the creation of a commission whose task it was toeconomically and (most important) institutionally. develop a scheme similar to that outlined in (a) - (d).
Regulation of oceanic resources In practice none of these commissions has been aIn the oceanic context there is no owner-state with success in terms of the management of its resources.the designated responsibility for management of a This result has been occasioned not by a failure togiven marine resource. The regulation problem appreciate the nature of the management solution toconcerns the construction of an owner-manager the problem, but rather by a failure of the parties toregime with regard to the resources which are, in accept and implement the managed solution.fact, international resources, falling outside any onestate's territorial jurisdictiori. The role of regulation Instead, the various states have over-depleted oceanicis to develop a management regime that would resources by failing to agree how to distribute themirror that constructed by an owner-state, if one gains from implementing the managed solution; theseexisted. are multilateral bargaining problems. When each
state argues that it should receive a larger share of thatThe development of an international resource man- gain, pressure is created to revise the aggregate off-agement regime is, in theory, a simple task. It take in order to accommodate all the demands. Theseconcerns the performance of a straightforward four- individual demands are then met through: increasedstep process in regard to the resource: aggregate quotas; state withdrawal from the interna-
tional commission (reservations and non-accession);(a) Assessment of stock level and growth capac- and/or state non-enforcement of its individual quota.
ity of the resource; The ultimate effect is the inefficient international(b) Determination of the aggregate optimal off- management of the resource. The existence of these
take (quota) for the resource; international bargaining problems has resulted in the(c) Allocation of the overall quota to individual over-depletion of many important oceanic resources.
states; and(d) Enforcement of the individual state quotas. Regulation of land resources
Although the problem of extinction on land is veryPrecisely this approach has been attempted for about different in character from that in the context ofhalf of this century by the various fisheries commis- oceanic resources, the policy approach applied on
36

land derives directly from the analysis of the prob- only three avenues to extinction for terrestrial re-lem developed for the sea. This has led to a largely sources. The other two, the competition for land andineffective and necessarily inefficient set of endan- management resources, are equally, or more com-gered species policies, as traditionally defined. monly, the incentives leading to extinction. There-
fore a system of bans would be an apt policy forThe leading piece of legislation regarding endangered over-exploited oceanic species and the slowest grow-species is the Convention on International Trade in ing (and highly valuable) terrestrial species, but theEndangered Species of Flora and Fauna. Its policy is policy would have no positive impact on the incen-to focus on the identification of endangered species tives resulting in the extinction of other terrestrialand the withdrawal of the demand for these species or resources. Species that are in decline on account oftheir products, and the criminalization of their supply. competition for lands (general biodiversity), or com-Endangered species policies developing out of this petition for state investments in management (suchconvention therefore operate through a system of as elephants), will not be assisted by the prevailingbans. An importing state is required to ban all imports set of endangered species policies.of products derived from a listed endangered species,and an exporting state is required to ban all exports of In fact, there is an argument to be made that theproducts derived from such a species. existing policies entirely misapprehend the core of
the extinction problem-the creation of incentivesThis system of bans is required of all parties to for owner-states to invest in (rather than convert)CITES (now more than 125 nations). In addition, their remaining diverse resources. A system ofthere is the requirement that the member states bans, and the resulting reductions in the profitabil-adopt internal legislation implementing the terms of ity of all diverse resources, is the antithesis of athe convention. Many states, particularly develop- constructive approach to the fundamental probleming countries, have implemented absolute bans on of extinction.all wildlife exploitation. In many developing coun-tries it is illegal to hunt, capture, trade or export any International regulation of extinction-part of the wildlife resource. This is true for most of creating incentives for owner-statesthe states of South and Central America. For exam- The objective of international extinction policiesple, Brazil and Boliviahave total bans on all wildlife should be the inducement of investments by owner-exports, as does Mexico. Many of their neighbors states in their diverse resources. This solution ishave partial or full bans in place. In sub-Saharan suggested by the nature of the problem, as devel-Africa, there are a half dozen states with complete oped in chapter 3. In essence, if an owner-state doeswildlife exploitation bans in place, while many not view its diverse resources as worthy of signifi-others have severe use restrictions. cant investments, then it will be optimal (from that
state's perspective) to allow a continuation of theThis approach to endangered species policy is based conversion of its lands to more specialized uses.on the over-exploitation theory of extinction de- Such conversions can occur through the managedscribed in chapter 3. It operates indirectly through ,mining" of existing resources (as with hardwoodthe economic system, by lowering the unit price of forests), via the unmanaged over-exploitation ofa species' products (through the destruction of existing natural resources (as with the African ele-demand) and by increasing the cost of supply phant), or by the removal and replacement of the(throughcriminalizing theproduction process). The diverse with the specialized (as with land-use con-narrowing of the price-cost ratio would have the versions to cattle and crops). All three routes toeffect of reducing the pressures on a resource within extinction have the same ultimate result (changedan open access regulatory framework, if the funda- land use) and the same underlying cause (perceivedmental cause of its decline is over-exploitation. investment worth). The objective of international
extinction policy, within this framework, must thenHowever, as discussed in chapter 3, the incentive to be to alter the perceived relative investment worthover-exploit stocks of biological resources is one of of diverse resources within individual owner-states.
37

Global versus local optimum effects of their decisions. In economic terms, theThe global problem of extinction comes down to a objective is the internalization of the global stockbasic divergence between what investment in di- effect of diverse resources in the owner-state's deci-verse resources is desirable from a global point of sion-making framework. The rationale is that if anview and what is desirable from a local point of owner-state considers the global benefits rendered byview. The owner-state responds only to the per- diverse resources when making its conversion deci-ceived national (internal) relative advantages of sion, it will only decide in favor of conversion whendiverse versus specialized resources. These are the that is globally optimal. This internalization of globalsame incentives that are found in every state, and externalities has the effect of making the perceivedthat have resulted in the almost complete conver- local optimum coincide with the global optimum.sion of the lands of most of the developed states inthe world. For example, the amount of unaltered Such a policy implies that international regulationhabitat of at least 400 square kilometers is zero in needs to be directed to the creation and maintenanceEurope against a global average of 30 percent of a global premium to investments in diverse(World Resources Institute 1990). resources. This is an additional return, created
through funding by the international community,The difference between the previously and currently that will flow to owner-states investing in theirconvertingstatesisnotsomuchamatterofdifferences diverse resources. There are two logically distinctbetween what is locally desirable, butratherthe change approaches to the creation of such premiums: inter-in what is optimal globally given the state of the global national subsidy agreements and market regulationstocks of diverse resources. In essence, the cost of agreements. However, there are a number of differ-each land conversion (from diverse to specialized) is ent forms (international parks, international man-not the same from the global lperspective because there agement subsidies, intellectual property rights,is a global stock effect. As stocks of diverse resources producer cooperative agreements, consumer pur-are replaced from the sanne roster of specialized chasing agreements and resource exchanges) thatresources across the globe, the range of global diver- either of these approaches may take.sity continues to narrow. The initial narrowing of thisroster probably had little consequence for global International subsidy agreementsbiological production; however, the final conversions Although it is under-investment thatgenerally driveswill have a very substantial imnpact. A world constitut- extinction, it is the specific costliness of particulared of none other than the relative handful of cultivated resource requirements that is the proximate cause ofand domesticated species would not support a sustain- extinction. Extinction is caused most directly by theableproductionsystemforhumanconsumptionneeds. refusal to allocate scarce societal resources to the
lands or the management that diverse resourcesIt is this uninternalized increasing costliness of con- require. It is the refusal to purchase these life-version that is the core of the global biodiversity sustaining factors for certain forms of biologicalproblem. The individual state considering land-use resources that is the direct cause of species decline.conversions does not consider the effects of its actionson the global stocks of diverse resources, because These sources of decline can be remedied through athere are no benefits from doing so. Therefore the system of strategic international payments. Thisunregulated global conversion process may continue system of payments would necessarily be condi-well past the global optimum as individual states tional upon the owner-state's application of them toimplement only locally optimal conversion policies. the purchase of the required factors for specified
diverse resources. The payments would thus beInternational extinction policy-investing in restricted to use for the purchase of land and man-the internalization of the global stock effect agement for a particular resource or region.The best policy for regulating the conversion deci-sions of individual owner-states is the creation of Such a system of payments is constructed in asystemsthatcausethesestatestoconsidertheexternal manner that constitutes a self-enforcing interna-
38

tional agreement. The voluntary cooperation of ing. The permanent redirection of developmentcountries in an international agreement means that paths will require the creation of institutions for thatnational sovereignty is respected rather than in- purpose. The suggested reforms outlined in thisfringed. So the first principle for constructing an paper should be interpreted as potential directionseffective system for regulating biological diversity for institution building of this nature.is to recognize terrestrial biological resources asnational resources. Once this point is recognized, An example of such an international factor-subsidythe approach to registering global preferences in the scheme might be an internationalparks agreement.regulation of national resources is clear; it requires Such a program would in effect buy the use of thethe inducement of changed national policies via land for the diverse resources that exist there. Thestrategic payments. In this way, host-states are role of the international community would be to payinduced to exercise their national sovereignty rights the rental price of the land each year that the nationalin globally-preferred ways, but only because it is in park remained unconverted. In order to manage thetheir own perceived best interests to do so. park, it would probably be necessary for the interna-
tional community to provide a subsidy for manage-A crucial feature of any international scheme of ment services as well. If the international communitypayments based on conditionality (here, payment wished to maintain diverse resources at the lowestconditional on specific application) is its necessar- levels of exploitation (for non-consumptive activi-ily dynamic nature. It is only possible to restructure ties such as tourism and filming), then it would bethe owner-state's decision-making process if the necessary to provide almost complete subsidies forpayment is offered at the end of each period in the foregone land development opportunities andwhich the state takes the specified action. The management services required.payment is the globalpremium, supplementing thestate's return, received for pursuing the global rath- However, the maintenance of a stock of diverseer than the local optimum. resources will often be compatible with a wide
range of forms of resource utilization, other thanA second important feature of this system of pay- those that are of the lowest intensity. In that case thements is assurance. As emphasized in the previous international subsidies may be reduced in accor-sections, investments in diverse resources represent dance with the extent to which development oppor-investments in specific forms of assets. It is the tunities are allowed in the region. This, in essence,expectation of a future flow of benefits from these is the development rights approach to diverse re-investments that will ultimately induce them. There- source conservation; to the extent that the interna-fore the global community must, in order to alter tional community wishes to reduce the developmenthost-state investment patterns, itself invest in two intensity away from the local optimum (of highdistinct ways: (a) the creation of a stream of en- intensity conversion and use), it must be willing tohanced benefits for host-states investing in diverse provide a stream of ex postpayments to compensateresources; and (b) the creation of assurance that this for the foregone development.stream of payments will flow to investing states inperpetuity. Another example of an international subsidy scheme
would be a resource franchise agreement. ThisThis latter object is equally important because, would be a three-way agreement (between owner-without assurance, the enhanced benefits are mean- state, international community and franchisee) iningless; states will not alter their long-term invest- which the international community would providement behavior without assurance that these benefits a stream of rental payments to the owner-state inare non-discretionary. The choice of an investment return for its agreement to restrict use of a givenpath for a given state's development is not redirect- piece of land to uses specified within the franchiseed by means of one-off impermanent injections of agreement. The land would thus be designated forfunds. This is the reason that global investments in use, but only for limited uses amounting to muchbiodiversity must take the form of institution build- less than complete conversion (for example, for
39
extractive industries such as rubber-tapping, and cutting),apolicyofrentmaximizationandappropri-plant and wildlife harvesting). The land would then ation is available.be franchised to an entity that could use it only forpurposes compatible with the franchise. If the state Rent appropriation is a policy based on assuring thatfailed to enforce the franchise agreement, it would the owner-state receives the full value from its di-forfeit its annual rental fee. verse resources. At present, this is the opposite of
what is occurring with respect to a wide range ofThe benefit of a franchise agreement over an inter- these resources. African countries were capturingnational parks scheme is that it provides a stream of about 5 percent of the value of their raw ivory exportsbenefits to fund the management of the operation. during the height of the ivory trade (Barbier et al.Under the franchise agreement, it is the responsibil- 1990). Tropical bird harvesters around the worldity of the franchisee to provide management servic- acquire between I percent and 5 percent of thees from the returns it generates in its operation of the wholesale value of the animals (Swanson 1992).franchise. In this fashion, the international commu- This is true even with regard to many exports ofnity is able to "contract out" the provision of man- tropical forest products (Repetto 1990). The ownersagement services, while (through the rental fee and of diverse resources under :hese circumstances arerestricted use clauses in the franchise agreement) it holding only the legal, and not the beneficial, rightsretains the possibility of moving the local optimum of ownership. Combining the two sets of rightscloser to the global one. Therefore, a franchise within the same entity will greatly enhance the per-agreement is simply a more generalized form of the ceived benefits from diverse resource management.international park agreement required for the acqui-sition of all development rights in a region. A At present, international policies regarding diversefranchise agreement could be used to specify the resourcetradearetheoppositeofarentappropriationprecise range of activities allowed and disallowed system. International policy regarding poorly man-in the region, and it would require the international aged resources (for example, where the beneficialcommunity to provide the "global premium" that is interest is separated from the legal resulting in over-necessary to make up the difference between what exploitation) is to attempt to destroy the value of thean entity would bid for the franchise and what the resource (as discussed above with regard to CITES)value of the land would be in sustainable use. or to bring the resource into domestication (as with
the relocation of the livestock for the tropical birdMarket regulation agreements industry to developed countries). Both approachesThe alternative to the direct purchase of develop- are geared equally to the destruction of incentives forment rights is the subsidization of diverse resource investments in diverse resource habitats.production, in order to alter the perceived benefitsof conversion. The owner-s,tate considering conver- An international policy regarding diverse resourcesion will balance the comparative benefits from the trade must instead be based upon a constructiveland in its various uses. One means by which the approach by being used for the maximization of thedecision-making process rnight be biased towards rental value of the resource combined with the tar-the naturally occurring slate of resources is the geted return of that value to those states investing inenhancement of the returns from these resources. theirdiverse resources. This approach provides com-
pensation for those states already investing in theThis approach obviously wvill not address all three management of their diverse resources, and it pro-of the potential routes to extinction (discussed in vides incentives to those states not so investing.chapter 3), but it will address two of them. The thirdroute-the mining of high value, slow-growth re- Forexample,theCITESbanontheivorytradecanbesources such as hardwood forests-must be ad- seen as a misconceived policy. Although the conti-dressedviathesubsidiesapjproachdevelopedabove. nental populations of the elephant had declined byFor all other resources threatened with extinction half, these populations had fallen precisely in those(those suffering from over-exploitation and under- states that had not invested. In other states that had
40

invested heavily in the species, such as Zimbabwe received from the exchange are re-channelled to the(with per kilometer investments ten or twenty times habitat, because sustainable management requiresas great as those in the non-investing states), the substantial investments of resources (which is why itelephant population had vastly increased over the so seldom exists). It would only be those states thatsame period (by 100 percent in Zimbabwe). A are willing to invest in this manner of development,blanket ban on the ivory trade provides the wrong and able to demonstrate their capabilities to do so,incentive structure for the African states. The impo- that would be listed on the exchange. In this way thesition of a ban proved that the states engaged in exchange system generates the funding required forelephant over-exploitation were right; there was no enhancing diverse resource benefits, and also gener-future to be had from investments in this diverse ates the incentives for channelling these enhancedresource. benefits back into the diverse resources.
The correct international incentive structure would Another example of such a scheme would be ado the opposite; it would provide premiums to the genetic (intellectual property) right regime. Thisstates investing in their diverse resources and pen- regime would also allot specific markets in consum-alties to those who do not. This could be achieved er states to compensate for diverse resource invest-through a sustainable wildlife trade exchange. As ments, but the connection between the market andwith any exchange, it would be developed to dis- the investment would be less direct (as comparedcriminate between good (investing) and bad (non- with stock investments that directly generate tangi-investing) suppliers and allow only the former to ble flows).sell on the exchange; then any consumer of theproduct would know that in purchasing from the The role of any form of intellectual property rightsexchange, the funding would flow to an owner-state regime is to provide a basis for compensating invest-that invests in the resource. In addition, to the extent ments in stocks that do not generate directly com-that the consumer states agreed and enforced pur- pensatory flows. Specifically, intellectual propertychases solely from the exchange, the result would regimes generally reward inappropriable investmentsbe greatly enhanced prices for the supplier states in information with rights in discrete markets. Alisted on the exchange. This exchange-based price concrete example is the innovation of the optimaldifferential would then constitute the premium for sized racquet head, developed from a program toinvesting owner-states and the penalty for the non- determine the optimal trade-off between wind resis-investing. tance (too large a head) and required accuracy (too
small a head). The inventor of the oversized tennisThe crucial element in this approach is the creation racquet determined that a racquet of 117.5 squareof a price differential for investing owner-states centimeters was optimal for tennis. In fact, thisthrough market regulation in the consumer-states. represented an investment in the creation of pureRestrictions on the country from which consumers information that would not have been appropriableare allowed to make their purchases will always through the marketing of tennis racquets (becausecreate a premium for the favored countries. A glo- other sellers would immediately have entered thebal premium for the sustainable producers of flows market with the same head). Therefore the intellec-of diverse resources may be created through any tual property rights regime awarded this inventorscheme generally directed to this purpose. with aprotected marketrightin all racquethead sizes
between 100 square centimeters (the original size ofThe method of certifying suppliers in a wildlife a tennis racquet head) and 135 square centimeters.trade exchange is the manner in which investments This protected market then acted as compensationin diverse resources are assured. A host-state would for the investment in the information created by thisonly be "listed" on the exchange if it were able to inventor.demonstrate that its supplies to the exchange werederived from "sustainably managed habitats." It is It is equally possible to link protected markets tothe latter requirement that ensures that the proceeds investments in diverse resource stocks, because these
41

stocks also feed into various industries in an indirect creating global premiums by changing the rate ofand usually inappropriable fashion. For example, return to conservation in the host country. As exper-many pharmaceutical innovations are developed tise is gathered in these ventures, the GEF mightfrom a starting point of knowledge derived from the readily become an intermediary for private sectorbiological activities of natural organisms. Howev- investments-a natural development of current co-er, after the long process of product development financing agreements. For example, the GEF mightand introduction, there is no compensation for the monitor and "authenticate" investments by the pri-role played by the diverse resource in initiating the vate sector in country A to reduce CO2 emissions inprocess. country B, an investment that would be justified for
the industry concerned if (a) CO2 quotas are im-A genetic resource right system could be construct- posed in the developed world; and (b) the costs ofed that would be analogous to an intellectual prop- abatement are lower in the developing world. Ex-erty rights system. This would require a royalty tending this brokerage function still further, thepayment to the owner-state investing in the mainte- GEF might ultimately involve itself in franchise andnance of diverse resources that are made available tradable development rights (TDR) agreements.for prospecting by various industrial concerns. This This is a scenario for the future, not a prescription.royalty would be based on a protected market right But the kind of economic analysis in this sectionfor the return of some share of the revenues from the does suggest that biodiversity conservation willmarketed product to the investors in the resource require more imaginative use of the limited resourc-that led to the creation of the product. es available under the Rio conventions.
In summary, the idea of consumer market agreements Domestic policiesis to allocate these markets only to those owner-states Chapter 3 argued that land-based biodiversity ero-investing in their diverse resources. The owner-states sion arises from under-investment and niche com-that choose to mine their diverse resources will other- petition. Under-investment reflects thewise drive down the prices, and rents, available to all unappropriated global externality from biodiversi-states providing diverse resource flows. An agree- ty loss, which is the failure to capture global values,ment to restrict consumer nmarkets to those owner- or the global premium. Chapter 2 showed that thesestates that invest in their diverse resources creates a premiums could be very large, as illustrated by theprice differential: a price premium target to all sus- carbon storage values of tropical forests.tainable producers and a price penalty target to all non-sustainable producers. Such a mechanism might be Butchapter 3 also showed thateven the apparentratesused in a wide variety of circumstances, where the of return to land-use conversion are distorted bystock-related investments are directly linked to the domestic policies. Correcting those policies thus be-final product (for example, an ivory exchange), and comes an integral part of the measures needed towhere the stock-related investments are less directly reverse the decline in the world's stock of biodiversi-linked to the final product (for example, a genetic ty. The general theme, then, of the policy measuresresource right regime). emerging from the economic analysis of biodiversity
loss is to:How are these considerations relevant to the GlobalEnvironment Facility? Since the GEF operates via * Establish a domestically level playing field be-projects,theconceptoftradabledevelopmentrights, tween alternative land uses by removing marketwhereby nation states capture what we have termed distortions in the form of subsidies and poorlythe global premium, does not seem appropriate for defined property rightsits remit. But over the long run the nature of the GEF * Capture the global premium to ensure that thereis likely to change. One scenario is that it becomes is a globally level playing fieldas much a "broker" of some or many of the different . Invest more in population control policies and inways in which international transfers take place. technologies to meet the needs of expandingThe GEF does deal directly in one mechanism for populations currently met by land conversion.
42

To be sure, the final result will not be total conser- of supply, and often leads to a lack of incentives tovation of biodiversity. If we knew all of the relevant conserve water (for example, charges are often setinformation there might still be an "optimal" level on the basis of irrigated acreage regardless of waterof biodiversity loss. But it will be a marked change quantity consumed). One of the effects of such lowof emphasis compared to the current situation. charges is over-watering, with the result that the
irrigated land becomes waterlogged. ApplicationsWhat kinds of domestic policy changes are re- of irrigation water often exceed design levels byquired? We illustrate this briefly since extensive factors of three. In India, 10 million hectares of landanalysis already exists (Pearce and Warford 1993; have been lost to cultivation through waterlogging,Repetto 1986; Kosmo 1989; and Panayotou and and 25 million hectares are threatened by saliniza-Ashton 1992, among others). Essentially, removal tion. In Pakistan, some 12 million hectares of theor reduction of economic distortions would be ben- Indus Basin canal system is waterlogged and 40eficial to the economies of the country in question percent is saline. Worldwide, some 40 percent ofand simultaneously benefit the environment, and the world's irrigation capacity is affected by salin-hence biodiversity in general. ization. Irrigation from river impoundments has
resulted in other environmental effects. Large damsIn the developing and developed world alike, free produce downstream pollution and upstream silt-markets are often not allowed to function. Govern- ation as the land around the reservoir is deforested.ments intervene and control prices. In the European Indigenous peoples are moved from their tradition-Community, agricultural prices are kept above their al homelands when the dammed area is flooded.market equilibrium, with resulting over-production Clearly, not all damage done by irrigation is due toand damage to the environment through hedgerow low pricing, nor, by any means, can the environ-removal and over-intensive agriculture. In the de- mental costs of large dams be attributed entirely toveloping world the tendency is to keep prices down, inefficient pricing. But there is an association be-below their market equilibrium. These interven- tween wrong pricing and environmental damage.tions often cause environmental problems through By adopting prices that are too low, more irrigationthe following negative effects: water than is needed is demanded, exaggerating the
requirement for major irrigation schemes such as* Governments use up substantial tax revenues and dams, as well as for other schemes. Even if the
other income in subsidies for price control, even scheme is justified, the amounts of water that arethough government revenues are at a premium used are likely to be excessive because of the failurebecause of the need to use them to develop the to price the resource closer to its true cost of supply.economy.
* Subsidies encourage over-use of the resources Table 4.1 shows the actual revenues obtained fromthat are subsidized. The effect of keeping prices selected irrigation schemes as a percentage of oper-down is to encourage wasteful use. ating and maintenance costs (O+M) and of total
* S ubsidies make the economic activity in question costs (capital conservatively estimated plus O+M).appear artificially attractive. This tends to attract While some countries succeed in recovering mostmore people into that industry or sector because or all of the O+M costs, the highest recovery rate ofprofits, or "rents," are high. This is termed rent- total costs is only around 20 percent.seeking, and diverts resources away from moreproductive activities in the economy. The under-pricing encourages a wasteful attitude so
that systems are kept in a poor state of repair.The impact on the environment can be illustrated in the Inefficient irrigation negatively affects agriculturalcontext of the pricing of irrigation water and energy. output. Low charges lead to excess demand, giving
a premium to those who can secure water rights, forIrrigation water example, by being the first in line to receive water.In many countries the price charged for water that is This is brought about because the system irrigatesused for irrigating crops is generally below the cost particular parcels of land first, leaving the poorer
43
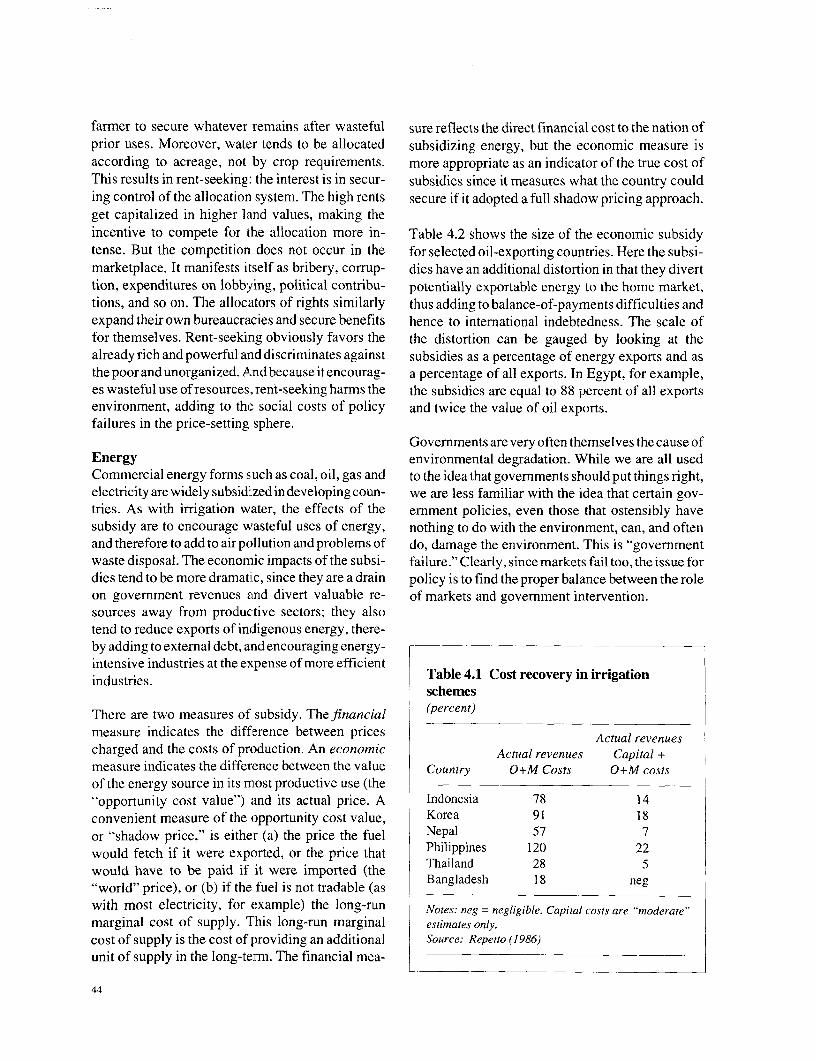
farmer to secure whatever remains after wasteful sure reflects the direct financial cost to the nation ofprior uses. Moreover, water tends to be allocated subsidizing energy, but the economic measure isaccording to acreage, not by crop requirements. more appropriate as an indicator of the true cost ofThis results in rent-seeking: the interest is in secur- subsidies since it measures what the country coulding control of the allocation system. The high rents secure if it adopted a full shadow pricing approach.get capitalized in higher land values, making theincentive to compete for the allocation more in- Table 4.2 shows the size of the economic subsidytense. But the competition does not occur in the for selected oil-exporting countries. Here the subsi-marketplace. It manifests itself as bribery, corrup- dies have an additional distortion in that they diverttion, expenditures on lobbying, political contribu- potentially exportable energy to the home market,tions, and so on. The allocators of rights similarly thus adding to balance-of-payments difficulties andexpand their own bureaucracies and secure benefits hence to international indebtedness. The scale offor themselves. Rent-seeking obviously favors the the distortion can be gauged by looking at thealready rich and powerful and discriminates against subsidies as a percentage of energy exports and asthe poor and unorganized. And because it encourag- a percentage of all exports. In Egypt, for example,es wasteful use of resources, rent-seeking harms the the subsidies are equal to 88 percent of all exportsenvironment, adding to the social costs of policy and twice the value of oil exports.failures in the price-setting sphere.
Governments are very often themselves the cause ofEnergy environmental degradation. While we are all usedCommercial energy forms such as coal, oil, gas and to the idea that governments should put things right,electricity are widely subsidized in developing coun- we are less familiar with the idea that certain gov-tries. As with irrigation water, the effects of the ernment policies, even those that ostensibly havesubsidy are to encourage wasteful uses of energy, nothing to do with the environment, can, and oftenand therefore to add to air pollution and problems of do, damage the environment. This is "governmentwaste disposal. The economic impacts of the subsi- failure." Clearly, since markets fail too, the issue fordies tend to be more dramatic, since they are a drain policy is to find the proper balance between the roleon government revenues and divert valuable re- of markets and government intervention.sources away from productive sectors; they alsotend to reduce exports of indigenous energy, there-by adding to external debt, and encouraging energy-intensive industries at the expense of more efficientindustries. Table 4.1 Cost recovery in irrigation
schemes
There are two measures of subsidy. The financial (percent)measure indicates the difference between prices Actual revenuescharged and the costs of production. An economic Actual revenues Capital +measure indicates the difference between the value Country O+M Costs O+M costsof the energy source in its most productive use (the"opportunity cost value") and its actual price. A Indonesia 78 14convenient measure of the opportunity cost value, Korea 91 18or "shadow price," is either (a) the price the fuel Nepal 57 7would fetch if it were exported, or the price that Philippines 120 22would have to be paid if it were imported (the Thailand 28 5"world" price), or (b) if the fuel is not tradable (as Bangladesh 18 negwith most electricity, for example) the long-run Notes: neg = negligible. Capital costs are "moderate"marginal cost of supply. This long-run marginal estimates only.cost of supply is the cost of providing an additional Source: Repetto (1986)
unit of supply in the long-term. The financial mea-
44
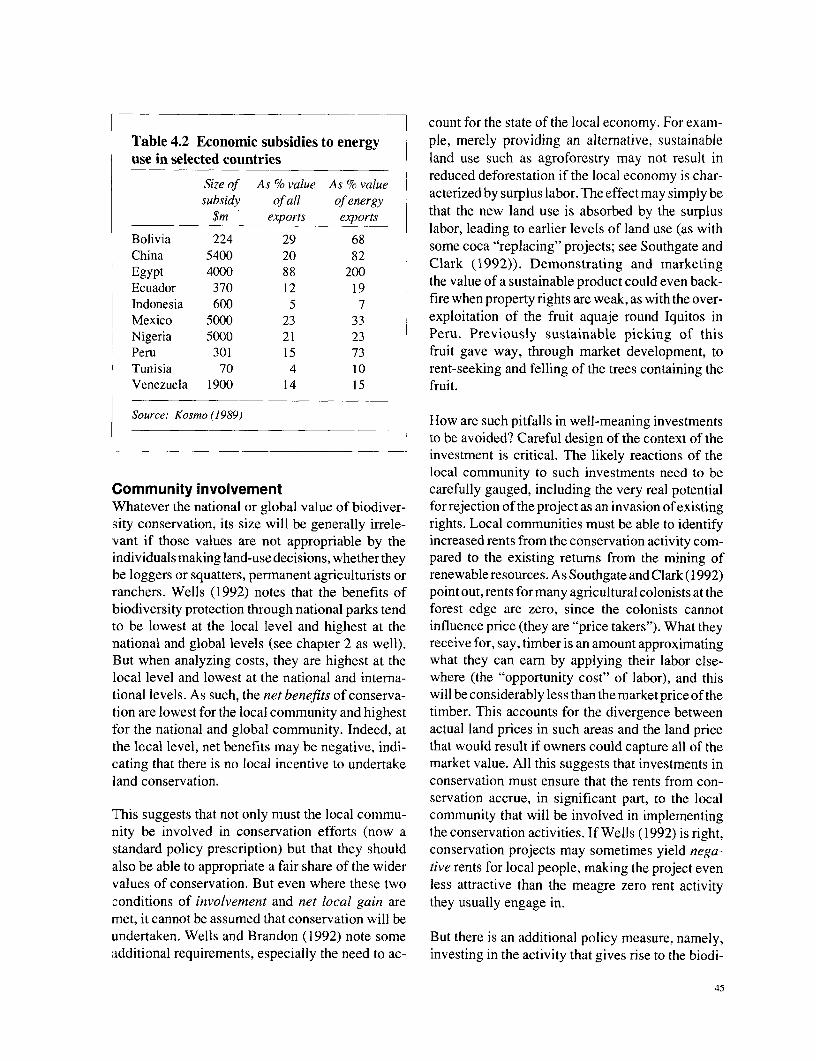
count for the state of the local economy. For exam-Table 4.2 Economic subsidies to energy ple, merely providing an alternative, sustainableuse in selected countries land use such as agroforestry may not result in
reduced deforestation if the local economy is char-
subsidy of alu As energy acterizedbysurpluslabor.Theeffectmaysimplybe$m exports exports that the new land use is absorbed by the surplus
labor, leading to earlier levels of land use (as withBolivia 5400 20 82 some coca "replacing" projects; see Southgate and
Egypt 4000 88 200 Clark (1992)). Demonstrating and marketingEcuador 370 12 19 the value of a sustainable product could even back-Indonesia 600 5 7 fire when property rights are weak, as with the over-Mexico 5000 23 33 exploitation of the fruit aquaje round Iquitos inNigeria 5000 21 23 Peru. Previously sustainable picking of thisPeru 301 15 73 fruit gave way, through market development, toTunisia 70 4 10 rent-seeking and felling of the trees containing theVenezuela 1900 14 15 fruit.
Source. Kosmo (1989) How are such pitfalls in well-meaning investments
to be avoided? Careful design of the context of theinvestment is critical. The likely reactions of thelocal community to such investments need to be
Community involvement carefully gauged, including the very real potentialWhatever the national or global value of biodiver- for rejection of the project as an invasion of existingsity conservation, its size will be generally irrele- rights. Local communities must be able to identifyvant if those values are not appropriable by the increased rents from the conservation activity com-individuals making land-use decisions, whether they pared to the existing returns from the mining ofbe loggers or squatters, permanent agriculturists or renewable resources. As Southgate and Clark (1992)ranchers. Wells (1992) notes that the benefits of pointout,rentsformanyagriculturalcolonistsatthebiodiversity protection through national parks tend forest edge are zero, since the colonists cannotto be lowest at the local level and highest at the influence price (they are "price takers"). What theynational and global levels (see chapter 2 as well). receive for, say, timber is an amount approximatingBut when analyzing costs, they are highest at the what they can earn by applying their labor else-local level and lowest at the national and interna- where (the "opportunity cost" of labor), and thistional levels. As such, the net benefits of conserva- will be considerably less than the market price of thetion are lowest for the local community and highest timber. This accounts for the divergence betweenfor the national and global community. Indeed, at actual land prices in such areas and the land pricethe local level, net benefits may be negative, indi- that would result if owners could capture all of thecating that there is no local incentive to undertake market value. All this suggests that investments inland conservation. conservation must ensure that the rents from con-
servation accrue, in significant part, to the localThis suggests that not only must the local commu- community that will be involved in implementingnity be involved in conservation efforts (now a the conservation activities. If Wells (1992) is right,standard policy prescription) but that they should conservation projects may sometimes yield nega-also be able to appropriate a fair share of the wider tive rents for local people, making the project evenvalues of conservation. But even where these two less attractive than the meagre zero rent activityconditions of involvement and net local gain are they usually engage in.met, it cannot be assumed that conservation will beundertaken. Wells and Brandon (1992) note some But there is an additional policy measure, namely,additional requirements, especially the need to ac- investing in the activity that gives rise to the biodi-
45

versity loss. While this may seem contradictory, raising agricultural productivity to reduce the moti-what is involved is raising the productivity of lands vation for land conversion.outside the areas where biodiversity is to be con-served through sustainable use activity or outright This approach also avoids or mitigates the difficultprotection. As chapter 3 showed, one of the funda- problem of choosing between biodiversity invest-mental forces at work in explaining land conver- ment projects-a basic concern for the GEF-for itsion is population growth and density. But the suggests that more will be achieved by agriculturaldemand for "new" land could be reduced by raising development, and fuelwood substitution technolo-the productivity of existing land through measures gies, than by protected areas. If the GEF is tosuch as agricultural investment, extension and irri- succeed in biodiversity conservation, conventionalgation. Instead of focusing solely on investment in development assistance needs to be strengthenedthe protected area, the focus should also be on with respect to the agricultural sector.
46

Summary and5 Conclusions
The economic value of biodiversity sible. This paper is primarily concerned with mo-Why conserve biodiversity? There are three poten- tives (b) and (c), motives for what we term econom-tial answers: ic valuation.
(a) The constituent parts of biological diversity The concept of economic valuehave some intrinsic right to exist, a value in Total economic value (TEV) can be broken downthemselves, independent of human valua- into use and non-use values, the latter being mea-tion. sured by a willingness to pay for conservation
(b) The erosion of biodiversity threatens the unrelated to any use, now or later, of the resource.well-being of the human race, regardless of Use values comprise direct uses (such as harvestingany intrinsic concept of value. and tourism), indirect use values (for example,
(c) Humans wish to conserve biodiversity, a habitats as carbon stores and watershed protectionwish they express through lobbying, a will- assets), and option values (an insurance premium toingness to pay, and so on. This valuation may ensure future use).be independent of any belief about intrinsicvalue or any risk assessment of biodiversity Of fundamental importance to GEF is the broaderosion. division of TEV into "domestic" and "global" val-
ues. The former accrue to individuals within theIn reality, human valuations of biodiversity are host-state, the latter to the rest of the world. Thus, atlikely to reflect all three motivations. Distinguish- any stage there is a potential eight-fold categoriza-ing between them can be complex, or even impos- tion of economic value, as in Table 5.1. GEF is
Table 5.1 Economic value classification
Use value Non-use valueDirect Indirect Option Existence
Domestic Harvesting Watershed WTP forprotection conservation in own
country, unrelated to use
Global Ecotourism Carbon WTP for conservationstore in other countries as revealed in
debt-for-nature swaps, etc.
47

concerned with (a) deterrnining global value; and (b) Land conversion is often subsidized through(b) seeking means whereby host countries can ben- direct grants for land clearance, subsidies forefit from global value. credit, agricultural inputs, and land purchase,
or through the maintenance of exaggeratedPreliminary investigations suggest that global val- prices for agricultural output. Land tenureue, particularly global indirect use value, and per- and resource rights are often ill-defined forhaps existence value, are large relative to the the sustainable uses of land, and may bedomestic returns from land conversion. Thus, car- made secure by the conversion process. Thebon storage values in tropical forests may be as high excess amount of land conversion that oc-as $500 to $2,000 per hectlare. curs because of these factors reflects govern-
mentfailure-inefficient interventions in theWhy are we losing biodiversity? marketplace by governments.Land-based biodiversity is being lost due to two (c) Some of the external benefits of sustainablefundamental forces: land use are global and are not captured by the
"owners" of land, whether this is the immedi-(a) Under-investment; and ate landowner or the government. Since these(b) Niche competition. global benefits (such as carbon storage) are not
under the control of the nation-state, they areThese forces are different for land and water. Many not appropriated, and hence do not appear as awater resources are open access resources, not be- domestic benefit to land conservation.ing owned by anyone. The traditional "tragedy ofthe commons" argument does much to explain the These domestic market, global market, and govern-loss of international water--based biodiversity. ment failures help to explain why the rate of return
to sustainable uses of land is below the rate of returnBut land-based resources share the open access to land conversion. There is no level playing fieldfeatures of water only because nation states choose between conservation and conversion.not to invest in those resources. All land-basedresources have state "owners." International waters Niche competitiondo not always have owners. To explain land-based The sheer expansion of human numbers has andbiodiversity loss, then, we need to explain under- will place pressure on the available unconvertedinvestment in biodiversity. land. Combined with under-investment in conserved
habitats, and hence in biodiversity, niche competi-Under-investment tion produces a fairly relentless demand for landThis arises because the "rate of return" to conserva- conversion. Statistical analysis tends to support thetion and sustainable use is less than the rate of return significant role of population density as a factorto land conversion. This is so for three reasons: explaining conversion and, to a lesser extent, pop-
ulation growth. But other factors are also at work,(a) Even where there are no deliberate attempts including national indebtedness to some extent, and
to distort the functioning of markets, and certainly income growth.where there is no global value, some landconversion beyond the socially desirable Towards a biodiversity policyamount will occur. This is due to market Once the causal factors giving rise to biodiversityfailure-thefailureofmarketstoaccountfor loss are put together in this overall picture, thethe side effects of the land conversion, such directions for policy to slow the rate of biodiversityas downstream sedimentation and loss of loss become clear, though complex to implement:biodiversity. The true rate of return to landconversion is less than the perceived rate of (a) Continued efforts to slow population growthreturn (in economics jargon, externalities need to be emphasized so as to reduce thehave been ignored). competition for available niche space.
48
(b) A major focus needs to be on measures which play with respect to niche competition due to pop-change the rates of return to land use, upwards ulation growth. Policies to control population growthin the case of biodiversity and downwards in are of the utmost importance but lie within the remitthe case of conversion. There are many mea- of existing national government policies assisted bysures which can be employed: international agencies. The focus of GEF activity
therefore has to be on under-investment in land uses* Continued pressure on domestic governments to to conserve biodiversity, and that focus has to be
reduce and remove economic distortions such as within the context of nation-state priorities andconversion and input subsidies, and guaranteed conservation strategies.output prices. While some subsidies reflect delib-erate policy to meet the needs of the poor, many All nations-states attenuate the use of land in oneare not targeted in this way and accrue to the way or another. As far as its biodiversity activitieswealthier classes of society. are concerned, the GEF has so far operated mainly
* Land registration, titling and resource rights for by raising the rate of return to protected areas. Itthose practising sustainable land use. conserves existing protected areas by reinforcing
* Mechanisms to capture the global benefits of sus- existing zoning policies, which in turn attenuate thetainable land uses. Various candidates here are: development uses of land. For a totally protected
area, the development uses are totally or near-(i) Global Environment Facility: the return to totally attenuated. In order partly to compensate for
conservation investment projects is inflated foregone development values, the rate of return toto reflect the global benefits they generate. protection is raised through global transfers of re-
(ii) Franchising agreements: land use is restricted sources to pay for the costs of protection. Thein return for payments from some internation- payment is not a subsidy, but a transfer in return forally agreed fund. Various forms of franchis- which the rest of the world secures a benefit in theing agreements are possible. form of conserved globally important biodiversity.
(iii) Debt-for-nature swaps. In this mode, GEF is, in terms of Figure 5. 1, in fact(iv) Tradable Development Rights (TDRs): do- executing an internationalfranchise agreement.
mestic or international purchasers might buydevelopment rights to zoned land in a given One issue that arises, then, is the extent to whichcountry. In exchange for payment, land users GEF should extend its activities to preventing fu-in conservation zones forego the right to de- ture land conversions that would not be justifiedvelop the land in a manner inimical to biodi- through a full global cost-benefit appraisal. As anversity conservation. The price of the TDRs example, consider the forces giving rise to futurethus reflect the foregone value of converting deforestation, or future drainage of wetlands, or thethe land-the "opportunity cost" of conserva- ranching of wildlands. The rationale for this kind oftion. As discussed in chapter 4, purchasers intervention is two-fold:may be governments, but could more interest-ingly be environmental organizations and the (a) GEF is currently the only international fundprivate sector. that seeks to capture global benefit;4 and
(b) It may be a very cost-effective way to con-A schematic summary serve biodiversity.Figure 5.1 summarizes the essential features of thisreport, and shows the links between valuation, cau- Indeed, there is evidence to suggest that, in Southsation of biodiversity loss, and remedial measures. America at least, significantly less land conversion
would occur if investments were targeted not at pro-The role of the Global Environment Facility tected areas, but at the areas outside protected areas.Figure 5.1 shows the context in which the GEF Southgate (1991) has shown that raising agriculturaloperates. Clearly, the GEF has a very limited role to productivity could significantly reduce the drive by
4 Debt-for-nature swaps do this but are piecemeal and financially very small compared to the GEF.
49

Figure 5.1 Schematic summary of factors affecting global biological diversity
; CAUSES OF BIODIVERSITY LOSS
NICHE UNDER-INVESTMENT IN SUSTAINABLE LAND USECOMPETITION i i i
MARKET GOVERNMENT GLOBALFAILURE FAILURE BENEFITS
FAILURE
r-----------------------------_-____
POPULATIO I ECONOMIC VALUATION (TEV)POPULATION -- - - - - - - -- - - - - - - --- _____________
GROWTH 4 4 _ _ _
ESTIMATE ESTIMATE ESTIMATEDOMESTIC BENEFITS OF GLOBAL
"EXTERNALITY" REMOVING EXTERNALITYDISTORTIONS
"CARBON"EXISTENCE STORE
VALUE" VALUE"
; ,_ ____ ____ ____ ___.___-------- ,--- - -- -- -
POLICY
I_ + - - - - - - - - - - - - - - - - - - - 1 ' - - - - -POPULATION _____
POLICY LOCAL ENVIR. CORRECTTAXES; DISTORTIONS; THE
ZONING and REMOVE GEFLOCAL TDRs SUBSIDIES, ETC
INTERNATIONAL FRANCHISE AGREEMENTS
DEBT-FOR-NATURE INTERNATIONALSWAPS TRADABLE
DEVELOPMENT RIGHTS
so

agricultural colonizers to expand into forested areas. (b) GEF projects are designed to capture globalSuch a policy fits the under-investment hypothesis benefits, so the idea of seeking conditions forsince it addresses the fundamental disparity between resource transfers to benefit the donors seemsthe rate of return to colonizers from land conversion contradictory.and existing land intensification. But such projects aremore typically the province of conventional develop- Finally, there is the important question of otherment aid. They may also generate a "magnet" effect by roles for the GEF. It seems clear that the mostattracting inward migration which would then threaten effective way forward for the GEF is to evolve awaythe forest areas. from being only a project focused agency. GEF
funding is unlikely to be at levels where majorHow far such a suggestion would change the remit of contributions to biodiversity conservation can bethe GEF is not clear. Raising agricultural productiv- made. But the GEF can leverage other funds, and itity in buffer zones would fit into a general conserva- can act as a broker for other forms of transfer suchtion strategy, but more generally raising agricultural as international tradable development rights andproductivity on degraded lands as a focus of a project international franchising agreements.is less likely to figure in the GEF portfolio. In thePilot Phase, few projects have appeared to empha- As noted in chapter 4, there are several reasons whysize the preventive approach. In GEF II, the fully purely private sector transfers could take place tooperational phase, with its greater emphasis on cost- conserve biodiversity. In these transfers, the GEFeffectiveness, it is arguable thatthis imbalance should could act as a monitoring, brokerage and authenti-change. At the very least, the relative cost-effective- cation agency, thereby widening its role and be-ness of the existing-areas focus versus the projected- coming more central and more effective inland-conversion focus needs to be explored. international efforts to conserve biodiversity. But
any new role, for example, in relation to franchiseThe role of GEF in seeking to change economic agreements, could involve conditionality. The pay-distortions also raises difficult questions. By and ment of the "global premium," say annually, by thelarge, "conditionality" clauses in conventional aid franchisee, would be conditional on evidence thatprograms cover the more obvious examples, and the agreed attenuation of land use had been hon-the:ir controversial nature must be acknowledged. ored. The conditionality would thus be between theThere are at least two reasons why the GEF need not recipient of the premium, the nation-state and theconsider conditionality as part of its project evalua- agent to whom the franchise is let. The GEF couldtioii procedure: act as the authenticating agent to ensure that the
agreement is being honored (on both sides).(a) GEF projects tend to complement existing
aid projects, so that they have limited "standalone" features; and
51

CO,
CD
Independent Variables O
CD (PDependent Population Agricultural Extemal ____
Study Type of Analysis Variable Population Density Income Productivity Indebtedness Other Significant Variables .a_ _ _ _ _ _ _ _ _ _ _ _ _ _ _ _ _ _ _ _ _ _ _ _ _ _ _ _ _ _ _ _ _ _ _ CD X~~~~~~~~~~~~~~~~~~~~~~~~~~~D
U) X
I. Shafik, the causes of annual rate of def. investment rate- C1992b deforestation for a 1962-86 positive c)
sample of 66 electricity tariff- Ocountries negative
trade shares in GDP- mnegative 0political rights- fpositive lcivil rights- 3Dpositive CD
2. Burgess, def. in 53 tropical five-year change, negative (real GNP per roundwood production per capita,1992 countries using 1980-85, in closed 0.01 capita in 1980) 1980- C
cross-sectional forest area. negative, 0.05. Canalysis. positive the log of closed forest area as a
0.05 percentage of total forest arca inon1980-positive, 0.05
3. Burgess, sdes.in4 of the rmodel i. (hea pop. growth)(GDPper (debt-service totalgrculdwood porroduction-1991C major tropical negative capita) ratio as a % of positive, 0.05 C
forest countries level of def. 0.05 positive exports)using cross- 0.05 positive psectional data. 0.05 0
model 2. negative positive food production per capita-0.01 0.10 positive, 0.10
level of def. total roundwood production-positive, 0.05.
4. causes of growth in the area pop. growth negative agricultural export growth-Southgate, agricultural used to produce positive 0.01 positive, 0.051991d colonization in 23 crops and livestock. 0.01
latin Americancountries.
5. Kahn & develop model to def. area (1000 ha) negative positive forested land area-McDonald, show economic 0.017 0.01 positive, 0.011 990C mechanisms by (significant annual change in public extemnal
which debt may alpha level), debt-lead to def.pp sda positive, 0.05
proxy for thelabour force

_ ~~~~~~~~~~~~~~~~~lindepen-dernt Variables
Dependent Population Agricultural ExternalStudy Type of Analysis Variable Population Density Income Productivity Indebtedness Other Significant Variables
6. global economic model 1: (per capita) (debt-service log export value-
Capistrano influences on def. (the area of positive ratio) positive, 0.01, P. 1.& Kiker, tropical closed closed broad- 0.01 real devaluation rate--
1990f broad-leaved leaved forest positive, 0.05, P.3&4.forest depletion, depleted by P.(perioe) 2 cereal self-sufficiency ratio-
1967-85. commercial positive, 0.01, P. 2.logging).
model 2. positive negative log export value-0.05 0.05 positive, 0.0 1, P. 1.P.3 P. 2 agri. export price index -
positive, 0.05, P.2.real devaluation rate -positive, 0.01, P.3 /0.05 PA4cereal self-sufficiency ratio-positive, 0.01, P.2 / 0.05 P.3.arable land per agriculturalcapital-positive, 0.01, PA4.
model 3. positive positive negative 0.05 log export value-0.05 0.01 P.2 positive, 0.01, P. 1.P.2 P.2 agricultural export price index-
positive, 0.05, P.2.real devaluation rate-positive, 0.05, P. 3.cereal self-sufficiency ratio-positive, 0.01, P.2 / 0.05, P.3.arable land per agriculturalcapita-positive, 0.01, P. 4.
7. Rudel, decline in closed average annual pop. growth GDP per forest land area-
1989e tropical forests for decline in hectares positive, 0.001 capita. positive, 0.001.36 countries of a country'sacross Africa, tropical forests (rural pop. positiveAsia and Latin during the period growth, positive, 0.01America. 1976-80 0.01)
8. Paulo, cross-sectional absolute forest negative. food production per capita-
Mery & test of factors cover in 1980. 0.01 negative, 0.01
Salmi, 1987 influencing share of forest fallow-deforestation in 72 positive, 0.1
countries. agri. area coverage-negative, 0.1

Independent Variables
Dependent Population Agricultural ExternalStudy Type of Analysis Variable Population Density Income Productivity Indebtedness Other Significant Variables
9. Allen & def. between model 1: annual pop. growthBames. 1968-78 in 39 change in forest negative1985h countries in areas. 0.10
f-i:ca, LatiiAmerica andAsia.
model 2: the logarithm of % of forest coverdecade change 1986-in forest area, positive, 0.10.1968-78. the % area under plantation crops
in 1968-negative, 0.05per capita wood fuels consumptionand wood exports in 1968-negative, 0.05
10. Lugo, def. in all greater % forest cover negative energy use per unit area-Schmidt & Caribbean 0.001 positive, 0.001Brown, countries.1981
11. Reis & Brazilian Amazon def. density. positive cattle herd-Guzman, deforestation and 0.001 positive, 0.051992i its contribution to logging-
C02 emissions. negative, 0.01.
12. Katila, def. in Thailand relative forest negative negative wholesale price of construction1992i cover by country 0.01 0.05 timber-
negative, 0.01.
13. def. rates in relative forest negative GDP per capita positive time-Constantino Indonesia. cover. 0.01 positive 0.01 negative, 0.01& Ingram, 0.05 (rice production1991K used as a proxy)
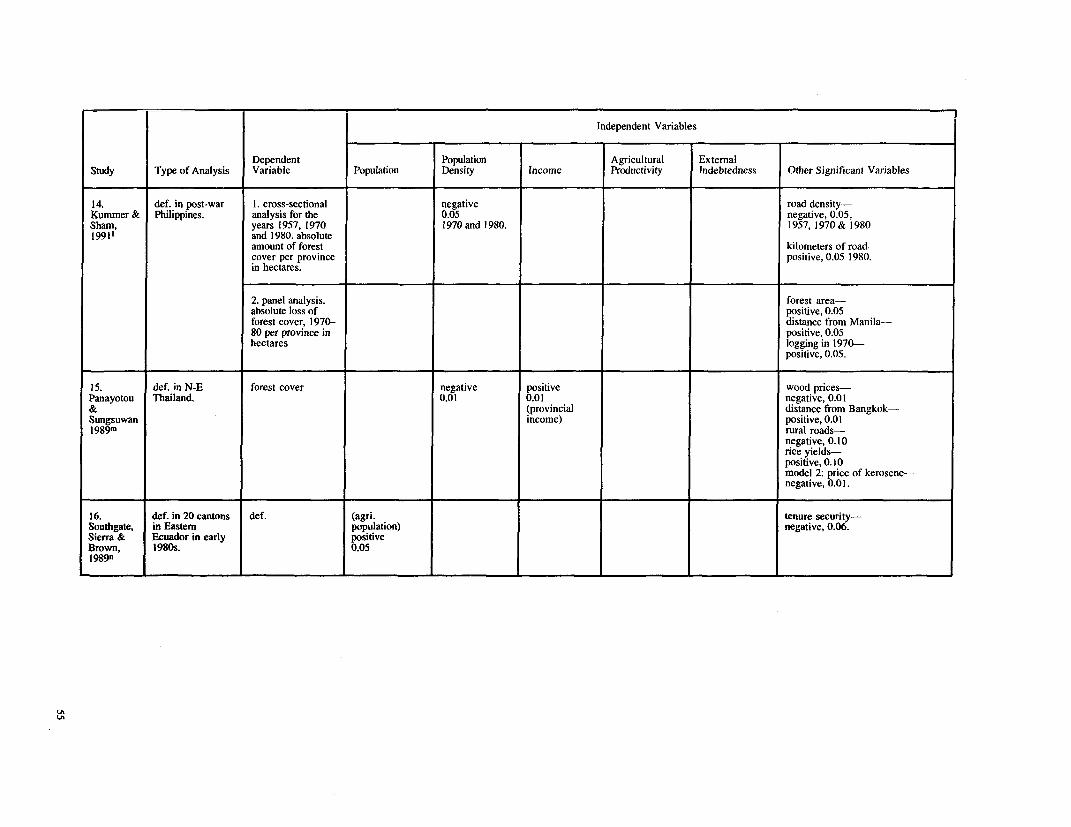
Independent Variables
Dependent Population Agricultural External
Study Type of Analysis Variable Population Density Income Productivity Indebtedness Other Significant Variables
14. def. in post-war 1. cross-sectional negative road density-
Kummer & Philippines. analysis for the 0.05 negative, 0.05,
Sham, years 1957, 1970 1970 and 1980. 1957, 1970 & 1980
19911 and 1980. absoluteamount of forest kilometers of road-
cover per province positive, 0.05 1980.
in hectares.
2. panel analysis. forest area-
absolute loss of positive, 0.05
forest cover, 1970- distance from Manila-
80 per province in positive, 0.05
hectares logging in 1970-positive, 0.05.
15. def. in N-E forest cover negative positive wood prices-
Panayotou Thailand. 0.01 0.01 negative, 0.01
& (provincial distance from Bangkok-
Sungsuwan income) positive, 0.01
1989m rural roads-negative, 0.10Orice yields-positive, 0.10Omodel 2: price of kerosene-negative, 0.01.
16. def. in 20 cantons def. (agri. tenure security-
Southgate, in Eastern population) negative, 0.06.
Sierra & Ecuador in early positiveBrown, 1980s. 0.051989n
LA

Notes repeated with deforestation; debt and forestland area are defined in per capita terms
a Presentation: studies explaining deforestation (results not shown in the table). In the scaledglobally are listed first (entries 1-9), followed by regression, the public debt variable is thecountry and regional studies (entries 10-15). The most significant behavioural variable.sign, i.e., positive or negative, and significancelevel, where available, is indicated for each signif- f 1. Three linear models are estimated:icant independent variable. * Model 1: OLS
* Model 2: a fixed effect model with theb Panel regressions are used to test three models- same explanatory variables as model 1,log linear, quadratic and cubic. Shafik estimates but with an intercept term allowed to varyboth the annual and total measures of deforestation by regions, income class and intemation-(only annual deforestation results are presented). al credit standingHe concludes that per capita income has virtually no * Model 3: intercept is constrained to beexplanatory power, staLtistically speaking, in both equal for all subgroups.cases regardless of the functional form. (Per capitaincome is defined as real per capita gross domestic 2. The period 1967-85 is divided into fourproduction in terms of purchasing power parity.) subperiods:
* Period 1: 1967-71 -the waning years ofc 1.Model 2 includes two dummy variables to the system of fixed exchange
capture possible regional differences between * Period 2: 1972-75-started with grainAfrican, Asian and Latin American coun- shortages, saw oil price increases andtries. credit expansion, and ended with reces-2. Food production is used as a proxy for sionfood demand. * Period 3:1976-80-booming commodi-
ty prices led to slow economic recovery,d Explores the possibility that deforestation in conditional lending and the second roundLatin America is symptomatic of agricultural un- of oil price increasesderdevelopment. Southgate argues that since prop- * Period 4: 1981 -85---deep recession anderty arrangements oblige agricultural colonists to painful adjustments as developing coun-pay scant attention to the value of tree covered land, tries staggered under the burden of debt.the option of using the ratio of cleared area toremaining forest makes little sense. The growth in 3. Period 1: tropical wood was the mostthe area used to produce crops and livestock is significant variable, explaining more than 85therefore chosen as the appropriate dependent vari- percent of forest depletion.able for causal analysis of frontier expansion. Period 2: cereal self-sufficiency ratio and the
e 1. Results shown are for 1981-85 data. debt service ratio were the most significant
2. The negative coefficient for population, variables.used as a proxy for labour input, stems from Period 3: real devaluation rates had the stron-the authors' definition for GNP. A greater gest statistical relationship to forest deple-labour force leads to a higher GNP, thus tion.reducing the need to deforest to meet current Period 4: expansion of arable land had theconsumption needs. strongest influence on forest.3. The regression results show a strongrelationship between debt and deforestation. Results suggest that population has had a less directTo eliminate the possibility that this mightbe impact on deforestation than macroeconomic vari-a function of country size and not a real ablescbehavioural relationship, the regression is
56
g The results shown are weighted by the size of a deforestation. Kummer argues that forest cover can-country's closed forest area. This procedure makes not be used as a dependent variable when analyzingequal units offorest area, belonging in varying propor- ongoing deforestation because it cannot capture thetions to different nations, the unit of analysis. GNP dynamic nature of tropical forest removal. The cross-explains a substantial amount of the variation in the sectional analysis is therefore not concerned withweighted analysis, but fails to show much variation in deforestation per se, but with the relative absolutethe unweighted analysis (results not shown). Rudel forest cover at one point in time with the hypothesizedargues that the results demonstrate the importance of independent variables. The panel analysis is, howev-capital availability, GDP, on the deforestation of large er, directly concerned with deforestation since theforests throughthefunding ofcapital intensiveprojects. dependent variable is the absolute change in forestIn countries with small scattered rainforests, encroach- cover. Results for the Philippines are said to supportment by growing rural population is more relevant to this by the fact that the cross-sectional and panelthe deforestation process. analyses yield such different results, with none of the
independent variables in the panel analysis appearinghi 1. In model I the coefficient for change in in the cross-sectional equation.
arable land is not significant. However, the The panel analysis cannot support the contention thatauthors observe that the bivariate correlationghscroathis population growth is one of the leading causes ofcoefficients show that population growth IS deforestation.related to agricultural expansion, which is intun related to deforestation. This relation m Two models are estimated to account for the highdoes not show up in the multivariate analysis multi-collinearity between kerosene price, crop pricesince controlling for population suppresses and the price of wood. Model 1 includes the price ofthe negative correlation between arable land wood and crops, and model 2, the price of kerosene.and forest loss; they therefore conclude that The difference in the explanatory power of the modelsboth population growth and change in arable was found to be minimal. While the results for modelland are associated with deforestation. 1 are presented in the table, the significance of the
price of kerosene coefficient is noted. In model 1,2. Model 2 IS specified im order t capture the population density emerges as the single most impor-
possibledelayed impact of harvesting forests tant cause of deforestation, followed by the price offor fuelwood and wood exports on the rate of logs and the distance from Bangkok.deforestation. While the coefficient per cap-ita wood is not significant in the first model, n Under the hypothesis that settlement in tree cov-it is in the second, suggesting that deforesta- ered hinterland is stimulated by the prospect of captur-tion is significantly related to population ing agricultural rent, the authors first examine thegrowth and agricultural expansion in the relationship between rural population pressure (agri-short term, and with wood use (fuelwood and cultural population) and the factors affecting agricul-wood exports) in the long term. tural rent, the scale of the urban population as a proxy
Population was found to be insignificant. for the local demand of agricultural commodities, soilquality, and road accessibility. Deforestation is then
Study concludes that population density is the regressed against agricultural population and an indexof relative tenure security among cantons.
most important cause of deforestation in Thailand.
k The time trend is used to capture the effects notaccounted for, more specifically the cumulativeroads built.
The panel analysis does not support the contentionthat population growth is one of the leading causes of
57

Appendix 11
Resource Franchise Agreements
Chapter 4 notes various forms of international re- the logs but also the value of the successive uses of thesource franchise agreements. In each case, the general land for crops and ranching, since the logger can "on-principle is that land use is reduced in a given zoned sell" the land to the agriculturist, and so on. If marketsarea in return for the payment of a premium. If all land do not work well, the premium may be difficult touses other than protective ones are forbidden, the assess.premium is equal to a rental on the land, and the donoreffectively pays the rent on the land. In tum, this rent Who would buy such development rights? Panayotouwould be approximately equal to the rental that the (1992) indicates that the international markets wouldland would command in some developmental use- be local and international environmental organiza-technically the "highest" sustainable use value. If only tions, govemments, corporations and the scientificsome land uses are forbidden, then the premium will community (who would effectively buy the informa-tend to converge towards the differential returns that tion value of the site). The motives for such purchasesland could have earned in the absence of reduced use. would vary:
Several franchise-type agreements have been dis- (a) Environmental groups would be expressingcussed in the literature (Sedjo 1988, 1991; Panayotou their non-use ("existence") value for the sites;1992; Katzman and Cale 1990). The importance of (b) Governments might be expressing some exist-intemational trading in such land-use rights ("devel- ence value on behalf of their populations, butopment rights") is that it offers a means of capturing would certainly be the likely agents for express-the global premium, the willingness to pay of the rest ing the global indirect use values such as carbonof the world foranation's conservation. If all develop- storage in forests; andment is restricted, the minimum supply price should (c) Corporations might be motivated in severalapproximate the development value of the land since ways:this is what is surrendered with the franchise agree-ment. If only some uses are restricted, the minimum * Pursuing the tropical forest example, they mightsupply price should be the difference between the purchase conservation rights to forests in order tooverall development value and the returns obtained by secure offsets to increased CO2 emissions else-operating the restricted uses. The demandprice will be where, the offset being required because of somedetermined by the global willingness to pay for the national CO2 control target under the Climate Con-global benefits. Chapter 2 suggested that for carbon, vention ("joint implementation").5
this demand price might be several times the total * They might wish to buy "exotic capital" to further adevelopment value. This picture will, however, be green image domestically or internationally.influenced by discount rates. The global premium will * Some might wish to buy use rights to, say, pharma-be a regular payment, say annually, since it has to be ceutical material.conditional on performance. But the developmental * As Panayotou (1992) notes, they might also wish toland use value could be based on, say, clear felling the speculate on the growth in the value of the tradablesite in a single year. It is therefore the resource owner's development rights (TDR) as the "demand for con-discount rate that will be relevant when making this servation" grows, that is, simply hold TDR for theircomparison between a stream ofannual premiums and asset value. The "carbon credit" value of a forestthe development value of the land. The issue is com- should also grow if carbon taxes in the developedplicated by the potential for successive uses of the world rise over time.land. Consider the "nutrient mining" sequence in a The incentives to sell therights would be straightfor-tropical forest (Schneider 1 992). If markets work well, ward. It would pay the owner-state to sell anya logger seeking a few trees on a given hectare should development right for a price higher than the fore-pay for the land a price reflecting notjust the rental ontn ~~~~~gone development value.
There is a complication here. An offset could involve a growing forest to fix Co2 released in the original country. Purchase of existingforests in carbon equilibrium begs the question of what wouldhave happened if the developmentrights had not been purchased. Unless there is somecertainty that the area would have been deforested there is no effective offset. One approach to this problem would be for an agency, such as theGEF, to determine the likelihood of "development." The potential for gains from threats should not, however, be overlooked.
58

Appendix III
Incremental Costs
This appendix outlines the basic elements of the This means the GEF may intervene to finance themeasurement of incremental cost. It is important to project provided the global benefits exceed the netunderstand that, in practice, estimating incremental cost to the nation if the nation had funded thecost is complex and must be adapted to the context project. The amount Cd - Bd is the incrementalof the institution and country in question. cost.
We distinguish two contexts: a simple one in which What flows of funds are associated with this case?the country in question has only one choice oftechnology, and a more complex one in which there (i) The country pays some of the cost since itis a choice of technologies. "Technology" here gets abenefitBd, butit does notpay all of theneeds to be interpreted broadly. In the context of cost (otherwise it would have no interest ingreenhouse gas control, it can refer to an energy the project). The limit to the country's con-source or to a carbon sink. In the context of the tribution is given by Cd less GEF's contribu-ozone layer, it refers to substitutes for chlorofluoro- tion which is Cd - Bd. So the country'scarbons (CFCs). In the international waters context, contribution is less than Cd - (Cd - Bd) = Bd.it may refer to different options for controlling (ii) GEF pays, in the limit, Cd -Bd, which is thewaste; and in the biodiversity context it will refer to incremental cost.different ways of meeting a given protection objec-tive. This context is likely to define many of the biodiver-
sity projects for GEF. Essentially, they will beNotation projects where the country finds that the benefits toIn what follows we use C for cost; B for benefit; d itself from conservation are not sufficient to justifyfor domestic or national; and g for global, where conservation. Hence it will not proceed withoutglobal means the rest of the world. IC is incremental GEF intervention. GEF must be satisfied that:cost, and 8 means "difference in."
(a) Domestic benefits are not greater than do-Simple case: single technology mestic costs; andIn the simple case there are two possibilities: (b) Global benefits exceed the incremental cost.
(a) Bd > Cd Multiple technologiesCases where a country has several choices of tech-
In this case, the domestic benefits exceed domestic nology may be less relevant to biodiversity, but thecosts-prima facie, therefore, the GEF would not analysis of incremental cost is not complete withoutbe: involved in financing the project. The country an assessment of this issue. Economic rationalitysecures net gains by investing in the project itself or from the country's standpoint dictates that it willthrough conventional development aid sources. choose the least-cost technology. But this may notHowever, if there are major global benefits associ- be the most beneficial technology in terms of theated with this investment, it might qualify for GEF global environment. For example, in the globalintervention as a Type I project. warming context, the country may be able to bum
coal or import gas. The coal is cheaper than the gas(b) Cd > Bd but emits higher amounts of CO . When should
GEF intervene?In this case, the country in question will not investin the project since it secures net losses to the Let Cdo be the cost of the technology 0, and let thiscountry. But if there are significant global benefits, be the "cheap" technology. Let Cdl be the cost of theGEF may wish to intervene. The requirement for its more expensive but more globally beneficial tech-intervention is then: nology. Now the condition for GEF intervention is:
Bg > (Cd -Bd) ... [I] Bg > (Cd, -Bd) ... [2]
59

This means that the global benefits must now ex- the two technologies (C) but that difference less theceed the net costs to the nation of adopting the more net benefits the country would have got from pro-expensive technology. ceeding with the less clean technology. The intuition
here is that the GEF should not be paying anyway forLet Cd, - Cdo = oC, which is the difference between the net benefits the country would have got.the costs of the two technologies. Then the require-ment for intervention can be expressed as: What now are the resource flows?
Bg > (Cdo + oC - Bd) ... [3] (a) The total cost of the project is Cd, and theGEF would pay, in the limit, the amount this
or Bg > ([Cdo - Bd] + 6C ... [4] cost less an estimate of the benefits accruingto the nation; and
This is the same requirement as for the simpletechnology case, but the term oC is added. (b) The country would pay up to Cd, - (Cd, - Bd)
= Bd, the benefits that it would obtain.The whole expression on the right hand side is theincremental cost, IC. The results are thus similar in form to the simple
case.If Cdo exceeds Bd the country will not proceedanyway, and since Cd, > Cdo, it will not be interest- Of course, the preceding analysis assumes that ben-ed in the globally cleaner technology either. So the efits and costs are measured in the same units (suchonly context of interest is the one where Bd > Cdo, as money) and this will not always be possible. Inbut Bd < Cd,. That is, in its own interests, the some contexts, especially biodiversity and intema-country will proceed with the less globally benefi- tional waters, monetary assessment of benefits willcial technology and will not choose the more bene- be very limited. Hence a significant judgmentalficial technology. But this means that Bd > Cdo, in element will enter into the assessment of incremen-which case the first term on the right hand side of [4] tal cost since, as shown above, it must always in-is negative. The implication is that GEF should not volve an assessment of the domestic benefits.seek to fund the complete difference in the costs of
60

Bibliography
Allen, J., and D. Barnes. "The Causes of Deforestation in Developing Countries."Annals of the Association ofAmerican Geographers, 1985.
Antonovic, J. "Genetically-Based Measures of Uniqueness." In The Preservation and Valuation of GeneticResources, ed. G.H. Orians, et al. Seattle, Washington: University of Washington Press, 1990.
Arrow, Kenneth, et al. Report of the National Oceanic and Atmospheric Administration on ContingentValuation. Washington, D.C.: National Oceanic and Atmospheric Administration, 1993.
Balick, M.J. and R.O. Mendelsohn. "Assessing the Economic Value of Traditional Medicine from TropicalRainforests," Biodiversity Conservation 6, no. 1 (1992).
Barbier, E. et al. Economic Valuation of Wetland Benefits: The Hadejiia-Jama'are Floodplain, Nigeria.London: London Environmental Economics Centre, Paper 91-02, 1991.
- . Elephants, Economics, and Ivory. London: Earthscan, 1990.
Barnes, J. Wildlife Values. Botswana: Department of Wildlife and National Parks, 1990.
Baiteman, Ian, and R.K. Turner. "Valuation of the Environment, Methods and Techniques: The ContingentValuation Method." In Sustainable Environmental Economics and Management: Principles andPractice, ed. R.K. Turner. London: Belhaven Press, 1993.
Bennett, J. "Using Direct Questioning to Value Existence Benefits of Preserved Natural Areas." Toowoomba,Australia: School of Business Studies, Darling Downs Institute of Education, 1982.
Bergstrom, J., et al. "Economic Value of Westlands-Based Recreation." Ecological Economics 2, no. 2 (June1990): 129-148.
Bibby, C.J., et al. Putting Diversity on the Map: Priority Areas for Global Conservation. Cambridge:International Council for Bird Protection, 1992.
Boyle, K., and R. Bishop. "The Total Value of Wildlife Resources: Conceptual and Empirical Issues." Paperpresented to the Association of Environmental and Resource Economists, Boulder, Colo., May 1985.
Brookshire, David S., et al. "Estimating Option Prices and Existence Values for Wildlife Resources." LandEconomics 59 (1983): 1-15.
Browder J. Public Policy and Deforestation in the Brazilian Amazon. In Public Policies and theMisuse ofForestResources, ed. R. Repetto and M. Gillis. Cambridge, Mass.: Cambridge University Press, 1988.
Brown, J. "Species Diversity." In AnalyticalBiogeography, ed. A. Myers and P. Giller. London: Chapman andHall, 1988.
Brown, G., and J. Goldstein. "A Model forValuingEndangeredSpecies."JournalofEnvironmentalEconomicsand Management 11 (1984): 303-309.
Brown, G., and W. Henry. "The Economic Value of Elephants." London Environmental Economics Centre,Discussion Paper 89-12, London, 1989.
61

Burgess, J. "Economic Analyses of Frontier Agricultural Expansion and Tropical Deforestation." Master ofScience dissertation presented to University College, London, 1991.
"Economic Analysis of the Causes of Tropical Deforestation." London Environmental EconomicsCentre, Discussion Paper 92-03, London, 1992.
Capistrano, A., and C. Kiker. Global Economic Influences on Tropical Broadleaved Forest Depletion.Washington, D.C.: World Bank, 1990.
Carter, K. et al. "Economic and Socioeconomic Impacts of the Crown of Thorns Starfish on the Great BarrierReef." Report to the Great Barrier Reef Marine Park Authority, Institute of Applied EnvironmentalResearch. Brisbane, Australia: Griffith University, 1987.
Child, B. Assessment of 'Wildlife Utilization as a Land Use Option in the Semi-Arid Rangelands of SouthemAfrica. In Living with Wildlife-Wildlife Resource Management with Local Participation in Africa,ed. Agnes Kiss. Washington, D.C.: World Bank, 1990a.
Economic Analysis of Buffalo Range Ranch. In Living with Wildlife-Wildlife Resource Managementwith Local Participation in Africa, ed. Agnes Kiss. Washington, D.C.: World Bank, 1990b.
Child, G. Managing Wildlife for People in Zimbabwe. In National Parks, Conservation and Development, ed.J. McNeely and K. Miller. Washington, D.C.: Smithsonian Institution, 1984.
Clark, C. "Profit Maximization and the Extinction of Animal Species." Journal of Political Economy 81 no. 4(1973): 950-j1.
"Tbe Economics of Overexploitation." Science 181 (1973): 630-634.
MathematicalBioeconomics: The Optimal Management ofRenewable Resources. 2nd ed. New York:John Wiley, 1990.
Cline, W. The Economics of Global Warming. Cambridge, Mass.: Cambridge University Press, 1992.
Conrad, J. "Quasi-Option Value and the Expected Value of Information." Quarterly Journal of Economics 94(1980): 13-20.
Conrad, J., and C. Clark. Natural Resource Economics. Cambridge, Mass.: Cambridge University Press, 1987.
Constantino, L., and D. Ingram. Supply-Deemand Projectionsfor the Indonesian Forestry Sector. Jakarta: Foodand Agriculture Organization, 1990.
Constanza, R., et al. "Valuation and Management of Wetland Ecosystems." Ecological Economics 1, no. 4(1989): 335-362.
Cooper, D., et al., eds. Growing Diversity: Genetic Resources and Local Food Security. London: IntennediateTechnology Publications, 1992.
62

Coulson, I.M. Tsetse Fly Eradication in Matusadona National Park-Integrated Environmental Planning toReduce Conflicts with Conservation and Tourism. Harare, Zimbabwe: Department of National Parksand Wildlife Management, 1991.
Cumming, D., et al. African Elephants and Rhinos: Status Survey and Conservation Action Plan. Gland,Switzerland: International Union for the Conservation of Nature and Natural Resources, 1987.
Dahle, L., et al. Attitudes Towards and Willingness to Pay for Brown Bear, Wolverine and Wolf in Norway.Department of ForestEconomics, Agricultural University of Norway, Report 5/1987 (in Norwegian),1987.
Daly, H., ed. Toward a Steady-State Economy. 2d ed. Washington, D.C.: Island Press, 1992.
Danielson, L.E., and J.A. Leitch. "Private Versus Public Economics of Prairie Wetland Allocation."Journal ofEnvironmental Economics and Management 13, no. 1 (March 1986).
Dasgupta, P. "On the Concept of Optimum Population." Review of Economic Studies Vol. 36, no. 3, no. 107(1969): 295-318.
The Control of Resources. Oxford: Blackwell, 1982.
Dasgupta, P., and G. Heal. "The Optimal Depletion of Exhaustible Resources." Review of Economic Studies,Symposium Issue on Depletable Resources (1974): 3-28.
Economic Theory and Exhaustible Resources. Cambridge, Mass.: Cambridge University Press, 1979.
Davis, R. "Research Accomplishments and Prospects in Wildlife Economics." Transaction of NorthAmerican Wildlife and Natural Resource Conference, 50 (1985): 392-98.
Davis, S. "The Taming of the Few." New Scientist 95 (1982): 697-700.
de Groot, R. Functions and Values ofProtectedAreas: A Comprehensive FrameworkforAssessing theBenefitsof Protected Areas to Human Society. Wageningen, The Netherlands: Agricultural University,Climate Change Research Centre, 1992.
Department of National Parks and Wildlife Management. Annual Report of the Warden for Tourism. Harare,Zimbabwe, 1991.
Diamond, J. "Normal Extinctions of Isolated Populations." In Extinctions, ed. M. Nitecki. Chicago: Universityof Chicago Press, 1984.
"Overview of Recent Extinctions." In Conservation for the Twenty-first Century, ed. D. Western andM. Pearl. Oxford: Oxford University Press, 1989.
Dobias, R.J. InfluencingDecision Makers AboutProviding Enhanced SupportforProtectedAreas in Thailand.Beneficial Use Project, World Wildlife Fund Contract 3757 Interim Report. Bangkok, Thailand:World Wildlife Fund Thailand, 1988. Mimeo.
63

Douglas-Hamilton, I. "Overview of Status and Trends of the African Elephant." In The Ivory Trade and theFuture of the African Elephant, ed. S. Cobb. Report of the Ivory Trade Review Group to theConvention on International Trade in Endangered Species (CITES) Secretariat, 1989.
Duvick, D.N. "Genetic Diversity in Major Farm Crops on the Farm and in Reserve." Economic Botany 38(1984): 161-178.
"Plant Breeding: Past Achievements and Expectations for the Future." Economic Botany 40 (1986):289-297.
Ehrlich, P. "The Loss of Diversity: Causes and Consequences." In Biodiversity, ed. E.O. Wilson. Washington,D.C.: National Academy Press, 1986.
Ehrlich, P., and A. Ehrlich. Extinction. New York: Random House, 1981.
Eiswerth, M.E., and J.C. Haney. "Allocating Conservation Expenditure: Accounting for Inter-Species GeneticDistinctiveness." Ecological Economics 5 (1992): 235-249.
Erwin, T.L. "How many species are there? Revisited." Conservation Biology 5, no. 3 (1991): 330-333.
Fankhauser, S. "Global Warming Damage Costs-Some Monetary Estimates," Working Paper GEC 92-29,Centre for Sccial and Economic Research on the Global Environment, University College, London,1992.
Farnsworth, N. "Screening Plants for New Medicines." In Biodiversity, ed. E.O. Wilson. Washington, D.C.:National Academy Press, 1986.
Farnsworth, N. and D. Soejarto. "Potential Consequences of Plant Extinction in the United States on the Currentand Future Availability of Prescription Drugs." Economic Botany 39, no. 3 (1985).
Feamside, P.M. "Brazil's Amazon Forest and the Global Carbon Problem." Interciencia 10, no. 4 (1985).
Feamside, P.M. "Greenhouse Gas Contributions from Deforestation in Brazilian Amazonia." In GlobalBiomassBurning: Atmospheric, Climatic and Biospheric Implications, ed. J.S. Levine. Cambridge: Massa-chusetts Institute of Technology, 1991.
Federal Republic of Germany. Federal Republic of Germany Tropical Forest Report. Bonn, Germany, March1991.
Findeisen, C. Natural Products Research and the Potential Role of the Pharmaceutical Industry in TropicalForest Conservation. New York: Rainforest Alliance, 1991.
Fiselier, J.L. Living off the Tides. Leiden, The Netherlands: Environmental Database on Wetlands Intervention,1990.
Fisher, A., et al. "Alternative Uses of Natural Environments: The Economics of Environmental Modification."In Natural Environments: Studies in Theoretical and EmpiricalAnalysis, ed. J. Krutilla. Baltimore:Johns Hopkins University Press, 1972.
64
- "The Economics of Environmental Preservation: A Theoretical and Empirical Analysis." AmericanEconomic Review 62 (1972): 605-19.
-"The Economics of Environmental Preservation: Further Discussion."American Economic Review 64(1974): 1030-39.
Fisher, A., and W.M. Hanneman. Endangered Species: The Economics of Irreversible Damage. In Economicsof Ecosystem Management, ed. D. Hall, N. Myers, and N. Margaris. Dordrecht, Germany: W. JunkPublishers, 1985.
Fisher, A., and J. Krutilla. Economics of Nature Preservation. In Handbook of Natural Resource and EnergyEconomics, ed. A. Kneese and J. Sweeney. Amsterdam: Elsevier, 1985.
Flint, M.E.S. Biodiversity: Economic Issues. London: Overseas Development Administration. Unpublishedpaper. 1990.
Foy, George, and Herman Daly. "Allocation, Distribution and Scale as Determinants of EnvironmentalDegradation: Case Studies of Haiti, El Salvador and Costa Rica." World Bank EnvironmentDepartment Working Paper No. 19. Washington,D.C.: World Bank, 1989.
Freeman, A.M. "The Quasi-Option Value of Irreversible Development." Journal ofEnvironmental Economicsand Management 11 (1984): 292-95.
Gadgil, M., and P. Iyer. "On the Diversification of Common Property Resource Use in Indian Society." InCommon Property Resources: Ecology and Community Based Sustainable Development, ed. F.Berkes. London: Belhaven, 1988.
Gentry, A. "Patterns of Neotropical Plant Species Diversity." In Biological Diversification in the Tropics, ed.G. Prance. New York: Columbia University Press, 1982.
German Bundestag. Protecting the Tropical Forests: A High Priority International Task. Bonn, Germany:Bonner Universitats-Buchdruckerei, 1990.
Gillis, M. "Indonesia: Public Policies, Resource Management, and the Tropical Forest." In Public Policies andthe Misuse of Forest Resources, ed. R. Repetto and M. Gillis. Cambridge, Mass.: CambridgeUniversity Press, 1988.
Gordon, H.S. "The Economic Theory of a Common-Property Resource: The Fishery." Journal of PoliticalEconomy 62 (1954): 124-42.
Gutierrez, B., and D.W. Pearce. Estimating the Environmental Benefits of the Amazon Forest: AnInternational Valuation Exercise. Centre for Social and Economic Research on the Environment(CSERGE) Policy Paper. London: University College London Press, 1992.
Hagernan, R. "Valuing Marine Mammal Populations: Benefit Valuations in a Multi-Species Ecosystem."National Marine Fisheries Service, Southwest Fisheries Center, Report LJ-85-22. La Jolla,California, 1985.
65

Hanemann, M. "Information and the Concept of Option Value." Journal of Environmental Economics andResource Management 16 (1989): 23-37.
Hanks, J. "Reproduction of Elephant in the Luangwa Valley, Zambia." Journal of Reproduction and Fertility30 (1972): 13-26.
Hanley, N., and S. Craig. "Wildemess Development Decisions and the Krutilla-Fisher Model: The Case ofScotland's Flow Country." Ecological Economics 4, no.2 (1991): 145-162.
Hardin, G. "The Competitive Exclusion Principle." Science 131 (1960): 1292-1297.
. "The Tragedy of the Commons." Science 162 (1968): 1243-1248.
Harrington, W., and A. Fisher. "Endangered Species." In Current Issues in Natural Resource Policy, ed. P.Portney. Resources for the Future: Washington, D.C., 1982.
Hausman, J.A., et al. Assessing Use Value Losses Due to Natural Resource Injury. Carmbridge, Mass.:Cambridge Economics, Inc., 1992.
Heal, G. "Economic Aspects of Natural Resource Depletion." In The Economics of Natural ResourceDepletion, eds. D. Pearce and J. Rose. London: MacMillan, 1975.
Henry, C. "Investment Decisions Under Uncertainty: The Irreversibility Effect." American Economic Review64(1974): 1006-12.
"Option Values in the Economics of Irreplaceable Assets." Review of Economic Studies, SymposiumIssue on Depletable Resources (1974): 89-104.
Hervik, A., et al. "Implicit Costs and Willingness to pay for Development of Water Resources." In Proceedingsof UNESCO, Symposium on Decision Making in Water Resources Planning, ed. A. Carlsen. Oslo,Norway, May 1986.
Honneger, R. "List of Amphibians and Reptiles Either Known or Thought to Have Become Extinct since 1600."Biological Conservation 19 (1981): 141-158.
Houghton, R.A., et al. "The Flux of Carbon from Terrestrial Ecosystems to the Atmosphere in 1980 Due toChanges in Land Use." Tellus 39B (1987): 122-139.
Hundloe. "Measuring the Value of the Great Barrier Reef." Australian Parks and Recreation 26, no. I (1990).
Iltis, H. "Serendipity in the Exploration of Biodiversity." In Biodiversity, ed. E. Wilson. Washington, D.C.:National Academy of Sciences, 1988.
Imber, D., et al. A Conttingent Valuation Survey of the Kakadu Conservation Zone. Resource AssessmentCommission, Research Paper No. 3. Canberra, Australia, February 1991.
Intemational Institute for Environment and Development and World Resources Institute. World Resources1988-89. New York: Basic Books, 1989.
66

Ivory Trade Review Group. "The Ivory Trade and the Future of the African Elephant." Report to the Conferenceof the Parties to CITES, Lausanne, Switzerland, 1989.
Jansen, D.J. "Sustainable Wildlife Utilization in the Zariibezi Valley of Zimbabwe: Economic Ecological andPolitical Tradeoffs." World Wildlife Fund Multispecies Project, Project Paper No. 10. Harare,Zimbabwe: World Wildlife Fund, 1990.
Jurna, C. The Gene Hunters. London: Zed Books, 1989.
Kahn, J., and J. McDonald. Third WorldDebtand TropicalDeforestation. Binghampton, N.Y.: State Universityof New York, Department of Economics, 1990.
Katila, M. "Modelling Deforestation in Thailand: the Causes of Deforestation and Deforestation Projections for1990-2010." Helsinki: Finnish Forestry Institute, 1992. Mimeo (first draft).
Katzman, M., and W. Cale. "Tropical Forest Preservation Using Economic Incentives: A Proposal ofConservation Easements." BioScience 40, no. I I (Decemnber): 827-832.
Kiss, A., ed. Living With Wildlife. Draft report of World Bank Environment Division. Washington, D.C.: WorldBank,1990.
Kosmo, M. "Commercial Energy Subsidies in Developing Countries." Energy Policy (June 1989): 244-253.
Krautkramer, J. "Optimal Growth, Resource Amenities and the Preservation of Natural Environments."Reviewof Economic Studies 52 (1985): 153-70.
Krutilla, J.V. "Conservation Reconsidered." American Economic Review 57 (1967): 777-786.
Krutilla, J.V., and A. Fisher. The Economics of Natural Environments. Baltimore: Johns Hopkins UniversityPress, 1975.
Kummer, D., and C.H. Sham. 'The Causes of Tropical Deforestation: A Quantitative Analysis." In The Causesof Deforestation, ed. K. Brown and D.W. Pearce. London: University College London Press.Forthcoming.
Leader-Williams, N., and S. Albon. "Allocation of Resources forConservation."Nature 336 (1988): 533-535.
Ledec, G., et al. "Carrying Capacity, Population Growth and Sustainable Development." In Rapid PopulationGrowth andHuman Carrying Capacity, ed. D. Mahar. World Bank Working Paper 690. Washington,D.C.: World Bank, 1985.
Leith, H., and R. Whittaker. Primary Productivity of the Biosphere. New York: Springer-Verlag, 1975.
Lewin, R. "What Killed the Giant Land Mammals?" Science 221: (1983): 1269-1271.
Lovejoy, T.A. "Projection of Species Extinctions." In The Global 2000 Report to the President, ed. G. Barney.Washington, D.C.: Council on Environmental Quality, 1980.
67

Lugo, A. "Estimating Reductions in the Diversity of Tropical Forest Species." In Biodiversity, ed. E.O. Wilson.Washington, D.C.: National Academy of Sciences, 1986.
Lugo, A., et al. "Tropical Forest in the Caribbean." Ambio 10, no. 6 (1981).
Luxmoore, R., et al. "The Volume of Raw Ivory Entering International Trade from African Producing Countriesfrom 1979 to 1988." In The Ivory Trade and the Future of the African Elephant, ed. S. Cobb. Reportof the Ivory Trade Review Group to the CITES Secretariat, 1989.
Lyster, S. International Wildlife Law. London: Grotius, 1985.
Mabberley, D. "Coexistence and Coevolution." In Tropical ForestEcology. New York: Chapman & Hall, 1992.
MacArthur, R.H., and E.O. Wilson. The Theory of Island Biogeography. Princeton, N.J.: Princeton UniversityPress, 1967.
Mahar, D. GovernmentP,sliciesandDeforestation inBrazil'sAmazonRegion. Washington,D.C.: WorldBank,1989.
Marcondes, M. "Adaptacion de une metodolgia de evaluacion economica, aplicada al Parque Nacional Cahuita,Costa Rica."" Centro Agronomica Tropical de Investigacion y Ensenanze (CATIE). Serie Tecnica No.9,1981.
Mares, M.A. "Neotropical Mammals and the Myth of Amazonian Biodiversity." Science 255 (11 February1992): 976-979.
Marshall, L. "Extinction." In AnalyticalBiogeography, ed. A. Myers and P. Giller. London: Chapman and Hall,1988.
McClenaghan, L.R., et al. "Founding Lineages and Genetic Variability in Plains Bison (Bison bison) fromBadlands National Park, South Dakota." Conservation Biology 4, no. 3 (1990): 285-289.
McNeely, J.A. Economics and Biological Diversity: Developing and Using Economic Incentives to ConserveBiological Resources. Gland, Switzerland: International Union for the Conservation of Nature andNatural Resources, 1988.
McNeely,J., etal. Conserving the World'sBiologicalDiversity. Gland, Switzerland: International Union for theConservation of Nature and Natural Resources, 1990.
McNeely, J., and R. Dobias. "Economic Incentives For Conserving Biological Diversity In Thailand." Ambio20, no. 2 (1991): 86-90.
Mendelsohn, R.O., and D. Tobias. "Valuing Ecotourism in a Tropical Rainforest Reserve." Ambio 20, no. 2(1991): 91-93.
Mintzer, I. "Greenhouse Gas Assessment Methodology." Status Report to the GEF Scientific and TechnicalAdvisory Panel. Boston: Stockholm Environment Institute, 1992. Mimeo.
68

Mittermeier, R. iPiimate Diversity and theTropical Forest."InBiodiversity, ed. E.O. Wilson. Washington, D.C.:National Academy of Sciences, 1986.
Muscat, R. "Carrying Capacity and Rapid Population Growth: Definition, Cases and Consequences." In RapidPopulation Growth and Human Carrying Capacity, ed. D. Mahar. World Bank Working Paper No.690. Washington, D.C.: World Bank, 1985.
Myers, N. The Sinking Ark. A Look at the Problem of Disappearing Species. New York: Pergamon, 1979.
A Wealth of Wild Species. Boulder, Colo.: Westview, 1983.
The Primary Source. New York: Norton, 1984.
"Tropical Deforestation and a Megadiversity Spasm." In Conservation Biology: The Science ofScarcity and Diversity, ed. M. Soul. Sunderland, Mass.: Sinauer Associates Inc., 1986.
"Tropical Forests." In Global Warming, The Greenpeace Report, ed. J. Leggett. Oxford: OxfordUniversity Press, 1990.
Myers, A. and P. Giller. Analytical Biogeography. London: Chapman and Hall, 1988.
Nordhaus, W. "To Slow or Not to Slow: the Economics of the Greenhouse Effect." EconomicJournal 101, no.407 (July 1991): 938-948.
"A Sketch of the Economics of the Greenhouse Effect." American Economic Review, Papers andProceedings 81, no. 2 (1991): 146-150.
Norgaard, R. "The Rise of the Global Exchange Economy and the Loss of Biological Diversity." InBiodiversity,ed. E.O. Wilson. Washington, D.C.: National Academy of Sciepces, 1986.
Norton, B., ed. The Preservation of Species. Princeton, N.J.: Princeton University Press, 1986.
Norton, B.G., and R.E. Ulanowocz. "Scale and Biodiversity Policy: A Hierarchical Approach." Ambio 213(1992): 244-249.
Noss, R.F., et al. "Monitoring and Assessing Biodiversity." In Achieving Environmental Goals: The Conceptand Practice of Environmental Performance Review, ed. E. Lykke. London: Belhaven Press, 1992.
Oiffice ofTechnology Assessment. Technologies toMaintainBiologicalDiversity. Philadelphia: Lippincott Co.,1988.
Oldfield, M. The Value of Conserving Genetic Resources. Washington, D.C.: U.S. Department of the Interior,1984.
Olson, S. "Extinction on Islands: Man as a Catastrophe." In Conservation for the Twenty-first Century, ed. D.Westem and M. Pearl. Oxford: Oxford University Press, 1989.
Olstrom, E. Governing the Commons. Cambridge: Cambridge University Press, 1990.
69
Panayotou, T. The Econqomics of Environmental Degradation Problems, Causes and Responses. Cambridge,Mass.: Harvard Institute for International Development, 1989.
"Transferable Development Rights as an Instrument of Conservation." Cambridge, Mass.: HarvardInstitute of International Development, 1992. Mimeo.
Panayotou, T., and P. Ashton. Not by Timber Alone: Economics andEcologyfor Sustainable Tropical Forests.Washington, D.C.: Island Press, 1992.
Panayotou, T., and S. Stngsuwan. An Econometric Study ofthe Causes of Tropical Deforestation: The Case ofNortheast T7hailand. Development Discussion Paper. Cambridge, Mass.: Harvard Institute forInternational Development, 1989.
Paulo, M., and J. Salmi. Deforestation or Development in the Third World? Helsinki: Finnish Forest ResearchInstitute, 1987.
Paulo, M., et al. Deforestation in the Tropics: Pilot Scenarios Based on Quantitative Analyses. Metsatutkimus-laitoksen Tiedonantaja nro. 272. Helsinki, 1987.
Pearce, D.W. The Sustainable Use of Natural Resources in Developing Countries. In Sustainable EnvironmentalManagement: Principles and Practice, ed. R.K. Turner. London: Belhaven Press, 1988.
"An Economic Approach to Saving the Tropical Forests." In Economic Policy Towards theEnvironment, ed. D. Helm. Oxford: Blackwell, 1991.
"Deforesting the Amazon: Toward an Economic Solution." Ecodecision 1 (1991): 40-49.
Economic Values and the Natural World. London: Earthscan, 1993.
Pearce, D.W., ed. Blueprint 2. London: Earthscan, 1991.
Pearce D.W., et al. SustainableDevelopment: Economics andEnvironment in the Third World. London: EdwardElgar, 1990.
The Economic Value ofBiological and Cultural Diversity. Report to the World Conservation Union.London: University College, Centre for Social and Economic Research on the Global Environment,1992.
Pearce, D.W., and S. Puroshothaman. "Protecting Biological Diversity: the Economic Value of MedicinalPlants." In Biodiversity and Botany: the Values of Medicinal Plants, ed. T. Swanson, 1993.
Pearce, D.W, and J. Warford. World Without End: Environment, Economics and Sustainable Development.Oxford: Oxford University Press, 1993.
Perrings, C. "An Economic Analysis of Tropical Deforestation." York, U.K.: University of York, Departmentof Environmental Economics, 1992. Mimeo.
Peters, C.M., et al. "Valuation of an Amazonian Rainforest." Nature 339, no. 29 (June 1989): 655-656.
70
Peters, R.L., and T.E. Lovejoy, eds. Global Warming and Biodiversity. New Haven: Yale University Press, 1992.
Peterson, W., and A. Randall. Valuation ofWildland Resource Benefits. Boulder, Colo.: Westview Press, 1984.
Plucknett, D.L., et al. "Crop Germplasm Conservation and Developing Countries." Science 8, (1983): 163-169.
- -. Gene Banks and the World's Food. Princeton, N.J.: Princeton University Press, 1987.
Plucknett, D.L., and N.J.H. Smith. "Sustaining Agricultural Yields." BioScience 36 (1986): 40-45.
Principe, P. "Valuing the Biodiversity of Medicinal Plants." In The Conservation of Medicinal Plants, ed. 0.Akerle, V. Heywood, and V. Synge. Cambridge: Cambridge University Press, 1991.
Randall, Alan. "Total and Nonuse Values." In Measuring the DemandforEnvironmental Quality, eds. John B.Braden and Charles D. Kolstad. Amsterdam: Elsevier Science Publishers BV, 1991.
Raup, D. "Diversity Crises in the Geological Past."InBiodiversity,ed. E. 0. Wilson. Washington, D.C.: NationalAcademy Press, 1988.
Raven, Peter H. OurDiminishingTropical Forests. InBiodiversity, ed. E.O. Wilson. Washington, D.C.: NationalAcademy Press, 1988.
Reid, W.V. "How many species will there be?" In Tropical Deforestation and Species Extinction, ed. T.C.Whitmore and J.A. Sayer. London: Chapman and Hall, 1992.
Reid, W.V., and K.R. Miller. Keeping Options Alive: The Scientific Basis for Conserving Biodiversity.Washington, D.C.: World Resources Institute, 1989.
Reid, W.V., et al. Developing Indicators of Biodiversity Conservation. Washington, D.C.: World ResourcesInstitute, 1992. Draft report.
Reis,J., andR. Guzman. "An Econometric Model of Amazon Deforestation."Paperpresented at the Conferenceon Statistics in Public Resources and Utilities, and in the Care of the Environment, Lisbon, Portugal,April 7-11, 1992.
Repetto,R. Paying thePrice: Pesticide Subsidies inDeveloping Countries. Washington, D.C.: WorldResourcesInstitute, December, 1985.
Skimming the Water: Rent Seeking and the Performance of Public Irrigation Systems. Washington,D.C.: World Resources Institute, December 1986.
- . "Soil Loss and Population Pressure on Java." Ambio 15 (1986): 14-20.
- . World Enough and Time. New Haven, Conn.: Yale University Press, 1986.
- ."Economic Policy Reform forNatural Resource Conservation." World Bank EnvironmentDepartmentWorking Paper No. 4. Washington D.C.: World Bank, 1988.
Repetto, R., ed. The Global Possible. New Haven, Conn.: Yale University Press, 1985.
71

Repetto, R., and M. Gillis. Public Policies and the Misuse of Forest Resources. Cambridge: CambridgeUniversity Press, 1988.
Rudel, T. "Population, Development, and Tropical Deforestation: A Cross-National Study." Rural Sociology54, no. 3 (1989).
Ruitenbeek, J. Social Cost Benefit Analysis of the Korup Project, Cameroon. England: World Wide Fund forNature, 1989.
"Evaluating Economic Policies for Promoting Rainforest Conservation in Developing Countries."Ph.D. dissertation, London School of Economics, 1990.
.Mangrove Management: An EconomicAnalysis ofManagement Options with a Focus on Bintuni Bay,Irian Java. Jakarta: Ministry of State for Population and Environment, 1991.
"The Rainforest Supply Price: A Tool for Evaluating Rainforest Conservation Expenditures."Ecological Economics 6, no. 1 (July 1992): 57-78.
Samples, K., et al. "Information Disclosure and Endangered Species Valuation." Land Economics 62, no. 3(1986).
Schneider, R. Brazil: AnAnalysis ofEnvironmentalProblems in theAmazon. World Bank Report No. 91 04-BR.Washington, D.C.: World Bank, 1992.
Schulze, W., et al. "Economic Benefits of Preserving Visibility in the National Parklands of the Southwest."Natural Resources Journal 23, (1983).
Scott, A. "The Fishery: The Objectives of Sole Ownership." Journal ofPolitical Economy 63, (1955): 116-24.
Sedjo, R. Property Rights and the Protection of Plant Genetic Resources. In The Use and Control ofPlantGeneticResources, ed. J.R. Kloppenburg. Durham, N.C.: Duke University Press, 1988.
Sedjo, R.A., et al. "Toward a Worldwide System of Tradeable Forest Protection and Management Obligations,Resources for the Future." World Bank Energy and Natural Resources Division, Paper 91-16.Washington, D.C.: World Bank, 1991.
Semples, K., et al. "Information Disclosure and Endangered Species Valuation." Land Economics 62, no. 3(1986).
Shafik, N. Macroeconomic Causes of Deforestation: Barking up the Wrong Tree. Washington, D.C.: WorldBank, Forthcoming.
Soberon, J. "Island Biogeography and Conservation Practice." Conservation Biology 6, no. 2 (1992): 161.
Solow, R. "The Economics of Resources or the Resources of Economics." American Economic Review 64(1974): 1-12.
."Intergenerational Equity andExhaustible Resources."Review ofEconomic Studies, Symposium Issueon Depletable Resources, (1974) 37-48.
72

Southgate, D. TropicalDeforestation andAgriculturalDevelopment in Latin America. LEEC Discussion Paper894-9. London: London Environmental Economics Centre, 1991.
Southgate, D., and H. Clark. "Do Biodiversity Conservation Projects in Poor Countries Make Sense?" Quito,Ecuador. Instituto de Estrategias Agropecuarias (IDEA), 1992. Mimeo.
Southgate, D., and D.W. Pearce. Agricultural Colonisation and Environmental Degradation in FrontierDeveloping Economies. World Bank Environment Department Working Paper No.9. Washington,D.C.: World Bank, 1988.
Southgate, D., et al. The Causes of Tropical Deforestation in Ecuador: A StatisticalAnalysis. LEEC Paper 89-09. London: London Environmental Economics Centre, 1989.
Spence, M. Blue Whales and Applied Control Theory. In System Approaches and EnvironmentalProblems, ed.H. Gottinger. Gottingen, The Netherlands: Vandenhoeck, 1975.
Stoll, R., and L. Johnson. Concepts of Value, Non-market Valuation, and the Case of the Whooping Crane. SanAntonio, Texas: Texas A&M University, Department of Agricultural Economics, 1984.
Swanson, T. "Policy Options for the Regulation of the Ivory Trade." In The Ivory Trade and the Future of theAfrican Elephant, Ivory Trade Review Group. Lausanne, Switzerland, 1989a.
"A Proposal for the Reform of the African Elephant Ivory Trade." London Environmental EconomicsCentre Discussion paper 89-04. London: Intemational Institute for Environment and Development,1989b.
- . "Conserving Biological Diversity." In Blueprint 2: Greening the World Economy, ed. D.W. Pearce.London: Earthscan, 1990a.
"Wildlife Utilisation as an Instrument for Natural Habitat Conservation: A Survey." LondonEnvironmental Economics Centre Discussion Paper 91-03. London: International Institute forEnvironment and Development, 1990b.
--. "Animal Welfare and Economics: The Case of the Live Bird Trade." In Conservation and Managementof Wild Birds in Trade, ed. S. Edwards and J. Thomsen. Kyoto, Japan: Report to the Conference ofthe Parties to CITES, 1991.
The Environmental Economics of Wildlife Utilisation. In Proceedings of the IUCN Workshop onWildlife Utilisation. Gland, Switzerland: International Union for the Conservation of Nature andNatural Resources, 1991.
"The Economics of a Biodiversity Convention." Ambio 21 (1992): 250-57.
Policies for the Conservation of Biological Diversity. In Economics for the Wilds: Wildlands, Wildlife,Diversity and Development, ed. T. Swanson and E. Barbier. London: Earthscan, 1992a.
"Regulating Endangered Species." GEC Working Paper, Centre for Social and Economic Research onthe Global Environment. London: University College, London, and University of East Anglia, 1992a.
73
. "The Evolvin'g Trade Mechanisms in CITES." Review of European Community and InternationalEnvironmental Law 1 (1992): 57-63.
-The International Regulation of Extinction. London: Macmillan, 1993.
Swanson, T., and E. Barbier, eds. Economics for the Wilds: Wildlands, Wildlife, Diversity and Development.London: Earthscan, 1992.
Swanson, T., and D.W. Pearce. "The International Regulation of the Ivory Trade-The Ivory Exchange." PaperPrepared for the International Union for the Conservation of Nature and Natural Resources, Gland,Switzerland, 1989.
Terborgh, J. "Preservation of Natural Diversity: The Problem of Extinction Prone Species." Bioscience 24(1974): 715-722.
Thibodeau, F., and B. Ostro. "An Economic Analysis of Wetland Protection." Journal of EnvironmentalManagement 12, no. I (January 1981).
Thomas, D., et al. Use Value and Non-Use Values in the Conservation of Ichkeul National Park, Tunisia.London: University College, Department of Geography, 1990.
Tobias, D., and R. Mendelsohn. "The Value of Recreation in a Tropical Rainforest Reserve."Ambio 20 (1990):91-93.
Turner, K., and K. Brooke. "Management and Valuation of an Environmentally Sensitive Area: NorfolkBroadland Case Study." Environmental Management 12, no. 3 (1988).
United Nations Environment Programme and East West Center. Mangrove Area Management. Honolulu:1984.
van Diepen, P., and J. Fiiselier. "The Bintuni Case: Nature Under Siege." In Proceedings of the InternationalConference on Wetlands: The People's Role in Wetland Management, Leiden, June 5-8, 1989.Leiden, The Netherlands: Centre for Environmental Studies.
Vincent, J.R. "Rent Capture and the Feasibility of Tropical Forest Management."LandEconomics 66, no.2 (May1990).
Vitousek, P., et al. "Human Appropriation of the Products of Photosynthesis." Bioscience 36, no.6 (1986): 368-373.
Walker, B.H. "Biodiversity and Ecological Redundancy." Conservation Biology 6, no. 1 (1992): 18-23.
Walsh, R., et al. "Valuing Option, Existence and Bequest Demands for Wilderness." Land Economics 60, no.1 (1984).
Watson, D. "The Evolution of Appropriate Resource Management Systems." In Common Property Resources:Ecology and Community Based Sustainable Development, ed. F. Berkes. London: Belhaven, 1988.
74
Webb, A., et al. "Estimates of Producer and Consumer Subsidy Equivalents: Government Intervention inAgriculture, 1982-1987." Statistical Bulletin, No. 803. Washington, D.C.: U.S. Department ofAgriculture, 1990.
Weitzman, M.L. "On Diversity." Harvard Institute of Economic Research Discussion Paper 1553. Cambridge,Mass.: Harvard University, 1991.
Weitzman, M.L. "A Reduced Forn Approach to Maximum Likelihood Estimation of Evolutionary Trees."Cambridge, Mass.: Harvard University, Department of Economics, 1991. Mimeo.
Wel]ls, M. "Biodiversity Conservation, Affluence and Poverty: Mismatched Costs and Benefits and Efforts toRemedy Them." Ambio 21, no. 3 (May 1992).
Wells, Michael, and Katrina Brandon. People and Parks: Linking Protected Area Management with LocalCommunities. Washington, D.C.: World Bank Environment Department, 1992.
Western, D. Population, Resources and Environment in the Twenty-first Century. In Conservation in the Twenty-first Century, eds. D. Westem and M. Pearl. Oxford: Oxford University Press, 1989.
Westem, D., and M. Pearl. Conservation for the Twenty-first Century. Oxford: Oxford University Press, 1989.
Westem, D., and P. Thresher. Development Plans for Amboseli. Nairobi: World Bank, 1973.
Wijnstekers, W. The Evolution of CITES. Lausanne, Switzerland: Secretariat of the Convention on IntemationalTrade in Endangered Species, 1988.
Williamson, M. "Relationship of Species Number to Area, Distance and Other Variables." In AnalyticalBiogeography, ed. A. Myers and P. Giller. London: Chapman and Hall, 1988.
Willis, K., and J. Benson. "Valuation of Wildlife: A Case Study on the Upper Teesdale Site of Special ScientificInterest and Comparison of Methods in Environmental Economics." In Sustainable EnvironmentalManagement, ed. R.K. Tumer. London: Belhaven Press, 1988.
Wilson, E.O. "The Current State of Biological Diversity." In Biodiversity, ed. E.O. Wilson. Washington:National Academy Press, 1988.
World Conservation Monitoring Centre. Global Biodiversity: Status of the Earth's Living Resources. London:Chapman and Hall, 1992.
Wood, W.B. "Tropical Deforestation: Balancing Regional Development Demands and Global EnvironmentalConcems." Global Environmental Change 1, no. 1 (1990): 23-41.
World Bank. World Development Report 1989. New York: Oxford University Press, 1989.
World Bank. World Development Report 1992. New York: Oxford University Press, 1992.
World Resources Institute. World Resources 1990-1991. New York: Oxford University Press, 1990.
World Resources Institute. World Resources 1992-93. New York: Oxford University Press, 1992.
75

.

Distributors of World Bank PublicationsARCLNTINA The Middle Fast Observer KENYA SOUTH AFRICA. BOTSWANACarioi Hirsch. SRL 41, Sherif Street Africa Book Service EA.) Ltd. For single tifleCaler a Guemes Cairo Quaran House, Mfangsno Street Oxford Univerity PrmFlorida 165, 4th FtoorOfc. 453/465 P.O. Box 45245 Southern Africa1333 Buenos Aires FINLAND Nairobi P.O. Box 1141
Akateeminen Kijakauppa Cape Town SOOOAUS1 RALIA, PAPUA NEW GUINEA, P.O. Box 128 KOREA, REPUBLIC OFFIJI. SOLOMON ISLANDS, SF-00101 Helsinki 10 Pan Korea Book Corporation For sate r onfow:VANUATU, AND WESTERN SAMOA P.O. Box 101, Kwangwhamun International Subription ServiceDAH nformation Services FRANCE Seoul P.O. Box 41095648 Whitehorse Road World Bank Publications CraighallMitb:ham3132 66. avenue dI6na MALAYSIA Johannesburg 2024Victoria 75116 Paris University of MalayaCooperative
Bookshop, Lmited SPAINAUSIRIA GERMANY P.O. Box 1127, JaLan Partai Baru Mundi-Prensa Libros, S.A.Cerold and Co. UNO.Verlag 59700 Kuala Lumpur Castello 37Craben 31 Poppelsdorfer Allee 55 28001 MadridA-1011 Wien D-5300 Bonn 1 MEXICO
fNFOTEC Librerfa InternmaconlAEDOSBANCLADESH HONG KONG, MACAO ApartadoPostal 27860 Conseil deCent,391Micn) Industries Development Asia 2000 Ltd. 14060 Talpan, Mexico DF. 08009 Barcelona
Amistance Society MDAS) 46-48 Wyndham Streen..House S, Road 16 Winning Centre NETHERLANDS SRI LANKA AND THE MALDIVE5Dharnmondi R/Area 2nd Floor De Lindeboom/LnOr-Publikaties Lake House BooklshopDhaka 1209 Central Hong Kong P.O. Box 20 P.O. Box 244
7480 AE Haaksbergen 100. Sir Chittampalam A.B -nch afftc- INDIA Gardiner MawathaPLne View, Ist Floor Allied Publishers Private Ltd. NEW ZEALAND Colombo 2100 Agrabad Commercial Area 751 Mount Road EBSCO NZ Ltd.Chittagong4100 Madras-600 002 PrivateMail Bag 99914 SWEDEN
New Market For single litiw715, XD.A. Avenue BS.c.Aofi: Auckland Fritzes FackboksforetgetKulna 9100 15 JIN. Heredia Marg Regeringsgatan 12 Box 16356
Ballard Estate NIGERIA S-i03 27 StockholmBELGIUM Bombay - 400 038 University Press LimitedJean De Lannoy Three Crowns Building Jericho For soucrWdan or&ss:Av. du Roi 202 13/14 Asaf Ali Road PrivateMail Bag5095 Wennergren-WillamsABi060 Brussels New Delhi -110 002 Ibadan P. O. Box 1305
S-171 23SolnaCANADA 17 Chittaranjan Avenue NORWAYLae liffuseur Calcutt- 700072 Narvesen Information Center SWITZERLANDC.P. 5, l5CIB rue Ampere Book Department Farsingle titlrarBou:herville, Qu6bec Jaladeva Hostel Buiding P.O. Box 6125 Etterstad LIWraine PayotJ4B SE6 5th Main Road, Gandhinapr N-0602 Oslo 6 Case postale 3212
Bangalore - 56_ 009 C1 1002 LausaneCHILE PAKISTANInvertec ICT S.A. 3-5-1129 Kachiguda Mirza Book Agency For sucrTt oAv. Santa Maria 6400 Cross Road 65, Shahrah-eQuaid--Azam Librairie PayotEdiicio TEC Of. 201 Hyderabad - 500 027 P.O. Box No. 729 Service des AbonnementsSandago Lahom 54000 Case postale 3312
Prarthana Flats, 2nd Floor CH 1002 LausanreCHINA Near Thakore Baug, Navrangpura PERUChina Financial & Economic Ahmedabad - 380 009 Editorial Desarrollo SA THAILAND
PlublishingHouse Apartado3824 Central DepartmentStorea, Da Fo Si Dong lie Patala House Lima 1 306 Silom RoadBeijing 16-A Ashok Marg Bangkok
Lucknow - 226 001 PHIUPPINESCOLOMBIA International Book Center TRINIDAD & TOBAGO, ANTnGUAInfoenlace Ltda. Central Bazaar Road Suite 1703, Clyland 10 BARBUDA, BARBADOS,Apartado Aereo 34270 60 Bajaj Nagar Condominium Tower I DOMINICA, GRENADA, GUYANA,Bogota D.E. Nagpur 440 010 Ayala Avenue, H.V. dela JAMAICA, MONTSERRAT, ST.
Costa Extension XITTS & NEVIS, ST. LUCA.CCTE! DVOIRE INDONESIA Makati, Metro Manila ST. VINCENT & GtENADINSCentre d-Edition et de Diffusion Pt Indira Limited Systernatics Studis Unit
Africaines (CEDA) Jalan Borobudur20 POLAND #9 Watts Street04 3.P. 541 P.O. Box 181 Intemational Publishing Service CurepeAbidjan 04 Plateau Jakarta 10320 Ul. PAekna31/37 Trinidad, Westindie
00-677 WarzawaCYPRUS IRELAND TURKEYCenter of Applied Research Covemment Supplies Agency Forsutcrition ordn: InfotelCvprus College 4-5 Harcourt Road IPS Journals Narlabahqe Sok. No. 156, Diogenes Stteet, Engomi Dublin 2 Ul. Okrezna 3 CagaiogluP.O. Box 2C06 02-916 Warszawa IstanbulNicosia ISRAEL
Yozmot Literature Ltd. PORTUCAL UNITED KINGDOMDENMARK P.O. Box 56055 Livraria Portugal Microinfo Ltd.SamnfundsLitteratur Tel Aviv 61560 Rua Do Carmo 70-74 P.O. Box 3Rosenoerns Alls 11 1200 Lisbon Alton, Hampshire CL34 2PGDi -1970 FrvderiksbergC ITALY England
Licosa Commissionaria Sanoni SPA SAUDI ARABIA. QATARDOMINICAN REPtiBUC Via Ducr Di Calabria, 1/1 jarir Book Store VENEZUELAE itora Taller, C por A. Casella Postale 552 P.O. Box 3196 Libreria del EsteRestauraci6n e Isabel la Cat6lica 309 50125 Firenze Riyadh 11471 Aptdo. 60337Apartado de Correos 2190 Z-1 Caracas 1060-ASanto Domingo JAPAN SINCAPORE. TAIWAN,
Eastern Book Service MYANMAR.BRUNEIEtYPT, ARAB REPUBUC OF Hongo 3-Chome, Bunkyo-ku 113 Infonnation PubicatonsA Ahram Tokyo Private, Ltd.A Calaa Street Golden Wheel BuildingCkiro 41, Kallang Pudding. #04-03
Singapore 1334

UNDP Field Offices*
1".0. BoxS C.,iUar of Grand Cntr:tl P.O. Soa^ 333XKbuiAfha~Igzi LaPUI Bolivi tMC3ngo Station Jakarta 103tO,
Ncw York, Nt.Y. SgsdonatlDe.i~n~ret S4 P.C. 30S 54 Ap,trtado Postal 10163 tff1
C A a P a a , 4540 7.O. B o xVillx No. 35 8o0wuAs Ssrt low, Coas P.O. B4 446 157545577iraza, AJbuIs Ri:a BE-0OMT kUE1A T1k1a, na, wls
CaiEx Po1 02M Eotia RWpobilO of kaM°oit pogaF° 23 70359470 Brai 01 30i4a poawl
A agr d rs, LF 1141 P. a. B= 5530 P.C. Fex 2XuAlsiar, 15000, 3zax Abidjtn 01t Addis Ababa, (UA1iy.AIx.i. R:opub11e 4d CoW Ecoik 3agJad0 , lrsq
F.0. Bcx S 'rosCaixaPostaltW 1I4Soil& PrivatMal)Bi P.0.. c2tOLuaada, P".1's BUR aru UNDP Cuib suv, Pji lCh¶g , JamaiuaR.pubita of Arl I Uoit.d Nealos1
Doit. p0..1 1490 PAzU Boit pcasa 2183 P.O. Box 51359Cialla dc Co"" B U I M u ts, Now York, r.Y. Librevill, Oabo JammI4S9151322S7 Bur..j I0 , U.S.A. Israel1000 Capital P. 0.laxSS3Fedcfat Uits PoNg1S72 P. O. BOXS AB&*1tsoabiA P. 0. O, x3sBusso, Aires, Rangui, Caitet l Niooda, Cypau A.a. n Je zaaArzmna AMt=a Rapubilc P. 0. DBo 1423
P.O. BOx M30 Acrs, China Hotal Xaul AkabUtated Naotioon P.O. x 77t D X * 2 1 0 0 RA=: 1312Ubtfl*d Ioterlm Luomr Eb2 Cophitiqm Apzuado Poa 23 L*oln Prospect0ffi<aw caOd! Denmark 'A' AIaianty, x. mNeAdIA How 01509 Oua1w.m
2od llorz. Bloi pomata 536 Bol postab 2001 Ctty, C.A O. 20% 30213Plnhia 5t.SL 2 YazAo, Republic D J l b o u i i, ouaba.ma Nairobis.K Y*Y erw ,9.a oCa Rdpubllqua do
Djiboul Bolts poel 222 P. 0. lox 2993UUaitid Nations P.O. lox 27 Co-kzy, R*VuWii flatt
eiOmA Of&* DOala Aperts4o 1424 of Oulu" 12030 XMWat3 Ltl.j1iiyit I Cauxoooa Sento Dnoinsco, State of Kuwai
B&L- 1, Aza an Dominiar&p PolC. P. 179QiAL dlCW 62 P.O. BOx 101 9 T7Msasir
P. 0. Box 26114 S4ia. RapabuW de P.O. lox 27 Ilisu CodX Sacood stoManam, ,ism Cabo V,ds Pyot,y4axg, R*pub11. of Riga
D I m o o r a t i c ulrao Ua41u LAtvli02.0. Box 224 lt& ?Qosbtal 9C6 P,opl.'sMba.ka 1000 t manna Republic ofXc P. 0, lox 10960 P. 0. lx I1-321Psopl'. Ritpublie Rlapubliqug du eoor atow u, 3einr5, Lab4an
Or&glads*ih Tahad P 0. B o I Guyana1703-4731 P. 0. Box 301
P.O 3Bc.62SC Cnull& 197-D QuDc,Eoudt lti. potal. 557 MJ*eru 100,Bri dgetow, 3amago, Clie PortI'ta.Priaaa, Ljotho
Barbas P 0.O 93 Haitl2 oonsqIjio P1 Ftal Cod$ No. P. 0. Box 104274
0P.0 Box 103 Sariloan 11311 AptadcPota97S lOUOcorcvis 10
=O1400 A{gisk Booing. peou's Caire, Arab 'g?sigalp D.C., Llberi&, Wait3<Xrea Pwepube;k e of CA. Ropubile of Egypt Hoda Atrio
3tci poatal 506 Apaorudo Asa,o P. O. Box It14 P.O. Box 3059 C t POff;cC4ano", Repbig No. 091349 San Salvador, El NowD IhilOOM, Dox 62
of Bci Slao", Colombia SuLv.dot bd; LT2DOVilnius, Lift.1A
B P 5 7 5 Boibt pogia A l P.O. Box 336OugidouM3O t1 Moroal, P,do.ral Arn= RAvinda, Mtlt P, 0. BOx 36Ourgrsdougou, Islamio itpubco Erit. (nd fto)o Tripoli, GreatDurklna Pr o of Cotorw Dlnsuua Viabita S30bl1t PeIsb'a
UNDP Milabo, Road Libyana. P. 0. Box 161 Boit poeuhl 445 Equatorlil ualte. Bombay 40X2Q, Aab JmabildysnThlnbu,I buiA s a Y vl II1 , a/* UNDP, P.O. hdi.
Poople's RApublo Box 1603 P 0. BDe 134S
*GEF Woring Papers are available at UNDP Fcled Office and through Wor?d Bank Dist7ibuztorr
Ardmnadvo 101. Niamay, Nigpt Roit Posle 445 Swliund (Or. Ar)Itpublic ot KIXgUi, Rwmnda WubJrpA D.C.
e rdadapOca P. Box2S5l PO. Box2317 20006Oarki, Abujs P. 0. Box 114 DsinAoUa, SyRa
P.O. DU 0135 loddah 21431, Axb lRptbln padar lap ofLIloqws3,MAIawi P. 0. Box 2075 Saudi Aabia Yu pLavis
Ja.,Nligeria P.0.Boxl12 ( S a r b I aP. O. Box 12544 P.O. BoXSst Pot-of-Spuin, MoWA03*)s0782 Kuslr CPOk 403 Riyadh 11421, Trinidad ad l x a t ao a r aLwpur, MAIyj Xrach 3, PaLWss Saudi Asbia Tobago Mudalu
P.O. Box 2051 P. O. Box 1051 P. O BoX IOtl O.P.O. BOx 5111w1e, Republic of Islamaba, Pakig Fratown, Sif" Bangkok 10501. B o * A I a
Madly" 1.4onaM dhan Hlrrestovo,Apartado 6314 r
Wodpoeala120 PanamaS,Pam- PrivutaMaiUiBg BoitaPo.aI,911 SIo v is*Bamako, Ma Apia, Samoa L1me, Togp M4de
CuIlil de Coma la ViennaDOW postl 620 1107 Calu Posa 109 BOt polsails 162 Isnlado lcauKoua khoti, AunoSlodr. ,PamaW $S ToW, 10 5I%W4TunIdd Rms: C0217Maurita Tom and Piniple P.O. Box 500
Ape4 ado44t 0 P. X. 407 X-1400 VIm.P.O. Box 253 Z4acio Unidu oa Mlidauy of 06Q43 UlwsPert Lao uis, Irn , Pa.u Bwironmat, Ankar, Trkey Boitp poswl 72Mmauius ;% Boznomi;i, aaaS,I A Rpbic
P.O. B=x7213 Panni sad S Stiha*vogo ofeZairApartado Postal Domestic Azpoct Limalu Rlatloz POVAanny&105-39 Post Otie Lock MGM Piawli Itr. P. o. Box t319:l5S1 M11rice Box P.O,oBX656 Ke*i 262010. Lusaka.buMlisofD.F. Matd. asy Ci, Mcuo V'ictovia, Mahk Ukuaia; Zambia
ManilI SoycheolsRoom 2221224, l ilippixs P. a. Box 3490 P.O. Box 4775nowl Codat Bolt. posta 154 AbU Dhaib, UnitAd lIarn", Zb Nbabw
277012 ChLinu P.O. Box 2865 Dakar, Sonegal Arab EmiratsRepublIc of 105I MunlaMoldova Phillppliaa P.O. Box 9182
P.O. Bmx24 Dar-ea-Slaarm,P.O. bx 49/07 P. . Box 1041 MogpAclo, Smali Unsiad Raplbi oGa- I a C i b a a t t, Part Moreoby, Dmoraetlo TUZAnia
oagalHA Papu Now Guinea RepublicP.OC. Box 7184
Caior ONU, P.O. Box I UNDF Mogadlalo Kampala, RaepusbioRabat-Coduh Wursw 12, Poland 040 UNDP NaIroI of UgandRabat,M.orocco X n y a t t a
Box 3233 lntsrnt tioalkI Casill. de ComoP. 0. Box 4595 Dahl, Salwe of Confrnsca 1;207MAputo Qatar Cenr 11200 Montevideo,ispublic o f P.O. BOx 30211 UmsugayMmmbiqu& P.O. lax 351 Nairobi, K"nya
SaMe' 4Tsra Shw clau*P.O. Sox 650 Republic ot Yeana P. O. Box 1505 StreetYago. Mypama Colombo, Sri Taahkas 700029
Cartral Pose Oam. Lanka UZb.idmanPrvata D 13320 lox 143Wrdholk, Namhia ' 5oul, m Coda P.O. box 913 ApateAdo 69005
10G601 l0iawotaum,bRpubiio 6 04 iP. 0. Box 107 lepublic of O of SudanICathmadu, Nepal 2 Puing Khoo
Strmda Aual Vkcu Privatb hFg KlmnApsrtado Postal nr. 16 M b a b a a ae Ho ChiMlab3260 Iteownul 2, P. O. SwuUald Socialis RapubtiM a n a u a, Rixl 1-701 of Vlt NatNioasua 7'9361 Buchares, Palas ds. Naloans
iRomer CH-1211 acoav 1319 P Street,Doi postals 11207 10 N.W.


:

t
I
j
I
The GEF Administrator
1818 H Street,, NWWashington DC 20433 USATelephone:- (202) 473-1053Fax: (202) 477-0551
Unied atins evelopment Priogramme,
GEF/Executive CoordinatorOne United Nations Pla;zaNew York, NY 1001 7 USATelephone: (212) 906-5044Fax: (212) 906-6998
UNEP
Uinited ations Environment, Programme
GEF Unit/UNEP,PO.Box 30552Nairobi,.Kenya,/Telephone:-(254-2) 621-234,Fax: (?54-2) 520-825
The World, Bank
GEF/Operations,Coordination DivisionEnvironment Department1 81 8 H Stree't, NWWashington, DC 20433 USATelephone:,(202) 473-601 0Fax: (202) ,676-0483
® Printed on recycled paper . ISBN 1-88412-01-9