Economics 12 Chapter 1 Notes. Economic Perspective Includes Scarcity & choice Purposeful behaviour...
28
Economics 12 Chapter 1 Notes
-
Upload
rose-joseph -
Category
Documents
-
view
224 -
download
2
Transcript of Economics 12 Chapter 1 Notes. Economic Perspective Includes Scarcity & choice Purposeful behaviour...

Economics 12Chapter 1 Notes

Economic PerspectiveIncludes
Scarcity & choicePurposeful behaviourMarginal analysis

Scarcity & choiceResources (time, money, water, oil, etc) are
LIMITED, therefore we must make CHOICES
Opportunity cost = the next best choice/optionWhat you would have done if your first choice was
no longer possible If options are ranked (1st, 2nd, 3rd) – opportunity
cost is the 2nd ranked option, if you choose the 1st
Opportunity cost is not the SUM of all choices

Purposeful behaviourHuman behaviour reflects “rational self-interest”
Ex. We seek opportunities to increase our UTILITY
Utility = pleasure, happiness, satisfaction obtained from consuming a good or service
Resources (time, energy, money, etc) are allocated in order to maximize satisfaction

Marginal Analysis: Benefits & Cost
All options have a marginal benefit and marginal cost
Marginal benefit = Extra/additional benefit
Marginal cost = Extra/additional cost

Marginal benefit/cost example
You have eaten 2 hotdogs already, and you are getting full. Hotdogs are $2. What is the marginal benefit & cost of eating a 3rd hot dog?
Benefit = slight additional satisfaction, but satisfaction is not as great as when you ate the first and 2nd hot dog, because you are getting VERY full
Cost = $2, plus potential discomfort from being TOO full.Forgoing a $2 cupcake later? (opportunity cost)

Marginal benefit vs Marginal cost
Compare the two, and always choose the option where the marginal benefit is highest (considering cost)

Scientific MethodEconomics relies on the scientific method
Observation of real-world behaviour & outcomes
Formulation of explanation of cause & effect (hypothesis)
Testing of hypothesis
Acceptance/rejection/modification of hypothesis
Hypothesis evolves into a theory after it has tested positively (seen to be correct)

Economic theoriesGeneralizations about how the economic world
works
When widely accepted, turns into economic principle or lawEnables predictions
Many economic models are expressed graphically
Example: supply & demandLow supply and high demand = high prices

MacroeconomicsExamines economy as a whole
Government, household, business sectorsUses aggregates (collections of specific units)
Seeks to obtain overview of structure of economy & relationships of major aggregates
Example: total output, total unemployment, total income
No detail given to specific units (1 individual, 1 company)

MicroeconomicsMicro (up close, microscopic, etc)
Examines individual unitsA householdA firmAn industry
Looks at very small segments of the economy

Positive & NormativePositive economics
Facts, cause & effect relationshipsTheory developmentConcerns what IS
NormativeValue judgements
What OUGHT TO BEPolicy development in order to achieve future
economic goals

The economic problemIndividual
Limited incomeUnlimited wantsBudget line

The economic problemSociety
Scarce resourcesResource categories/INPUTS
LandLabourCapitalEntrepreneurial ability (p.12)
Takes initiative in combining resources to produce good or service
Makes strategic business decisions Risk bearer – no guarantee of profit

Production possibilities model
Scarce resources are used to produce goods and services
AssumeFull employmentFixed resourcesFixed technology2 goods

Production possibilities table
Difference combinations of 2 products that can be made with the available resources, assuming full employment
Economy produces only pizzas and robots
Capital goods (robots) and consumer goods (pizzas)
Production Alternatives
Type of product
A B C D E
Pizzas 0 1 2 3 4
Robots 10 9 7 4 0

Production possibilities table
Consumer goods give MORE NOW, where capital goods promise MUCH MORE LATER
Scarcity prevents society from being able to have more of both goods
Some of 1 must be given up for more of another
Production Alternatives
Type of product
A B C D E
Pizzas 0 1 2 3 4
Robots 10 9 7 4 0

Production possibilities curve
0 1 2 3 4 5 6 7 8 9 100
2
4
6
8
10
12
Robots
Pizzas
Unattainable (outside of curve)
Attainable

Production possibilities curve
Shows different combinations of goods and services that society can produce in fully employed economy Assumes fixed availability of supplies, resources Assumes constant technology
Points ON the curve represents the maximum output of 2 products
Points under the curve, do not use full production Less total output
Points outside the curve are not attainable with current resources and technology
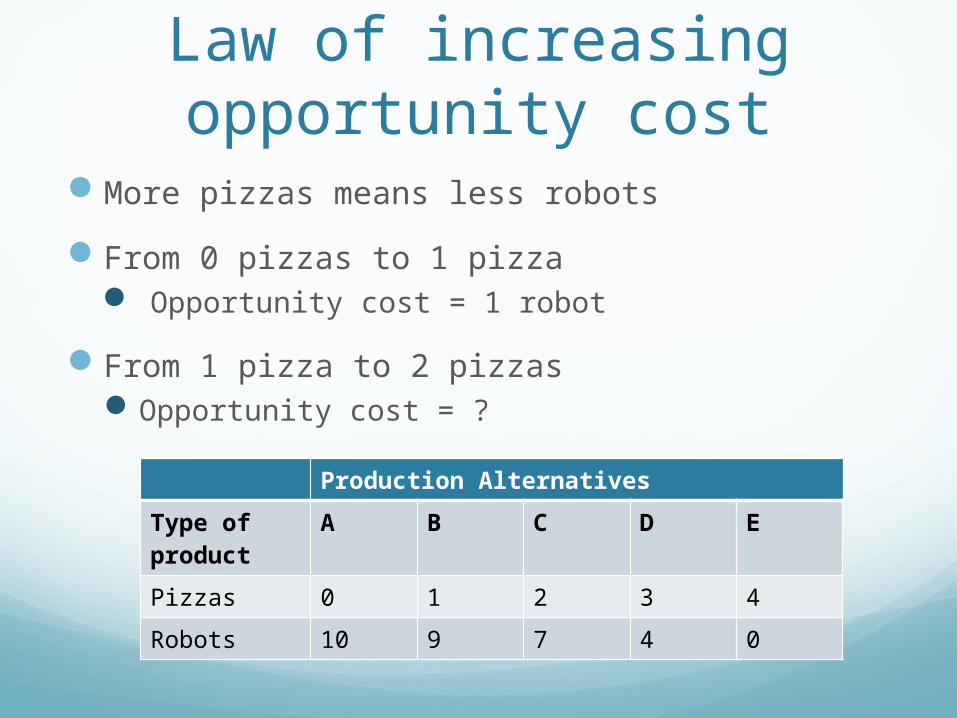
Law of increasing opportunity cost
More pizzas means less robots
From 0 pizzas to 1 pizza Opportunity cost = 1 robot
From 1 pizza to 2 pizzasOpportunity cost = ?
Production Alternatives
Type of product
A B C D E
Pizzas 0 1 2 3 4
Robots 10 9 7 4 0
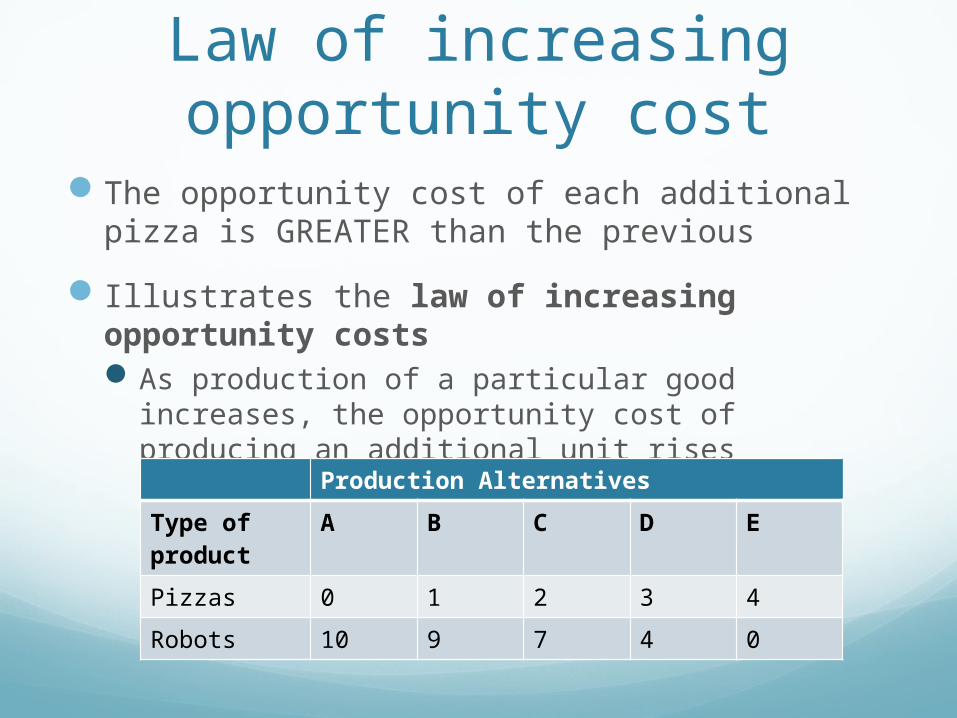
Law of increasing opportunity cost
The opportunity cost of each additional pizza is GREATER than the previous
Illustrates the law of increasing opportunity costsAs production of a particular good increases, the
opportunity cost of producing an additional unit rises
Production Alternatives
Type of product
A B C D E
Pizzas 0 1 2 3 4
Robots 10 9 7 4 0

Shape of the curve
0 1 2 3 4 5 6 7 8 9 100
2
4
6
8
10
12
Robots
Pizzas
Unattainable (outside of curve)
Attainable
Increasing opportunity cost is reflected
Shows as move to more pizzas, giving larger and larger amounts of robots

Economic rationaleRationale for increasing opportunity costs
Resources are not completely adaptable to alternative uses
Many resources are better at producing one type of good than anotherSome land is good for growing resources needed to
make pizzaAs pizza production expands, land that is less suited
to this is used, producing less efficiently

Optimal allocationThe IDEAL or OPTIMAL allocation of resources
occurs when the marginal benefit = the marginal cost
MB = MC

Growth (p19)Maximum output is increased
Could be due to technology advanceMore resources are found
Production possibilities curve shifts outward
0 1 2 3 4 5 6 7 8 9 1002468
1012
Robots
Pizzas0 1 2 3 4 5 6 7 8 9 10
0
5
10
15

Present choices vs future possibilities
By choosing to use resources for goods to consume NOW, we give up the potential for greater growth in the future
Example, p 20.

International tradeAllows for specialization
One country may specialize in producing a type of good due to the presence of resources or more skilled labour
Enable a nation to get more of a specific good at less of a sacrifice than if it was produced at home
HandoutComplete the handout
Fill in the blanks
True and false


![[PPT]DIRECT, PURPOSEFUL EXPERIENCES AND BEYONDcreativityandinnovations21st.weebly.com/uploads/2/4/3/2/... · Web viewWhy are these direct experiences described to be purposeful? Purposeful](https://static.fdocuments.in/doc/165x107/5b1820407f8b9a28258b78ce/pptdirect-purposeful-experiences-and-beyondcreativi-web-viewwhy-are-these.jpg)