
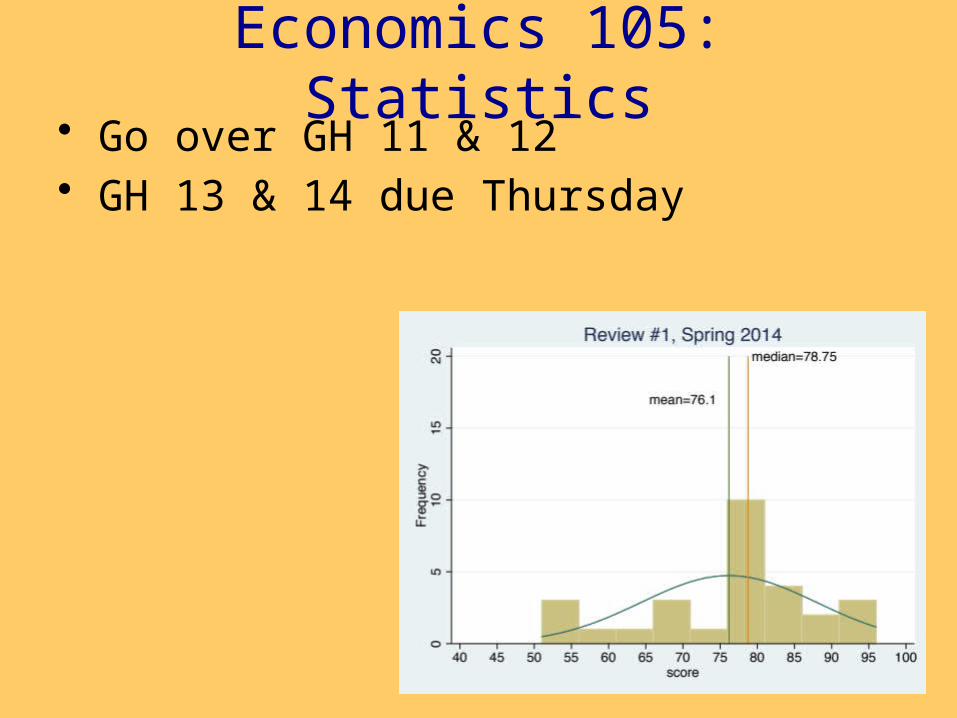
Economics 105: Statistics Go over GH 11 & 12 GH 13 & 14 due Thursday.
19
Economics 105: Statistics • Go over GH 11 & 12 • GH 13 & 14 due Thursday
-
Upload
damien-bemis -
Category
Documents
-
view
223 -
download
0
Transcript of Economics 105: Statistics Go over GH 11 & 12 GH 13 & 14 due Thursday.
Economics 105: Statistics• Go over GH 11 & 12• GH 13 & 14 due Thursday
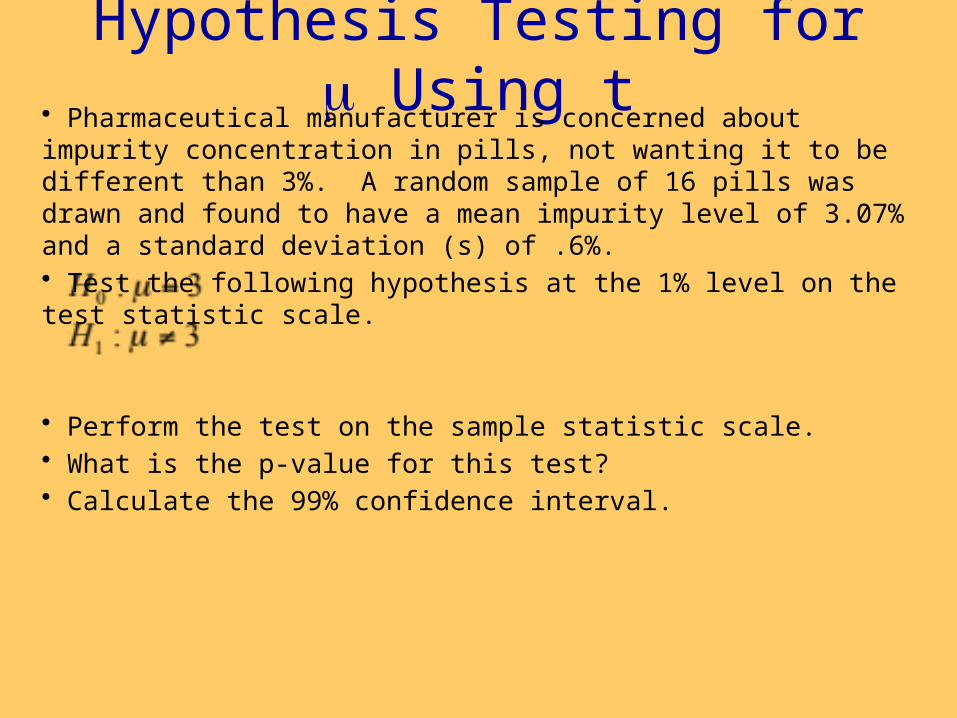
Hypothesis Testing for Using t• Pharmaceutical manufacturer is concerned about impurity concentration in pills, not wanting it to be different than 3%. A random sample of 16 pills was drawn and found to have a mean impurity level of 3.07% and a standard deviation (s) of .6%.• Test the following hypothesis at the 1% level on the test statistic scale.
• Perform the test on the sample statistic scale.• What is the p-value for this test? • Calculate the 99% confidence interval.

When to use z or t-test for H0: = 0Xi~N Xi not ~ N
s s
n ≥ 30 n<30 n ≥ 30 n<30 n ≥ 30 n<30 n ≥ 30 n<30
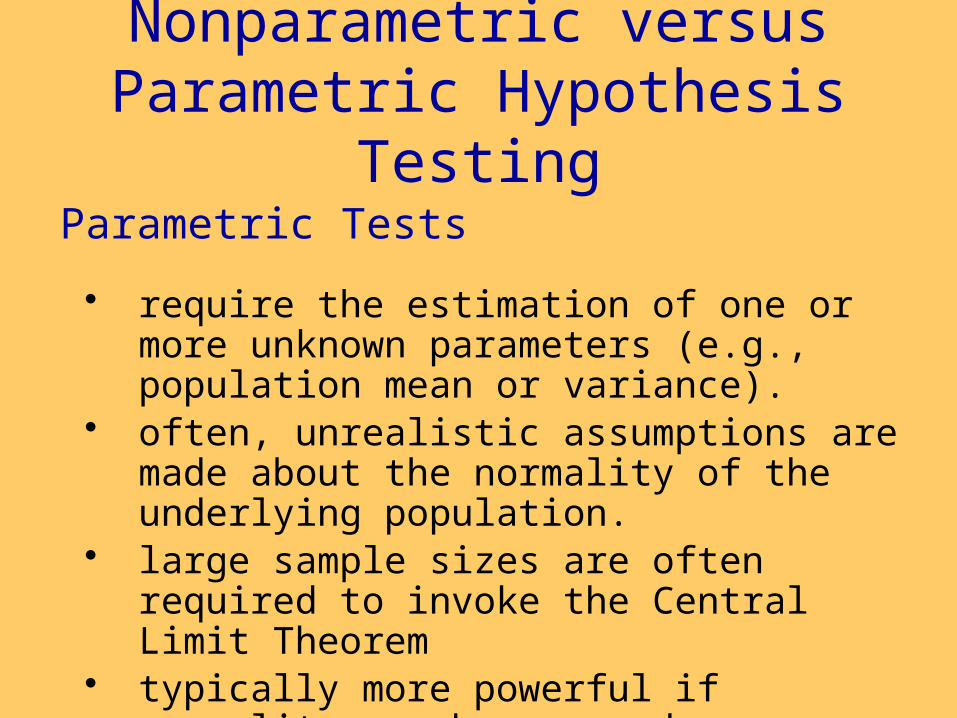
Nonparametric versus Parametric Hypothesis Testing
• require the estimation of one or more unknown parameters (e.g., population mean or variance).
• often, unrealistic assumptions are made about the normality of the underlying population.
• large sample sizes are often required to invoke the Central Limit Theorem
• typically more powerful if normality can be assumed
Parametric Tests

• usually focus on the sign or rank of the data rather than the exact numerical value
• do not specify the shape of the parent population• can often be used in smaller samples• can be used for ordinal data• usually more powerful if normality can’t be assumed• require special tables of critical values if small n
Nonparametric Tests (“distribution-free”)
Nonparametric versus Parametric Hypothesis Testing
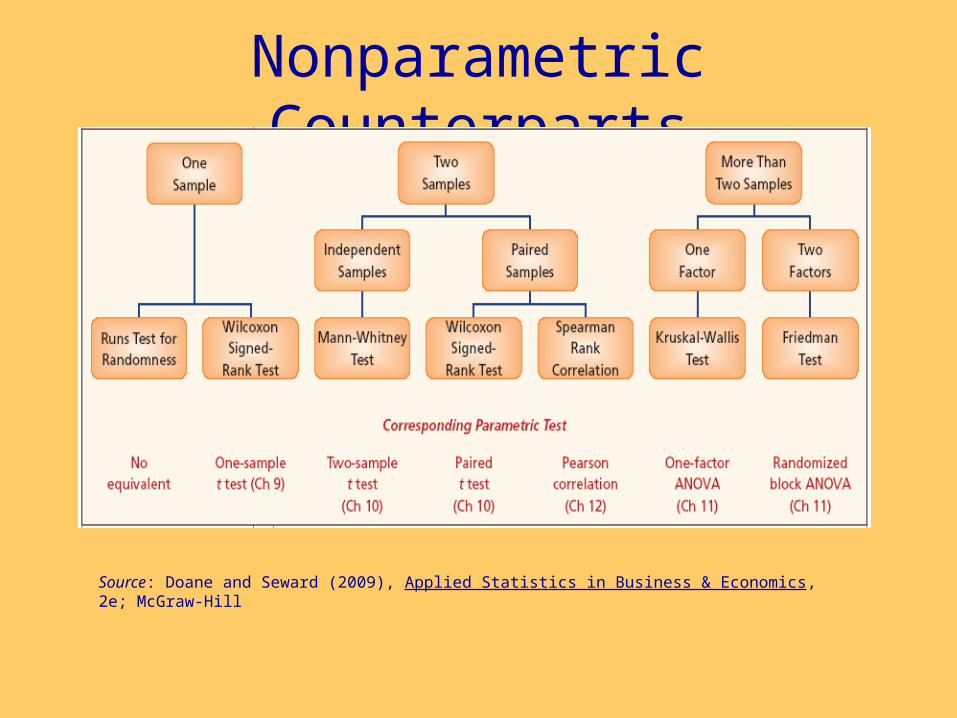
Source: Doane and Seward (2009), Applied Statistics in Business & Economics, 2e; McGraw-Hill
Nonparametric Counterparts
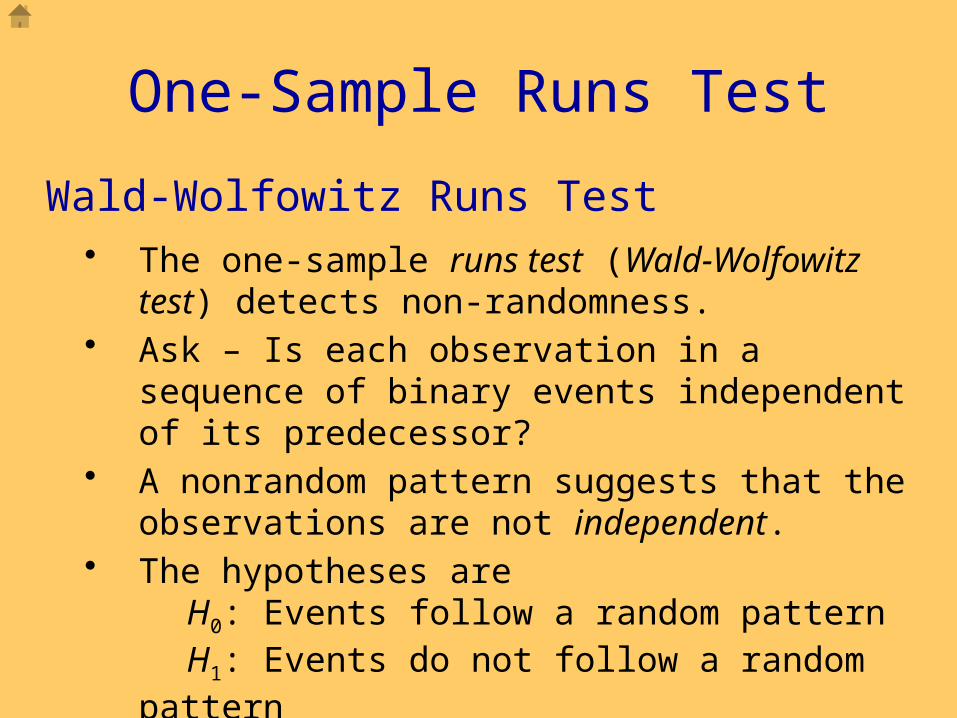
One-Sample Runs Test
• The one-sample runs test (Wald-Wolfowitz test) detects non-randomness.
• Ask – Is each observation in a sequence of binary events independent of its predecessor?
• A nonrandom pattern suggests that the observations are not independent.
• The hypotheses areH0: Events follow a random patternH1: Events do not follow a random pattern
Wald-Wolfowitz Runs Test

One-Sample Runs Test
• To test the hypothesis, first count the number of outcomes of each type.
n1 = number of outcomes of the first typen2 = number of outcomes of the second typen = total sample size = n1 + n2
• A run is a series of consecutive outcomes of the same type, surrounded by a sequence of outcomes of the other type.
Wald-Wolfowitz Runs Test
One-Sample Runs Test
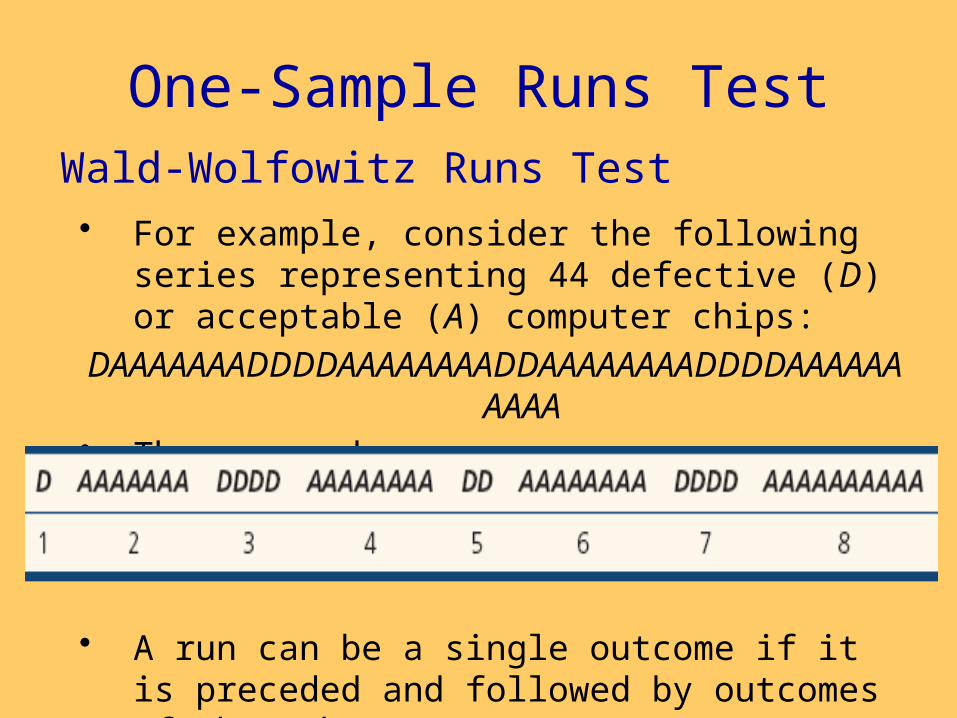
• For example, consider the following series representing 44 defective (D) or acceptable (A) computer chips:
DAAAAAAADDDDAAAAAAAADDAAAAAAAADDDDAAAAAAAAAA
• The grouped sequences are:
• A run can be a single outcome if it is preceded and followed by outcomes of the other type.
Wald-Wolfowitz Runs Test

One-Sample Runs Test
• There are 8 runs (R = 8).n1 = number of defective chips (D) = 11n2 = number of acceptable chips (A) = 33n = total sample size = n1 + n2 = 11 + 33 = 44
• The hypotheses are:H0: Defects follow a random sequenceH1: Defects follow a nonrandom sequence
Wald-Wolfowitz Runs Test
One-Sample Runs Test
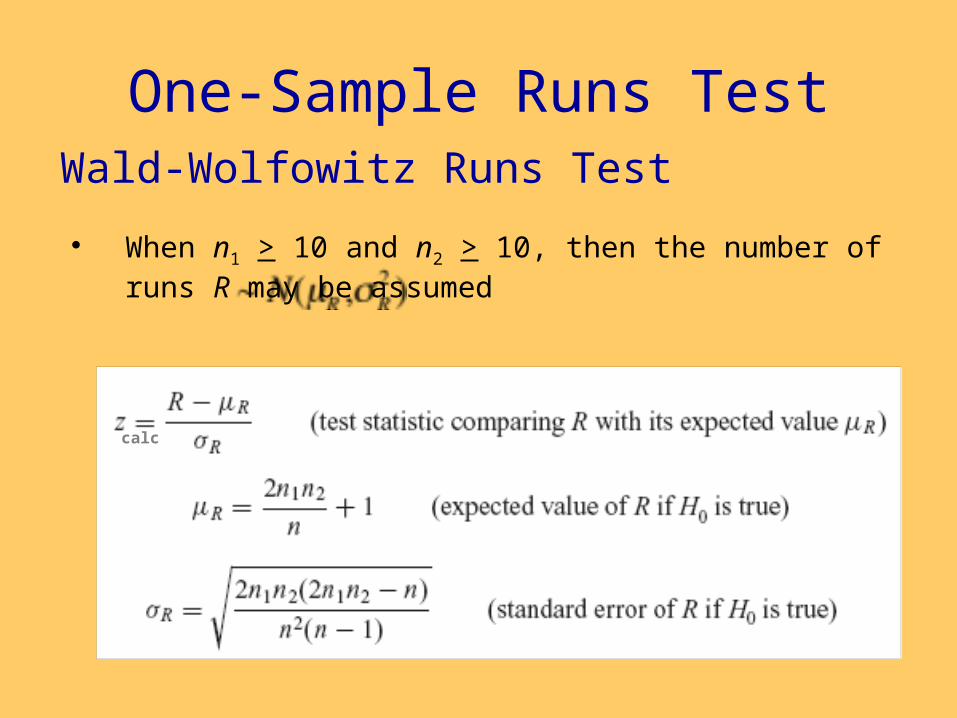
• When n1 > 10 and n2 > 10, then the number of runs R may be assumed
Wald-Wolfowitz Runs Test
calc
One-Sample Runs Test
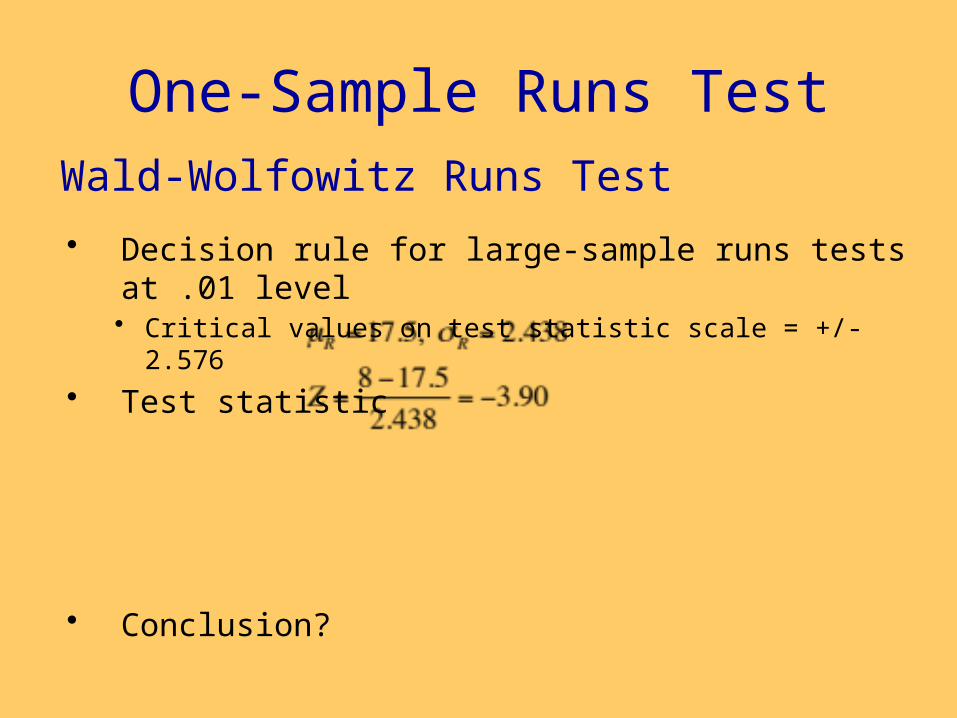
• Decision rule for large-sample runs tests at .01 level• Critical values on test statistic scale = +/- 2.576
• Test statistic
• Conclusion?
Wald-Wolfowitz Runs Test

Source: Doane and Seward (2009), Applied Statistics in Business & Economics, 2e; McGraw-Hill
Nonparametric Counterparts
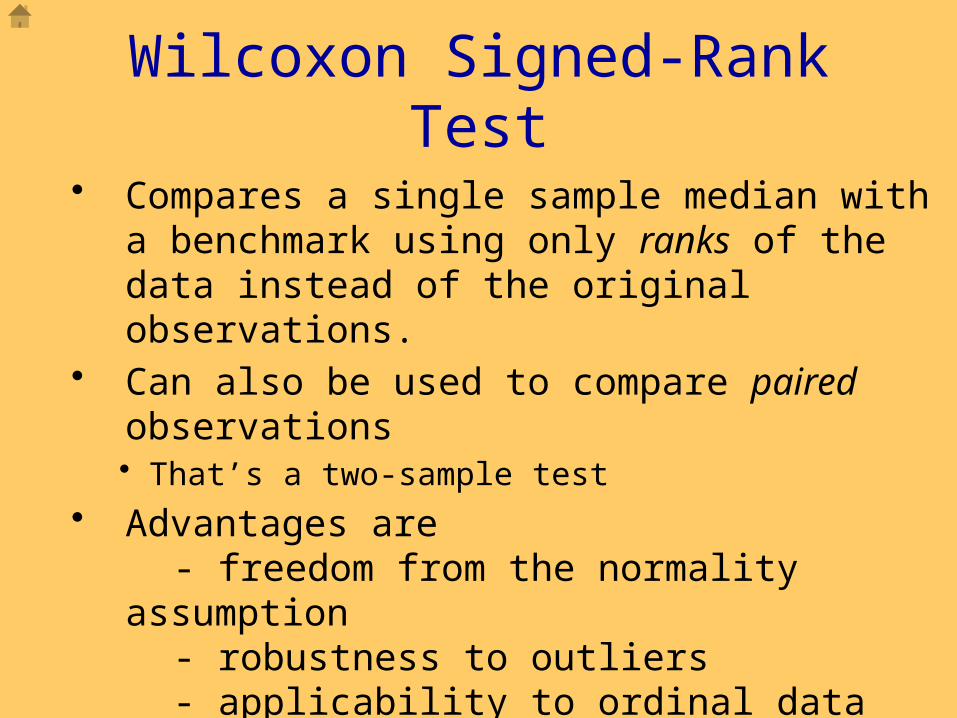
Wilcoxon Signed-Rank Test
• Compares a single sample median with a benchmark using only ranks of the data instead of the original observations.
• Can also be used to compare paired observations • That’s a two-sample test
• Advantages are - freedom from the normality assumption- robustness to outliers- applicability to ordinal data
• The population should be roughly symmetric
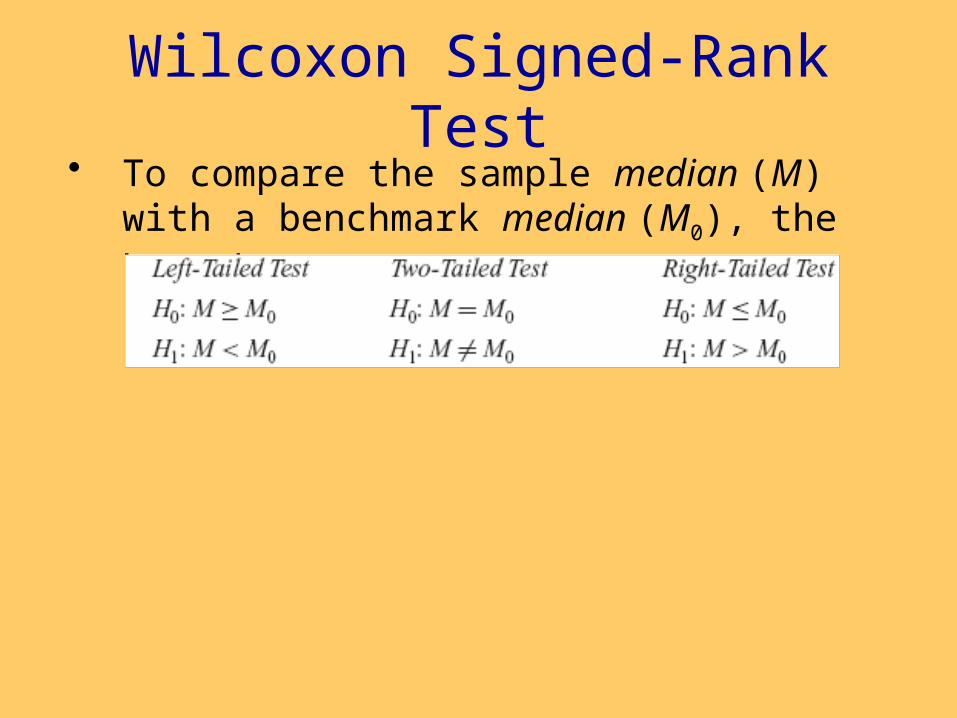
Wilcoxon Signed-Rank Test• To compare the sample median (M) with a
benchmark median (M0), the hypotheses are:
Wilcoxon Signed-Rank Test
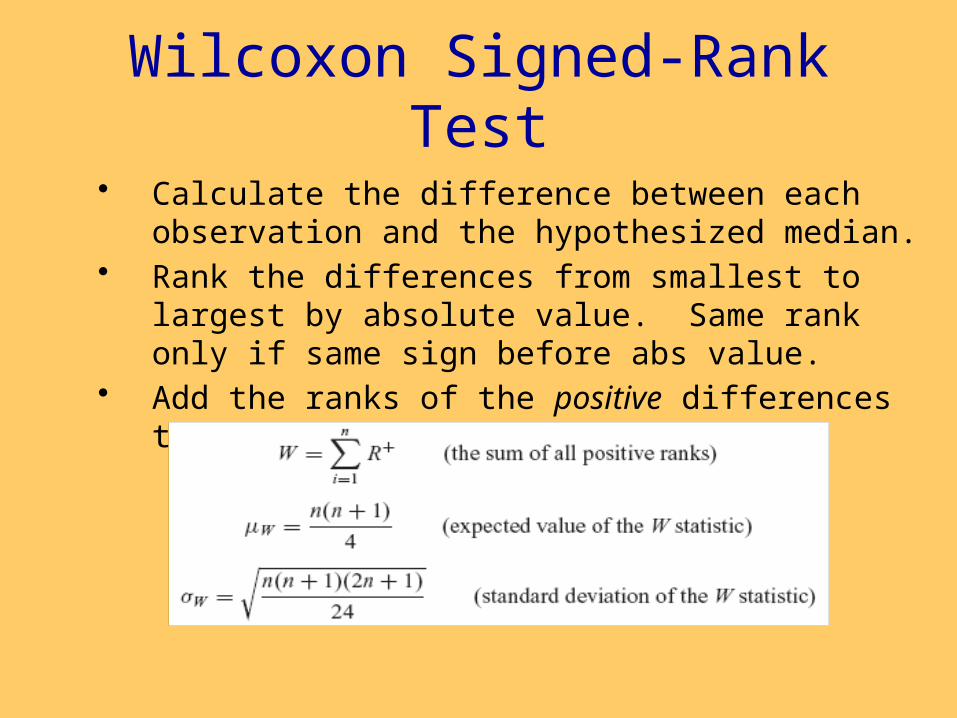
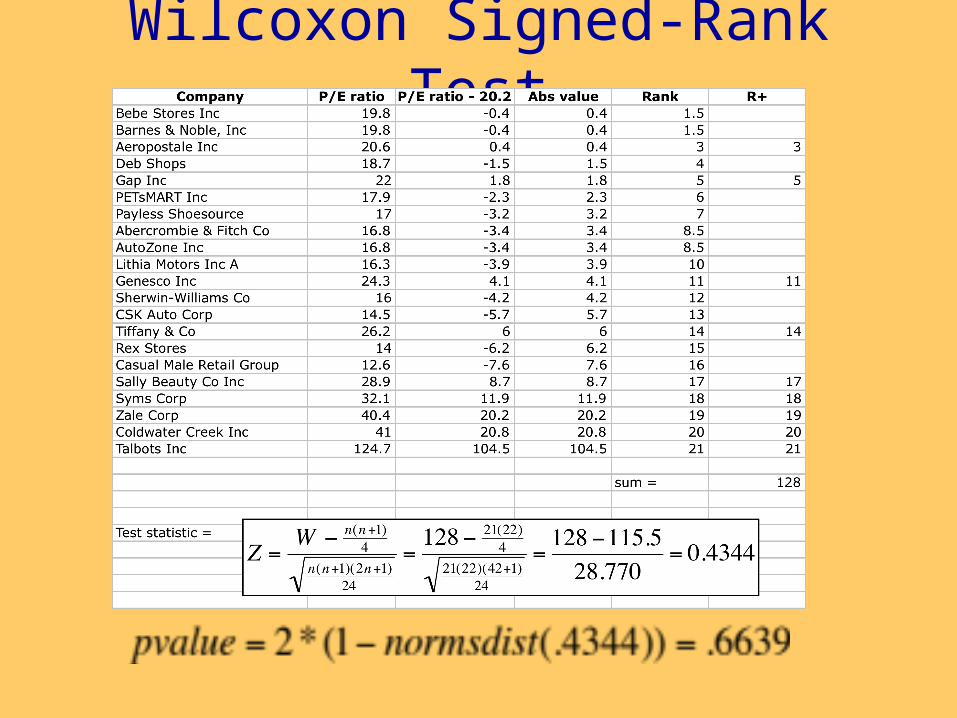
• Calculate the difference between each observation and the hypothesized median.
• Rank the differences from smallest to largest by absolute value. Same rank only if same sign before abs value.
• Add the ranks of the positive differences to obtain the rank sum W.

Wilcoxon Signed-Rank Test
• For small samples, a special table is required to obtain critical values.
• For large samples (n > 20), the test statistic is approximately normal.
• Use Excel to get a p-value • Reject H0 if p-value < a
Wilcoxon Signed-Rank Test
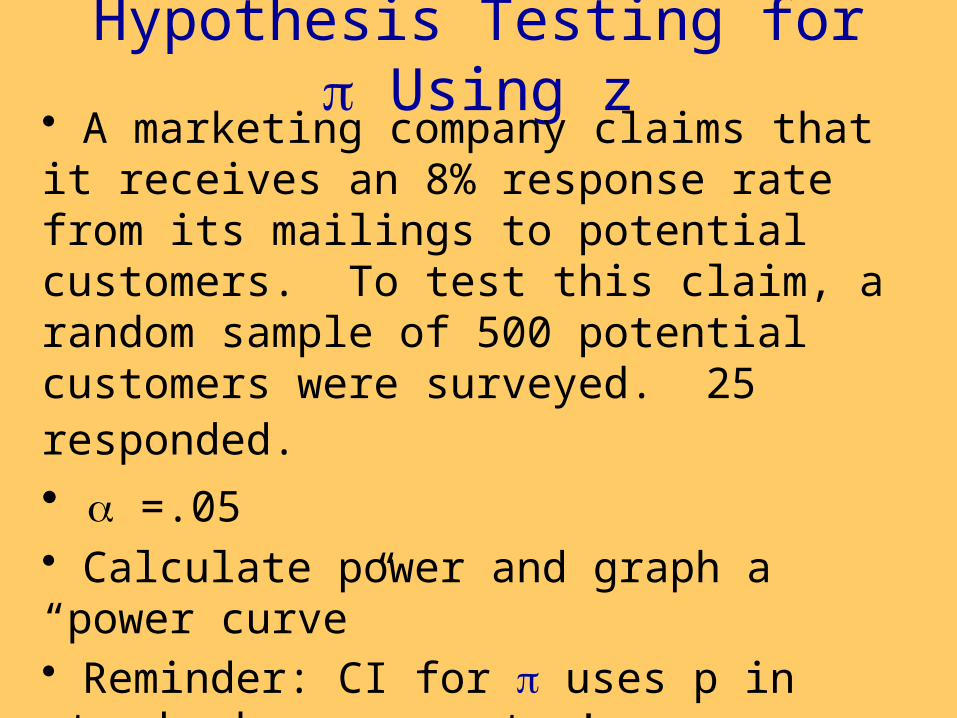
Hypothesis Testing for Using z• A marketing company claims that it receives an 8% response rate from its mailings to potential customers. To test this claim, a random sample of 500 potential customers were surveyed. 25 responded. • =.05 • Calculate power and graph a “power curve”• Reminder: CI for uses p in standard error, not !
– because CI does not assume H0 is true


![á ã - ULisboa · 5hvxpr 5hdol]hl phx surmhwr gh whvh qr oderudwyulr gh 3 ' gh dghvlyrv gh flphqwr gd 0dshl 6s$ hpsuhvd otghu qr fdpsr gh dghvlyrv vhodqwhv h surgxwrv txtplfrv sdud](https://static.fdocuments.in/doc/165x107/60fd575d9fb9b014e3322db6/-ulisboa-5hvxpr-5hdolhl-phx-surmhwr-gh-whvh-qr-oderudwyulr-gh-3-gh-dghvlyrv.jpg)


