Economical! - · PDF file– $40k hardware –$10k/flight Siletz Spit, OR Courtesy Tom...
37
Transcript of Economical! - · PDF file– $40k hardware –$10k/flight Siletz Spit, OR Courtesy Tom...

• Equipment – (2) 1.5-m marked rods, short tape• Survey advances from benchmark stopping every few
meters to sight horizon and read difference in elevation.• Errors cumulative & severe, use on short, flat beaches only
VeryEconomical!

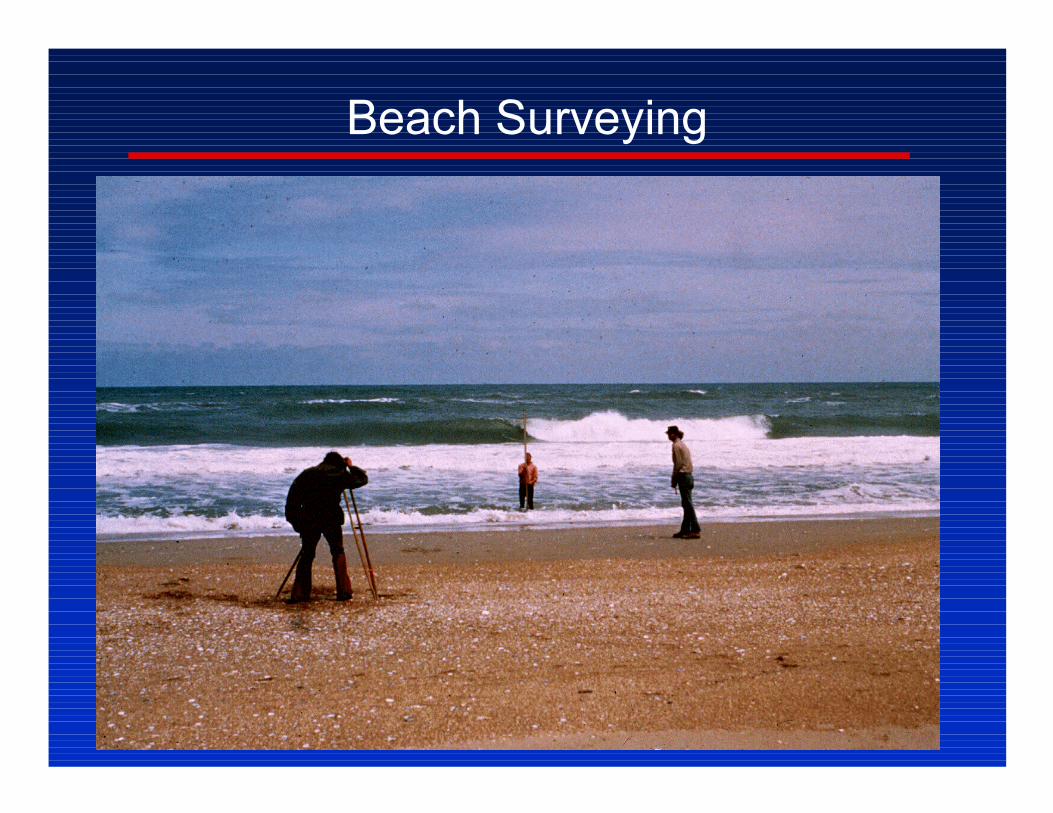
Rod, Level & Tape SurveyOld standby. Cheap, fast, high potential for errors, still useful
• Equipment -Automatic Level, tape, 8 m fiberglass rod• Data collected at breaks in slope• Errors: Rod-reading, leveling, note-taking• Variant – read stadia hairs to determine distance, replacing tape

Electronic total station Reflecting prism
Range-Azimuth System

GPS Beach Surveys
• Fast• Accurate (± 3 cm)• Large spatial coverage• Depth & beach limited• Very cool

Surf Zone Surveys
A swimmer can get only so deep!

Halloween Storm of 1991
Need to Measure Small Profound Changes
Line Survey Date 188 396 23 OCT 91 188 399 3 NOV 91
100 200 300 400 500 600 700 800 900 1000-10
-8
-6
-4
-2
0
2
Distance, m
20 cm change= 125 m3/m
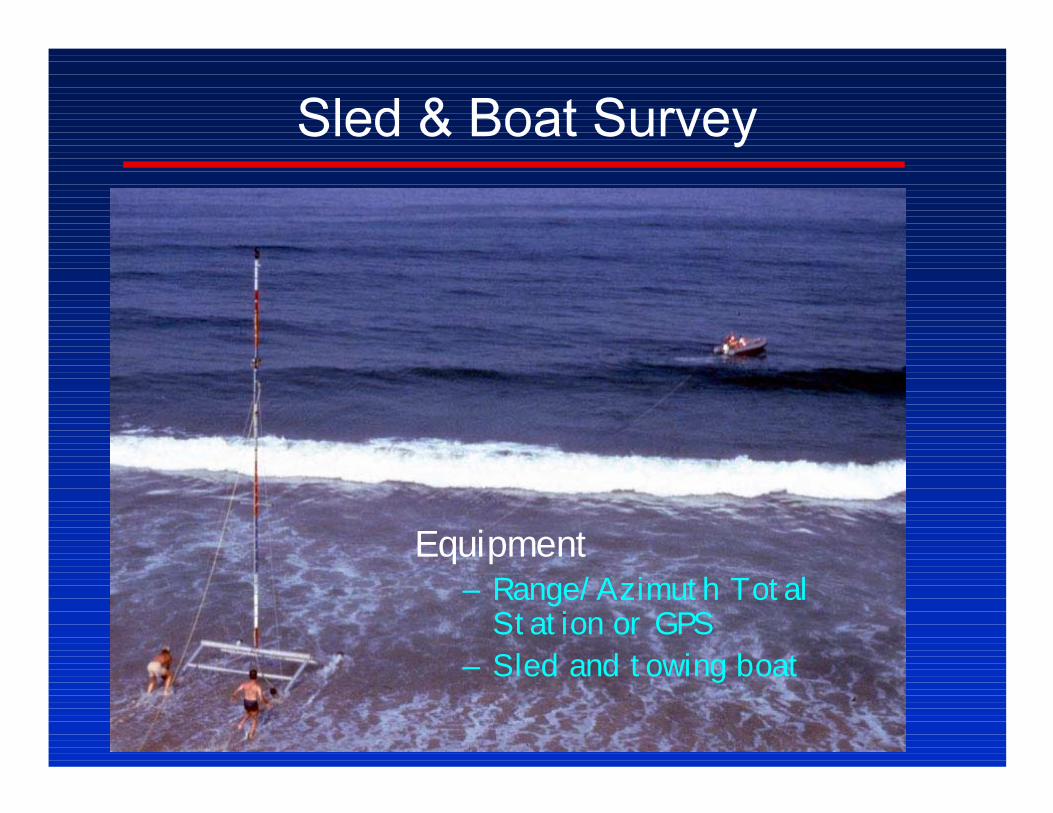
Equipment– Range/Azimuth Total
Station or GPS– Sled and towing boat

Sled & Boat Survey System
• Depth Range: <50 ft (13 m)• Max wave height: 3 ft (1 m)• Speed > 3 km/hr• Advantages
– Mobile– CRAB Accuracy– Sleds are cheap
• Disadvantages– Requires 5-Person Crew– Logistically & Physically– Demanding– Equipment Requirements– Condition Limitations

Envelope of 5 Sled Surveys

• Amphibious vessel to cover beach and nearshore
• Leadline or acoustic sounder for depth
• Two transits for horizontal positioning
• Radio communication for timing
• No accommodation for waves
• Can still do today!

0 100 200 300 400 500 600 700 800 900-10
-5
0
5
Distance, m
Beach/Boat SurveyCRAB Survey
40 cmmissed section
Typical Nearshore Survey
Fathometer ProblemsWave motionShip motionWater density profileWater/Tide level

Boat
Single or multi-beam depth Sounder
GPS
or
Range-Azimuth

Depth is indirectly measured
• Wave motion• Ship motion• Water density
profile• Bar Check• Water/Tide level


Envelope of 5 Analog Fathometer Surveys

Impact of Survey Accuracy on a Contour Map
• Wave motion• Systematic tide
error• Density
stratification– bar check
• Ship motion– squat

Vertical Error Volume Error SYSTEM ft cm cu yd/1000 ft cu m/300 m
CRAB/SLED 0.06 1.8 4,400 3,300
FATHOMETER ANALOG 0.30 9.1 22,200 16,700 DIGITAL 0.74 22.5 54,800 41,200
EFFECT OF VERTICAL ACCURACY ON COMPUTED VOLUMES
Use these where appropriate

An Order of Magnitude Improvement
HYPACK navigation software screen display
• Kinematic Differential GPS – Horizontal Position– Wave Motion (at least a lot of
it)– Water Level
• Digital Sounder – Single transducer or
multibeam• PC based navigation (HYPACK)
– Easy data handling
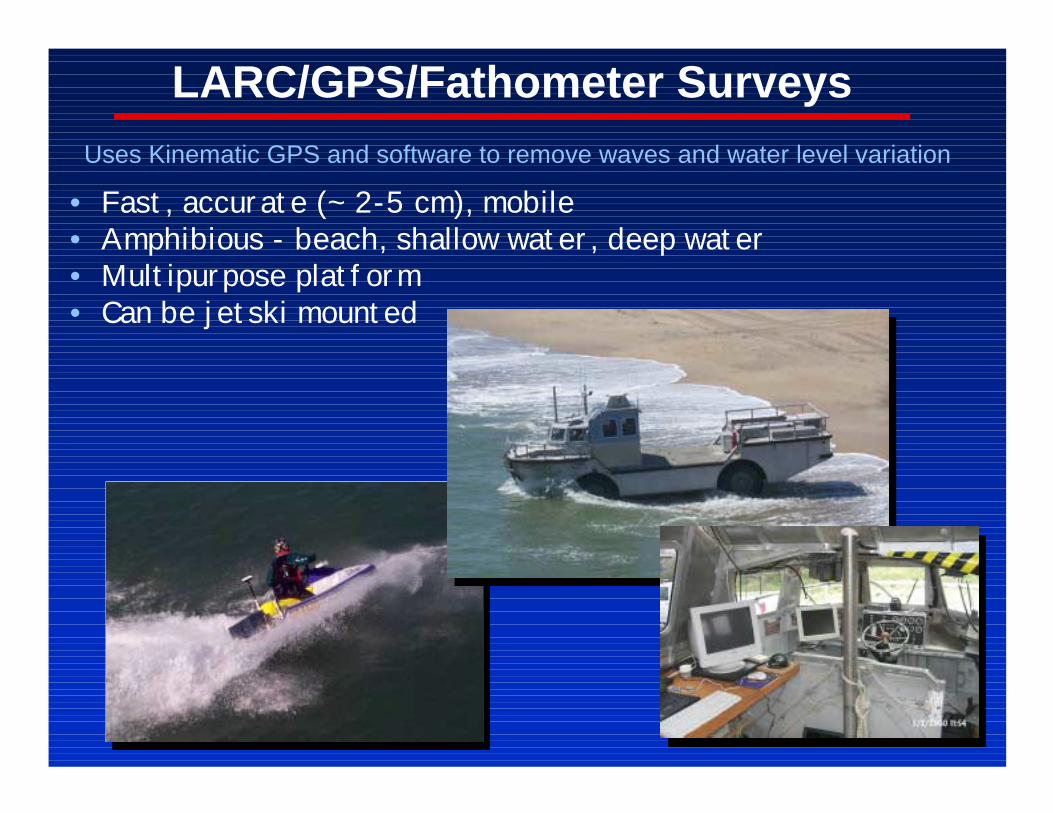
LARC/GPS/Fathometer SurveysUses Kinematic GPS and software to remove waves and water level variation
• Fast, accurate (~ 2-5 cm), mobile• Amphibious - beach, shallow water, deep water• Multipurpose platform• Can be jetski mounted

0 200 400 600 800 1000
-2
0
2
4
6
8
GPS
Fathometer
m
Distance offshore, m
0 200 400 600 800 1000
-2
0
2
4
6
8
GPS
Fathometer
m
Distance offshore, m

Fathometer depths adjusted for sound speed profile
10
8
6
4
2
0
1513 1514 1515 1516 1517Sound Speed, m/s
Dep
th, m
Profiles taken multiple times during the survey day

0 200 400 600 800 1000
-10
-8
-6
-4
-2
0
2
4
Fathometer
CRAB
5 point average of fathometer data
Elev
atio
n, m
Distance, m
300 320 340
-4.0
-3.5
-3.0
Distance, m
m
0 200 400 600 800 1000
-10
-8
-6
-4
-2
0
2
4
Fathometer
CRAB
5 point average of fathometer data
Elev
atio
n, m
Distance, m
300 320 340
-4.0
-3.5
-3.0
Distance, m
m

Scanning Hydrographic Operational Airborne Lidar: SHOALS
http://shoals.sam.usace.army.mil/• Twin Otter Aircraft• Altitude of 200 m, at 60 or 120 kn• Survey 8-32 km2/hr• Depth soundings every 4 m• Using GPS, horizontal accurate to
3 m, vertical to 15 cm

• Fast• Accurate (<10 cm)• Subaqueous (SHOALS)• Complete coverage• Price competitive• Some data exist• Concerns
– Cost– Vegetation– Water clarity– Availability


• Water visibility is limiting factor – can see ~3 times Secchi
reading• Creates large data set

SWASH survey
Surveying ATV
• Amphibious• Accuracy: x,y,z to cm• Slope: 0.4 degrees• GPS-overprinted video• MHW - Shoreline• Fast - 20km/low tide• COE/Contractors can do• System cost: ~$60k
Courtesy, Jeff List, USGS

• Developed cooperatively with Oregon State University at the FRF
• 7 cameras record hourly, on the web• World-wide network of coastal cameras• Good for monitoring known problem areas
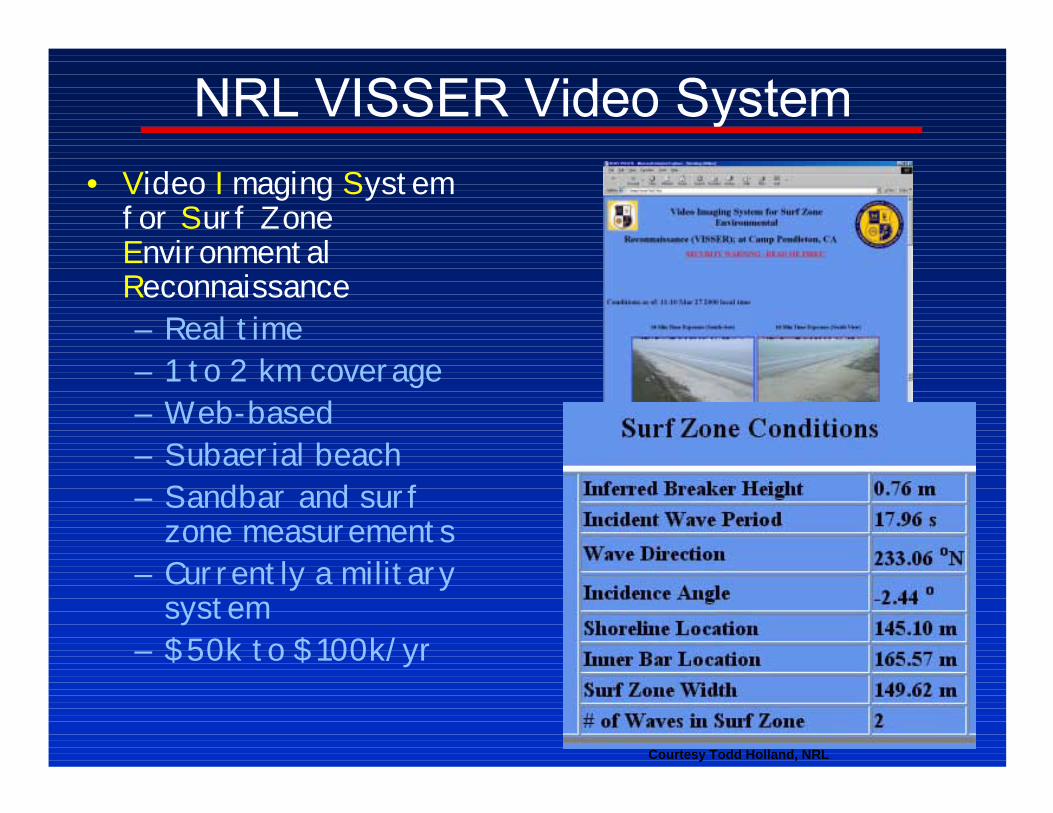
• Video Imaging System for Surf Zone Environmental Reconnaissance– Real time– 1 to 2 km coverage– Web-based– Subaerial beach– Sandbar and surf
zone measurements– Currently a military
system– $50k to $100k/yr
Courtesy Todd Holland, NRL

10 k
m
Aerial Time Exposure to Quantify• Shoreline• Beach width• Sandbars
Courtesy Tom Lippmann, OSU
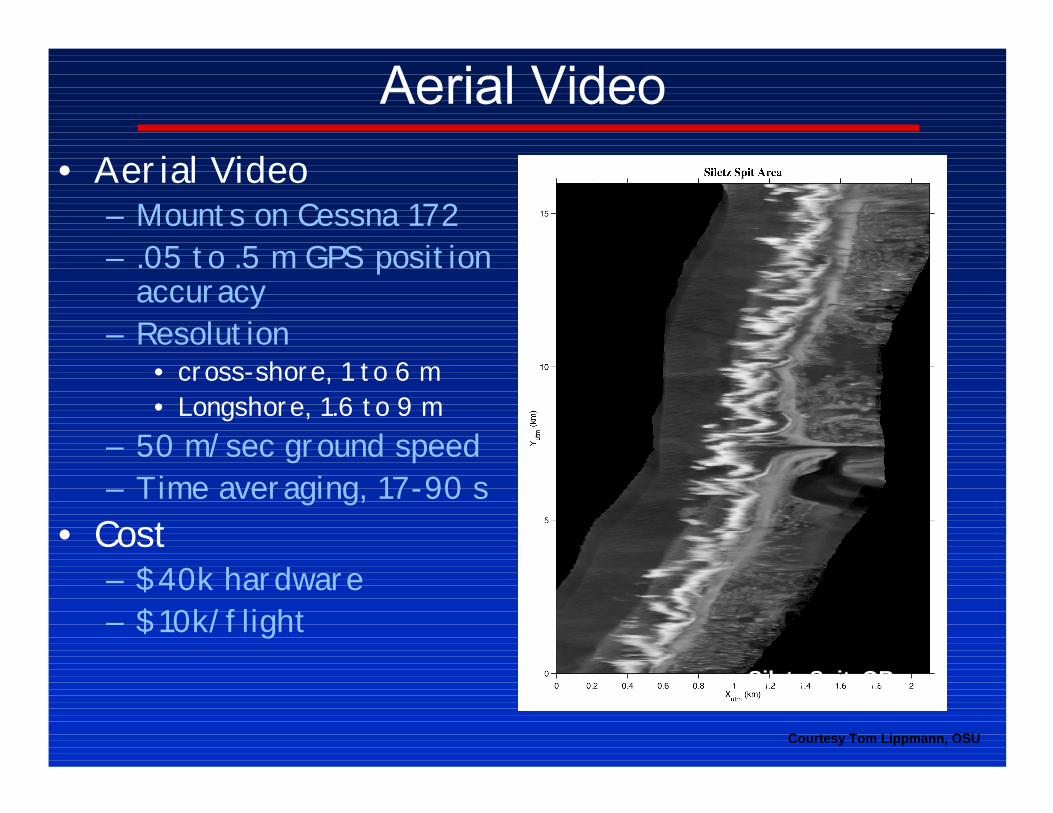
• Aerial Video– Mounts on Cessna 172– .05 to .5 m GPS position
accuracy– Resolution
• cross-shore, 1 to 6 m• Longshore, 1.6 to 9 m
– 50 m/sec ground speed– Time averaging, 17-90 s
• Cost– $40k hardware– $10k/flight
Siletz Spit, OR
Courtesy Tom Lippmann, OSU

core locations
Post-storm
Pre-storm
Multi-beam & Interfermetric Sidescan Survey
Courtesy Jesse McNinch, NCSU
• Subaqueous (deeper water only)
• Continuous coverage possible• Can be combined with seismic
and sidescan• Reveals 3D Sandbars and
bedforms

Sorry, all these are DOS programs which will run under windows
PC Software Programs
• ISRP - Interactive Survey Reduction Program– Interactive cross-section data entry, editing,
plotting– Handles many surveys of the same profile
• Volume– computes volumetric changes and other useful
parameters for every survey in a ISRP file• BMAP - Beach Morphology Analysis Program
– suite of useful cross-section analysis tools– works with ISRP data

Useful References
• Engineering Manuals• http://www.usace.army.mil/inet/usace-docs/eng-
manuals/cecw.htm– Hydrographic Surveying, EM 1110-2-1003– Coastal Project Monitoring, EM 1110-2-1004– Topographic Surveying, EM 1110-1-1005– NAVSTAR Global Positioning System Surveying, EM 1110-1 -1003
• Coastal Engineering Technical Notes• http://chl.wes.army.mil/library/publications/chetn/
– CETN II-31, Nov 1993 Guidelines for Surveying Beach Nourishment Projects
– CETN II-38, June 1997 Beach and Nearshore Survey Technology

• Understand the variation in the system
• Sample to define the temporal & spatial variation
• Define the products/computations required
• Pick the most appropriate survey method that fits the budget
• Anticipate errors - handle them early


![[Walter Lippmann] Public Opinion(BookFi.org)](https://static.fdocuments.in/doc/165x107/54549df5b1af9f89308b4655/walter-lippmann-public-opinionbookfiorg.jpg)