ECONOMIC WELL BEING OF OLDER MALAYSIANS · PDF fileECONOMIC WELL BEING OF OLDER MALAYSIANS ......
12
Benjamin Chan Yin-Fah Tutor, Faculty of Human Ecology Research Associate, Institute of Gerontology ECONOMIC WELL BEING OF OLDER MALAYSIANS South East Asian Conference on Ageing 2010: Improving Well Being in Later Life 17 - 18 July, Grand Millennium Hotel Kuala Lumpur, Federal Territory of Kuala Lumpur, Malaysia Ageing is a global phenomenon Malaysia, along with other nations has been experiencing population ageing What will happen if there is more and more older persons? Macro Perspectives, Micro Perspectives
Transcript of ECONOMIC WELL BEING OF OLDER MALAYSIANS · PDF fileECONOMIC WELL BEING OF OLDER MALAYSIANS ......

Benjamin Chan Yin-FahTutor, Faculty of Human Ecology
Research Associate, Institute of Gerontology
ECONOMIC WELL BEING
OF OLDER MALAYSIANS
South East Asian Conference on Ageing 2010: Improving Well Being in Later Life
17 - 18 July, Grand Millennium Hotel Kuala Lumpur, Federal Territory of Kuala Lumpur, Malaysia
Ageing is a global phenomenon
Malaysia, along with other nations has been
experiencing population ageing
What will happen if there is more and more older persons?
Macro Perspectives, Micro Perspectives
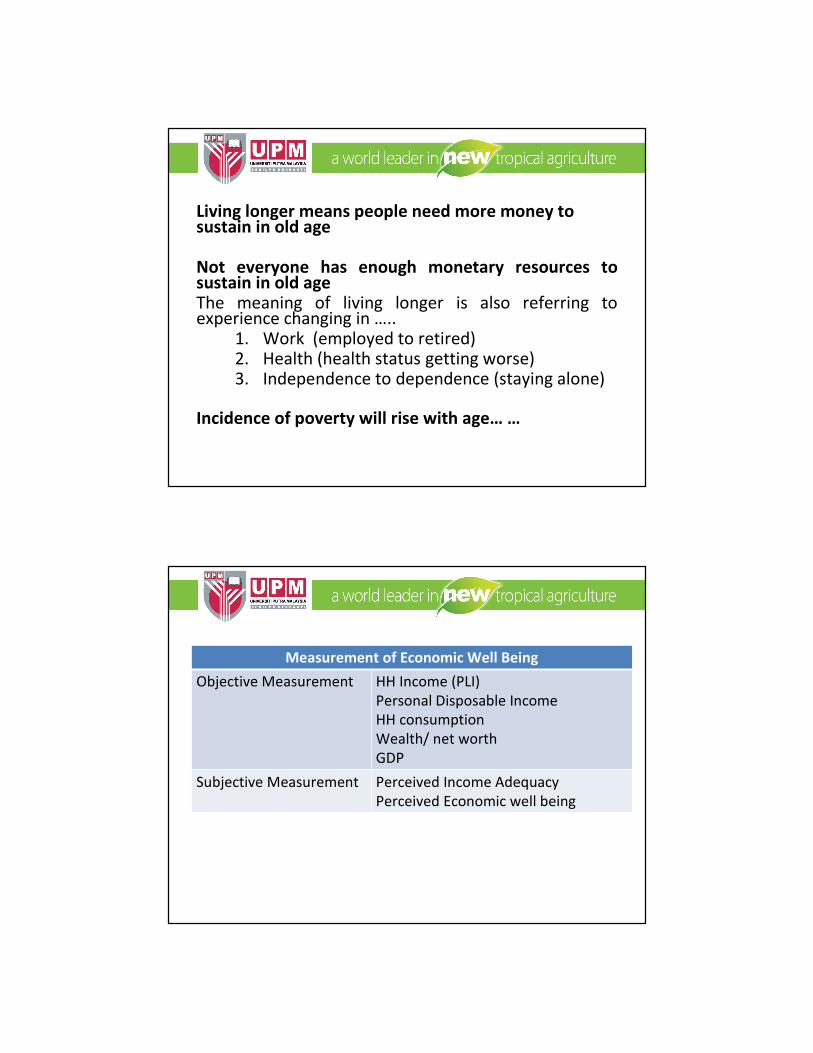
Living longer means people need more money to sustain in old age
Not everyone has enough monetary resources to sustain in old age The meaning of living longer is also referring to experience changing in …..
1. Work (employed to retired)2. Health (health status getting worse)3. Independence to dependence (staying alone)
Incidence of poverty will rise with age… …
Measurement of Economic Well Being
Objective Measurement HH Income (PLI)
Personal Disposable Income
HH consumption
Wealth/ net worth
GDP
Subjective Measurement Perceived Income Adequacy
Perceived Economic well being
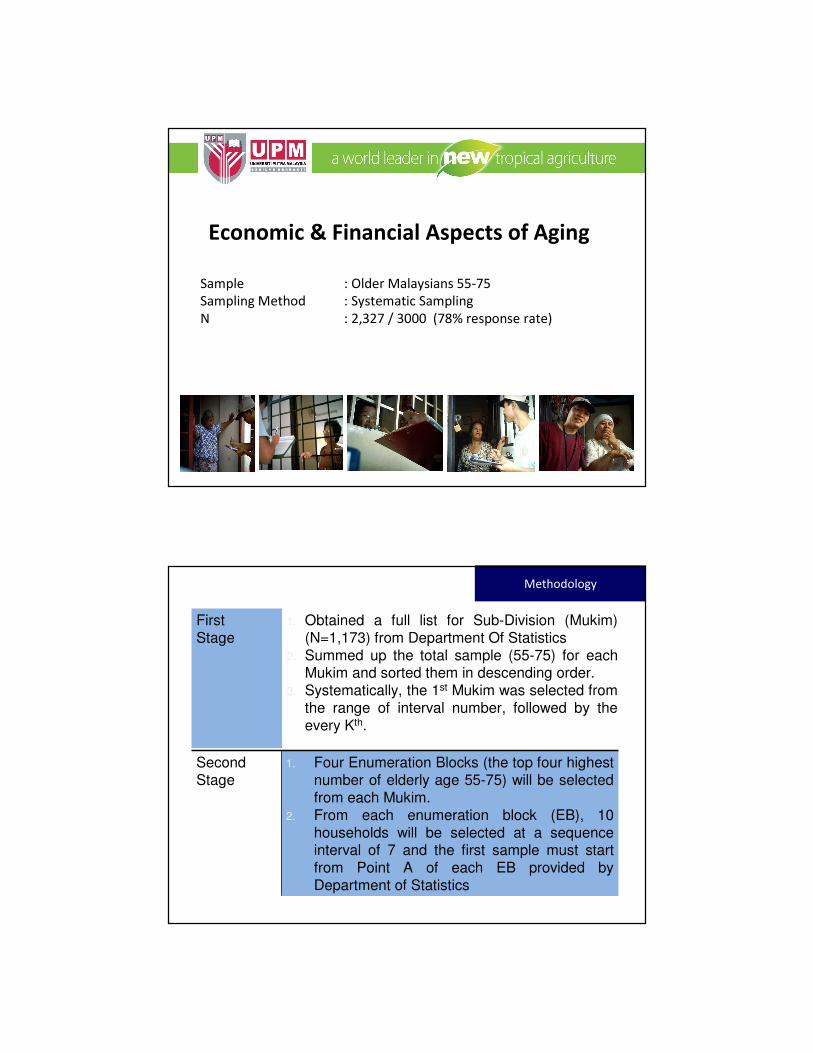
Sample : Older Malaysians 55-75
Sampling Method : Systematic Sampling
N : 2,327 / 3000 (78% response rate)
Economic & Financial Aspects of Aging
First Stage
1. Obtained a full list for Sub-Division (Mukim) (N=1,173) from Department Of Statistics
2. Summed up the total sample (55-75) for each Mukim and sorted them in descending order.
3. Systematically, the 1st Mukim was selected from the range of interval number, followed by the every Kth.
Second Stage
1. Four Enumeration Blocks (the top four highest number of elderly age 55-75) will be selected from each Mukim.
2. From each enumeration block (EB), 10 households will be selected at a sequence interval of 7 and the first sample must start from Point A of each EB provided by Department of Statistics
Methodology

Sampling Frame
PENAMPANG (N=40)
KOTA KINABALU (n=37)
KOTA BELUD (n=40)
KUDAT (n=40)
SANDAKAN
LAHAD DATU (n=36)
TAWAU (n=40)
Total (n=253)
KUCHING (N=60)
DARO (N=22)
SIBU (N=16)
TATAU (N=30)
KAPIT (N=40)
BINTULU (N=25)
SIBUTI (N=40)
Total (N=233)
Total = 1,841
Variable %
Gender
Male 50.6
Female 49.4
Age Group
55-5929.9
60-6426.9
65-6924.8
70 and older 18.4
Ethnicity
Malay 55.7
Chinese 22.5
Indians 7.0
Aboriginal 14.9
Variable %
Marital Status
Never Married 2.0
Married 65.8
Divorced, Widow, widower 32.1
Highest education level
Never to school 34.6
Up to primary level 46.6
Up to secondary level or above 18.7
Living Arrangement
Staying Alone 4.6
Only with spouse 13.9
With children/ grandchild, son and
daughter-in-law
80.0
With unrelated persons 1.5
Respondent's Profile…..
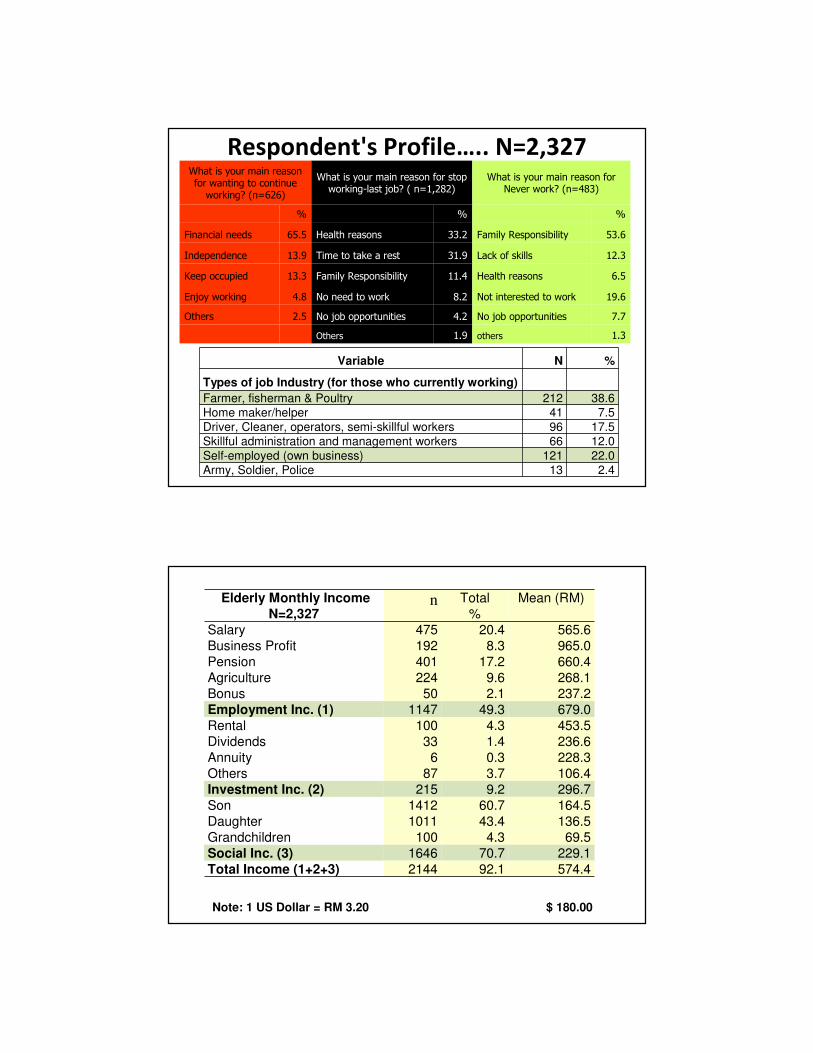
Variable N %
Types of job Industry (for those who currently working)
Farmer, fisherman & Poultry 212 38.6
Home maker/helper 41 7.5
Driver, Cleaner, operators, semi-skillful workers 96 17.5
Skillful administration and management workers 66 12.0
Self-employed (own business) 121 22.0
Army, Soldier, Police 13 2.4
What is your main reason for wanting to continue
working? (n=626)
What is your main reason for stop working-last job? ( n=1,282)
What is your main reason for Never work? (n=483)
% % %
Financial needs 65.5 Health reasons 33.2 Family Responsibility 53.6
Independence 13.9 Time to take a rest 31.9 Lack of skills 12.3
Keep occupied 13.3 Family Responsibility 11.4 Health reasons 6.5
Enjoy working 4.8 No need to work 8.2 Not interested to work 19.6
Others 2.5 No job opportunities 4.2 No job opportunities 7.7
Others 1.9 others 1.3
Respondent's Profile….. N=2,327
Elderly Monthly IncomeN=2,327
n Total
%
Mean (RM)
Salary 475 20.4 565.6
Business Profit 192 8.3 965.0
Pension 401 17.2 660.4
Agriculture 224 9.6 268.1
Bonus 50 2.1 237.2
Employment Inc. (1) 1147 49.3 679.0
Rental 100 4.3 453.5
Dividends 33 1.4 236.6
Annuity 6 0.3 228.3
Others 87 3.7 106.4
Investment Inc. (2) 215 9.2 296.7
Son 1412 60.7 164.5
Daughter 1011 43.4 136.5
Grandchildren 100 4.3 69.5
Social Inc. (3) 1646 70.7 229.1
Total Income (1+2+3) 2144 92.1 574.4
Note: 1 US Dollar = RM 3.20 $ 180.00

Elderly Adjusted Expendituren Total
%
Mean (RM)
Dine In 2310 99.3 101.3
Dine out 833 35.8 37.1
Cloth 1308 56.2 17.3
Rental 172 7.4 72.3
Vehicle 932 40.1 42.6
Utilities Bills 2188 94.0 26.0
Communication 1411 60.6 22.8
Health Cost 1106 47.5 26.7
Leisure 225 9.7 34.7
Reading 649 27.9 11.0
Tuition Fees 482 20.7 38.0
Others 111 4.8 36.7
Total Expenditure 2327 100.0 213.0
Negative Income Net Flow 489 21.1 (401.9)
Positive Income Net Flow 1790 76.9 19,665
Note: 1 US Dollar = RM 3.20 $ 67
Assets N
(2,327)
Total
%
Mean (RM)
Fix AssetsLand 993 42.7 44430.7
House 1697 72.9 52874.5
Vehicle 1064 45.7 20205.1
Shop lot 18 0.8 92000.0
Poultry 114 4.9 6764.3
Jewelry 993 42.7 44430.7
Sub-Total (1) 1885 81.0 83953.3
Monetary AssetsSavings 907 38.9 11580.29
Investments 265 11.4 19962.1
EPF 221 9.5 20466.4
Insured Insurance 133 5.7 53355.8
Sub-Total (2) 1049 45.1 25748.9
Total (1)+(2) 2036 87.5 90993.4
Note: 1 US Dollar = RM 3.20 $ 28435

Debt N
(2,327)
Total
%
Mean (RM)
Land 30 1.3 9658
House 122 5.2 15137
Vehicle 92 4.0 11928
Building 7 0.3 18019
Furniture 37 1.6 3355
Investment 21 0.9 25728
Total Liabilities 263 11.3 15302
Net Worth 1907 81.9 84595.6
Note: 1 US Dollar = RM 3.20 $ 26435
Subjective Measures: Income Adequacy
Single-measured Item, Five-points ordinal scale“Sir/Madam, is your current income adequate for your basic needs?
For income adequacy, about 63% of the total respondents revealed that their current income was not adequate for their daily expenses.
The remaining 37% respondents perceived that their income was adequate for their living expenses and some were able to save from their income.

Type of
Measurement
Category Percentage
Income Net Flow Positive 76.9
Negative 21.1
Net Worth Positive 81.9
Negative 18.1
Perceived Income
Adequacy
Adequate 37.0
Not Adequate 63.0
(+) Net flow
(+) Net Worth
(+) Net flow
(-) Net Worth
(-) Net flow
(+) Net Worth
(-) Net flow
(-) Net Worth
Adequate
Income
Adequacy
Not
Adequate
Income
Adequacy
x

At Risk Group Economically
Advantage Group
Economically
Disadvantage Grp
At Risk Group
Not adequate Adequate
Do not meet
the standard
meet
the standardIn
com
e N
et
flo
w a
nd
Ne
t W
ort
h
Perceived Income Adequacy
Level of Economic Well Being
1. Four typologies were tabulated prior in explaining the level of
economic well being in this study
2. The first typology was defined as “economically disadvantage group”,
the last typology was defined as “economic advantages group” while
“at risk group” deprived form the combination of the second and
third typology
Economically advantage Grp VS At Risk Grp1. Male were 1.25 times more likely than female in advantaged group
over the at risk group given all other predictors variables in the
modal are held constant
2. Indian respondents were fifty percent less likely to be in
advantaged group over the at risk group compared to aboriginal
group.
3. Those who were working, with financial preparing and good health
were 1.3 times more likely to be in advantaged group over the at
risk group than those who were not working, not preparing for
financial security in old age and with poor self rated health.
4. This study also found that those older Malaysians who are
practicing good financial management were one times more likely
in economically advantages group than those with poor financial
practices.

Economically Disadvantage Grp VS At Risk Grp
1. Malay, Chinese and Indians were 1.5 times, 1.5 times and 2.3
times more likely to be in economically disadvantage group
over at risk group than aboriginal group, respectively.
2. Those who were uneducated (2 times) and up to primary
education level (1.6 times) were also more likely to be in
economically disadvantage group over at risk group than
those with higher education.
3. Those were married and with good financial management
were 25 percent and four per cent less likely in disadvantages
group.
Discussion & Recommendations
• The Indian elderly have the highest odds falling in
the economically disadvantages group.
– Indian younger generations from economically
disadvantages group are unlikely to benefit from
inherited wealth, ending up with the imbalance
wealth accumulation and distribution among the
ethnicity groups
– In coping with this matter, government’s allocation
need to be channeled to the needed group

Discussion & Recommendations
• Those who are still working upon retirement
are economically better off (1.3 X) than those
who has stopped working
– Improve the employability skills among those who
want to continue working
– Change the mindset of the “gatekeeper”
Discussion & Recommendations• Those who are practicing good financial
management are one times more likely in economically advantages group and four percent less likely in disadvantages over the at risk group.
– Thus, efforts should be addressed in financial education programs, especially younger generation so that they are able to make correct decisions related in financial matter.
– Master in financial knowledge and positive monetary attitude are essential to build up a good financial management of an individual since young.

Conclusion
• The Economic well being can be measured
both in objective and subjective way…but with
its limitations.
– Net flow: stream of products/services
– Net Worth : Stock of accumulated wealth
– Income Adequacy: Past experience and aspiration
• Combining the two measures might be able to
reflect a better picture about the EWB among
the older persons.
Thanks You
For your kind Attention
Past publications from the dataset:Jariah M and Sharifah, A.H. 2008. Income differences among Elderly in Malaysia: A regional Comparison.
International Journal of Consumer Studies, 32: 335-340.
Jariah, M., Sharifah, A. H., & Lucy, W. G. (2008). Gender Differences in Income Sources of the Elderly in
Peninsular Malaysia. Journal of Family and Economic Issues. Vol. 29(4), 623-633.
Chan Yin-Fah, Laily Paim, Jariah Masud, Tengku Aizan Hamid, (2010). The Future of the Malaysian Older
Employees: An Exploratory Study. International Journal of Business and Management Vol. 5(4), 125-132
Chan Yin-Fah, Jariah Masud, Tengku Aizan Hamid & Laily Paim (2010). Financial Wellbeing of Older Peninsular
Malaysians: A Gender Comparison. Asian Social Science. 6 (3), 58-712010
Chan Yin–Fah, Tengku Aizan Hamid, Jariah Masud, Laily Paim (2010). Predictors of Financial Dependency in Old
Age in Peninsular Malaysia: An Ethnicity Comparison. Asian Social Science. Vol. 6, No. 6; 54-62
Chan Yin-Fah, Tengku-Aizan Hamid, Jariah Masud, Laily Paim. Financial Satisfaction among Older Malaysians in
Peninsular Malaysia. Malaysian Journal of Social Policy and Society.