ECONOMIC VALUE OF GOLDEN TROUT FISHING IN THE
27
ECONOMIC VALUE OF GOLDEN TROUT FISHING IN THE GOLDEN TROUT WILDERNESS, CALIFORNIA An Analysis By Carolyn Alkire, Ph.D. Resource Economist A Report for California Trout March 21, 2003 ACKNOWLEDGEMENTS Thanks to the many individuals who provided essential data and information, without which this study would not have been possible: Del Hubbs, Adam McClory, and Julie Molzahn, Inyo National Forest; Cheryl Bauer and Judi Kaiser, Sequoia National Forest; Jim Shackelford, Forest Service Region 5; and Donn Burton and Dave Lentz, California Department of Fish and Game. The author is grateful for the professional review by Dr. John Loomis. Stan Stephens of the California Department of Fish and Game and Dr. Robert Richardson also offered helpful comments and suggestions. This report was expertly edited by Deanne Kloepfer. California Trout would like to thank Joseph Tomelleri for the use of his trout illustrations. California Trout thanks C. Pat Patterson and Bill Hooper for generously funding this report. Cover illustration courtesy of Michael Flynn
Transcript of ECONOMIC VALUE OF GOLDEN TROUT FISHING IN THE
ECONOMIC VALUE OF GOLDEN TROUT FISHING IN THEGOLDEN TROUT WILDERNESS, CALIFORNIA
An Analysis ByCarolyn Alkire, Ph.D. Resource Economist
A Report for California Trout
March 21, 2003
ACKNOWLEDGEMENTS
Thanks to the many individuals who provided essential data and information, without which this study would not have been possible: Del Hubbs, Adam McClory, and Julie Molzahn, Inyo National Forest; Cheryl Bauer and Judi Kaiser, Sequoia National Forest; Jim Shackelford, Forest Service Region 5; and Donn Burton and Dave Lentz, California Department of Fish and Game.
The author is grateful for the professional review by Dr. John Loomis. Stan Stephens of the California Department of Fish and Game and Dr. Robert Richardson also offered helpful comments and suggestions. This report was expertly edited by Deanne Kloepfer.
California Trout would like to thank Joseph Tomelleri for the use of his trout illustrations.
California Trout thanks C. Pat Patterson and Bill Hooper for generously funding this report.
Cover illustration courtesy of Michael Flynn
FOREWORDBy R. Brett Matzke
Public Lands DirectorCalifornia Trout, Inc.
Cattle began grazing the Kern Plateau more than 130 years ago, long before the area and surrounding environs were established as the Inyo and Sequoia national forests. Various studies have documented that cattle grazing can seriously damage water and land resources. But attempts to reform grazing management policy on the Kern Plateau and to protect native species in this case, California's state fish, the golden trout, and its close relative shave met with little success.
In part, the failure to reform grazing management stems from the long-held view that cattle ranching is the cornerstone of the local economy. Virtually ignored in management decisions are the economic benefits of recreational fishing, which depend to a large extent on the existence of native golden trout in viable habitat. Ignored, too, are well-documented studies that indicate protection of natural settings will attract visitors and their dollars to an area, as well as new business and new residents who seek a better quality of life.
California Trout presents this analysis to inform the public debate over the fate of the Kern Plateau. Even its conservative results indicate that substantial economic benefits will accrue if steps are taken to preserve habitat for the golden trout.
We note, too, that the methodology used in the analysis can be readily adapted for use in other areas of California. Ultimately, we believe that the information in this document and data from similar studies will help protect areas that are well known and deservedly so for their beauty, wildlife, and valuable ecosystem functions, but that also offer potentially significant economic benefits.

Figure 1
Trout Drawings courtesy of Joseph R. Tomelleri

There is no mistaking the California golden trout. Its brilliant red and gold hues have long
fascinated anglers in California's southern Sierra Nevada region. But populations of the golden trout
California's state fish are declining, even in the Golden Trout Wilderness on the Inyo and Sequoia
national forests. The primary causes are predation by brown trout, hybridization with non-native rainbow
trout, and habitat degradation brought about by livestock grazing. Both the State of California and the
Forest Service list the golden trout as a species of special concern, and the U.S. Fish and Wildlife
Service is considering whether to list the subspecies under the federal Endangered Species Act.
This report describes the economic value of recreational fishing for golden trout and two related
species in the Golden Trout Wilderness. The report also compares those values with livestock grazing,
the other major economic activity in the wilderness area.
The Golden Trout Wilderness was chosen for this study because it provides most of the golden
trout's remaining, relatively intact native habitat. The study area includes the Kern Plateau, containing
Golden Trout Creek and the North and South forks of the Kern River in Tulare and Inyo counties (Figure
1). Of particular interest are 26 miles of native habitat along the South Fork Kern River, from the
headwaters to Kennedy Meadow, in the Inyo and Sequoia national forests.
Maintenance of golden trout populations in Golden Trout Creek and South Fork Kern River will
require active management, including elimination of competing non-native trout and elimination of
grazing along the streams (Moyle et. al 1996). Documented impacts of livestock grazing in the
wilderness area include fecal contamination, erosion of stream banks (which results in large amount of
stream sedimentation that fill in many pools important to fish survival over the winter), channelization of
shallow stream, trampling of spawning beds, and loss of vegetation and hiding cover.
In a recent study, Knapp and Matthews (1996) found that grazed portions of the Golden Trout
Wilderness were in poorer condition than ungrazed portions of the wilderness area and that grazing-
induced habitat degradation was harmful to the remaining populations of California golden trout. The
study suggested “resting” of grazing allotments or reductions in livestock numbers to lessen the impacts
of grazing on stream and riparian ecosystems in the Golden Trout Wilderness. This method of restoration
is both easier to implement and more cost-effective than previous stream habitat rehabilitation efforts,
which relied primarily on structural remedies such as bank stabilization and demonstrated only limited
success. In 2001, the Forest Service decided to rest two grazing allotments in the Inyo National Forest
for 10 years. Approximately 88,000 acres of those allotments are in the Golden Trout Wilderness (USDA
Forest Service 2001).
2
Report Summary

According to the Knapp and Matthews study, restoration of the stream and riparian ecosystems
would increase meadow stability, improve habitat for native California golden trout, and enhance
conditions for a wide range of other riparian-dependent species. In addition to ecological benefits, Knapp
and Matthews conclude that preventing the extinction of California golden trout through measures such
as habitat restoration will yield substantial economic benefits tied to recreational fishing.
This analysis for California Trout estimates the economic benefits of recreational fishing in the
Golden Trout Wilderness at $148,000 to $713,000 a year. Economic benefits from grazing in the Golden
Trout Wilderness, on the other hand, are estimated at $35,000 a year.
The estimate for recreational fishing is a conservative estimate of the value of golden trout
because it does not include non-fishing recreation values or passive-use values the option value that
accrues from maintaining the ability to fish for the species in the future, the existence value to the
general public from knowing that the California state fish continues to thrive in the wild, and the bequest
value of providing viable populations of the golden trout for future generations. Studies suggest passive-
use values are at least equal to and may be several times greater than recreation use values (Loomis and
White 1996, Brown 1993).
In addition, this analysis found that annual Forest Service receipts from wilderness permits and
pack station fees that are potentially related to fishing in the Golden Trout Wilderness are more than
twice the amount generated from livestock grazing receipts. Some of the recreation revenues and
benefits would undoubtedly be lost if California golden trout were to go extinct or if population levels
were to fall below the threshold that allows recreational fishing.
3

4
Recreational Fishing in California
Anglers come from across this country and around the world to fish California's coastal and
inland waters. Of the 9.4 million people who participate in wildlife-related recreation each year in that
state, 29 percent choose to fish mostly in freshwater streams, mostly (70 percent) for trout, and mostly
for wild trout (U.S. Department of the Interior, Fish and Wildlife Service/U.S. Department of Commerce,
Bureau of the Census 1998; Anderson 1990). In the Sierra region, anglers are showing increased interest
in fly fishing for "natural" trout and in an expansion of catch-and-release programs (Duane 1996a).
Sales of sport fishing licenses and stamps generated more than $48 million in revenue for the
California Department of Fish and Game in 2000. Revenue from the sale of sport fishing licenses is
deposited into the Fish and Game Preservation Fund and used, among other things, to raise and plant
trout, steelhead, and salmon (California Department of Fish and Game 2002).
Trip and equipment expenditures associated with freshwater fishing in California totaled $2.3
billion in 1996. Equipment represented the largest share (60 percent) of expenditures, followed by food
and lodging (16 percent), transportation (12 percent), and other items (12 percent). Each angler in
California spent an average of $972 that year (U.S. Department of the Interior, Fish and Wildlife
Service/U.S. Department of Commerce, Bureau of the Census 1998).

California golden trout, Little Kern golden trout, and Kern River rainbow trout (hereafter
referred to collectively as golden trout) are the main target species for recreational anglers in the Golden
Trout Wilderness. The vast majority of all golden trout and the only pure golden trout reside in the
wilderness. A few are found north of the wilderness boundary, and these species have also been planted
as far away as Wyoming and England.
California Fish and Game Commission sport fishing regulations (2002) specify that fishing is
allowed in the Golden Trout Wilderness (within the Sierra Sport Fishing District) from the last Saturday
in April through October 31, except:
! Cottonwood Creek and drainage lakes, Little Cottonwood Creek and tributaries in Inyo County July 1 through October 31
! Golden Trout Wilderness Area in Tulare County last Saturday in April through November 15
Golden Trout Creek and the upper Kern River have been designated as “heritage trout” waters
and are managed to protect habitat for native trout. Special regulations apply as follows (California
Department of Fish and Game 1999):
! Golden Trout Creek (entire drainage, including tributaries from the Kern River upstream to the headwaters in Tulare County)last Saturday in April through November 15. The heritage trout species is the California golden trout.
! Upper Kern River (from Forks of the Kern, upstream to Tyndall Creek in Sequoia National Park) last Saturday in April through November 15. The heritage trout species is the Kern River rainbow trout. Golden trout are among the other species that are occasionally present.
5
Recreational Fishing in theGolden Trout Wilderness
California Golden Trout

The economic benefits associated with recreational fishing in the Golden Trout Wilderness
serve as a reasonable estimate of the economic value of recreational fishing for golden trout because
golden trout are generally the only target species for recreational anglers in the wilderness. Such an
estimate is also conservative because it does not take into account non-fishing recreation values or
passive-use values described earlier, and because it does not include golden trout (hybrids) outside the
Golden Trout Wilderness.
Estimating the economic benefits from recreational fishing for golden trout requires data on
both the number of anglers and the economic benefits per angler. For this report, the number of anglers
was based on the number of visitors to the Golden Trout Wilderness, as described below. The economic
benefits per angler were obtained from published studies.
Estimating the Number of Potential Anglers
Forest Service staff provided data related to the number of people who entered the Golden Trout
Wilderness at each trailhead and other points of access during 2001 (by month) and the number of nights
they stayed.
Trailheads. Hikers must obtain a permit for overnight camping in the wilderness (permits are
not required for day use). Between May 1 and November 1, entry quotas limit the number of people per
day on the trails. The exception is Cottonwood Pass, where quotas are in effect from the last Friday in
June through September 15.1During 2001, at least 5,228 people with permits visited the Golden Trout Wilderness (Table 1).
About two-thirds, or at least 3,387 people, entered on the western side of the wilderness in the Sequoia
National Forest at the following trailheads: Blackrock, Osa Meadow, Lion Meadow, Rincon, Forks of the
Kern, Jerkey, Lewis Camp, Clicks Creek, Summit, Jacobson, Griswold, and Long Canyon. The
remaining visitors entered on the eastern side of the wilderness at trailheads in the Inyo National Forest: 2Cottonwood Pass, Olancha Pass, Trail Pass, Kennedy Meadows, Mulkey Pass, and Blackrock. On the
west side, a significant number of people entered the wilderness on pack animals or riding stock.
6
Economic Benefits of RecreationalFishing for Golden Trout
1. Wilderness permit data for the Sequoia National Forest are not available from October 2001 through December 2001 (Bauer 2002). 2. Both the Sequoia and Inyo national forests issue wilderness permits for the Blackrock Trailhead. In 2001, most permits for this trailhead were issued by the Sequoia National Forest (USDA Forest Service 2002a and 2002b).

Monache Jeep Road, Inyo National Forest. The Monache Jeep Road provides access to
camping sites in Monache Meadow just outside the southwestern boundary of the wilderness area.
People with four-wheel drive vehicles can drive in, camp, and walk into a wilderness portion of the
South Fork Kern River without getting a wilderness permit. The road is generally open from late May or
mid-June to early November. The South Fork of the Kern River flows south through Monache Meadow
and is inhabited primarily by wild stocks of German brown trout and hybrid golden/rainbow trout
(USDA Forest Service no date). California golden trout may also be found in this section of the river
(Lentz 2002). During 2000, about 9,225 people visited the Monache Meadow area between the end of
April and the end of November (Molzahn 2002).
7
Table 1. Wildernes Permits for Golden Trout Wilderness, 2001
Month
January
February
March
April
May
June
July
August
September
October
November
December
Total
West
8
0
1
10
525
603
832
828
580
*
*
*
> 3,387
East
0
1
0
0
48
254
478
665
354
36
5
0
1,841
Total
8
1
1
10
573
857
1310
1493
934
> 36
> 5
> 0
>5,228
Number of PeopleWest
0
0
0
0
72
124
221
247
164
*
*
*
> 828
East
0
0
0
0
4
0
23
44
19
0
0
0
90
Total
0
0
0
0
76
124
244
291
183
> 0
> 0
> 0
> 918
Number of Animals / Stock
Sources: USDA Forest Service. 2002a and 2002b. Sequoia National Forest, Cannell Meadow Ranger District; Inyo National Forest,Wilderness Permit Office.* Not available > Greater than

Commercial Pack Stock Trips.
Several private companies have permits from the Forest
Service to provide pack trips into the wilderness. Pack
services include transport of camping equipment and
supplies to a specified location and then back to the pack
station on a pre-designated day (“spot trips”), multi-day
trips with a packer and stock, and “all expense” trips in
which the pack station provides meals as well as a
packer and stock. The companies issue wilderness
permits to their clients.
Five pack stations led trips to or through the Golden Trout Wilderness in 2001, two on the east
side (Inyo National Forest) and three on the west side (Sequoia National Forest). Clients spent a total of
1,692 user days (equivalent to the number of people times the number of days) in the wilderness (Table
2). Most of these trips were one-way or spot trips (Molzahn 2002). Forest Service records do not indicate
which entry and exit points were used.
8
Table 2. Visitors Using Commercial Packers in the Golden Trout Wilderness
Photograph courtesy of Carla Cloer
Sources: USDA Forest Service. 2002a and 2002b. Sequoia National Forest, Tule River Ranger District and Inyo National Forest,White Mountain/Mt. Whitney Ranger Districts. > Greater than.
3. The Rock Creek Pack Station also conducts a Professional Packer School in the Golden Trout Wilderness (with the University ofCalifornia, Davis). These participants are not included in Table 2 because fishing is not the intent of the trip. Most of Rock CreekPack Stations trips are to the John Muir Wilderness (Rock Creek Pack Station 2002)
Region and Pack Company
East: Inyo National Forest
Cottonwood Pack Station
Rock Creek Pack Station
Subtotal
West: Sequoia National Forest
Balch Park Pack Station
Golden Trout Wilderness Packtrains
Mineral King Pack Station
Subtotal
Total
Number of People
Not Available
40
> 40
83
221
32
336
> 376
Number of User Days
80
240
320
212
1,062
98
1,372
1,692
Flyfishing Guides. There is one flyfishing guide who has a permit to lead trips from the west
side, but he reported no use within the Golden Trout Wilderness in 2001 (Bauer 2002).
Other Visitors. Groups often visit the Golden Trout Wilderness for work or educational trips.
They include the Backcountry Horsemen of California, a service and education organization concerned
with stock use in backcountry; Aguabonita Flyfishing Club; Sierra Club; the Boy Scouts of America; and
area schools. Some people who own property in the wilderness may sponsor equestrian trips. In
addition, whitewater rafting trips originate from the Forks of the Kern in the Golden Trout Wilderness,
but most of the river traveled by the rafters is in the non-wilderness portion of the Sequoia National
Forest (Bauer 2002).
Estimating the Number of Angler Days
Variations in fishing seasons within the Golden Trout Wilderness present a challenge in
estimating the number of potential anglers. In addition, visitor data for wilderness permits is not
available by destination (only by entry point), so the number of visitors to Golden Trout Creek, for
example, is unknown. And while fishing is allowed as early as April, the high elevation habitat for
golden trout is generally inaccessible until June because of snow (Matzke 2002). Therefore, this report
used the most conservative estimate of the number of potential anglers during fishing season that is, the
number of visitors who obtained permits between July 1 and October 31. There are only a few golden
trout fishing areas that can be reached without an overnight stay. Thus, all permitted wilderness visitors
from July through October were considered potential anglers.
During the four months, visitors with permits totaled at least 3,773 - 2,240 from the west side
and 1,533 from the east side trailheads. Those visitors accounted for 21,014 user days (Table 3). All of
the commercial pack trips occurred during fishing season, so all 1,692 user days from the pack trips were
counted as potential angler days.
9

The Forest Service does not routinely collect data on the types of activities people engage in
once they are in the wilderness, although research shows that fishing, photography, and nature study
follow hiking as the most common activities in wilderness (Roggenbuck and Watson 1989). Published
studies of recreation users in the region provide some indication of just how popular fishing is. As
examples, a survey of recreationists in the Inyo National Forest found that fishing was the main activity
for 58 percent of the respondents (Lee and Brown 1991). The management plan for the Sequoia National
Forest notes that fishing accounts for 40 percent of wildlife and fish user days in the forest (USDA
Forest Service 1988a). In the Mt. Whitney region, 12 percent of hikers surveyed indicted that they fished
during their trips (Duane and Knauer 1996). 4
This report applied the lower (12 percent) and upper (58 percent) bounds from the above
studies to the number of user days during the fishing season to derive estimates of 3,629 to 17,539 angler
days (Table 3).
104. Although golden trout are not found in the Mt. Whitney region, the percent of hikers that fish there is believed to bea reasonable lower bound for fishing participation in wilderness.
a. For wilderness permits, number of user nights. Number of permits issued during October for Sequoia National Forest trailheadsis not available; user nights for July to September estimated based on average nights per person for Inyo National Forest trailheads.b. Number of visitors multiplied by the larger estimate of the portion that fish (58 percent).c. Number of visitors multiplied by the smaller estimate of the portion that fish (12 percent).> Greater than.
Wilderness Permits
East - Inyo National Forest
West - Sequoia National Forest
Subtotal
Pack Station Clients:
East - Inyo National Forest
Cottonwood Creek Pack Station
Rock Creek Pack Station
West - Sequoia National Forest
Balch Park Pack Station
Golden Trout Wilderness Packtrains
Mineral King Pack Station
Subtotal
Monache Jeep Road
Total
Number ofaUser Days
7,874
> 11,448
> 19,322
80
240
212
1,062
98
1,692
9,225
> 30,239
Number of User DaysbUpper Bound
4,567
> 6,640
> 11,207
46
139
123
616
57
981
5,351
> 17,539
cLower Bound
945
> 1,374
> 2,319
10
29
25
127
12
203
1,107
> 3,629
Table 3. Golden Trout Wilderness User Days during Fishing Season andAngler Days by access location
Estimating Fishing Benefits: Fishing Value Per Person
There appear to be no published empirical studies that address recreational fishing values for
the southern Sierra Nevada region. However, a reasonable estimate of fishing use value can be obtained
by using benefit transfer methodology, which refers to the adaptation and use of economic information
from specific sites at other sites with similar resource and policy conditions (Rosenberger and Loomis
2001).
For this report, day values for fishing in the Pacific Coast Area (defined to include the states of
Washington, Oregon, and California) were applied to fishing use data for the Golden Trout Wilderness.
The most recent available studies suggest an average value per person per day of $40.67 in current 5(2002) dollars (Rosenberger and Loomis 2001), which was estimated using contingent valuation a
method that is accepted by federal agencies to estimate the value of recreation and other benefits for 6which no market exists.
The Forest Service used a more conservative value of $12 per fishing day in 1982 to estimate
the value of fishing days in the Inyo and Sequoia national forests (USDA Forest Service 1988a, 1988b).
Converting that amount to current (2002) dollars results in an estimate of $19.92 p
Estimates of Fishing Benefits
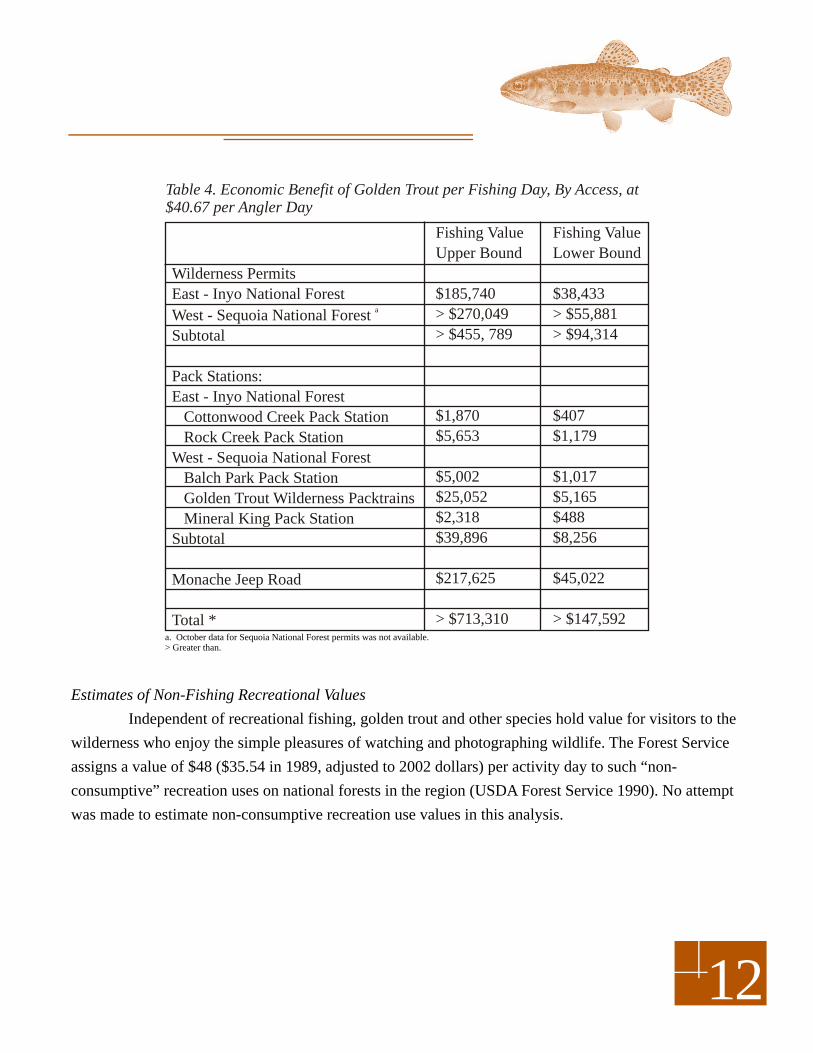
The estimates of angler days from Table 3 were multiplied by the values per day$40.67to derive
a minimum and maximum value for the entry points identified in Tables 1 and 2. This resulted in a total
value of at least $147,592 and as high as $713,310 for recreational fishing in the Golden Trout
Wilderness (Table 4). Using the lower Forest Service value of $19.92 per angler day, the total value
ranged from $72,290 to $349,377.
er day.
11
5. The value in 1996 dollars ($36.97) was converted to 2002 dollars using the gross domestic product implicit pricedeflator (U.S. Department of Commerce 2002).6. This measure of value, typically referred to as “willingness to pay,” is comparable to market price plus consumersurplus (the amount the consumer is willing to pay over and above costs). It measures economic value beyond cashflow to producers and has gained strong support as a concept that is relevant to many social decisions(USDA Forest Service 1990).
Estimates of Non-Fishing Recreational Values
Independent of recreational fishing, golden trout and other species hold value for visitors to the
wilderness who enjoy the simple pleasures of watching and photographing wildlife. The Forest Service
assigns a value of $48 ($35.54 in 1989, adjusted to 2002 dollars) per activity day to such “non-
consumptive” recreation uses on national forests in the region (USDA Forest Service 1990). No attempt
was made to estimate non-consumptive recreation use values in this analysis.
12
Table 4. Economic Benefit of Golden Trout per Fishing Day, By Access, at$40.67 per Angler Day
a. October data for Sequoia National Forest permits was not available.> Greater than.
Fishing Value
Upper Bound
$185,740
> $270,049
> $455, 789
$1,870
$5,653
$5,002
$25,052
$2,318
$39,896
$217,625
> $713,310
Wilderness Permits
East - Inyo National ForestaWest - Sequoia National Forest
Subtotal
Pack Stations:
East - Inyo National Forest
Cottonwood Creek Pack Station
Rock Creek Pack Station
West - Sequoia National Forest
Balch Park Pack Station
Golden Trout Wilderness Packtrains
Mineral King Pack Station
Subtotal
Monache Jeep Road
Total *
Fishing Value
Lower Bound
$38,433
> $55,881
> $94,314
$407
$1,179
$1,017
$5,165
$488
$8,256
$45,022
> $147,592

Wilderness permits in the Inyo National Forest cost $5 per person for the Golden Trout 7Wilderness, except that permits for Mt. Whitney trailheads cost $15. The forest may keep 95 percent of
the receipts 80 percent for projects on the forest and no more than 15 percent for administrative costs to
run the program). The remaining five percent is sent to the agency's national office in Washington, DC,
and is eventually deposited in the federal treasury. One thousand five hundred and thirty-three visitors
with permits entered the Golden Trout Wilderness from Inyo National Forest trailheads from July
through October, 2001, during the fishing seasons. This figure was multiplied by $5 to estimate Forest
Service receipts of $7,665 that are potentially associated with golden trout fishing. There is no charge for
wilderness permits issued by the Sequoia National Forest.
Pack stations and fishing guides operate under a special use permits from the Forest Service and
pay either a flat fee or a percentage of receipts. Annual fees for the two pack stations that led trips from
the eastern side of the Golden Trout Wilderness in 2001 totaled $1,765 (Molzahn 2002). All receipts
from pack stations are deposited in the federal treasury. Fees for the three pack stations operating from
the western side of the wilderness totaled $1,943 in 2001 (Kaiser 2002). Not all of these receipts are
attributable to pack trips in the Golden Trout Wilderness because some visitors continue to other
destinations such as Sequoia National Park.
13
Forest Service Receipts from Potential Golden Trout Anglers
Sources: USDA Forest Service. 2002a and 2002b. Sequoia National Forest, Tule River Ranger District; Inyo National Forest,White Mountain/Mt. Whitney ranger districts.a. National Forestb. Number of people entering between July 1 to October 31 (Sequoia figure is missing October data).> Greater than.
7. Mt. Whitney trailhead receipts are not included in this study because golden troutare not found in that area.
Table 5. Forest Service Revenues from Potential Anglers, by Access, 2001
Permits:
Inyo NF
Sequoia NF
Pack Stations:
Inyo NF
Sequoia NF
Total
Number
a1,533 visitors b
> 2,240 visitors
2 pack stations
3 pack stations
Fees Paid
$5 per person
0
$1,765 / station
$1,942
Total
Revenues
$7,665
0
$3,530
$1,943
$13,138
Revenues
to NF
$7,282
0
0
$136
$7,418
Revenues
to Treasury
$383
0
$3,530
$1,807
$5,720
Table 5 displays Forest Service receipts from potential anglers in the Golden Trout Wilderness.
It does not include revenues from other activities that may be related to golden trout but that are not
directly attributable to fishing. For example, many of the people who stay at public campgrounds near
trailheads in the Sequoia and Inyo national forests hike into the Golden Trout Wilderness to fish. These
campgrounds can generate significant revenue. The three at Horseshoe Meadow on the Inyo National
Forest, for example, account for about $10,000 a year (Molzahn 2002), 80 percent of which has helped
fund a seasonal staff member and rehabilitation of campground facilities. None of that revenue is
included in this report.
Recreation surveys indicate that most of the visitors to the eastern Sierra come from other parts
of California, primarily Inyo, Mono, Riverside, or Kern counties, or from metropolitan areas along the
southern California coast (Duane 1996b). One way to view the economic contribution of fishing in the
Golden Trout Wilderness to nearby localities is to calculate the money spent by anglers for 8transportation, food, lodging, tackle, and other items. The California Department of Fish and Game
collects this information from various sites around the state, using voluntary angler survey forms during
the fishing season. The only survey box located in the vicinity of the Golden Trout Wilderness is at the
Forks of the Kern trailhead near the confluence of the North Fork Kern River and Little Kern Rivers.
The North Fork Kern River is a two-mile hike from the Forks of the Kern trailhead on the southwestern
side of the wilderness in the Sequoia National Forest. Kern River rainbow trout and brown trout are
caught in the area. Surveys collected from the Forks of the Kern trailhead indicate that anglers spent an
average of $112 per trip in 2001, with gas and food as the largest expenditures (Table 6; California
Department of Fish and Game 2002).
Local Economic Contribution ofRecreational Fishing forGolden Trout
148. For employment, income, and output supported by visitors to wilderness andnatural areas in Inyo and Mono counties, see Richardson 2002.

A 1993 study of the economic benefits of sport fishing on the Tule River Ranger District
estimated that anglers at the Forks of the Kern trailhead spent $1.5 million in 1990 (Lechner and
Pustejovsky 1993). The estimate was based on expenditures reported by 39 anglers on survey forms
provided at the trailhead by the California Department of Fish and Game. Nearly two-thirds of the
average daily expense of $71 was for goods and services that were probably purchased locally (food,
lodging, tackle, etc.). The authors suggested that lodging costs were low because most forest users are
either day-use visitors or campers.
A survey conducted by California Trout during the summer of 2002 indicated a similar level of 9
spending. Trip expenditures for the 17 respondents totaled $7,085 and averaged $109 per day during an
average four-day stay. The majority of trip-related expenditures (such as food and lodging) were local.
Travel costs represented less than 20 percent of total expenditures. Most of the respondents reported
catching golden trout.
Because of the small number of respondents in some surveys and because the surveys cover a
very small portion of potential fishable water, these data cannot be interpreted as representative of all
anglers in the region. The results do, however, provide a useful indication of the magnitude of fishing
expenditures.
159. A brief survey was printed on a (return postage paid) postcard available at fishing supply stores nearInyo National Forest trailheads. They were to be distributed only to anglers in the Golden Trout Wilderness.
Table 6. Average Angler Expenditures for Forks of the Kern Trailhead,Sequoia National Forest
Source: California Department of Fish and Game
Year
2001
2000
1999
Number of
Surveys
26
16
13
Total
$112
$139
$78
Gas
$43
$61
$33
Food
$35
$61
$30
Lodging
$66
$16
$19
Tackle
$19
$12
$10
Other
$3
$0
$0

Cattle have grazed in the
Golden Trout Wilderness and
surrounding area for more than 130
years. Most present-day trails in the
wilderness area were established
before Congress designated the
Golden Trout Wilderness, and cattle
ranchers continue to drive stock over
these historic trails and use pack
stock to supply cow camps.
Livestock operations are now
controlled by a permit system based
on guidelines established in the
Forest Service's Grazing Allotment Management Plan and Forest Land and Resource Management Plan
(USDA Forest Service1988a, USDA Forest Service 1988b). Cattle are moved often and at any given
time can be found in a relatively small part of the Golden Trout Wilderness.
There are seven active grazing allotments in the Golden Trout Wilderness four in the Inyo
National Forest and three in the Sequoia National Forest that range in size from about 18,000 acres to
54,000 acres. However, only part of each allotment is in the Golden Trout Wilderness (see Appendix A),
and the portions of the Ash Creek and Olancha allotments in the wilderness area are rarely used because
of steep terrain and lack of vegetation (Hubbs 2002).
Permittees pay a fee for grazing based on the number of cattle and the number of months the
area is used. The current fee, set by the U.S. Department of the Interior, is $1.43 per animal month
(AM), which equals one cow/calf pair grazing for one month. In 2001, the rate was $1.35/AM. One-
fourth of the grazing fees are deposited in the Forest Service's Range Betterment Fund to support
activities that benefit grazing on the national forest from which the fees are collected (with no more than
six percent to administration), one-fourth goes to the state in which the fees are collected (to compensate
for the tax-exempt status of federally managed lands), and one-half is deposited to the federal treasury.
Livestock Grazing in theGolden Trout Wilderness
16
Photo courtesy of Christy McGuire

Economic Benefits of Grazing
The economic benefits associated with livestock grazing in the Golden Trout Wilderness can be
estimated in the same manner as fishing benefits. Annual cattle use is multiplied by $6.77, the Forest
Service's value per animal unit month (AUM; USDA Forest Service 1990). This is the market price per
AUM plus the consumer surplus in 2000 for California, converted to current (2002) dollars to adjust for
inflation. Annual cattle use, measured as AMs, may be approximated as AUMs if the composition of the 10stock is known. Based on knowledge of local ranching operations, a reasonable assumption would be
90 percent cow/calf pairs, 5 percent immature heifers and 5 percent bulls (Shackelford 2003). This
estimate of stock composition suggests that in the Golden Trout Wilderness 3,947 AMs are
approximately equivalent to 5,143 AUMs. Multiplied by the value per AUM, this resulted in a total
estimated value of $34,818 for cattle grazing in the Golden Trout Wilderness. Annual expenditures for
ranches using the Golden Trout Wilderness are not a matter of public record, so it was not possible to
compare the total economic impacts of fishing and grazing in the wilderness area. This would be a useful
topic for further research.
1710. One AM for a stocker or heifer cow (immature) is equivalent to 0.8 AUM, one AM for a mature cowis equivalent to one AUM, one AM for a mature cow with a nursing calf is 1.32 AUMs, and one AMfor a mature bull is 1.5 AUMs (Shackelford 2002).To calculate AMs to AUMs: 5,143 AUMs = (3,947 x 0.9 x 1.32) + (3,947 x 0.05 x 0.8) + (3,947 x 0.05 x 1.5).
Table 7. Revenues from Golden Trout Wilderness Grazing Allotments, 2001
Source: USDA Forest Service. 2002c. Golden Trout Wilderness, Allotment and Permit Information Spreadsheet. Jim Shackelford,Region 5 Range Program Manager. There are two permit holders for the Monache allotment.a. Range Betterment Fund.b. Neither the Beach or Burnt Country allotments were used in 2001.
Allotment
Inyo National
Forest:
Ash Creek
Monache
Monache
Mulkey
Olancha
Sequoia National
Forest:b
Beach b
Burnt Country
Little Kern
Total
Authorized Use
(head months)
$192
$1,174
$907
$719
$170
0
0
$785
$3,947
Total
Revenues
$259
$1,585
$1,224
$971
$230
0
0
$1,060
$5,329
RevenuesaRBF
$65
$396
$306
$243
$57
0
0
$265
$1,332
Revenues:
California
$65
$396
$306
$243
$57
0
0
$265
$1,332
Revenues:
Treasury
$130
$792
$612
$485
$115
0
0
$530
$2,664

Kern River Rainbow TroutOncorhynchus mykiss gilberti
Little Kern River Golden TroutOncorhynchus mykiss whitei
Golden Trout Creek Golden TroutOncorhynchus mykiss aquabonita
Information about employment and income in the areas surrounding the Golden Trout
Wilderness provides an overview of the leading types of economic activities in the area. One of the
smallest geographic units for which such data are readily available is the Census County Division (see
maps below). In 2000, there were 7,658 people in the two County Census Divisions Lone Pine and
Springville-Johnsondale that border the Inyo and Sequoia national forests. (U.S. Bureau of the Census
2002a). That figure represents a seven percent increase in population since the 1990 census.
Employment totaled 2,918 in 2000 (Table 8); education, health, and social services accounted
for the most significant portion (28 percent) of the employed. Arts, entertainment, recreation,
accommodations, and food service entities were the second largest employer (14 percent). All other
sectors each represented eight percent or less of total employment.
Overview of the Region’s Economy
18Trout drawings courtesy of Joseph R. Tomelleri
Lone Pine Census County DivisionSource: U.S. Bureau of the Census 2002b.
Springville-Johnsondale Census County DivisionSource: U.S. Bureau of the Census 2002b.

19
No industry category is devoted solely to recreation-related activities, but some portions of arts,
entertainment, recreation, accommodations, and food services employment and retail employment
categories are related to recreation such as fishing and whitewater rafting. Some portion of employment
related to livestock grazing and other ranch activities is reflected in the agriculture, forestry, fishing, and
mining total. 11
Total earnings in the region were $97 million in 1999 (U.S. Department of Commerce 2002).
Virtually all other income was from social security payments ($13 million) and retirement benefits such
as pensions, annuities, and Individual Retirement Account income ($12 million). Data for earnings by
industry that were collected during the 2000 census are not yet available for County Census Divisions.
11. Wage or salary income plus net income from both farmand non-farm self-employment comprise earnings.
Table 8. Employment by Industry in Areas Bordering the Inyoand Sequoia National Forests, 2000
Source: U.S. Bureau of the Census 2002a. a. Agriculture, Forestry and Fishing is comprised of establishments primarily engaged in (1) harvesting timber, (2) harvesting fish and otheranimals, (3) providing support activities for crop, animal, and forestry activities. It excludes agricultural production-based establishmentssuch as farms, ranches, dairies, and greenhouses; these are covered by the USDA Census of Agriculture. This county-level survey isconducted every five years.
Educational, Health and Social Services
Arts, Entertainment, Recreation
Accommodation and Food Servicesa
Agriculture, Forestry, Fishing and Mining
Retail Trade
Public Administration
Construction
Manufacturing
Other Services
Transportation, Warehousing and Utilities
Professional, Scientific, Management,
Administrative, and Waste Management
Services
Finance, Insurance, Real Estate, Rental
and Leasing
Wholesale Trade
Information
Total
Total Employed
821
343
254
241
221
215
162
156
149
120
102
91
43
2,918
Percent of Total
28%
12%
9%
8%
8%
7%
6%
5%
5%
4%
3%
3%
1%
100%

2
Conclusions
20
Golden trout have long been recognized as biologically and culturally important in the southern Sierra
region. This analysis demonstrates that their survival also has significant economic repercussions and
that the economic sectors related to recreation are important portions of the region's economy.
Economic benefits for recreational fishing in the Golden Trout Wilderness are estimated to be
$148,000 to $713,000 annually, based on available visitation data from the Forest Service. These
estimates of economic benefits are conservative because they do not include non-fishing recreation
values or passive-use (option, existence, and bequest) values.
Annual economic benefits for grazing in the Golden Trout Wilderness are estimated to be
$35,000, based on the Forest Service's 2001 use data and values. As Table 9 illustrates, these estimated
benefits are far less than the benefits that are likely to accrue from protection of habitat for the golden
trout.
As Table 9 also shows, annual Forest Service receipts from wilderness permit and pack station
fees that may be tied to fishing in the Golden Trout Wilderness are substantially more than the receipts
from livestock grazing.
The survival of the golden trout and associated recreation benefits depend on conservation and
restoration of habitat. Hence, the economic benefits associated with golden trout fishing and other
recreation pursuits in the Golden Trout Wilderness should be considered in future land management
decisions that are likely to have impacts on golden trout habitat.
12The methodology in this analysis is applicable to other areas. It can be used to generate
information that informs land management decisions, particularly in assessing the implications of
allocating public land to recreation and other uses.
12. To apply the methodology to other areas, two types of data are needed. First is the number of visitors (ideally, the number of anglers)to the area in question. This information is generally available from the agency that is responsible for managing the area. Second is theeconomic value per activity day, which may be available from the management agency and/or published in empirical studies for the area.If not, Rosenberger and Loomis (2001) provides values by recreation activityincluding fishingfor five regions in the United States(see Table 3) and list guidelines for applying benefit transfer methods.
Table 9. Summary of Revenue and Economic Benefits
Revenue
User Benefits
Trout Preservation
$13,138
$148,600 - $713,310
Grazing
$5,329
$21,380 - $40,082

Anderson, R. 1990. Cost-Benefit Analysis of California's Catchable Trout Program. California Trout, Inc.
Bauer, Cheryl. 2002. Recreation Manager, Sequoia National Forest, Cannell Meadow Ranger District, Kernville, CA. Personal communication (August and November).
Brown, T. 1993. Measuring non-use value: A comparison of recent contingent valuation studies. In th
Proceedings of the 1993, Benefits and Costs Transfers in Natural Resource Planning, 6 Interim Report. Athens, GA: University of Georgia, Department of Agricultural and Applied Economics.
California Department of Fish and Game. 1999. California Heritage Trout Program. Sacramento, CA: Wildlife and Inland Fisheries Division, Fisheries Program Branch.<Http:// www.dfg.ca.gov/fishing/htrout.htm> Accessed 16 October 2002.
_____. 2002. Department of Fish and Game Statistics. Sacramento, CA: License and Revenue Branch.> Accessed July 2002.
California Fish and Game Commission. 2002. Freshwater Sport Fishing Regulations. Sacramento, CA.
Duane, T. P. 1996a. Recreation in the Sierra. In: Sierra Nevada Ecosystem Project: Final Report to Congress, Vol. II, Assessments and Scientific Basis for Management Options. Davis, CA: University of California, Centers for Water and Wildland Resources.
______. 1996b. Letter to Bill Bramlette, Deputy Supervisor, Inyo National Forest, Bishop, California (dated February 2) related to spatial pattern of visitors who live in California for the Mount Whitney Complex and the Mammoth Lakes Basin of the Inyo National Forest; see Duane and Knauer 1996.
Duane, T. P. and J. L. Knauer. 1996. Recreational Activities and Visitor Characteristics in the Mount Whitney Complex and the Mammoth Lakes Basin of the Inyo National Forest. Prepared for the Inyo National Forest. Bishop, CA.
Hubbs, D. 2002. Rangeland Management Specialist, Inyo National Forest, Mt. Whitney Ranger Station, Lone Pine, CA. Personal communication (August).
Kaiser, J. 2002. Recreation Manager, Sequoia National Forest, Tule River Ranger District, Springville, CA. Personal communication (December).
Knapp, R. A. and K. R. Matthews. 1996. Livestock grazing, golden trout, and streams in the Golden Trout Wilderness, California: Impacts and management implications. North American Journal of Fisheries Management 16(November): 805-820.
Lechner, M. and T. Pustejovsky. 1993. Fishing economics on the Tule River Ranger District. Fish Habitat Relationship Bulletin (12) (September).
<http://www.dfg.ca.gov/licensing/statistics/statistics.html
21
References Cited
References Continued...
Lee, M. E. and P. J. Brown. 1991. An analysis, interpretation, and report of recreational user data collected on the Inyo National Forest during summer 1989. Unpublished draft. Cited in D. J. Chavez. 2001. Managing Outdoor Recreation in California: Visitor Contact Studies 1989-1998. Gen. Tech. Rep. PSW-GTR-180. Albany, CA: U.S. Department of Agriculture, Forest Service, Pacific Southwest Research Station.
Lentz, D. 2002. California Department of Fish and Game, Wild Trout Program. Personal communication (November).
Loomis, J. B. and D. S. White. 1996. Economic benefits of rare and endangered species: Summary and meta-analysis. Ecological Economics 18: 197-206.
Matzke, B. 2002. Public Lands Director, California Trout, Coarsegold, CA. Personal communication (November).
Molzahn, J. 2002. South Zone Recreation Officer and Forest OHV/OSV Coordinator, Inyo National Forest, White Mountain/Mt. Whitney Ranger Districts, Bishop, CA. Personal communication (August and September).
Moyle, P. B., R. M. Yoshiyama, and R. A. Knapp. 1996. Status of fish and fisheries. In Sierra Nevada Ecosystem Project: Final Report to Congress, Vol. II, Assessments and Scientific Basis for Management Options. Davis, CA: University of California, Centers for Water and Wildland Resources.
Richardson, R. B. 2002. The Economic Benefits of Wildlands in the Eastern Sierra Nevada Region of California. San Francisco, CA: The Wilderness Society.
Rock Creek Pack Station. 2002. <http://www.rockcreekpackstation.com> Accessed 22 October 2002.
Roggenbuck, J. W. and A. E. Watson. 1989. Wilderness recreation use: The current situation. In Outdoor Recreation Benchmark 1988: Proceedings of the National Outdoor Recreation Forum, Tampa, FL. Asheville, NC: Southeastern Forest Experiment Station.
Rosenberger, R. S. and J. B. Loomis. 2001. Benefit Transfer of Outdoor Recreation Use Values: A Technical Document Supporting the Forest Service Strategic Plan (2000) Revision. Gen. Tech. Rep. RMRS-GTR-72. Fort Collins, CO: U.S. Department of Agriculture, Forest Service, Rocky Mountain Research Station. <http://www.fs.fed.us/rm/pubs/rmrs_gtr72.html> Accessed September 2002.
Shackelford, J. 2002. Region 5 Range Program Manager, Vallejo, CA. Personal communication (December).
22

References Continued...
U.S. Bureau of the Census. 2002a. Census 2000, Table DP-3, Profile of Selected Economic Characteristics: 2000 for Springville CDP and Lone Pine CDP, California. Washington, DC.
______. 2002b. Census 2000, Maps: Lone Pine Division, Inyo County, California and Springville-Johnsondale CCD, Tulare County, California. American Factfinder at <http//www.census.gov> Accessed July 2002.
USDA Forest Service. 1988a. Sequoia National Forest Land and Resource Management Plan. Bishop, CA: Pacific Southwest Region.
______. 1988b. Environmental Impact Statement for the Land and Resource Management Plan. Bishop, CA: Pacific Southwest Region, Inyo National Forest.
______. 1990. Resource Pricing and Valuation Procedures for the Recommended 1990 RPA Program. Washington, DC.
______. 2001. Decision Notice and Finding of No Significant Impact, Templeton and Whitney Grazing Allotments. Bishop, CA: Pacific Southwest Region, Inyo National Forest Mount Whitney Ranger Station.
______. 2002a. FY 2001 Golden Trout Wilderness Summary. Fax from C. Bauer, Recreation Manager, Sequoia National Forest (September 19). Kernville, CA: Cannell Meadow Ranger District.
______. 2002b. Golden Trout Wilderness Use Data. Excel file from A. B. McClory, Wilderness Permit Officer. Bishop, CA: Inyo National Forest, Wilderness Permit Office.
______. 2002c. Golden Trout Wilderness, Allotment and Permit Information Spreadsheet. From J. Shackelford, Region 5 Range Program Manager.
______. No date. Monache Meadows, Inyo National Forest. Fact sheet.
U.S. Department of Commerce. 2002. Gross Domestic Products: First Quarter (2002). Washington, DC: Bureau of Economic Analysis.
U.S. Department of the Interior, Fish and Wildlife Service, and U.S. Department of Commerce, Bureau of the Census. 1998. 1996 National Survey of Fishing, Hunting, and Wildlife-Associated Recreation: California. Washington, DC.
23

Appendix AGolden Trout WildernessAllotment/Permit Information
24

25
Notes