
Economic Transformation in Africa from the Bottom Up...
65
Economic Transformation in Africa from the Bottom Up: Macro and Micro Evidence from Tanzania Xinshen Diao, Josaphat Kweka, Margaret McMillan 1 , Zara Qureshi DRAFT March 11, 2016 Abstract: At roughly 4% per annum, labor productivity in Tanzania has grown more rapidly over the past 14 years than at any other time in recent history. Employment growth has also been strong keeping up with population growth at roughly 2.2 percent per annum. However, the bulk of the employment growth – 88.6% - has been in the non-agricultural and largely informal private sector. Using Tanzania’s first nationally representative survey of micro, small and medium sized enterprises - we show that these informal firms made a substantial contribution to annual labor productivity growth through structural change. However, most of this labor productivity growth came from a relatively small subset of these firms where annual average labor productivity is significantly higher than average labor productivity in the rest of the economy. The owners of these firms share the following characteristics: (i) they wouldn’t leave their business for a full time salaried position and; (ii) they keep written accounts. Accelerating employment growth in this group of firms has the potential to contribute 1.3 percentage points to annual labor productivity growth; to put this in perspective the formal modern sector contributed 1.58 percentage points to annual labor productivity growth over the past decade. Actualizing this potential will require financial products and business services targeted at this group of firms. 1 Corresponding author: M. [email protected]. 1
Transcript of Economic Transformation in Africa from the Bottom Up...

Economic Transformation in Africa from the Bottom Up:
Macro and Micro Evidence from Tanzania
Xinshen Diao, Josaphat Kweka, Margaret McMillan1, Zara Qureshi
DRAFT
March 11, 2016
Abstract: At roughly 4% per annum, labor productivity in Tanzania has grown more rapidly over the
past 14 years than at any other time in recent history. Employment growth has also been strong
keeping up with population growth at roughly 2.2 percent per annum. However, the bulk of the
employment growth – 88.6% - has been in the non-agricultural and largely informal private sector.
Using Tanzania’s first nationally representative survey of micro, small and medium sized enterprises
- we show that these informal firms made a substantial contribution to annual labor productivity
growth through structural change. However, most of this labor productivity growth came from a
relatively small subset of these firms where annual average labor productivity is significantly higher
than average labor productivity in the rest of the economy. The owners of these firms share the
following characteristics: (i) they wouldn’t leave their business for a full time salaried position and; (ii)
they keep written accounts. Accelerating employment growth in this group of firms has the potential
to contribute 1.3 percentage points to annual labor productivity growth; to put this in perspective
the formal modern sector contributed 1.58 percentage points to annual labor productivity growth
over the past decade. Actualizing this potential will require financial products and business services
targeted at this group of firms.
1 Corresponding author: M. [email protected].
1

1. Introduction
Africa’s impressive performance over the past two decades has been accompanied by a
proliferation of small firms, many of which operate in the informal sector. Researchers at the
African Development Bank (2013) estimate that the informal sector accounts for around 55% of
Sub-Saharan Africa’s GDP and 80% of its’ employment2. This is potentially alarming since firms in
the informal sector are widely viewed as unproductive employers of last resort3. Using Tanzania’s
first nationally representative survey of micro, small and medium sized enterprises we show that
many of these firms have surprisingly high labor productivity and that they have contributed
significantly to economy-wide employment and productivity growth.
Between 2002 and 2012 Tanzania’s economy grew more rapidly than at any other time in
recent history; average annual GDP growth was 6.5% and average annual labor productivity growth
was 4.1%. More than three quarters of this labor productivity growth is accounted for by structural
change; the remainder of the growth is largely attributable to within sector productivity growth in
agriculture. The growth attributable to structural change is almost entirely explained by a rapid
decline in the agricultural employment share and an increase in the non-agricultural private sector
employment share. However, only 11.4% of employment growth in the private nonagricultural
economy is due to the expansion of the formal private sector. The remaining 88.6% of this
employment growth occurred in the informal sector.
The two sectors that contributed most significantly to labor productivity growth are
manufacturing and trade services. Since two thirds of the employment expansion in manufacturing
and virtually all of the employment expansion in trade services is in the informal sector, we examine
the informal firms in these sectors to better understand their characteristics. We find that a
significant portion of firms in the informal sector have average labor productivity greater than
economy-wide average labor productivity in manufacturing. And although the average firm size is
small, there is also a great deal of heterogeneity in employment growth. Average annual employment
growth in all MSMEs is 1.15% per annum. This masks the relatively high annual employment
growth among the firms that did grow – 12% of the sample - of 13% per annum. Analyzing the
relationship between employment growth and firm size, we find that younger and smaller firms
2 These numbers also include agriculture. In this paper, we focus on the non-agricultural private sector. There is clearly room for modernizing agriculture but that is not the focus of this paper. 3 See for example La Porta and Shleifer (2011).
2

grow more quickly than older larger firms; this result is robust to alternative specifications and the
inclusion of interaction terms.
We also find that many of these business owners cannot be characterized as ‘reluctant
entrepreneurs’. Instead, 51% of the small business owners report that they were motivated by a
business opportunity and that they would not give up their business for a full time salaried position.
Nor can all of these business owners be characterized as ‘petty traders’. In the manufacturing sector,
they make elaborate steel doors, wheel-barrows, furniture, milled flour and other products. And in
the trade services sector – while there are street vendors – other activities range from hotels and
restaurants to the installation of electronic equipment to business services. While many of these
products are made exclusively for the domestic market, there is evidence of significant cross-border
trade in some of these items.
Many of these firms also do not fit the stereotypes conjured up by labels such as ‘household
enterprises’ or ‘self-employed’. The most productive of these enterprises typically have rental
agreements for their business premises and are not run out of the home. And the nature of the
employment relationships are complicated; some firms hire paid workers while others lease
machinery and space to workers who turn over a portion of their profits in return. Many of the
business owners and employees have training but more often than not, they received their training as
apprentices. Overall, the geographic distribution of employment in these small firms is roughly
proportional to population size with the majority (74%) located in rural areas. However the most
productive of these firms are more likely to be located in urban areas. The firms and their owners
are young (6.3 years and 36 years respectively) and the majority of businesses (80%) operate on a full
time basis.
Having documented the importance of these firms to past employment and labor
productivity growth, we turn to the issue of what to expect from these firms going forward. To do
this, we use the analytical framework developed by Rodrik (2014) in ‘The Past, Present and Future
of Economic Growth’. We begin this analysis by identifying groups of firms in the informal sector
that have some of the same characteristics as firms in the formal sector. In particular, we focus on
firms with the following characteristics: (i) the owners report that running their businesses is
preferable to taking a full time salaried position; (ii) the businesses keep written accounts and; (iii)
the businesses hire paid workers. Within this group of firms we further explore the consequences
for economy-wide productivity growth of limiting the sample of firms to those with labor
productivity greater than economy-wide labor productivity in trade services and then manufacturing.
3

The size of the group of existing firms that could contribute meaningfully to future productivity
growth shrinks as the criteria become stricter. It ranges from 24% of all MSMEs to 4.4% of all
MSMEs.
We estimate the contribution of these highly productive MSMEs to future productivity
growth under alternative scenarios. We conduct these simulations not because we want to predict
the future! Rather, these should be viewed in the spirit of thinking about what to expect if – for
example – financial assistance was targeted at this group of MSMEs. We focus on two sets of
scenarios. In the first set of scenarios, we focus on employment growth in the MSMEs that meet the
criteria laid out above. In the second set of scenarios, in addition to employment growth, we
simulate the impact of productivity growth in some of the more productive MSMEs. The idea is that
some of the more productive MSMEs are able to learn from and adopt practices used by the most
productive MSMEs and also by firms in the formal sector. Under our baseline scenario -- in which
the next ten years look exactly like the past ten years – the MSMEs contribute a half of a percentage
point to annual labor productivity growth. However, most of this labor productivity growth comes
from only 10% of the MSMEs where annual average labor productivity is 80% higher than
economy-wide productivity in manufacturing. And under our most optimistic scenario this same
group of firms has the potential to contribute up to 1.3 percentage points to annual labor
productivity growth. By comparison, the entire modern sector currently contributes rough 1.5
percentage points to annual labor productivity growth.
We conclude the paper with a discussion of policy. Most developing country governments
have policies in place to support the MSME sector and Tanzania is no exception. But the evidence
presented in this paper makes it clear that the heterogeneity of the MSME sector calls for
differentiated sets of policies depending on the goal. Obviously, the MSME sector is important for
poverty reduction. But policies targeted at poverty reduction are not necessarily the same as policies
targeted at productivity and employment growth in firms that are already growing and that have the
potential to join the modern sector.
At the same time, targeting will be difficult. For example, focusing only on the firms with the
highest productivity, we find that the three main constraints to doing business are: (i) access to
finance (44%); (ii) improving infrastructure (33%) and; (iii) access to business services (16%). But
the less productive firms also report these constraints and in the same order. Thus, if the goal is to
increase the number of firms and employees in the most productive MSMEs, policymakers will need
to think carefully about the kinds of support to offer. One notable difference between the
4

productive MSMEs and the rest of the MSMEs is that the productive MSMEs are significantly more
likely to have a relationship with a formal bank. They don’t necessarily borrow from formal banks
but they do put their savings in these banks. Thus, formal banking networks may be one way to
reach out to the MSMEs with significant potential for employment and productivity growth.
Fortunately for Tanzanians, some of Tanzania’s most dynamic entrepreneurs are not waiting
for the government to improve the situation for these relatively small but productive firms. Instead
– they are taking matters into their own hands. For example, Darecha Limited - a start-up founded
by Julius James Shirima and incorporated on August 11th, 2014 – is bridging the gap between some
of Tanzania’s wealthiest firms and MSMEs through micro-venture capital and mentorship. For
example, on January 25, 2016, Darecha partnered with Mohammed Dewji – Forbes Africa’s
Businessman of the Year 2015 – to pilot a competition for entrepreneurs. The competition is
designed to identify young (ages 18 to 30 years old) entrepreneurs who are already in business.
Winners of the competition will be supported along three dimensions: finance, access to networks
and mentorship. Darecha also partnered with STATOIL - Norway’s state-owned oil company - to
launch the ‘Heroes of Tomorrow (HoT)’ competition in the Mtwara region of Tanzania with the
aim of supporting youth entrepreneurship.
The evidence presented in this paper is consistent with older work by Sir Arthur Lewis who
was acutely aware of the issue of ‘informality’ in developing countries. Regarding firms in the
informal sector, Lewis (1979) wrote:
‘An economy does not divide into a capitalist sector hiring workers for factories and other
large units on the one hand, and a small farming sector on the other hand. In-between are
units of production of all sizes, and in particular a great number of one-to five-man
undertakings in manufacturing, transport and a wide range of services – often nowadays
called the informal sector. Some of this activity belongs in the modern sector as we have
defined it; i.e., it will expand with economic development; the rest – e.g., some of the
handicrafts and some of the services – belong to the traditional sector in that they will
contract.’
Indeed - using one of Africa’s only nationally representative surveys of the informal sector – we
have uncovered empirical support for Lewis’s argument.
5

Our results are also consistent with much more recent work that finds a great deal of
heterogeneity in the profitability of small firms in developing countries. For example, using the 1-2-3
surveys, Grimm et al. (2011) study the return to capital in SMEs in urban areas in seven West
African countries. They find evidence of significant heterogeneity in profitability as well as evidence
of under-investment in seemingly profitable activities by small firms. There is also some evidence to
support the case for targeting assistance to small firms. For example, the results of randomized
controlled trials in several countries across continents support the view that there are constrained
microenterprises that would grow if they had access to capital (de Mel et al (2008), McKenzie and
Woodruff (2008), Grimm et al. (2011), Fafchamps et al. (2014), Dodlova et al. (2015) and McKenzie
(2015)). Perhaps the most relevant to this paper is recent work by Banerjee et al (2015) showing the
heterogeneous impact of microfinance on borrowers. They classify the owners of microenterprises
into ‘gung-ho’ and ‘reluctant’ entrepreneurs and show that unlike ‘reluctant’ entrepreneurs, ‘gung-ho’
entrepreneurs benefitted significantly from access to microfinance.
This paper contributes to three broad strands of literature. First, the evidence presented in
this paper provides a more nuanced and enlightened view of economic transformation in Tanzania.
Up to a quarter of the firms in the informal sector look more like firms in the modern sector in that
they have the potential for both employment and productivity growth. Moreover, many of them
seem to have done very well without significant assistance from the government. Whether and to
what extent government should play a role apart from investing in education, health care and
infrastructure is an open question that deserves further investigation. Second, this paper contributes
to our understanding of the role of small firms in developing country economies. As noted by Li
and Rama (2015) – largely because of a lack of comprehensive nationally representative data – we
know very little about the contribution of these firms to economy-wide employment and
productivity growth. As a consequence, there is a policy bias toward large firms. Third, we
contribute to a large and growing literature that recognizes the heterogeneous impacts of programs
designed to stimulate entrepreneurship in developing countries4.
The remainder of this paper is organized as follows. In Section 2, we place Tanzania’s
MSMEs in the context of the macro economy. In Section 3 we describe the MSME data, provide an
4 See for example Banerjee et al. (2015) and McKenzie (2015).
6

industrial and geographic breakdown of MSME activity and examine the motivations of MSME
owners for going into business. In Section 4, we analyze the productivity and employment growth of
MSMEs. In Section 5, we identify MSMEs with significant potential for employment and
productivity growth and study the economy-wide implications of employment and productivity
growth in these firms. In Section 6, we discuss what it would mean to include these firms in a
growth strategy. Section 7 concludes.
2. The macro setting: structural change, productivity growth and employment
2.1 Economic Growth in Tanzania 1988-2014
Between 2000 and 2014 Tanzania’s economy grew more rapidly than at any other time in
recent history, with the annual GDP growth rate averaging 6.7% (Figure 1). An important feature of
this recent performance is that it has been inclusive in nature; growth in total employment has been
at par with population growth. A second important feature of this recent growth is that it has been
accompanied by strong labor productivity growth: labor productivity grew by 4.1% per year annually
between 2002 and 2012. Additionally, rapid growth in the country’s manufacturing sector implies
that there are no signs of deindustrialization: the sector’s GDP grew at 8% per year between 2000
and 2014 - more than three times the growth experienced in 1988-1999 (Figure 1).
2.2 Structural Change Accounts for Most of the Productivity Growth
To better understand the nature of Tanzania’s recent growth, we employ the growth
decomposition methodology developed by McMillan and Rodrik (2011). To this end, we aggregate
the economy into 10 main subsectors and decompose economy-wide labor productivity into that
which can be attributed to within sector productivity growth and that which can be attributed to
structural change. For the purposes of this paper, we define within sector productivity growth as
growth in labor productivity in any of the ten sub-sectors and we define productivity growth
attributable to structural change as the productivity growth that occurs when employment is
reallocated across these ten sub-sectors as a result of different levels of average labor productivity.
Details of the growth decomposition are presented in Appendix 1.
Table 1 highlights the main results of this exercise. Our analysis confirms that close to 80%
of Tanzania’s recent growth in labor productivity is attributable to structural change. Employment
7

shares have declined in agriculture – the sector with the lowest average labor productivity – and
increased in various nonagricultural sectors, most of which are significantly more productive than
agriculture.
The growth decomposition presented in Table 1 tells us nothing about whether structural
change in Tanzania was the result of job creation or simply labor reallocation across sectors. Like
many African countries, Tanzania has had a relatively high population growth rate over the past
decade leading millions of young people to enter the job market. To this end, Table 2 links the
growth in employment with the change in the economic structure by displaying ‘new’ employment
opportunities across all nonagricultural sectors.
We define new employment by sector as the net increase in the number of employees in
each sector between 2002 and 2012 computed using the population censuses. For these calculations
we exclude agricultural employment primarily because it has not played an important role in job
creation; the net increase in agricultural employment accounted for only 11% of the total increase in
employment between 2002 and 2012. Instead, almost 90% of the new jobs created over this ten year
period were created in the non-agricultural sector. Considering that agricultural employment made
up more than 80% of total employment in 2002 (Table 1, first panel, column 6), it is remarkable that
almost all of the new jobs were created outside of the agricultural sector in a relatively short period
of time.
2.3 Employment in Small Private Firms Dominates Employment Growth
Two key facts need to be highlighted in the ‘new employment’ decomposition presented in
Table 2. First, a majority of new jobs were created in the private sector, not the public sector; almost
94% of increased nonagricultural employment between 2002 and 2012 is based in the private sector
(Table 2, second column). Second, 83% of these private sector jobs were created in the so-called
‘informal economy’ by micro and small firms (Table 2, last column).
This trend in private sector job creation by micro and small firms is often seen as a
distressing phenomenon, as firms in the informal economy, or small firms in general, are often
associated with low productivity and a lack of dynamism. However, once we link the trend in private
sector job creation with the results of the growth decomposition analysis shown in Table 1, the
following stylized facts become evident. First, structural change accounted for almost 80% of
economy-wide labor productivity growth (Table 1, last row) in Tanzania between 2002 and 2012.
8

Second, structural change was primarily achieved by the growth in employment in small firms in the
informal economy. These two facts together raise the possibility that some of Tanzania’s growth in
labor productivity may be linked to the growth in employment in small firms.
There are two sectors that stand out as having contributed significantly to job creation in
Tanzania over the period 2002 to 2012. These are manufacturing and trade services. Average labor
productivity in Tanzania’s manufacturing sector is more than seven times that of the agricultural
sector. Although the sector is still relatively small, because of its extremely high productivity
compared with the rest of the economy, increased employment in this sector contributed 12.4% of
economy-wide labor productivity growth (Table 1, second panel, column 2). Notably, more than
two thirds of this increase in employment is accounted for by small mostly informal firms.
Like manufacturing, trade services productivity is also relatively high in Tanzania. While
labor productivity in this sector is only half of that of manufacturing, it is still 3.5 times that of
agriculture (Table 1, first panel, columns 1 and 2). More importantly, more new jobs were created in
this sector than in any other sector between 2002 and 2012. As Table 2 highlights, amongst the
nearly one million new jobs created in trade services, more than 99% were created by the informal
economy. Further, although these jobs were created by small firms in the informal sector,
productivity in trade services did not fall. As the growth decomposition analysis of Table 1 shows,
within-sector productivity actually increased modestly in the trade services sector between 2002-
2012 (Table 1, comparing row 1 to row 2). As a result, job creation in Tanzania’s trade services
sector accounted for more than 18% of economy-wide productivity growth between 2002 and 2012.
Nonetheless, without more information it is difficult to know what to make of these results.
On the one hand, we would have preferred to see more rapid growth in employment in large
productive private sector formal firms. On the other hand, the news is not all bad. Employment has
kept pace with population growth and labor productivity growth has been strong. But as we have
shown, the bulk of the employment growth has come from the entry of small informal firms. A key
question going forward is: what can we expect from these small firms? If the next ten years look like
the past ten years, will the entry of more and more small firms eventually be a drag on productivity?
Or will some of these small firms grow? And in the process, will some of the firms that are less
productive disappear? The remainder of this paper is devoted to these issues.
9

3. The micro setting: where are the small firms and what do they do?
Based on our analysis in Section 2, we know that the majority of ‘new’ jobs in Tanzania have
been created by micro, small and medium sized firms largely in the informal sector. In this section,
we will use Tanzania’s first nationally representative survey of small businesses - The Micro, Small
and Medium Sized Enterprise Survey (MSME) 2010 - to document the sectoral and geographic
concentration of these firms as well as their contribution to national employment and output.
A significant advantage of this survey is that it is nationally representative; it covers a little
under 3 million businesses and around 5 million employees. A second advantage of this survey is
that it covers both the formal and the informal sectors. However, the survey is not without
limitations. First, the sampling frame for this survey is households and the selection of households is
based on the 2002 census. This poses at least two problems. First, because the survey is household
based, it is representative of households and not businesses. Thus, since Tanzania is still a very poor
country, we are likely to be missing some of the more productive businesses. Indeed, an analysis of
the data reveals that mid-sized firms are under-represented in this dataset (MSME Report, 2012).
Second, because the sampling framework is 2002, it oversamples rural households. This is because
there was a significant reduction in rural activity between 2002 and 2012 as documented in Section 2
of this paper. Therefore, the reader should keep in mind that our analysis is likely to understate the
contribution of small businesses to economy-wide productivity and employment and also to
understate the importance of small businesses in urban areas.
3.1 Data and summary statistics
A set of summary statistics based on the MSME survey is presented in Table 3. Among the
6,134 sampled firms, a total of 5,653 firms have all of the information reported in Table 3. Based on
the information that is available, we have no reason to believe that the firms with missing
information are ‘select’ in a particular manner. For example, they are dispersed across regions and
firm size. As shown in the first panel of Table 3, most MSMEs are extremely small: mean
employment is 1.48. Only 3% of these firms are registered with Tanzania's Business Registration and
Licensing Agency that opened in 19995. Similarly, only 5.3% of these firms have a tax identification
5 BRELA is Tanzania’s Business Registrations and Licensing Agency. It is a Government Executive Agency and was established on the 28th of October, 1999. The aim of the agency is to ensure that businesses operate in accordance with regulations and to ensure that businesses follow ‘sound principles.’
10

number. While the MSME survey is a household based survey, only 50% of firms report that their
businesses are actually operating out of their homes.
As previously noted, because the sampling framework is based on the 2002 census, the
sample is heavily skewed towards rural firms; indeed the second panel of Table 3 indicates that 74.1%
of firms are located in rural areas. We also report in the second panel of Table 3 average monthly
value-added and average monthly sales per firm. The mean value-added of an MSME firm is very
close to the average monthly gross income of a formal employee in Tanzania, which is 336,835
Tanzanian Shillings according to Tanzania’s Formal Employment and Earnings Survey 2010. There
is enormous variation in monthly value-added among surveyed firms, indicated by the very high
value of the standard deviation (s.d.) in Table 3. This productive heterogeneity among small informal
firms is a point to which we will return in great detail later on in the paper.
The majority of MSME firms are young as indicated by the mean age of 6.33 years in panel 2
of Table 3. This is consistent with our macro findings that the majority of non-farm private sector
jobs created in Tanzania between 2002 and 2012 were created by small informal firms. Panel 2 of
Table 3 also indicates that 80% of these businesses operate full time. Panel 3 of Table 3 indicates
that roughly one third of these business owners report that the business is the owners’ only source
of income with a slightly higher share of business owners (40%) reporting that the business is the
owners’ main source of income. 19.3% of business owners report that farming is their main source
of income.
Like their businesses, the owners of these small businesses are also relatively young. The
mean age of business owners is 36.9 years; the youngest business owner is 16 and the oldest is 91.
Roughly half of these business owners are women.
Finally, we report in panel 4 of Table 3 the category of income of the household in which
the business owner resides. There are three categories derived from Tanzania’s Living Standards and
Measurement Survey (LSMS): not poor, moderately poor and very poor. 44.9% of the MSME
owners households are not poor, 35.2% are moderately poor and 19.9% are very poor.
3.2 Industrial and Geographic Distribution
Although the MSMEs operate in a wide range of activities, the bulk of these activities can be
classified into trade services (79.9%) and manufacturing (16.7%). As reported in Table 4,
manufacturing enterprises operate in the following 6 sub-sectors: grain milling (1.7%), beverages
11

(8.3%), textiles (3.4%), wood (0.5%), building materials (1.1%) and furniture (1.6%). Firms in the
trade services sector operate primarily in retail (47.1%), food services (22.3%) and beverage services
(7.9%). Many of these activities appear to have strong links to agriculture but without further
information, it is not possible to identify which ones and exactly how these linkages work. This is an
important area for future research.
In Table 5 we report the distribution of employment in MSMEs by the 26 geographic
regions of Tanzania. Unlike the distribution of firms, the distribution of employment is almost
evenly split between rural and urban areas indicating that firms in urban areas have on average more
employees. Overall, the distribution of employment in small firms is roughly proportional to
population size with the highest concentration of employment in MSMEs located in Dar es Salaam
(17.32%) and the lowest concentration of employment in Kusini Pemba (0.35%). Apart from Dar es
Salaam, other regions with a high concentration of MSMEs include Mwanza (10.7%), Mbeya (8.02%)
and Morogoro (6.44%).
3.3 MSME coverage of national employment
In Section 2, we combined census data with Tanzania’s Formal Employment and Earnings
Survey (FEES) to show that the majority of new jobs created in Tanzania over the past decade are in
the informal sector. Here, we combine the MSME data for 2010 with data from the 2012 Census
and the Formal Employment and Earnings Survey (FEES) 2012 to get a sense for what the MSME
data covers in terms of national output and employment. Since we are only interested in rough
estimates, we chose not to interpolate 2012 data back to 2010 and instead report actual numbers.
This is likely to understate the importance of MSMEs since this sector is growing more rapidly than
the formal sector. However, some discrepancies are bound to arise due to the differences in the
timing of the surveys.
Table 6 summarizes the results of the comparison of MSME employment to census and FEES
employment. We report total private non-agricultural employment by data source in the last row of
Table 6. As we reported previously, formal private sector employment is about 15% of the total
non-agricultural employment reported in the 2012 Census; the implication is that 85% of all private
nonagricultural jobs are in the informal sector. The MSME survey covers 83% of the jobs in the
informal sector.
At the sector level, the number of employees in the MSME is much higher than in the Census
12

for manufacturing and trade services. In manufacturing, the total number of employees covered by
the MSME survey doubles the informal manufacturing employment numbers obtained by taking the
difference between the census and FEES. In the trade services sector, the total number of
employees covered by the MSME survey is more than 50% greater than what is reported in the
census. In addition, in other small informal business activities, such as construction and transport,
there are very few firms covered by the MSME survey, indicating that such economic activities seem
to be under-represented in the MSME survey. Furthermore, personal services, which account for
25% of total informal non-agricultural employment in the Census, are not considered small
businesses and hence are not covered by the MSME survey.
Most of the employment related discrepancies in the sectoral breakdowns between the MSME
data and the census data can be explained by digging deeper into the data. First, the MSME survey
covers businesses that do not run full time, and employees of such part time businesses may have
been counted in the Census as farm workers. In fact, more than 25% of the rural MSME firms
identified agriculture as their main source of income and 32% of rural households operating in
MSME manufacturing identified agriculture as their main source of income. Second, though the
Census reports fewer informal workers in the “Hotel, Restaurants and Food Services” industry than
the MSME, a possible explanation for this could be that the Census counts only the employees of
hotels and restaurants in this sector, designating small business owners of food and beverage
services to other service activities.
3.4 MSME coverage of national output
In addition to the MSME contribution to employment, we would like to know how much the
MSMEs contribute to total output of the economy. According to the “National Baseline Survey
Report for Micro, Small, and Medium Enterprises in Tanzania”, MSMEs contributed around 27% to
Tanzania’s GDP in 2010 (Ministry of Trade and Industry, 2012, p15). Using the after rebasing
national accounts data for 2010, Using a different methodology we arrive at a lower but more
realistic estimate for the MSME sector’s value added, about 13.5% of national GDP (see Appendix 3
for the estimation methodology). The results of this estimation are reported in Table 7.
As reported in Table 7, the value added of the MSME sector accounted for 25% of national
private non-agricultural GDP in 2010. The contribution of the MSME sector to manufacturing
value-added is roughly 18%. In manufacturing, the MSMEs are concentrated in six sub-sectors:
13

beverages, food processing, textiles, wood processing, furniture, and building materials.6 We also
present the value-added of these six manufacturing sub-sectors contributed by firms in the formal
sector using Tanzania’s Annual Survey of Industrial Production (ASIP) for the years 2008 and 2009
(the two most recent rounds of ASIP). We find that in some cases, small informal firms seem to play
the dominant role as their total value-added contribution is actually higher than that of their
counterpart formal firms.
In summary, the nonagricultural sectors where the MSME businesses concentrate, while they are
important to these sectors’ GDP, are more important to these sectors’ employment. This is an
indication that in such sectors MSME firms have lower average productivity than formal firms in the
same private non-agricultural sectors. This leads to the second important question we tried to
address in this paper in the next section.
4. Should MSME’s be part of Tanzania’s growth strategy?
For small firms to be an effective part of a growth strategy, they should not only contribute
to employment growth but also to productivity growth. In addition, the owners of these businesses
should be enthusiastic participants in the process. In other words, it is unlikely that individuals who
run businesses solely for the purposes of survival or ‘reluctant entrepreneurs’ can contribute in a
meaningful way to employment and productivity growth. To get at these issues, in this section of the
paper we examine the following: (i) self-reported motivations for business ownership; (ii) the
productive heterogeneity of MSMEs and; (iii) employment growth in MSMEs.
4.1 Self-reported motivations of small business owners
The MSME survey includes three questions designed to elicit the reasons for which
businesses are opened. The responses to these questions are tabulated using sample weights in
Tables 8-10.
6 Though the value added numbers for these six sub-sectors of manufacturing is not available in the National Account data, according to the Annual Survey of Industrial Production (ASIP), these six manufacturing sectors account for less than 50% of total formal manufacturing. Therefore, we can say with confidence that the contribution of MSMEs in these six manufacturing sectors would be much higher than their contribution to the overall manufacturing sector.
14

The first question is: what was your main occupation before you started this business?
Responses to this question are reported in order of how often they were repeated in Table 8.
36.73% of respondents reported that they were previously farming, 21.23% of respondents reported
that they were previously working in another business and 19.99% of respondents reported that they
were previously housewives. Only 7.56% of respondents reported that they were previously
unemployed.
The second question is: for what reason did you choose your line of business? Responses to
this question are reported in Table 9 and broken out by three broad sectors: manufacturing, trade
services and other services. A little under half of all business owners say that the reason they chose
their line of business is because they saw a market opportunity. This response is more pronounced
in services than in manufacturing. The second most common reason for operating in a particular
line of business is that the owners’ capital could only finance that line of business. The third and
most common reason for picking a line of business was having friends and family who operated a
similar business. And the fourth reason for opening in a particular line of business was business
experience.
The third question is: if you were offered a full-time salary paying job, would you take it?
Responses to this question are reported in Table 10 and indicate that only 46.57% of small business
owners would leave their current business for a full time salaried position. 63.92% of the
respondents who would prefer a full time salaried job say they would like to work for the
government. This is consistent with results reported in Duflo and Banerjee’s analysis of the
economic lives of the poor (2007). Another 23.99% of the respondents say they would prefer to
work for a large private company. The reported reason for preferring a full time salaried position is
better security of income.
4.2 The productive heterogeneity of small firms
We use kernel densities of the log of value added to examine the productive heterogeneity of
MSMEs. Value added is computed as the firm’s average monthly sales minus the firms’ average
monthly costs of production. Firms in the MSME database report sales on a monthly basis and thus
we are able to take seasonality into account. Our analysis of the productive heterogeneity of firms in
the MSME sector reveals two important features of these firms.
15

First, there is significant overlap in productivity between ‘formal’ and ‘informal’ firms. This
is shown in Figures 2a and 2b which plot the distribution of productivity for formal MSMEs (blue
line) and the distribution of productivity for informal MSMEs (red line). We use two definitions of
formality. In Figure 2a firms are consider formal if they are registered with BRELA Tanzania’s
business registration and licensing agency. In Figure 2b firms are considered formal if they have a
tax identification number (Tax ID). The overlap in the distribution of productivity between formal
and informal MSMEs is significant. Thus, it would be a mistake to classify all informal MSMEs as
unproductive and all formal MSMEs as productive.
Second, Figure 3 reveals that a little over half of the firms in the MSME sector have labor
productivity levels higher than the economy-wide average in agriculture. This is not surprising and is
consistent with evidence presented in Section 2 of this paper where we show that average
productivity in the sectors dominated by small firms is consistently higher than average productivity
in agriculture. What is more surprising is the fact that 15% of the MSMEs have labor productivity
higher than economy-wide manufacturing labor productivity. These firms account for 70% of the
total value-added generated by the MSME sector. By contrast, the remaining 85% of the MSMEs
account for only 30% of the value added generated by the MSME sector. This is important because
it means that a good number of these firms contribute to raising labor productivity in Tanzania’s
economy and it underscores the productive heterogeneity of the informal sector.
4.3 Job creation: the employment growth of small firms
Our analysis of the dynamics of small firms is somewhat limited by the cross sectional nature
of the data (a second survey is planned for 2016). There is though, a retrospective question that asks
business owners how many employees worked in the business when the business started and how
many employees work in the business now. We are well aware of the selection bias associated with
this sort of retrospective data. Because we don’t observe firms that leave the sample, our results may
be biased toward finding a higher growth rate among smaller firms. However, this paper is not about
the merits of small vs large firms – both are clearly important for employment and productivity
growth. Instead, we are using the data available to describe the patterns we observe in the data. Thus,
we use the information on current employment and employment when the business started –
adjusted for firm age - to measure employment growth in MSMEs. We examine three separate but
16

related questions: (i) is there employment growth? ; (ii) is employment growth related to firm size?
and; (iii) is employment growth related to firm age?
It is very important to keep in mind that firm size in the universe of firms that we are
studying in this paper is by definition very small. So we cannot make broad statements about
employment growth among the firms in our sample relative to firms in the formal sector.
Nevertheless, by examining employment growth among the MSMEs, we can begin to get a sense for
whether any of the MSMEs have the potential to grow into larger firms generating employment for
the scores of individuals who would rather have salaried jobs than work in a small business and at
the same time take advantage of economies of scale.
Following Haltiwanger et al (2013) and Harrison et al (2014) we model the relationship
between employment growth, firm size and firm age in the following way:
(1) 𝑔𝑔(𝑡𝑡′) = 𝑓𝑓(𝑆𝑆(𝑡𝑡),𝐴𝐴(𝑡𝑡),𝑋𝑋(𝑡𝑡))
where g denotes growth, S size, A age, X is a vector of additional control variables and t’ and t
denote successive time periods.
Employment growth is typically measured in the following way:
(2) 𝑔𝑔(𝑡𝑡′) = 𝑆𝑆�𝑡𝑡′�−𝑆𝑆(𝑡𝑡)𝑆𝑆(𝑡𝑡)
This measure of growth has been criticized in the literature on employment growth and firm size
because of ‘mean reversion’. If most firms eventually end up with a mean growth rate of Y, then
small firms will have a proportionately higher growth rate.
An alternative methodology for computing firm growth rates – and the one we use in this
paper – is as follows:
(3) 𝑔𝑔𝑎𝑎𝑎𝑎𝑎𝑎(𝑡𝑡′) = 𝑆𝑆�𝑡𝑡′�−𝑆𝑆(𝑡𝑡)
𝑆𝑆𝑎𝑎𝑎𝑎𝑎𝑎(𝑡𝑡)
17

The difference between these two measures of employment growth is that the adjusted calculation
uses the simple average between beginning of the period employment and end of period
employment in the denominator instead of using beginning of period employment.
Because we only have a cross section of firms and because firm start dates vary widely, we
make one further adjustment to the formula. To be able to compare firms with different start dates,
we compute annual employment growth rates using the following compound growth rate formula:
(4) 𝑔𝑔𝑎𝑎𝑎𝑎𝑎𝑎(𝑡𝑡′) = �� 𝑆𝑆�𝑡𝑡′�𝑆𝑆𝑎𝑎𝑎𝑎𝑎𝑎(𝑡𝑡)�^ 1
𝑡𝑡′−𝑡𝑡� − 1
Table 11 shows that annual employment growth is zero in 87.8% of the MSMEs. However,
average annual employment growth has been very high – 13% - among the 12.2% of firms with
employment growth. There are roughly 300,000 of these high growth firms and they employ around
32% of all MSME employees. The average number of employees in non-growing MSMEs is 1.28,
while it is 3.11 for firms with positive employment growth. The implication is that 300,000 small but
growing firms created as much employment as the entire formal economy in 2010 (excluding the
public sector).
To better understand the correlates of employment growth, we explore the relationship between
growth, firm size and firm age using the framework laid out in equation (1). This framework yields
the following estimating equation:
(5) 𝑔𝑔𝑎𝑎𝑎𝑎𝑎𝑎 𝑖𝑖𝑖𝑖(𝑡𝑡′) = 𝛽𝛽0 + 𝛽𝛽𝑠𝑠𝑠𝑠𝑖𝑖𝑖𝑖(𝑡𝑡) + 𝛽𝛽𝑎𝑎𝑎𝑎𝑖𝑖𝑖𝑖(𝑡𝑡) + 𝛽𝛽𝑠𝑠𝑎𝑎𝑠𝑠𝑖𝑖𝑖𝑖(𝑡𝑡)𝑎𝑎𝑖𝑖𝑖𝑖(𝑡𝑡) + 𝑋𝑋′𝑖𝑖𝑖𝑖 + 𝜀𝜀𝑖𝑖𝑖𝑖
where i denotes firm, j denotes industry, t denotes time, g denotes growth, a denotes firm age and X
is a vector of firm level controls.
Based on this estimating equation, the relationship between employment growth, firm size
and firm age is as follows:
(6) 𝑔𝑔𝑠𝑠 ≡𝜕𝜕𝑎𝑎𝜕𝜕𝑠𝑠
= 𝛽𝛽𝑠𝑠 + 𝛽𝛽𝑠𝑠𝑎𝑎𝑎𝑎
18

(7) 𝑔𝑔𝑎𝑎 ≡𝜕𝜕𝑎𝑎𝜕𝜕𝑎𝑎
= 𝛽𝛽𝑎𝑎 + 𝛽𝛽𝑠𝑠𝑎𝑎𝑠𝑠
The results of estimating this equation are presented in Table 12. Because so many of the
observations on growth are equal to zero, we ran the regressions using both the OLS model and the
Tobit model left censored at zero. The results are similar so we report only the OLS estimates. In
Panel A of table 12 we report the estimates obtained using a continuous variable to measure firm
size while in Panel B we report the estimates obtained using categorical variables to measure firm
size. The omitted size is firms with only one employee. Size2 equals 1 if the firm has two employees,
Size3 equals 1 if the firm has three employees, Size4 equals 1 if the firm has four employees and
Size5 equals 1 if the firm has 5 or more employees.
The results across specifications in both Panel A and Panel B are consistent. There is an
inverse relationship between firm size and employment growth. In other words, the smallest firms in
our sample grow more rapidly than the larger firms in the sample. The results in Panel B indicate
that it is the firms with more than 5 employees where employment growth is the smallest. However,
in column (8) of both Panel A and Panel B, the sign on the interaction between the log of age and
the log of size is significant and positive. When evaluated at the mean of the log of firm age, the
interaction term cancels out the direct effect of firm size on employment growth. The bottom line is
that for the younger firms, there is an inverse relationship between firm size and employment
growth but for the older firms the opposite is true.
There is also an inverse relationship between employment growth and firm age – younger
firms grow more rapidly than older firms. The interaction term weakens the strength of this
relationship but it does not overturn the results when evaluated at the mean firm size. As previously
noted, interpretation of these results is tricky because we do not observe firms that grew too big to
be classified as MSMEs. Nevertheless, it is encouraging that the young firms are growing. This result
is consistent with much of the literature that emphasizes the importance of young firms for
employment generation. And it is consistent with a story in which some young firms survive and
grow out of MSME status.
4.4 Using the MSME survey to identify firms with potential
The upshot of the last three parts of this section of the paper is that some MSMEs should be
part of Tanzania’s growth strategy. We separate the ‘high potential’ MSMEs from the rest using both
19

qualitative information and performance based measures of labor productivity and employment
growth to get a sense for the size of the group of MSMEs with significant potential for future
growth. Following Lewis (1979), we call these groups of firms the ‘in-between’ firms. This
terminology is meant to capture the idea that the characteristics of these firms place them
somewhere in-between Tanzania’s modern (most productive) and informal (least productive) firms.
For example, the in-between firms may keep written accounts and be quite productive, but not be
registered. As a first cut, we include in the in-between group of firms only firms whose owners
report that they would not quit their job for a salaried position and that they keep written accounts.
We then experiment with the following additional restrictions: firm has paid employees, firm has
employment growth, firm’s labor productivity is greater than economy-wide manufacturing labor
productivity and firm’s labor productivity is greater than economy-wide trade services productivity.
Specifically, we focus on the following three groups of firms:
• Group 1: Business owners report that running their businesses is preferable to
taking a full time salaried position, the business keeps written accounts and firm
level value added per worker is greater than economy-wide trade services labor
productivity.
• Group 2: In addition to the criteria laid out in Group 1, the firms hire paid workers.
Thus, Group 2 is a subset of Group 1
• Group 3: In addition to the criteria laid out in Group 2, firm level value added per
worker is greater than economy-wide trade services labor productivity. Thus, Group
3 is a subset of Group 2.
Table 13 summarizes the number of firms, the number of employees and average labor
productivity for each of the three sub-groups of MSMEs. Based on Table 13, we conclude that there
are 260,000 firms in Group 1 accounting for about 10.4% of all MSMEs and roughly 37.4% of the
total MSME value-added (Table 13). The average labor productivity for this group of firms is 3.3
times the MSME average and almost 80% higher than economy-wide manufacturing labor
productivity. These results underscore the productive heterogeneity of the MSME sector in
Tanzania.
20

5 Estimating the growth effects of expanding ‘modern’ MSMEs
In this section of the paper, we lay out a framework for estimating the potential of the in-
between firms to contribute to economy-wide productivity growth. Our analytical framework is
adopted and from Rodrik (2014) and modified to fit the characteristics of the Tanzanian economy.
We then use this framework to simulate future growth scenarios and parameterize the model using
the actual data presented in the first three sections of this paper.
5.1 A framework for estimating the contribution of the ‘high potential’ firms to economy-
wide growth
Having identified groups of more productive small firms, we simulate their potential
contribution to economy-wide employment and productivity growth in the future using a modified
version of the analytical framework developed by Rodrik (2014) in “The Past, Present and Future of
Economic Growth.” We begin with a description of the original framework and then explain the
way in which we modify it for our purposes.
Rodrik (2014) relies on the following framework to analyze growth in labor productivity:
(1) 𝑦𝑦�𝑆𝑆 = 𝛾𝛾(ln𝑦𝑦∗ (Θ) − ln𝑦𝑦)
(2) 𝑦𝑦�𝑀𝑀 = 𝛽𝛽(ln 𝑦𝑦𝑀𝑀∗ − ln𝑦𝑦𝑀𝑀) + 𝛾𝛾(ln 𝑦𝑦∗ (Θ) − ln𝑦𝑦)
(3) 𝑦𝑦 = 𝛼𝛼𝑀𝑀𝑦𝑦𝑀𝑀 + 𝛼𝛼𝑆𝑆𝑦𝑦𝑆𝑆 + (1 − 𝛼𝛼𝑀𝑀 − 𝛼𝛼𝑆𝑆)
(4) 𝑦𝑦� = (𝛼𝛼𝑀𝑀𝜋𝜋𝑀𝑀 + 𝛼𝛼𝑆𝑆𝜋𝜋𝑆𝑆)𝛾𝛾(ln𝑦𝑦∗ (Θ) − ln 𝑦𝑦) + 𝛼𝛼𝑀𝑀𝜋𝜋𝑀𝑀𝛽𝛽(ln𝑦𝑦𝑀𝑀∗ − ln𝑦𝑦𝑀𝑀) + (𝜋𝜋𝑀𝑀 − 𝜋𝜋𝑇𝑇)𝑑𝑑𝛼𝛼𝑀𝑀 +(𝜋𝜋𝑆𝑆 − 𝜋𝜋𝑇𝑇)𝑑𝑑𝛼𝛼𝑆𝑆
where 𝑦𝑦𝑇𝑇 is normalized to one in (3), hats over variables, y and 𝑦𝑦𝑖𝑖 denote growth rates, S and M stand
for modern services and manufacturing, T stands for the traditional sector where growth in output
per worker is stagnant by assumption, 𝛼𝛼𝑖𝑖 represents employment shares, 𝛽𝛽 and 𝛾𝛾 are rates of
convergence and 𝜋𝜋𝑖𝑖 = 𝑦𝑦𝑖𝑖 𝑦𝑦� represents relative productivity.
21

Equations (1) and (2) in this framework describe productivity growth in modern services and
manufacturing. Total output per worker in the economy is described by Equation (3). Totally
differentiating equation (3) yields the expression in equation (4) that describes growth in labor
productivity in the economy. In this setup, there are three main drivers of economy-wide
productivity growth. The first is the growth that arises as a result of unconditional convergence in
the modern manufacturing sector – the second term in equation (4). Rodrik (2012) has shown that
the modern manufacturing exhibits unconditional convergence and can be a powerful source of
short term gains. The second source of growth in this framework is a function of the difference
between a country’s existing ‘broad capabilities’ and its’ potential (or steady-state) ‘broad capabilities’.
It is a measure of the rate at which labor productivity will grow as a function of investments in
things like human capital, institutions and infrastructure. For a more elaborate discussion of this
term, see Rodrik (2014). In the setup described above, only the modern services and manufacturing
sectors benefit from these investments. The third source of growth in this framework is structural
change. It comes about as employment shares expand in the modern manufacturing and services
sectors and is captured by the last two terms in equation (4).
This framework makes it clear that to contribute substantially to a countries’ productivity
growth, activities must possess two qualities: first, they have to have productivity higher than the
average for the economy and second, the activity must be able to grow by employing more workers.
It is in this context that Rodrik (2014) argues that manufacturing is less likely to be the shortcut that
it once was to rapid growth. Because of technological changes in manufacturing that are making it
more capital and skill intensive, manufacturing is unlikely to be able to absorb large numbers of
unskilled workers the way it did for example in China. This is a powerful argument that cannot be
ignored.
However, in this same paper Rodrik also argues that growth will depend primarily on what
happens at home. Thus, we modify his framework to take into account the realities on the ground in
a country like Tanzania. First, we explicitly include the agricultural sector because it has become an
important source of within sector productivity growth in Tanzania and other African countries
(Harttgen and McMillan, 2015). Second, we include the informal sector and allow for the productive
heterogeneity of the informal sector. And third, we combine manufacturing and services into one
modern sector preserving the aspect of un-conditional convergence unique to manufacturing. This is
in no way meant to downplay the importance of the modern sector. Indeed, our results show that
even small expansions of the modern sector have relatively large impacts on productivity growth.
22

Our logic for the modifications we make to Rodrik’s (2014) framework is as follows. First, if
indeed industrialization is going to be less important in determining economic growth rates going
forward, then we need to be open minded about other sources of growth. Second, treating all
activities outside of the modern sector as homogeneous does not align with the facts for Tanzania.
We have already shown that there is a great deal of heterogeneity in what Rodrik and others often
refer to as petty trade and services. Third, there is a clear demand from policymakers in developing
countries for advice on how to deal with this sector. Fourth, modifying the framework to include a
group of firms that are now treated as part of the informal economy allows us to separately estimate
both their past contribution to labor productivity growth as well as their potential to contribute to
growth in the future. And finally, the modified framework highlights for policymakers the pitfalls of
a ‘one size fits all’ approach to the informal sector.
Thus, we make the following modifications to the Rodrik (2014) framework. Instead of
using manufacturing, services and the traditional sector, we use modern, informal and agriculture.
We further divide the informal sector into high productivity informal firms (HI) and low
productivity informal firms (LI). As previously noted, we follow Lewis (1979) and call the high
productivity firms in the infomral sector (HI) the ‘in-between’ firms. The modern and informal
sectors include both services and manufacturing. We preserve the un-conditional convergence
aspect of the modern sector which Rodrik (2011) and others have shown to hold in the data for
manufacturing. For our purposes, the distinction between modern manufacturing and modern
services is not important; we combine them into the modern sector and in the data they will be
represented by the formal sector.
We also do not have a traditional sector where there is no productivity growth. Instead, we
explicitly model the agricultural sector since it has been an important source of labor productivity
growth in Tanzania over the past decade or so. Based on our empirical evidence, the relative
productivities of each of the four sectors satisfy the following condition:
𝜋𝜋𝑀𝑀 > 𝜋𝜋𝐻𝐻𝐻𝐻 > 𝜋𝜋𝐿𝐿𝐻𝐻 > 𝜋𝜋𝐴𝐴
We assume that only three sectors grow as a result of investment in fundamentals:
agriculture, the high productivity informal sector and the modern sector. We assume that there is no
productivity growth in the least productive firms in the informal sector. We are aware that labor
productivity growth in the agricultural and in-between sectors could be decomposed into the parts
that are due to technological change and the parts that are due to investments in fundamentals.
23

However, we cannot as of yet get at this distinction empirically; thereforewe do not try to model it
as it only complicates the notation.
The framework we use for analysis is thus given by the following set of equations:
(1) 𝑦𝑦�𝑀𝑀 = 𝛽𝛽(ln𝑦𝑦𝑀𝑀∗ − ln 𝑦𝑦𝑀𝑀) + 𝛾𝛾𝑀𝑀(ln𝑦𝑦∗ (Θ) − ln𝑦𝑦)
(2) 𝑦𝑦�𝐴𝐴 = 𝛾𝛾𝐴𝐴(ln𝑦𝑦∗ (Θ) − ln 𝑦𝑦)
(3) 𝑦𝑦�𝐻𝐻𝐻𝐻 = 𝛾𝛾𝐻𝐻𝐻𝐻(ln𝑦𝑦∗ (Θ) − ln𝑦𝑦)
Employment shares in the four sectors are given by:
𝛼𝛼𝑀𝑀,𝛼𝛼𝐻𝐻𝐻𝐻 ,𝛼𝛼𝐿𝐿𝐻𝐻 𝑎𝑎𝑎𝑎𝑑𝑑 (1 − 𝛼𝛼𝑀𝑀 − 𝛼𝛼𝐻𝐻𝐻𝐻 − 𝛼𝛼𝐿𝐿𝐻𝐻)
Thus, total real GDP in this economy is given by:
(5) 𝑦𝑦 = 𝛼𝛼𝑀𝑀𝑦𝑦𝑀𝑀 + 𝛼𝛼𝐻𝐻𝐻𝐻𝑦𝑦𝐻𝐻𝐻𝐻 + 𝛼𝛼𝐿𝐿𝐻𝐻𝑦𝑦𝐿𝐿𝐻𝐻 + (1 − 𝛼𝛼𝑀𝑀 − 𝛼𝛼𝐻𝐻𝐻𝐻 − 𝛼𝛼𝐿𝐿𝐻𝐻)𝑦𝑦𝐴𝐴
Totally differentiating (5) and re-arranging terms yields the following equation for labor productivity
growth:
(6) 𝑦𝑦 � = 𝛼𝛼𝑀𝑀𝜋𝜋𝑀𝑀𝛽𝛽(ln𝑦𝑦𝑀𝑀∗ − ln 𝑦𝑦𝑀𝑀) + ( 𝛼𝛼𝑀𝑀𝜋𝜋𝑀𝑀𝛾𝛾𝑀𝑀 + 𝛼𝛼𝐻𝐻𝐻𝐻𝜋𝜋𝐻𝐻𝐻𝐻𝛾𝛾𝐻𝐻𝐻𝐻 + 𝛼𝛼𝐴𝐴𝜋𝜋𝐴𝐴𝛾𝛾𝐴𝐴)(ln𝑦𝑦∗ (Θ) −
ln 𝑦𝑦) + (𝜋𝜋𝑀𝑀 − 𝜋𝜋𝐴𝐴)𝑑𝑑𝛼𝛼𝑀𝑀 + (𝜋𝜋𝐻𝐻𝐻𝐻 − 𝜋𝜋𝐴𝐴)𝑑𝑑𝛼𝛼𝐻𝐻𝐻𝐻 + (𝜋𝜋𝐿𝐿𝐻𝐻 − 𝜋𝜋𝐴𝐴)𝑑𝑑𝛼𝛼𝐿𝐿𝐻𝐻.
In this framework, there are three broad sources of productivity growth. The first is the productivity
growth that arises as a result of unconditional convergence in the modern sector – Rodrik has
shown that this applies to manufacturing but there is no reason to believe that it wouldn’t also apply
to modern services (channel (A) below). The second source of productivity growth (B) is due to
investments in fundamentals and includes all three sectors where productivity growth occurs - the
modern, HI and agricultural sectors. In our framework, we allow the speed of convergence – gamma
(γ) – to vary across sectors. The third source of productivity growth (C) is structural change. Since
the modern and informal sectors (HI and LI) have relative productivity levels higher than relative
24

productivity in agriculture, increases in employment shares in any of these three sectors increases
economy-wide labor productivity growth (i.e., 𝑑𝑑𝛼𝛼𝑖𝑖is positive for i = M, HI, LI).
(A): 𝛼𝛼𝑀𝑀𝜋𝜋𝑀𝑀𝛽𝛽(ln𝑦𝑦𝑀𝑀∗ − ln𝑦𝑦𝑀𝑀)
(B): ( 𝛼𝛼𝑀𝑀𝜋𝜋𝑀𝑀𝛾𝛾𝑀𝑀 + 𝛼𝛼𝐻𝐻𝐻𝐻𝜋𝜋𝐻𝐻𝐻𝐻𝛾𝛾𝐻𝐻𝐻𝐻 + 𝛼𝛼𝐴𝐴𝜋𝜋𝐴𝐴𝛾𝛾𝐴𝐴)(ln𝑦𝑦∗ (Θ) − ln 𝑦𝑦)
(C): (𝜋𝜋𝑀𝑀 − 𝜋𝜋𝐴𝐴)𝑑𝑑𝛼𝛼𝑀𝑀 + (𝜋𝜋𝐻𝐻𝐻𝐻 − 𝜋𝜋𝐴𝐴)𝑑𝑑𝛼𝛼𝐻𝐻𝐻𝐻 + (𝜋𝜋𝐿𝐿𝐻𝐻 − 𝜋𝜋𝐴𝐴)𝑑𝑑𝛼𝛼𝐿𝐿𝐻𝐻
One additional point deserves mention. If labor productivity in agriculture continues to grow
as in the past, without productivity growth in the low productivity informal sector, the relative
productivity of agriculture will exceed the relative productivity of the low productivity informal
sector at some point in the future (i.e. 𝜋𝜋𝐿𝐿𝐻𝐻 < 𝜋𝜋𝐴𝐴). Since the focus of this paper is the in-between
sector, we ignore this possibility in our growth simulations.
5.2 Could these firms contribute more to economy-wide growth?
To quantify the potential contribution of the in-between sector to economy-wide labor
productivity growth, we calibrate the modified framework using actual data and conduct a set of
simulations. Following the setup in equations (A) through (C), we aggregate Tanzania’s economy
into the following four sectors: agriculture (A), formal private non-agriculture (M), the productive
informal nonagricultural sector (in-between sector) (HI) and the rest of the informal sector (LI). We
consider the private sectors only in defining the Tanzanian economy and ignore the public sector.
The justification for this is that the public sector has become less important as a source of
employment growth over the past several years and because we want to focus on private sector
development. Obviously there are formal and informal activities within agriculture and this de-
composition would be quite informative. But since we do not have any data on this breakdown, we
cannot incorporate this into our model.
25

Parameters of the simulations
The groups of firms we use for the simulations are defined in Table 13. We use as our
baseline the largest group of in-between firms, those in Group 1; all of the parameters for the in-
between sector are based on this first sub-group of MSMEs. The Group 1 MSMEs account for
roughly 10% of all of the MSMEs - around a quarter of a million firms and half a million employees.
Group 1 includes roughly the same number of employees as Tanzania’s formal manufacturing and
trade services sectors combined and many more firms than the formal sector since the average firm
size of the firms in the MSME sector is only 1.48. The firms in Groups 2 and 3 are more productive
and have on average more employees. We use the information about the firms in Groups 2 and 3 to
make some predictions about the potential for employment and productivity growth in the Group 1
firms.
The parameters used in the simulations are based on the actual data in Tables 1, 6 and 13
and are reported in Table 14. In the first column of Table 14, we report beginning of period (2012)
employment shares (𝛼𝛼𝑖𝑖). In the second column of Table 14, relative labor productivities in 2012 –
𝜋𝜋𝑖𝑖 or (𝑦𝑦𝑖𝑖/𝑦𝑦) – are reported. In the third column of Table 14, we report annual changes in
employment shares across the four sectors. 𝑑𝑑𝛼𝛼𝐴𝐴, 𝑑𝑑𝛼𝛼𝑀𝑀, and changes in the employment share of the
aggregate informal economy, 𝑑𝑑𝛼𝛼𝐻𝐻𝐻𝐻 + 𝑑𝑑𝛼𝛼𝐿𝐿𝐻𝐻, are based on annualized changes between the two
rounds of census data for 2002 and 2012. We assume that 𝑑𝑑𝛼𝛼𝐻𝐻𝐻𝐻 and 𝑑𝑑𝛼𝛼𝐿𝐿𝐻𝐻 are proportional to the
employment shares of HI and LI in 2012.
Simulations and Assumptions
We consider three scenarios in the growth simulations. The first scenario (S1) is a baseline in
which the annual change in employment shares is identical to those observed for the period 2002-
2012 and are reported in the third column of Table 14. This implies that after 10 years in S1, the
employment share of agriculture 𝛼𝛼𝐴𝐴 will fall to 52.85% from its’ current level of 68.20% (i.e.,
𝛼𝛼𝐴𝐴+10 x 𝑑𝑑𝛼𝛼𝐴𝐴= 68.20 – 1.54 x 10 = 52.85 ) while 𝛼𝛼𝑀𝑀, 𝛼𝛼𝐻𝐻𝐻𝐻, and 𝛼𝛼𝐿𝐿𝐻𝐻 increase to 6.10%, 3.85%, and
37.20%, respectively, from their current levels (i.e., 𝛼𝛼𝑀𝑀+10 x 𝑑𝑑𝛼𝛼𝑀𝑀= 4.60 + 0.15 x 10 = 6.10;
𝛼𝛼𝐻𝐻𝐻𝐻+10 x 𝑑𝑑𝛼𝛼𝐻𝐻𝐻𝐻= 2.55 + 0.13 x 10 = 3.85; and 𝛼𝛼𝐿𝐿𝐻𝐻+10 x 𝑑𝑑𝛼𝛼𝐿𝐿𝐻𝐻= 24.56 + 1.26 x 10 = 37.20).
In the second and third scenarios (S2 and S3), annual changes in employment shares are the
same as in S1 except for the two informal sector employment shares, 𝑑𝑑𝛼𝛼𝐻𝐻𝐻𝐻 and 𝑑𝑑𝛼𝛼𝐿𝐿𝐻𝐻. In these two
scenarios, we allow the share of employment in the in-between sector (HI) to increase while
26

reducing the share of employment in the low productivity informal sector (LI) holding constant the
total share of employment in the informal sector.
The employment growth assumptions for the employment of HI in S2 and S3 are derived by
comparing the average firm sizes of Group 1 and Group 2. As shown in Table 13, the average
number of employees per firm in Group 2 is 2.3 times that of Group 1’s. By assuming that all firms
in Group 1 will hire – on average - an additional 1.3 paid workers over a period of 10 years, we
arrive at an annual employment growth rate of 8.8% for the firms in Group 1. This implies that by
the end of the 10 years, 𝛼𝛼𝐻𝐻𝐻𝐻 rises to 4.79% (Table 16 second panel), and 𝛼𝛼𝐿𝐿𝐻𝐻 falls to 36.2% in S2.
As shown in Table 13, average labor productivity in the Group 3 firms is about 30% higher
than it is in the Group 1 firms. Thus, we design scenario 3 (S3) to narrow the productivity gap
between these two groups of firms. If all firms in Group 1 catch up with the most productive firms
in Group 3 over a 10 year period, average annual productivity growth would have to be 2.6% for
Group 1: this is our assumption in S3.
Simulation Results
Applying the parameters displayed in Tables 14 to Equation (C) in Section 5.2 under
scenario 1 (S1), we find that 1.57% of the economy-wide productivity growth comes from the
modern sector, i.e., (𝜋𝜋𝑀𝑀 − 𝜋𝜋𝐴𝐴)𝑑𝑑𝛼𝛼𝑀𝑀 = (10.884 – 0.407) x 0.15% = 1.57%, while only 0.57% comes
from the two informal sectors combined, i.e., (𝜋𝜋𝐻𝐻𝐻𝐻 − 𝜋𝜋𝐴𝐴)𝑑𝑑𝛼𝛼𝐻𝐻𝐻𝐻 + (𝜋𝜋𝐿𝐿𝐻𝐻 − 𝜋𝜋𝐴𝐴)𝑑𝑑𝛼𝛼𝐿𝐿𝐻𝐻 = (4.70 – 0.407)
x 0.13% + (0.414 – 0.407) x 1.26% = 0.57%. In other words, about a quarter of the structural
change led economy-wide productivity growth comes from the two informal sectors (HI and LI),
the formal economy accounts for the remaining three quarters of the productivity growth. These
results are not surprising and are consistent with Rodrik’s emphasis on the ‘modern’ sector as an
engine of productivity growth. Even though the increase in the employment share in the modern
sector is relatively small (𝑑𝑑𝛼𝛼𝑀𝑀 =0.15% annually, Table 14, Column 3), its’ productivity is so much
higher than productivity in the rest of the economy that it contributes significantly to economy-wide
productivity growth.
Thus, the first important message of the simulation results is that although the increase in
the modern sector’s employment share is only about 0.15%, it accounts for almost three quarters of
the labor productivity growth associated with structural change. The second important message that
comes out of the S1 simulation is that it is important to take into account the productive
27

heterogeneity of the informal sector in order to understand its role in economy-wide productivity
growth.
A relatively small group of the informal firms (10%) account for almost the entire structural
change led growth that comes from the informal sector. This amounts to roughly 26% of economy-
wide structural change led productivity growth (Table 15, first column and last row). While the in-
between sector’s productivity is lower than that of the modern sector, it is still much higher than
labor productivity in the agricultural sector (𝜋𝜋𝐻𝐻𝐻𝐻 = 4.7 and 𝜋𝜋𝐴𝐴 =0.41).
The second scenario (S2) is designed to gauge the impact of expanding the in-between
sectors’ employment share on economy-wide productivity growth. When the change in the
employment share of the in-between sector rises from 𝑑𝑑𝛼𝛼𝐻𝐻𝐻𝐻 = 0.13% in S1 to 𝑑𝑑𝛼𝛼𝐻𝐻𝐻𝐻 = 0.22% in S2
and S3, the structural change led economy-wide productivity growth contributed by the in-between
sector rises from 0.56% a year in S1 to 0.96% a year in S2 and S3 (Table 15, third row). In other
words, the contribution of the in-between sector to structural change led growth rises from 26.1% in
the baseline (S1) to 37.9% in S2 and S3 (Table 15, last row).
There is also room for productivity gains at the firm level in the in-between sector, given the
existence of the productivity gap between the most productive firms in Group 3 and the firms in
Group 1. In scenario 3 (S3), we simulate the additional impact of productivity growth in the in-
between sector. The additional growth rate of 𝑦𝑦�𝐻𝐻𝐻𝐻 is 2.55% annually in this simulation (Table 15,
second row). This within sector productivity growth raises the contribution of productivity growth
from the in-between sector from 0.56% in S1, to 0.97% in S2 and to 1.27% in S3.
In summary, if the future looks like the past, we might expect the in-between sector to
contribute roughly one half of a percentage point to economy-wide labor productivity growth per
year. Increasing the share of employment in the in-between sector from its’ current share of 2.55%
to 3.85% has the potential to raise economy-wide productivity growth by an additional 0.40
percentage points per year. If some of the less productive firms in the in-between sector are able to
catch up with the most productive firms in the in-between sector, the in-between sector’s
contribution to annual labor productivity growth could increase by an additional 0.31 percentage
points a year. To put this in perspective, the in-between sector has the potential to contribute
roughly 1.2 percentage points to annual labor productivity growth. This is less than the modern
sector’s annual contribution of 1.57 percentage points but it is not bad.
28

6 Policy Discussion: What have we learned?
The results presented in this paper indicate that it is a mistake to lump all MSMEs together.
Some MSMEs already contribute significantly to employment and productivity growth and have the
potential to contribute significantly more. At the other end of the spectrum, the least productive
MSMEs are typically owned by people who would rather not be in business. The implication is that
blanket policies that offer assistance in the form of business training and access to credit with a view
to growing these businesses is likely to be a waste of time and money. Instead, policies targeted at
the MSMEs with potential for employment and productivity growth may have large payoffs.
This is not the way MSME policy in Tanzania is done today. On the one hand, it would be easy
to conclude that MSME policy in Tanzania is not well designed because the people at the top don’t
really care about MSMEs. For example, Tanzania’s proposed Integrated Industrial Development
Strategy for the years 2016/2017 through 2021/22 accords a ‘special’ role to MSMEs in the
industrialization of Tanzania. But it includes no details about why they are special or how they might
be included in Tanzania’s development strategy (ODI, 2015). On the other hand, Isaga, Mwagike
and Rasheli (2016) provide an up to date and excellent overview of the Tanzanian governments’
official initiatives vis a vis MSME development. They identify at least 14 government or quasi-
government institutions that deal with MSMEs in one way or another. There appears to be very little
coordination between these institutions and none of these programs have been evaluated in terms of
their impact on MSMEs. Instead, they have been evaluated in terms of outputs such as how many
training sessions they run.
Tanzania is not special in this regard. One of the most ‘successful’ programs to support MSMEs
has been the Indian government’s small scale reservation policy. It was successful in that it reached
large numbers of small entrepreneurs by reserving products in the manufacturing sector for
production only by small enterprises. But after nearly 60 years, the policy was widely perceived as a
failure and was gradually dismantled beginning in 1997. An evaluation of the impact of the de-
reservation by Harrison et al (2014) finds that the elimination of small-scale industry promotion in
India lead to higher growth in employment and wages in districts that were more exposed to the de-
reservation policy.
Instead of targeting products, the Brazilian government used credit as an instrument for the
development of small firms. Schenkman et al (2005) argue that the government of Brazil
indiscriminately subsidized credit to small firms leading to an economically inefficient outcome.
29

They develop a theoretical model which they use to show that a blanket policy of subsidized credit
to informal firms would lead to an economically inefficient outcome. They then apply their model to
Brazil and make the case that subsidized credit lead to the proliferation of inefficient firms.
On the other hand, there is some very recent evidence that targeting high potential firms
through business plan competitions can have an impact on employment and productivity growth
(McKenzie, 2015). In 2011, Nigeria’s President Goodluck Jonathan launched a national business
plan competition dubbed YouWiN!. The program cost roughly 36 million dollars, almost all of
which was contributed by the Government of Nigeria. Although the program was expensive,
McKenzie (2015) compares it to a fiscal stimulus package in the UK and shows that the YouWiN!
competition was actually more cost effective. In total, 24,000 applicants applied and 1,204 were
eventually awarded an average of around $50,000 each. Importantly, more than half of the winners
were randomly selected from a pool of successful applicants which allowed for an evaluation of the
causal impact of the program. McKenzie (2015) finds that three years after applying for the grants,
winners were more likely to survive and more likely to have businesses with 10 or more employees.
However, while the business plan competition seems to have been quite successful in Nigeria, the
World Bank has supported competitions in a number of other countries across Africa and it is very
unclear whether or not these have been equally successful.
Although quite different, Banerjee et al (2015) find that a micro-credit program in India that had
no significant ‘average’ effects, did have an impact on a specific groups of firms which they call the
‘gung-ho’ firms. They study residents of urban Hyderabad, India six years after a randomly rolled
out micro-credit intervention designed to lower the cost of credit and spur business creation among
borrowers. They find that a specific group of entrepreneurs whom they label ‘gung-ho entrepreneurs’
reaped significant business benefits from the intervention relative to ‘reluctant entrepreneurs’.
Importantly, the ‘gung-ho entrepreneurs’ had already been in business prior to accessing micro-
credit so they had some kind of a proven track record. They interpret these results as evidence that
heterogeneity in entrepreneurial ability is important and persistent; and that lenders entering a new
market may be better off by focusing on borrowers at the intensive rather than extensive margin.
In Tanzania, some interesting and very recent programs have been started by young
entrepreneurs whose goal it is to target and assist businesses with growth potential. For example,
Darecha Limited - a start-up founded by Julius James Shirima and incorporated on August 11th, 2014
– is bridging the gap between some of Tanzania’s wealthiest firms and MSMEs through micro-
30

venture capital and mentorship. For example, on January 25, 2016, Darecha partnered with
Mohammed Dewji – Forbes Africa’s Businessman of the Year 2015 – to pilot a competition for
entrepreneurs. The competition is designed to identify young (ages 18 to 30 years old) entrepreneurs
who are already in business. Winners of the competition will be supported along three dimensions:
access to finance, access to networks and mentorship by Dewji himself. Darecha also partnered with
STATOIL - Norway’s state-owned oil company - to launch the ‘Heroes of Tomorrow (HoT)’
competition in the Mtwara region of Tanzania with the aim of supportin youth entrepreneurship.
MerseyTel is following a different model but also with the aim of targeting financial assistance to
young entrepreneurs with promising business ideas. MerseyTel runs a bit like a co-op and does not
offer loans per se but offers micro-venture capital. One of the most interesting aspects of MerseyTel
is that it is Sharia compliant7. The reason this is so interesting is that around a quarter of the MSME
owners surveyed in Tanzania report that they do not believe in interest. All of these programs are
very new so it is obviously too soon to tell what kind of impact – if any – these programs will have.
The good news is that all of the program sponsors reported that they are open to randomization and
impact evaluation.8
Taken together, the most important policy implication of the evidence presented in this paper is
that if the goal is to grow MSMEs with the potential to contribute to productive employment,
policies must be targeted at the most promising firms. Some of the information we already used to
classify firms according to productive potential might be used for the purposes of targeting. For
example, it should be possible to verify whether or not a firm keeps written accounts. However,
verifying the accuracy of the accounts would be cumbersome and time consuming. And for obvious
reasons, the MSME data cannot be used to track down high potential firms. Instead, in the next
section of this paper, we investigate the possibility that there are other salient observable differences
between the MSMEs in the in-between sector and the rest of the MSMEs. We organize this
investigation into two parts: individual and business characteristics and obstacles to doing business
as reported by the business owners.
6.1 Can Individual and Business Characteristics be Targeted?
A comparison of means across high potential MSMEs (our Group 3) and the rest of the
MSMEs is presented in Table 16. Table 16 is divided into two parts: individual characteristics and
7 Interview with Mohamed H. Kassango, January 30, 2016. 8 Interviews with Dewji January 27, 2016 and Julius Shirima the founder of Darecha, February 2, 2016.
31

business characteristics. The individual characteristics include socio-economic characteristics of the
business owners such as age and gender. The business characteristics we examine include whether or
not a firm started with a business plan and whether or not a firm is registered as well as the
following sub-groups : (i) business attributes; (ii) the business owners employment and training
history; (iii) infrastructure and technology used by the business; (iv) access to financial services and;
(v)) measures of business practices.
The results in Panel A that describe individual characteristics of MSME owners reveal a
number of significant differences between the in-between firms and the rest of the MSMEs. Owners
of the Group 3 in-between firms are significantly more educated, they are much less likely to be
female, they are much less likely to be rural, and they are much less likely to come from poor
households. Only 2% of these businesses report that their main source of income is farming
compared to roughly 20% of the rest of the businesses. The owners of these businesses are also
much more likely to view their businesses as growing and they are more likely to have started their
business because they saw it as a business opportunity (as opposed to having done it out of
necessity).
The results in Panel B that describe business attributes also reveal some important
differences between the Group 3 in-between firms and the rest of the MSMEs. The in-between
firms have been in business longer (10.35 years compared to 6.32 years), they are much less likely to
be run out of the household, they are more likely to have some sort of license, they are more likely
to pay income taxes, they are more likely to pay their workers in cash, the workers in these
businesses are more likely to have received technical training, they are more likely to have increased
their workforce over the past year, they have many more customers, they are more likely to have
regional (as opposed to local) input suppliers and customers, they are more likely to be registered
with BRELA and to have a tax id number, they are more likely to get inputs on credit, and they are
more likely to have a rental agreement for their business premises. Anecdotal evidence suggests that
having regional customers is likely to be associated with exporting across borders into Kenya and
Rwanda to the north, Rwanda, Burundi and the Democratic Republic of Congo to the west and
Zambia, Malawi and Mozambique to the south. Unfortunately the information in the survey is not
detailed enough to sort out the importance of this trade. In short, the firms in the in-between sector
look more like formal firms than do the firms in the rest of the MSME sector.
32

The results in Panel C describe the labor history of business owners in the MSME sector by
firm type. While there are some statistically significant differences in labor histories – the magnitudes
of the differences are not as large as the magnitudes of the differences in the individual and business
attributes. Owners of the Group 3 in-between firms are more likely to have previously worked for a
large private enterprise and they are more likely to have been trained on a previous job. Practically
none of the firms report that they were trained in a public or private program. Instead, our
interviews with small business owners indicate that they have typically learned as paid or unpaid
apprentices.
The results in Panel D reveal significant differences in the use of technology. Almost all of
the in-between business owners own mobile phones while only half of the rest of the MSME
owners own mobile phones. Similarly, 89% of the owners of the in-between businesses use their
mobile phones to conduct business while only 42% of the remaining firms do so. The firms in the
in-between sector are also much more likely to own a calculator, own office equipment, own a
cooling facility, have security services and use electricity in their businesses.
The results in Panel E indicate that owners of the in-between MSMEs are much more likely
to participate in the formal banking sector although not necessarily through borrowing. One of the
most striking differences in financial practices is that in-between sector firms are much more likely
to save in a formal bank account (52.2% vs. 7.3%). However, although the vast majority of firms say
they are in need of a loan to invest in machinery and equipment, expand their businesses and/or
purchase stocks, most firms have not taken loans for these purposes (30.4% of the in-between firms
and 17.7% of the rest of the MSMEs). Of the firms that do borrow, roughly 50% of the in-between
firms say they borrow from formal banks while only 8% of the remaining firms report borrowing
from formal banks. Only 15% of the in-between firms report borrowing from friends and family; by
contrast 48.2% of the remaining firms report borrowing from friends and family. Around 20% of
both types of firms report borrowing from micro-finance institutions.
Finally, the results in Panel E of Table 16 are meant to capture other financial practices.
Between 19 and 26% of the business owners report that they do not believe in interest. Given that
Tanzania is roughly 50% Muslim, this is not that surprising. Firms in the in-between sector are
significantly more likely to use profits to expand their businesses and/or invest in buildings in land.
33

6.2 Obstacles to Doing Business
In Table 17, we present the results of tabulating answers to questions about what firms say
they view as obstacles to doing business (Panel A) and the type of assistance they would like to see
provided by the government (Panel B). The questionnaire itself lists 21 possible obstacles to doing
business. If less than 1 percent of the firms reported one of the items as a significant obstacle to
doing business, we do not report it. Apart from access to working capital, there are no significant
differences between the in-between firms and the rest of the firms in terms of obstacles to doing
business. And even in the case of insufficient working capital, the percentages of business owners
who report that insufficient working capital is an obstacle is relatively low compared to the share of
firms that report that they could use a business loan. This is because when firms are asked what they
would use the loans for – they almost never say they need it for working capital. Instead, they report
that they would use loans to invest in buildings and machinery and business expansion.
In Panel B of Table 17, we report means and differences in means for areas in which firms
would like to see government intervention. Access to finance and investment in infrastructure are at
the top of the list. The in-between firms also report that they would like to see more business
services provided by the government such as information and consulting. But without further
information, it is difficult to know what this means. Notably, very few firms of either type report
that they would like to see the government provide more training. This does not appear to be
because firms are already getting training from the government since in a separate section of the
survey almost no firms report that they received training from the government. But it is consistent
with what we heard from small business owners about receiving training on the job in both large and
small firms.
An especially interesting example of this type of training was reported to us by Godwin H.
Makayo the CEO of MAKTECH9. Mr. Makayo was selected for one year of technical training by
NORAD which he did at partly at the private company Vodacom and partly at the University of Dar
es Salaam. Mr. Makayo started working for Vodacom in Tanzania in 1998. In 2000, he left Vodacom
and set up his own firm contracting out his services to Vodacom. When the company started, it was
not registered and it had only 3 employees – Mr. Makayo and two relatively uneducated technicians
whom he was able to train to do installation of Vodacom equipment. As his company grew, he
realized that he had strong technical skills but not the kind of skills he would need to manage a
9 Interview with Godwin H. Makyao, Dar es Salaam, January 25, 2016.
34

growing business. He enrolled in an online business course at the University of Liverpool and
received his Master’s Degree in Business Administration in 2007. Between 2001 and 2011, his
company grew to 150 employees. Today, MAKTECH is a leading service and solution provider in
the telecom infrastructure contracting industry.
We heard a similar story about training on the job from a small shop owner in Kariakoo
Market – the heart of Dar es Salaam’s small business activity. Mr. Eliya Gomezulu told us that he
learned everything he knows about metalworking from watching an Indian metalworker who used to
be in the business but who has since moved back to India10. Now, Mr. Gomezulu runs a small shop
in Gherazani – the metal-working district of Kariakoo Market - that makes steel products from scrap
metal including ovens and machines for grinding coconut shells. Although Mr. Gomezulu does not
have any employees per se, he has the tools needed to do metalworking and he ‘rents’ out his space
and tools to other metalworkers and in return he gets 10% of their profits.
7. Conclusion
Using Tanzania’s first nationally representative survey of micro, small and medium sized
enterprises we have shown that there is an enormous amount of heterogeneity among these MSMEs.
The owners of the most productive of these enterprises share the following characteristics: (i) they
wouldn’t leave their business for a full time salaried position; (ii) they keep written accounts; (iii) they
hire paid employees and;(iv) a relatively small group of these firms – 10% - already contribute
roughly half a percentage point to annual labor productivity growth in Tanzania. This group of firms
operates primarily in the manufacturing and trade services sectors and employs roughly the same
number of employees as Tanzania’s formal manufacturing and trade services firms. This group of
firms has the potential to contribute 1.3 percentage points to annual labor productivity growth; to
put this in perspective the formal modern sector contributed 1.58 percentage points to annual labor
productivity growth over the past decade.
To achieve this result, Tanzania needs an MSME policy that is targeted at the most productive
MSMEs. Although targeting is difficult, we have outlined some important differences between the
most productive MSMEs and the least productive MSMEs. In particular, the owners of the most
productive MSMEs are better educated and they are significantly more likely to save in a formal
banking account. Thus, one way of reaching these MSMEs is likely to be through the formal
35

banking sector. This does not mean that the rest of the MSMEs serve no purpose. To the contrary,
they provide sorely needed extra income to some of Tanzania’s poorest families. But we should not
expect these MSMEs to be a source of labor productivity growth or within firm employment growth.
We have also described some innovative programs in Tanzania designed to target the more
productive MSMEs. These programs are operating exclusively in the private sector and are in their
infancy. If some of these programs are successful, scaling them up may require public private
partnerships. Scaling up will require targeting. Targeting the MSMEs with the potential for
productivity and employment growth will require careful design of a product(s) that is attractive to
the MSMEs with potential but that is too costly for the MSMEs without the potential for
employment and productivity growth.
36

Tables and Figures
Table 1: Tanzania’s economy-wide labor productivity growth decomposition (2002-2012)
Value-added per worker
(constant 2005 TZS in
billion)
Labor
productivity
growth in
2002-12 (%)
Sector GDP
share
Sector Labor
share
Labor productivity growth
decomposition (2002-12
total, %)
2002 2012
2002 2012 2002 2012 Within Between Total
Agriculture 351 509 44.8 34.2 27.0 81.7 65.8 15.5 -9.7 5.7
Mining 4,057 1,581 -61.0 2.4 3.3 0.5 2.6 -1.5 4.0 2.5
Manufacturing 3,575 3,706 3.7 8.2 9.6 1.8 3.2 0.3 6.2 6.5
Utilities 6,467 1,792 -72.3 2.3 1.9 0.3 1.3 -1.7 2.2 0.5
Construction 5,560 5,119 -7.9 7.3 9.9 1.0 2.4 -0.5 8.6 8.1
Trade services 1,607 1,760 9.5 14.9 16.0 7.5 11.3 1.4 8.0 9.4
Transport services 5,968 5,442 -8.8 6.5 7.5 0.8 1.7 -0.5 5.9 5.4
Business services 35,298 20,860 -40.9 12.1 13.5 0.2 0.8 -3.5 15.0 11.6
Gov’t services 3,178 3,762 18.4 11.2 10.7 4.1 3.5 2.9 -2.6 0.3
Personal services 213 114 -46.4 0.8 0.7 2.1 7.4 -0.2 0.7 0.5
Total private economy 761 1,148 50.1 88.8 89.3 95.9 96.5 9.2 41.0 50.1
Total 832 1,240 50.4 100 100 100 100 12.1 38.3 50.4
Contribution to total economy's labor productivity growth (total economy’s labor productivity growth in 2002-12 = 100)
Agriculture 30.7 -19.3 11.4
Mining
-3.0 7.9 5.0
Manufacturing 0.6 12.4 12.9
Utilities
-3.3 4.3 0.9
Construction
-1.1 17.1 16.0
Trade services 2.7 15.9 18.7
Transport services
-1.0 11.7 10.7
Business services -6.9 29.8 22.9
Gov’t services
5.7 -5.2 0.5
Personal services
-0.5 1.4 0.9
Total 23.9 76.1 100.0
Source: Authors’ calculation based on the national account data from Tanzanian government documents and Census of
2002 and 2012.
37

Table 2. Contribution to new employment by sector, nonagricultural formal and informal 2002-2012 Total Formal
Informal
Number of
Share in
Total Number of
Share in
Total Number of Share in Total
Increase Increase Increase Increase Increase Increase
Mining
404,212 11.4 9,021 0.3 395,192 11.1
Manufacturing 313,882 8.8 103,049 2.9 210,833 5.9
Utilities
194,960 5.5 194,960 5.5
- 0.0
Construction
281,864 7.9 521 0.0 281,343 7.9
Trade services 966,807 27.2 1,304 0.0 965,503 27.2
Transport services 182,383 5.1 18,497 0.5 163,886 4.6
Business services 105,871 3.0 56,924 1.6 48,947 1.4
Personal services 881,053 24.8 0 0.0 881,053 24.8
Public sector
224,579 6.3 224,579 6.3
0.0
Total private non-agriculture 3,331,032 93.7 384,275 10.8 2,946,757 82.9
Total non-agriculture 3,555,611 100.0 608,855 17.1 2,946,757 82.9
Source: Authors calculation based on data from Tanzanian government documents of the Formal Employment and
Earnings Survey and the Censuses of 2002 and 2012.
38

Table 3. MSME Summary Statistics
Names of variables Observations Value unit or range Mean
S.D. Min Max
Number of employees per firm 5653 Person 1.480 1.652 1 80
Number of full-time employees per firm 5653 Person 1.286 0.958 0 31
% of firms registered with Brella 5653 [0,1] 0.030 0.171 0 1
% of firms with tax ID 5653 [0,1] 0.053 0.224 0 1
% of firms with business run out of home 5653 [0,1] 0.515 0.500 0 1
% of firms in the rural area 5653
0.741 0.438 0 1
Average monthly value added per firm 5653 TZS 328,018 367,939 500 2,538,000
Average monthly sales per firm 5653 TZS 461,138 434,142 3,000 2,600,000
Firm's age 5595 Year 6.333 6.022 1 35
% of firms with business as full-time 5653 0.799 0.401 0 1
% firms with business as main source of income 5653 [0,1] 0.402 0.490 0 1
% firms with farming as main source of income 5653 [0,1] 0.193 0.394 0 1
% firms with business as only source of income 5653 [0,1] 0.333 0.471 0 1
Age of owner 5653 Year 36.925 10.646 16 91
Whether owner is female 5653 [0,1] 0.521 0.500 0 1
% of firms households that are not poor 5653 [0,1] 0.449 0.497 0 1
% of firms households that are moderately poor 5653 [0,1] 0.352 0.478 0 1
% of firms households that are very poor 5653 [0,1] 0.199 0.399 0 1 Notes: Brella is Tanzania's Business Registration and Licensing Agency opened in 1999. Measures of poverty were computed at the household level and using Tanzania's LSMS. TZS denote Tanzanian Shillings. Source: Authors calculations using the MSME Survey 2010.
39

Table 4. Sectoral distribution of MSME firms
Number of sample % in total
Extraction 21 0.4
Manufacturing 928 16.6
Grain milling 95 1.7
Beverage 466 8.3
Textile 189 3.4
Wood 30 0.5
Building materials 59 1.1
Furniture 89 1.6
Trade services 4,479 79.9
Wholesale 145 2.6
Retail with shops 865 15.4
Retail with stalls 1,376 24.5
Retail on street 402 7.2
Beverage services 441 7.9
Food services 1,250 22.3
Transport 17 0.3
Business services 31 0.6
Repair and personal services 130 2.3
Total 5,606 Source: Authors’ calculation using MSME survey 2010
40

Table 5: Regional distribution of MSME firms
Region Population
Share Total
Employment % Urban
Employment % Rural
Employment % Dodoma 5.44 3.85 39.55 60.45 Arusha 3.21 2.74 56.68 43.32 Kilimanjaro 2.95 2.75 45.26 54.74 Tanga 3.85 5.07 50.45 49.55 Morogoro 6.01 6.44 53.17 46.83 Pwani 2.66 3.1 38.12 61.88 Dar-es-Salaam 14.64 17.32 100 0 Lindi 2.24 2.61 41.32 58.68 Mtwara 3.04 2.44 42.52 57.48 Ruvuma 3.11 3.83 43.33 56.67 Iringa 5.9 4.59 37.16 62.84 Mbeya 10.88 8.02 40.52 59.48 Singida 1.93 2.34 37.18 62.82 Tabora 2.67 2.08 55.26 44.74 Rukwa 2.42 2.41 35.54 64.46 Kigoma 2.04 1.73 9.56 90.44 Shinyanga 7.16 6.81 36.36 63.64 Kagera 2.9 2.83 15.67 84.33 Mwanza 8.9 10.7 36.86 63.14 Mara 3.27 4.6 48.32 51.68 Manyara 1.65 1.58 37.99 62.01 Kaskazini Unguja 0.34 0.19 0 100 Kusini Unguja 0.26 0.14 0 100 Mjini Magharibi 1.54 1.11 79.99 20.01 Kaskazini Pemba 0.48 0.38 12.19 87.81 Kusini Pemba 0.51 0.35 27.87 72.13 Total 100 51.29 48.71
41

Table 6: MSME contribution to national employment (1,000 person)
National economy
Formal economy Census - MSMEs
(Census 2012)
(FEES 2012) FEES (MSME
2010) Manufacturing
585 260 325 648
Trade services
2,067 240 1,827 3,104 Wholesale and Retail Trade
1,738 119 1,619 1,893
Wholesale
110
90 Service Workers Shop and Stall Sales Workers 1,061
1,586
Street Vendors and Related Workers 567
217 Hotel, restaurants and food services 329 119 210 1,173
Transport
311 62 249 Transport and Storage
238 43 195
Information and Communication
73 19 54 Construction
439 45 394
Other private services
1,349
1,349 178 Other private non-agriculture
861 205 655 20
Total private non-agriculture 5,612 812 4,800 3,912 Note: We applied individual weights in the calculation, which is different from the weights applied in the National Baseline Survey Report for MSME (FSDT 2012). Because of this, and also because some firms did not have ISIC code in the data and hence are not included in our calculation, the total MSME employment number of 4 million in this table is lower than that in FSDT (2012) in which is around 5 million. Sources: Authors calculation using Census 2012 report (NBS 2014), FEES report (NBS 2013), and MSME survey data.
42

Table 7: MSME contribution to national and sectoral GDP (in current billion TZS)
National economy Formal economy MSME
(National account, 2010)
(ASIP 2008)
(ASIP 2009) (MSME 2010)
Total Manufacturing 3,022
538 Beverage
183 499 164
Food processing
26 494 65 Textile
842 117 166
Wood products excluding furniture
1,108 5 18 Furniture
207 21 53
Building related materials
12 252 71 Trade services 5,163
5,141
Wholesale and Retail Trade 4,442
3,941
Wholesale
394
Retail with shops
3,151
Street vendors
396
Hotel and Restaurants 721
1,200
Transport 3,689
- Transport and Storage 2,537
-
Information and Communication 1,152 Construction 3,146 Other private services 5,042
196
Other private non-agriculture 3,175
10
Total private non-agriculture 23,237
5,884
Total economy 43,571 Note: Value-added calculation is extremely difficult for MSME survey given that many small firms did not keep an account. The methodology for such calculation is documented in Appendix. Sources: Authors calculation using National account after rebasing (NSB 2015), ASIP (NSB 2013), and MSME survey data
43

Table 8: Occupation prior to starting business of MSMEs (%) What was your main occupation before you started this business (%)? All Firms %
Unemployed 7.56
Housewife (home maker) 19.99
In education, at various levels 4.24
Employed in large private enterprise in similar business 1.19
Employed in large private enterprise in a different business 3.37
Employed in a similar sized private business in the same line of business 1.04
Employed in a similar sized private business in another line of business 1.04
Ran a similar sized business in the same line of business 1.39
Ran a similar sized enterprise in another line of business 13.2
Civil servant/employed by the government 2.51
I was employed by some individual 1.31
Rearing of cattle 0.4
Farming 36.73 I was selling food 0.91 Others 4.02
None 1.11
44

Table 9: Reasons for business choice by broad sector in MSME survey (%)
Manufacturing Other Services Trade Services
I had previous experience in this line 28.96 20.54 14.44
Friends/relatives are in this line 20.14 12.84 15.85
I saw a market opportunity 43.3 43.82 47.88
My capital could only finance this business 34.74 44.37 44.75
No apparent reason 3.22 4.38 4.85
I could start business gradually 0 0.49 0.24
Goods are easy to manufacture and sell 1.04 2.08 1.66
I just wanted to be near my house 0.56 0.71 1.12
I have been trained in it, I am an expert 3.14 0.5 0.29
Goods are available 0.22 0.4 0.76
I perceived it to be profitable 0.95 1.42 1.74
I liked it 1.39 1.57 1.2
Business does not have many problems 0.98 0.47 0.67
None 0.75 1.07 0.94
45

Table 10: Job satisfaction in MSME survey
All Firms
In-between Firms
Non In-Between
Firms If you were offered a full-time salary paying job, would you take it?
46.57 39.33 47.83
Who would you rather work for?
A large private company 23.99 31.18 22.96
Government 63.92 63.41 63.99
Someone else's business 9.13 4.26 9.82
Anywhere 2.97 1.15 3.23
And why do you say that?
Better security of income 82.32 82.81 82.24
Shorter hours 5.07 8.35 4.60
Less risk 1.94 1.80 1.96
To get pension 1.36 2.21 1.24
I am less educated 1.78 0.94 1.89
They listen to the opinions of the employees 0.95 0.63 1.00
As long as I get a living 0.46 0.15 0.51
Job security 1.37 0.14 1.54
Others 3.12 2.65 3.18
None/Nothing 1.63 0.32 1.82
46

Table 11: Description of Employment Growth
Mean S.D. Share of Firms
No Employment Growth 0 0 87.76
Employment Growth 0.13 0.08 12.24
Overall 0.02 0.05 100
47

Table 12: Employment Growth, Firm Size and Firm Age, MSME survey Panel A: Size Measured as a Continuous Variable
Panel B: Size Measured as Categorical Variables
VARIABLES (1) (2) (3) (4) (5) (6) (7) (8)
Ln Size -0.03*** -0.03*** -0.03*** -0.04*** -0.04*** -0.08*** -0.08*** -0.10***(0.00) (0.00) (0.00) (0.00) (0.00) (0.01) (0.01) (0.02)
Ln Age -0.01*** -0.03*** -0.03*** -0.03*** -0.01*** -0.03*** -0.04***(0.00) (0.01) (0.01) (0.00) (0.00) (0.00) (0.01)
Ln Age Squared 0.01*** 0.01*** 0.01*** 0.01*** 0.01***(0.00) (0.00) (0.00) (0.00) (0.00)
Ln Size * Ln Age 0.03*** 0.03*** 0.07***(0.01) (0.01) (0.02)
Ln Size * Ln Age Squared -0.01***(0.00)
Constant 0.02*** 0.03*** 0.04*** 0.05** 0.03* 0.03 0.04* 0.04**(0.00) (0.00) (0.00) (0.02) (0.02) (0.02) (0.02) (0.02)
Observations 5,537 5,537 5,537 5,537 5,537 5,537 5,537 5,537R-squared 0.04 0.06 0.06 0.08 0.09 0.11 0.12 0.12Industry FE NO NO NO YES YES YES YES YESRegion FE NO NO NO NO YES YES YES YESRobust standard errors in parentheses*** p<0.01, ** p<0.05, * p<0.1
VARIABLES (1) (2) (3) (4) (5) (6) (7) (8)
Size2 -0.03*** -0.03*** -0.03*** -0.03*** -0.03*** -0.06*** -0.06*** -0.07***(0.00) (0.00) (0.00) (0.00) (0.00) (0.01) (0.01) (0.01)
Size3 -0.03*** -0.03*** -0.03*** -0.04*** -0.04*** -0.09*** -0.09*** -0.11***(0.01) (0.01) (0.01) (0.01) (0.01) (0.01) (0.01) (0.02)
Size4 -0.01 -0.01 -0.01 -0.01 -0.01 -0.08*** -0.08*** -0.10***(0.01) (0.01) (0.01) (0.01) (0.01) (0.02) (0.02) (0.03)
Size5+ -0.08*** -0.08*** -0.08*** -0.08*** -0.09*** -0.18*** -0.18*** -0.20***(0.02) (0.02) (0.02) (0.02) (0.02) (0.03) (0.03) (0.04)
Ln Firm Age -0.01*** -0.03*** -0.03*** -0.03*** -0.01*** -0.03*** -0.04***(0.00) (0.00) (0.01) (0.00) (0.00) (0.00) (0.01)
Ln Firm Age Squared 0.01*** 0.01*** 0.01*** 0.01*** 0.01***(0.00) (0.00) (0.00) (0.00) (0.00)
Ln Age * Ln Size 0.03*** 0.03*** 0.06***(0.01) (0.01) (0.02)
Ln Age Squared*Ln Size -0.01***(0.00)
Constant 0.02*** 0.03*** 0.04*** 0.05** 0.03* 0.03 0.04* 0.04**(0.00) (0.00) (0.00) (0.02) (0.02) (0.02) (0.02) (0.02)
Observations 5,551 5,551 5,551 5,551 5,551 5,537 5,537 5,537R-squared 0.04 0.06 0.07 0.08 0.09 0.11 0.12 0.12Industry FE NO NO NO YES YES YES YES YESRegion FE NO NO NO NO YES YES YES YESRobust standard errors in parentheses*** p<0.01, ** p<0.05, * p<0.1
48

Table 13: Definitions of Groups of In-between Firms
# of firms # of
employees VA per
worker ($US)
# of employees
per firm
Group 1
Want to be in business, keeps accounts & labor productivity > economy-wide trade services labor productivity
261,375
449,783
6,463
1.72
Group 2 Conditions of Group 1 + with paid employees
46,081
183,686
5,890
3.99
Group 3
Conditions of Group 2 but labor productivity > economy-wide manufacturing labor productivity
26,207
106,415
8,311
4.06
Share of MSME total (percentages) Ratio to MSME average
Firms
Employees Value Added Lprody Firm size
Group 1
Want to be in business, keeps accounts & labor productivity > economy-wide trade services labor productivity
10.38
11.34
37.4
3.30
1.09
Group 2 Conditions of Group 1 + with paid employees
1.83
4.63
13.9
3.01
2.53
Group 3
Conditions of Group 2 but labor productivity > economy-wide manufacturing labor productivity
1.04
2.68
11.4
4.24
2.58
Source: Authors calculation using MSME data
49

Table 14: Parameters used in simulations based on 2010-2012 data
Share of employment
(𝛼𝛼𝑖𝑖)
Relative labor productivity
(𝜋𝜋𝑖𝑖)
Annual change in share of
employment (𝑑𝑑𝛼𝛼𝑖𝑖)
Agriculture (A) 68.2 0.41 -1.54 Private formal non-agriculture (M) 4.6 10.88 0.15 In-between non-agriculture (HI) 2.5 4.70 0.13 Other informal non-agriculture (LI) 24.6 0.42 1.26 Source: Authors calibration based on National Accounts, Census and MSME data
50

Table 15: Simulation results of in-between sector’s role in economy-wide productivity growth
S1 S2 S3 Assumptions
𝑑𝑑𝛼𝛼𝐻𝐻𝐻𝐻 0.130 0.224 0.224 𝑦𝑦�𝐻𝐻𝐻𝐻
2.55
Simulation results Economy-wide productivity growth rate (annual %)
Structural change led growth 0.56 0.96 0.96 Within sector growth
0.31
Total 0.56 0.96 1.27 Contribution (Total structural change led economy-wide growth = 100) 26.1 37.9 37.9 Notes: Definitions of the three simulations: S1: 𝑑𝑑𝛼𝛼𝐻𝐻𝐻𝐻 is proportional to the change in the informal economy’s employment share between 2002 and 2012 S2: 𝑑𝑑𝛼𝛼𝐻𝐻𝐻𝐻 increases from S1 S3: 𝑑𝑑𝛼𝛼𝐻𝐻𝐻𝐻 and 𝑦𝑦�𝐻𝐻𝐻𝐻 increase from S1 Source: Authors’ simulations based on the modified analytical framework in Rodrik (2014)
51

Table 16: How Do High Performing Firms Compare to the Rest: Individual & Business Characteristics
Mean (Not In-Between Firms)
Mean (In-Between Firms)
Difference in Means t-test
Individual Characteristics Education (Above Primary Level) 0.194 0.478 -4.844 Marital Status 0.904 0.935 -0.700 Owner's Age 36.932 38.850 -1.218 Female 0.521 0.304 2.935 Rural 0.745 0.413 5.136 Owner is Not Poor 0.446 0.717 -3.682 Owner is Moderately Poor 0.354 0.196 2.234 Owner has started Other Businesses 1.121 1.261 -2.245 Main Source of Income is the Business 0.402 0.480 -1.056 Main Source of Income is Farming 0.195 0.022 2.960 Owner is Member of Business Savings Club 0.089 0.130 -0.987 Owner is Member of a Business Association 0.053 0.152 -2.959 Owner has taken Expert Advice 0.170 0.152 -6.943 Saw Business as a Market Opportunity 0.478 0.674 -2.645 Views Business as Growing 0.573 0.870 -4.055 Business Characteristics Firm Age 6.323 10.350 -4.529 Business runs Full Time 0.798 0.891 -1.570 Business is run out of the Household 0.517 0.174 4.642 Firm has Market Access 0.589 0.761 -2.365 Business near Similar Businesses 0.721 0.761 -0.595 Firm keeps Written Accounts 0.417 1 -8.026 Firm maintains Business Budget 0.078 0.174 -2.400 Firm started with a Business Plan 0.007 0.130 -9.417 Firm has some License 0.164 0.652 -8.868 Firm pays Income Tax 0.044 0.435 -12.642 Firm Advertises 0.017 0.261 -12.758 Firm pays Workers in Cash 0.098 0.935 -19.074 Workers received Technical Training 0.161 0.587 -7.800 Workforce Increased for the Business in the Past Year
0.074 0.130 -1.462
Firm Has Regional customers 0.174 0.326 -2.690 Number of Daily Customers is More than 20 0.288 0.391 -1.540 Firm's Suppliers are Individuals 0.461 0.326 1.832 Firm's Suppliers are Small Traders 0.507 0.304 2.736 Firm's Suppliers are Nationwide 0.041 0.391 -11.722 Business Registered with Brela 0.028 0.240 -8.505 Business Has a Tax ID 0.049 0.478 -13.102 Business Gets Inputs on Credit 0.101 0.130 -0.654 Business has Rental Agreement for B.Premises 0.081 0.413 -8.164
52

Table 16: Individual & Business Characteristics (continued)
Labor History Previously Unemployed 0.068 0.196 -3.424 Previously a Home Maker 0.173 0.152 0.368 Previously worked in the Education Sector 0.040 0.022 0.623 Previously Employed in Large Private Enterprise 0.030 0.087 -2.198 Previously Employed in Similar Sized Private Enterprise
0.178 0.000 0.913
Previously Ran a Similar Sized Enterprise 0.108 0.087 0.463 Previously a Civil Servant 0.030 0.087 -2.600 Previously engaged in Farming/Rearing of Livestock
0.476 0.130 4.681
Owner was Trained on Previous Job 0.042 0.109 -2.250 Owner was Trained in a Course 0.018 0.043 -1.260 Infrastructure and Technology Firm Owner has a Mobile Phone 0.509 0.913 -5.477 Owner uses Mobile to Conduct Business 0.419 0.891 -6.486 Firm Owner has a Calculator 0.154 0.522 -6.833 Business has Office Equipment 0.168 0.304 -2.460 Business Owns a Cooling Facility 0.040 0.196 -5.358 Firm has Received Legal Services 0.006 0.043 -3.105 Firm has Received Technical Services 0.030 0.152 -4.830 Firm Has Security Services 0.142 0.370 -4.392 Business uses Electricity to Light Business 0.160 0.652 -9.140 Access to Financial Services Loan from Government 0.014 0.000 0.336 Owner has Borrowed for Business 0.176 0.304 -2.260 Firm has Received Financial Services 0.048 0.304 -7.981 Owner has Formal Bank Account 0.065 0.543 -12.999 Owner uses Debit Card for Business 0.510 0.500 -13.546 Owner Saves Money in a Bank Account 0.073 0.522 -11.542 Owner saves in Secret Hiding Place 0.694 0.349 4.884 Owner uses a Sacco 0.016 0.022 -0.320 Owner regularly Sends & Receives Money for Business
0.152 0.413 -4.896
Measures of Ability/Financial Literacy Owner does not Believe in Interest 0.196 0.261 -1.094 Owner uses Profits to Expand Business 0.183 0.348 -2.873 Owner uses Profits to Buy Stocks in Advance 0.436 0.500 -0.868 Owner uses Profits to Invest in Business 0.183 0.348 -2.873 Owner uses Profits to Invest in Buildings and land 0.054 0.174 -3.518 Source: Authors calculations based on the 2010 MSME survey. Firms in the ‘in-between’ category satisfy the following conditions: (i) owner wouldn’t leave the firm for a full time salaried job; (ii) keeps written accounts; (iii) has paid employees and; (iv) labor productivity is higher than economy-wide labor productivity in manufacturing.
53
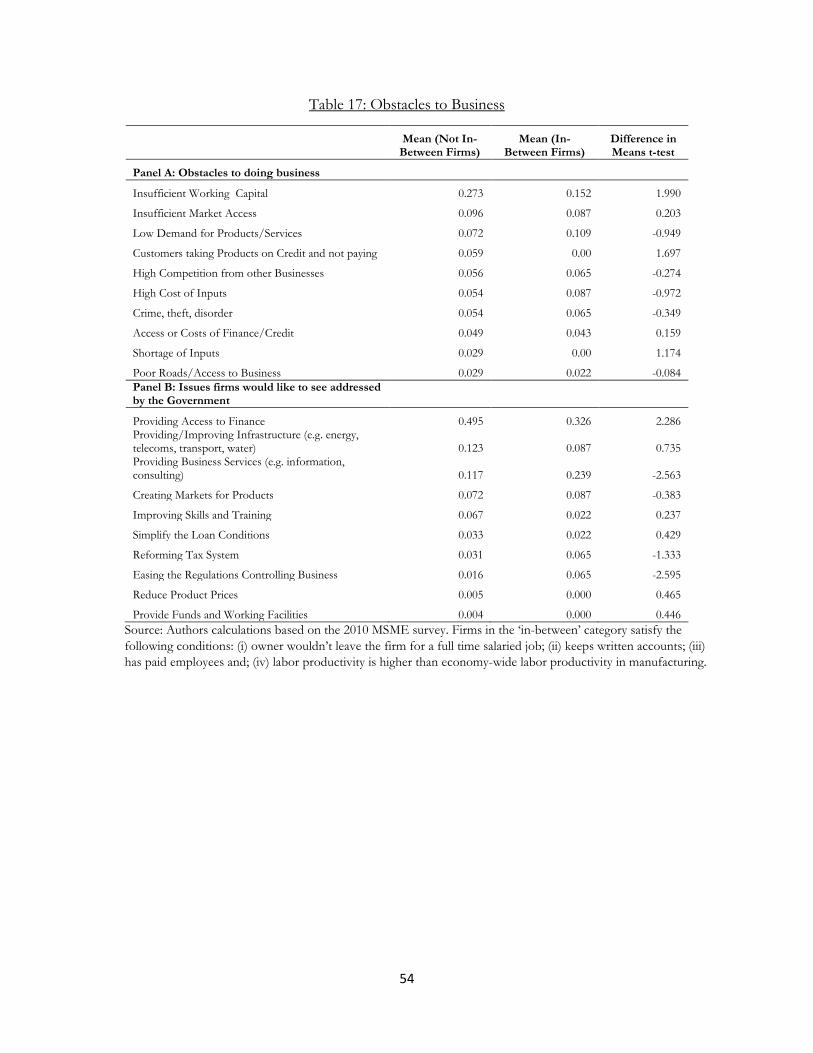
Table 17: Obstacles to Business
Mean (Not In-
Between Firms) Mean (In-
Between Firms) Difference in Means t-test
Panel A: Obstacles to doing business
Insufficient Working Capital 0.273 0.152 1.990
Insufficient Market Access 0.096 0.087 0.203
Low Demand for Products/Services 0.072 0.109 -0.949
Customers taking Products on Credit and not paying 0.059 0.00 1.697
High Competition from other Businesses 0.056 0.065 -0.274
High Cost of Inputs 0.054 0.087 -0.972
Crime, theft, disorder 0.054 0.065 -0.349
Access or Costs of Finance/Credit 0.049 0.043 0.159
Shortage of Inputs 0.029 0.00 1.174
Poor Roads/Access to Business 0.029 0.022 -0.084 Panel B: Issues firms would like to see addressed by the Government
Providing Access to Finance 0.495 0.326 2.286 Providing/Improving Infrastructure (e.g. energy, telecoms, transport, water) 0.123 0.087 0.735 Providing Business Services (e.g. information, consulting) 0.117 0.239 -2.563
Creating Markets for Products 0.072 0.087 -0.383
Improving Skills and Training 0.067 0.022 0.237
Simplify the Loan Conditions 0.033 0.022 0.429
Reforming Tax System 0.031 0.065 -1.333
Easing the Regulations Controlling Business 0.016 0.065 -2.595
Reduce Product Prices 0.005 0.000 0.465
Provide Funds and Working Facilities 0.004 0.000 0.446 Source: Authors calculations based on the 2010 MSME survey. Firms in the ‘in-between’ category satisfy the following conditions: (i) owner wouldn’t leave the firm for a full time salaried job; (ii) keeps written accounts; (iii) has paid employees and; (iv) labor productivity is higher than economy-wide labor productivity in manufacturing.
54

Figure 1: GDP and sectoral GDP annual growth rate in 1988-1999 and 2000-2014 (%)
Source: Authors’ calculation using the national account data (2015). The sector-wise GDP annual growth
uses the period of 1990-1999 due to data limitation.
3.2
4.4
2.6
8.5
2.4
8.0
2.4
7.1
3.0
6.7
-
1.0
2.0
3.0
4.0
5.0
6.0
7.0
8.0
9.0
1988-1999 2000-2014
Agriculture IndustryManufacturing ServicesTotal GDP
55

Figure 2: Comparison of the Distribution of Annual Value Added Per Worker between Formal and
Informal Firms in the MSME survey
Note: BRELA is Tanzania’s Business Registration and Licensing Agency. Only 3.7% of MSMEs are registered with
BRELA. When we take the log of value added per worker, firms with negative value added per worker are dropped.
Firms with negative value added represent 5% of the sample. We tried a variety of alternative representations of the data
and taking the log of annual value added made the graphs easiest to read. Visually, including firms with negative value
added would shift the densities to the left slightly. For this reason, we don’t use these densities to estimate the actual
share of the distribution that falls between any two values. This type of calculation is done using the actual data.
0.0
5.1
.15
.2.2
5De
nsity
-10 -5 0 5lnVAworker
BRELA== 1BRELA == 0
kernel = epanechnikov, bandwidth = 0.8500
Kernel density estimate
0.0
5.1
.15
.2.2
5D
ensit
y
-10 -5 0 5lnVAworker
Tax ID== 1Tax ID == 0
kernel = epanechnikov, bandwidth = 0.8500
Kernel density estimate
56

Figure 3: Comparison of the Distribution of Annual Value Added Per Worker to Economy-wide Productivity
Notes: Vertical lines are the log of average economy-wide productivity in agriculture (green), trade services (blue) and
manufacturing (purple). Annual average value added per worker in 2010 in agriculture is 1.08 million TZSH, in trade
services 2.49 million TZSH and in manufacturing 5.16 million TZSH. At a nominal exchange rate of .TZSH 1,428.57 to
1 USD, these numbers work out to 756 USD, 1,743 USD and 3,612 USD respectively. When we take the log of value
added per worker, firms with negative value added per worker are dropped. Firms with negative value added represent 5%
of the sample. We tried a variety of alternative representations of the data and taking the log of annual value added made
the graphs easiest to read. Visually, including firms with negative value added would shift the densities to the left slightly.
For this reason, we don’t use these densities to estimate the actual share of the distribution that falls between any two
values. This type of calculation is done using the actual data.
0.0
5.1
.15
.2.2
5D
ensi
ty
-10 -5 0 5lnVAworker
kernel = epanechnikov, bandwidth = 0.4500
Kernel density estimate
57

References
African Development Bank (2013, March 23). "Recognizing Africa's Informal Sector." Retrieved November 30, 2015, from http://www.afdb.org/en/blogs/afdb-championing-inclusive-growth-across-africa/post/recognizing-africas-informal-sector-11645/
Banerjee, Abhijit, Abhijit Vinayak Banerjee, and Esther Duflo. Poor economics: A radical rethinking of the way to fight global poverty. PublicAffairs, 2011.
Banerjee, Abhijit V., and Esther Duflo. "The economic lives of the poor." The journal of economic perspectives: a journal of the American Economic Association 21.1 (2007): 141.
Banerjee, Abhijit V., Emily Breza, Esther Duflo and Cynthia Kinnan. “Do credit constraints limit entrepreneurship? Heterogeneity in the returns to microfinance.” Working Paper. July 2015. Retrieved from
Bartelsman, Eric, John Halitwanger and Stefano Scarpetta. “Cross-Country Differences in
Productivity: The Role of Allocation and Selection” American Economic Review 2013, 103(1): 305-334
Dewji, Mohammed, CEO MeTL Group Tanzania and Chairman Mo Dewji Foundation. Personal
interview, January 27th 2016.
De Mel, Suresh, David McKenzie, and Christopher Woodruff. 2008. “Returns to Capital in
Microenterprises: Evidence from a Field Experiment.” The Quarterly Journal of Economics. 123(4): 1329-1372.
De Paula, Aureo and Jose Scheinkman. 2011. “The Informal Sector: An Equilibrium Model and Some Empirical Evidence from Brazil” Review of Income and Wealth, 57(s1), s8-s26.
Dodlova, M., K. Göbel, M. Grimm, J. Lay. 2015. Constrained firms, not subsistence activities: Evidence on capital returns and accumulation in Peruvian microenterprises. Labour Economics.
Fafchamps, Marcel, David McKenzie, Simon Quinn, and Christopher Woodruff. 2014. “When is Capital Enough to Get Female Enterprises Growing? Evidence from a Randomized Experiment in Ghana.” Journal of Development Economics (xx).
Financial Sector Deepening Trust. "National Baseline Survey Report for Micro, Small and Medium Enterprises in Tanzania." (2012). Retrieved from http://www.fsdt.or.tz/data/msme-baseline-survey/
58

Forbes Magazine. “Kenyan Entrepreneur Stands to Make Millions After Sale to L’Oreal.” April 15, 2013. Retrieved from http://www.forbes.com/sites/mfonobongnsehe/2013/04/15/kenyan-entrepreneur-stands-to-make-millions-after-sale-to-loreal/
Formal Employment and Earnings Survey. Various years. National Bureau of Statistics, Tanzania.
Gomezulu, Eliya. Owner Gherazani Steelworking Association. Personal interview. January 25th 2016.
Grimm, Michael, Jens Krüger, and Jann Lay. 2011. “Barriers to Entry and Returns to Capital in
Informal Activities: Evidence from Sub-Saharan Africa.” Review of Income and Wealth. 57(1): 27-53.
Haltiwanger, John, Ron S. Jarmin and Javier Miranda. “Who Creates Jobs? Small Versus Large Versus Young.” The Review of Economics and Statistics, Vol XCV, May 2013 No. 2
Isaga, N. Mwagike L. and Rasheli G. “Review of Interventions and Their Impact of Furniture Enterprises in Tanzania” Draft, Jan. 31, 2016
Kassongo, Mohamed H. CEO UMI, Personal interview, January 28th 2016.
Lewis, W. Arthur. "The Dual Economy Revisited." The Manchester School, V. 47, Issue 3, (1979) pp 211-29. Print.
Li, Yue and Martin Rama. “Firm Dynamics, Productivity Growth and Job Creation in Developing Countries: The Role of Micro- and Small Enterprises.” 2015. The World Bank Research Observer, Oxford University Press.
Martin, Leslie A., Shanti Nataraj and Ann Harrison. “In with the big, out with the small: Removing small-scale reservations in India.” NBER Working Paper, 19942. Retrieved July 24, 2015, from http://www.nber.org/papers/w19942
McKenzie, David J. "Identifying and spurring high-growth entrepreneurship: experimental evidence from a business plan competition." World Bank Policy Research Working Paper 7391 (2015).
59

McKenzie, David, and Christopher Woodruff. 2008. “Experimental Evidence on Returns to Capital and Access to Finance in Mexico.” World Bank Economic Review. 22(3): 457-482.
McMillan, M., & Rodrik, D. (2011). "Globalization, Structural Change and Productivity Growth." NBER Working Paper, 17143. Retrieved November 30, 2015, from http://www.nber.org/papers/w17143
McMillan, Margaret, Dani Rodrik, and Íñigo Verduzco-Gallo. "Globalization, structural change, and productivity growth, with an update on Africa." World Development 63 (2014): 11-32.
Overseas Development Institute. “Supporting the Preparation of Tanzania’s Second Five Year Development Plan (FYDP II) 2016/17-2021/22.” Draft report for the Planning Commission in the Ministry of Finance and Planning, December 2015.
Porta, R., & Shleifer, A. (2011). "The Unofficial Economy in Africa." NBER Working Paper, 16821. Retrieved November 30, 2015, from http://www.nber.org/papers/w16821
Porta, R., & Shleifer, A. (2014). "Informality and Development." NBER Working Paper, 20205. Retrieved November 30, 2015, from http://www.nber.org/papers/w20205
Rodrik, Dani. "The past, present, and future of economic growth." Challenge 57.3 (2014): 5-39. Rodrik, Dani. "Unconditional Convergence in Manufacturing*." The Quarterly Journal of Economics (2012): qjs047. Rodrik, Dani. An African Growth Miracle?. No. w20188. National Bureau of Economic Research, 2014. Rodrik, Dani. Premature Deindustrialization. No. w20935. National Bureau of Economic Research, 2015.
Shirima, Julius James. CEO Darecha Limited. Phone interview, January 29th 2016.
Sutton, John, and Donath Olomi. An enterprise map of Tanzania. International Growth Centre, 2012. Interviews – Jan 24th – February 2nd 2016
World Bank. 2014. World Development Indicators. An online database.
60

Appendices
Appendix 1. Growth Decomposition Methodology
We use the productivity growth decomposition method first developed by McMillan and Rodrik (2013) to analyze the patterns of structural change in Tanzania. We use this method with some modifications and decompose labor productivity growth rate as follows:
Let Yt be the level of GDP at year t for Tanzania, Lt number of total employment, Yit sector level GDP (i.e., sector’s value-added), and Li sector employment. Economywide labor productivity can be defined as the ratio of GDP and total employment, which can be further displayed as the sum of sector level labor productivity weighted by the sector’s share of total employment, i.e., y = Y/L = ∑ 𝑌𝑌𝑖𝑖
𝐿𝐿𝑖𝑖
𝐿𝐿𝑖𝑖𝐿𝐿𝑖𝑖 = ∑ 𝑦𝑦𝑖𝑖𝑆𝑆𝑖𝑖𝑖𝑖 , where yi is sector level labor productivity and Si share of employment in
sector i. We then define 𝑃𝑃𝑃𝑃𝑖𝑖 = 𝑦𝑦𝑖𝑖𝑦𝑦
as the relative labor productivity for sector i, i.e., a ratio of sector labor productivity over economywide labor productivity.
Change in economywide labor productivity y between t and t-k can be defined as
𝑦𝑦𝑡𝑡 − 𝑦𝑦𝑡𝑡−𝑘𝑘 = ∑ (𝑦𝑦𝑖𝑖𝑡𝑡 − 𝑦𝑦𝑖𝑖𝑡𝑡−𝑘𝑘)𝑖𝑖 𝑆𝑆𝑖𝑖𝑡𝑡−𝑘𝑘 + ∑ 𝑦𝑦𝑖𝑖𝑡𝑡𝑖𝑖 (𝑆𝑆𝑖𝑖𝑡𝑡 − 𝑆𝑆𝑖𝑖𝑡𝑡−𝑘𝑘) (1)
Equation (1) is identical with the similar equation in McMillan and Rodrik (2013). For the purpose of the discussion in the paper here, we further present it in the form of decomposition in the growth rate of economywide labor productivity.
Let 𝑔𝑔𝑦𝑦𝑡𝑡 be the growth rate of economywide labor productivity between time t and t-k, i.e., 𝑔𝑔𝑦𝑦𝑡𝑡 =(𝑦𝑦𝑡𝑡 − 𝑦𝑦𝑡𝑡−𝑘𝑘)/𝑦𝑦𝑡𝑡−𝑘𝑘 ; 𝑔𝑔𝑦𝑦𝑖𝑖
𝑡𝑡 growth rate for the sector labor productivity in the same period, 𝑔𝑔𝑦𝑦𝑖𝑖𝑡𝑡 =
(𝑦𝑦𝑖𝑖𝑡𝑡 − 𝑦𝑦𝑖𝑖𝑡𝑡−𝑘𝑘)/𝑦𝑦𝑖𝑖𝑡𝑡−𝑘𝑘 ; and 𝑔𝑔𝑆𝑆𝑖𝑖𝑡𝑡 growth (or change) rate of sector’s labor share in the same period,
𝑔𝑔𝑆𝑆𝑖𝑖𝑡𝑡 = (𝑆𝑆𝑖𝑖𝑡𝑡 − 𝑆𝑆𝑖𝑖𝑡𝑡−𝑘𝑘)/𝑆𝑆𝑖𝑖𝑡𝑡−𝑘𝑘.
Growth rate of economywide labor productivity thus can be decomposed into within sector’s labor productivity growth and growth coming from movement of labor across sector – structural change-led productivity growth as follows:
𝑔𝑔𝑦𝑦𝑡𝑡 = ∑ 𝑔𝑔𝑦𝑦𝑖𝑖𝑡𝑡
𝑖𝑖 𝑆𝑆𝑖𝑖𝑡𝑡−𝑘𝑘𝑃𝑃𝑃𝑃𝑖𝑖𝑡𝑡−𝑘𝑘 + ∑ 𝑔𝑔𝑆𝑆𝑖𝑖𝑡𝑡
𝑖𝑖 𝑆𝑆𝑖𝑖𝑡𝑡−𝑘𝑘𝑃𝑃𝑃𝑃𝑖𝑖𝑡𝑡−𝑘𝑘(1 + 𝑔𝑔𝑦𝑦𝑖𝑖𝑡𝑡 ) (2)
The first component of the right hand side of Eq. (2) is the sum of within sector’s labor productivity growth rate, weighted by the sector’s labor share in the economy and its relative productivity, both at the previous period t-k, while the second component is the contribution of structural change, which is the sum of change rate of sector’s labor share weighted by the sector’s labor share in the economy and its relative productivity in the previous period, t-k, augmented by the level of sector’s labor productivity over that in the previous period.
61

Given that 𝑆𝑆𝑖𝑖𝑡𝑡−𝑘𝑘 , 𝑃𝑃𝑃𝑃𝑖𝑖𝑡𝑡−𝑘𝑘 , and 1 + 𝑔𝑔𝑦𝑦𝑖𝑖𝑡𝑡 are always positive, the contribution of within-sector
productivity growth for a particular sector i to the economywide labor productivity growth is determined by the sign of its within-sector labor productivity growth rate 𝑔𝑔𝑦𝑦𝑖𝑖
𝑡𝑡 , i.e., if sector i sees a positive (negative) labor productivity growth rate, 𝑔𝑔𝑦𝑦𝑖𝑖
𝑡𝑡 , this sector positively (negatively) contributes to the economywide labor productivity growth. Similarly, the structural change contribution from a particular sector to the overall labor productivity growth is determined by the sign of the change rate for this sector’s labor share in the economy, 𝑔𝑔𝑆𝑆𝑖𝑖
𝑡𝑡 , i.e., if a sector’s share of labor in the total employment falls (rises), and the sign for 𝑔𝑔𝑆𝑆𝑖𝑖
𝑡𝑡 is negative (positive), this sector negatively (positively) contribution to economywide labor productivity growth through structural change.
The magnitude of structural change’s contribution from a particular sector, however, is affected by the initial year’s sectoral share of employment, i.e., 𝑆𝑆𝑖𝑖𝑡𝑡−𝑘𝑘 and the initial year’s relative productivity
of this sector, i.e., 𝑃𝑃𝑃𝑃𝑖𝑖𝑡𝑡−𝑘𝑘 = 𝑦𝑦𝑖𝑖𝑡𝑡−𝑘𝑘
𝑦𝑦𝑡𝑡−𝑘𝑘, augmented by the sector’s labor productivity growth, 1 + 𝑔𝑔𝑦𝑦𝑖𝑖
𝑡𝑡 .
Appendix 2. Employment Information for the Formal Economy
There are three surveys in Tanzania with data relevant to the formal economy: the first is the Formal Earnings and Employment Survey (FEES) of which the survey data is available for 2002, 2010 and 2013; the second is the Central Register of Establishments (CRE), of which data is only available for 2009 and 2010; and the third is the Annual Survey of Industrial Production (ASIP), which only covers formal firms with more than 10 employees in manufacturing and mining. Constrained by the years the censuses were conducted (2002 and 2012), we used the FEES 2002 and 2013 data to analyze the formal economy as part of the whole economy. To ensure consistency between the population census and FEES datasets across sectors, if the employment number in FEES for a particular sector was more than that noted in the Census, we relied on the FEES data for out analysis. This was done in order to minimize inflated employment figures for certain sectors, since technically the FEES covers only the formal part of the economy and is a subset of the employment data compiled from Census that covers the economy as a whole. Fortunately, there are very few such cases.
In those rare cases, we made adjustments to the FEES total employment numbers using a carefully devised approach unique to each sector. Specifically, The employment values of business services and government services are adjusted and increased from the original Census 2002 numbers to match the FEES 2002 numbers. In order to keep the total employment number the same as in Census 2002, the number of total personal services is reduced accordingly. Further, formal employment of utilities in 2002 and 2012 and personal services in 2012 are adjusted so that the ‘Utilities’ sector contains only formal employment only and ‘Personal Services’ contains no formal employment. Accordingly, formal employment for construction in 2002 and for trade services in 2012 is reduced such that the total formal employment number is the same as in FEES reports for these two years. It should be noted that overall these adjustments resulted in small changes, and at no point did we adjust the total employment number for the Census or the FEES.
After completing such adjustments, based on the micro-data of FEES and ASIP we were able to analyze formal employment and number of formal firms by different firm size groups. Again, we ensured comparability of these two data sources when we used them for the analysis. The ASIP
62

covers formal firms in the industrial sectors with total employees 10 and more whereas the FEES covers a sample of registered establishments with regular employees between 5 and 49 persons in Tanzania Mainland. Given that the sampling method differs between ASIP and FEES for the smaller sized formal firms (i.e., firms with employees less than 50), the comparison between the two datasets focuses on industrial firms with employees at least 50 as such firms should be fully sampled in both surveys. However, in reality neither survey could get 100% of response rate among the firms they were supposed to cover. For this reason the missing firms in ASIP were added back in the original dataset using data provided by similar firms that responded to the survey, in order to get the number of firms in the ASIP data to equal the numbers of firms the survey was supposed to cover.
This method differs from the one we used with FEES in which sample weights are assigned to a surveyed firm such that it can present all similar firms. In this case, for firms with employees 50 and more, the weights should have been designed according to the response rate, which is provided for some years in FEES reports. However, from the micro-dataset we obtained for FEES 2002 and 2013, and compared with the response rate reported in FEES 2013, the weights assigned to manufacturing firms with employees 50+ seemed to be too high. For example, according to FEES 2013 report, the response rate of private firms with employees 50 and more is 88.4% and it is 100% for the public firms at the same firm size in 2013. This implies that the average weight for a firm with employees 50 or more should not be higher than 1.13 (i.e., 1/0.884). In reality in the dataset of 2013 FEES, the weights for such manufacturing firms is 1.422 – 2.522 with mean of 1.775. Moreover, there is no significant difference in the weight ranges in the data between medium size firms with employees 50-99 and large or very large-scale firms with employees 100-499 and 500+. Using these high weights without making any adjustments may have inflated the growth in large-scale firms and exaggerated the results. Therefore, to overcome this issue we adjusted the numbers of firms and employment for the two largest scale groups of manufacturing firms in the micro-data of FEES 2013, i.e. groups of manufacturing firms with regular employees 100-499 and 500+. Specifically, for the group of manufacturing firms with employees 100-499, we assigned the minimum weights of 1.422 observed in the data for a manufacturing firm with employees 100-499. Further, we did not assign the weight for manufacturing firms with employees 500 and more, based on the assumption that larger firms’ response rate is higher than the smaller firms. Given that there are 44 such firms that’s responded in FEES 2013 and there are only 12 similar scale firms in FEES 2002, the assumption we make is that the largest firms were fully covered in the FEES and therefore would not need to be weighted.
Overall, the robustness assessment between the four main data sources mentioned above highlight that the employment numbers, as well as total number of firms by industry and firm size, are comparable across the datasets. This provided us with the confidence to utilize these datasets simultaneously for our analysis, in an effort to investigate the primary role of the private non-agriculture sectors in economic growth and job creation in the past decade.
63

Appendix 3 – Calculation of Labor Productivity for MSMEs
According to the “National Baseline Survey Report for Micro, Small, and Medium Enterprises in Tanzania”, it was estimated that small businesses in the MSME sector contributed about 27% to Tanzania’s GDP in 2010 (Ministry of Trade and Industry, 2012, p15). We arrive at a similar estimate for the MSME sector’s total value added, although using a different methodology that takes into account the seasonality of business volumes for small firms.
As seasonal fluctuations affects firm level value added for small businesses, particularly since many businesses are located in the rural areas, we calculated the monthly sales value at the firm level before calculating total annual value-added. The MSME survey takes seasonality into consideration by asking respondents to report values of sales for a good, an average and a bad/poor month in a year. It also asked the respondents whether each of the 12 months of the past year was a good, average or bad month. Among the total sample of full-time firms, 4,497 sampled full-time firms reported sales values in a good, bad and average month, while 3,943 firms also properly reported rated each month as good, bad or average in terms of sales. Using this we directly calculate the seasonality adjusted annual sales at the firm level for these 3,943 firms.
For the remaining 554 sampled full-time firms that identified less than 12 months according to the good, average and bad classification, we assume all missing months to be bad sales months. There are also some sampled full-time firms that did not provide the relevant sales information, and for such firms we use the average sales of the industry the firms belong to replace the missing sales information.
In addition, there are 1,131 sampled part-time firms in our sample as well. For such firms, if they reported sales numbers and months according to whether a particular month was good, bad or average, we made similar total sales and value added calculations as for the full-time firms. If a part-time firm did not identify certain months according to the three sales status we treat these missing months as ‘no sales’ months (i.e., considering them as being seasonally out of businesses). With these adjustments, we are confident that while the calculated value of MSME sales could have been underestimated, it is unlikely to have been overestimated.
Table A3-1 below presents the distribution of average sales months among full-time and part-time firms. In the table, the x-axis represents the number of the months that firms identified as an ‘average sales’ month, while the y-axis depicts the distribution (in percentage) of total full-time and part-time firms according to number of average sales month. The result presented in table A3-1 first shows that there is no firm (either full-time or part-time) that considers having ‘average sales’ for more than 10 months in a year. In fact, the majority of firms (more than 90% of total) consider themselves to experience less than 6 months of average sales in a year, with the distribution being similar between the full-time and part-time firms indicating that the fluctuation in sales is a common phenomenon for all MSME firms. Further, there are more full-time firms (27.7% of total) than part-time ones (24.5%) that consider at least 6 months in a year as ‘good sales’ months, an indication that full-time firms are possibly more productive than part-time ones.
64

Table A3-1: Distribution of sampled MSME firms according to number of months that are average in sales
Note: For the part-time firms’ no-sales months, we treat them as bad months in the calculation here for
simplification. Source: Authors calculation using MSME data
Unfortunately, the MSME survey information on business expenditures was inquired only for the last month in the interview. We assumed that such expenditure information represents monthly average at firm level when calculating total value added for the whole year. Based on this assumption, we multiplied this variable by 12 to get full-time firm’s annual expenditure and by the actual number of months the part-time firms were operating to get annual expenditure for such firms. We only considered expenditure of intermediate inputs in the calculation, given that very a few firms reported other types of business expenditures such as water, landline and electricity. We acknowledge that even though intermediate inputs should not be the only cost in calculating value-added, overestimation of value-added should not be a serious problem using this methodology, as many small firms do not incur other types of costs. Further, for the firms with missing expenditure information, we calculated expenditure averages for each sector and assigned intermediate costs based on which sector the firm belonged to. Finally we calculated the differences between annual sales and expenditures of intermediate inputs to derive the value-added at the firm level.
-
5.0
10.0
15.0
20.0
25.0
30.0
0 1 2 3 4 5 6 7 8 9 10 11 12
%
Number of months
Fulltime firms
Parttime firms
65