Economic Survey of Latin America and the Caribbean · 2 Executive summary Economic Commission for...
231
2016 Economic Survey of Latin America and the Caribbean The 2030 Agenda for Sustainable Development and the challenges of financing for development
Transcript of Economic Survey of Latin America and the Caribbean · 2 Executive summary Economic Commission for...

2016Economic Surveyof Latin America and the Caribbean
The 2030 Agenda for Sustainable Development and the challenges of financing for development
2016Economic Survey of Latin America and the Caribbean
The 2030 Agenda for Sustainable Development and the challenges of financing for development
2 Economic Commission for Latin America and the Caribbean (ECLAC)Executive summary
Alicia BárcenaExecutive Secretary
Antonio PradoDeputy Executive Secretary
Daniel TitelmanChief, Economic Development Division
Ricardo PérezChief, Publications and Web Services Division
Explanatory notes
- Three dots (…) indicate that data are missing, are not available or are not separately reported.- A dash (-) indicates that the amount is nil or negligible.- A full stop (.) is used to indicate decimals.- The word “dollars” refers to United States dollars unless otherwise specified.- A slash (/) between years (e.g., 2013/2014) indicates a 12-month period falling between the two years. - Individual figures and percentages in tables may not always add up to the corresponding total due to rounding.
The Economic Survey of Latin America and the Caribbean is issued annually by the Economic Development Division of the Economic Commission for Latin America and the Caribbean (ECLAC). The 2016 edition was prepared under the supervision of Daniel Titelman, Chief of the Division, and coordinated by Jürgen Weller.
In the preparation of this edition, the Economic Development Division was assisted by the Statistics Division, the ECLAC subregional headquarters in Mexico City and Port of Spain, and the Commission’s country offices in Bogota, Brasilia, Buenos Aires, Montevideo and Washington, D.C.
Part I, entitled “The economic situation and outlook for 2016”, was prepared with input from the following experts: Cecilia Vera (international context and external sector); Claudia de Camino (external sector); Ramón Pineda, Alejandra Acevedo, Claudio Aravena and Pablo Carvallo (economic activity); Ramón Pineda and Alda Díaz (prices); Jürgen Weller (employment and wages); Ramón Pineda, Rodrigo Cárcamo, Alejandra Acevedo, Alda Díaz and Adriana Matos (monetary, exchange-rate and macroprudential policies); and Ricardo Martner, Juan Pablo Jiménez, Michael Hanni and Ivonne González (fiscal policy).
Part II, entitled “The 2030 Agenda for Sustainable Development and the challenges of financing for development”, was prepared by Ricardo Martner, Ivonne González, Michael Hanni and Ignacio Ruelas (chapter II); Ricardo Martner, Juan Carlos Gómez Sabaini, Michael Hanni, Juan Pablo Jiménez, Dalmiro Morán and Andrea Podestá (chapter III); and Esteban Pérez, with input from Cecilia Vera and assistance from Javier Ahumada, Manuel Cruz, Cecile Poulard and Matías Rodríguez (chapters IV and V).
The country notes are based on studies conducted by the following experts: Dillon Alleyne (Jamaica); Anahí Amar and Daniel Vega (Argentina); Rodrigo Cárcamo (Peru); Cameron Daneshvar (Honduras and Dominican Republic); Claudia de Camino and Michael Hanni (Plurinational State of Bolivia); Stefanie Garry (El Salvador and Guatemala); Randolph Gilbert (Haiti); Sonia Gontero (Paraguay); Michael Hendrickson (Bahamas and Belize); Cornelia Kaldewei (Ecuador); Álvaro Lalanne (Uruguay); Sheldon McLean (Guyana and Eastern Caribbean Currency Union); Rodolfo Minzer (Panama); Carlos Mussi (Brazil); Ramón Padilla (Costa Rica); Machel Pantin (Suriname and Trinidad and Tobago); Esteban Pérez (Chile); Ramón Pineda (Bolivarian Republic of Venezuela); Juan Carlos Ramírez, Olga Lucía Acosta, Tomás Concha and Yaddi Miranda (Colombia); Juan Carlos Rivas (Mexico); Indira Romero (Cuba); Jesús Santamaría (El Salvador); Nyasha Skerrette (Barbados); and Francisco Villarreal (Nicaragua). Michael Hanni and José Luis Germán reviewed the country notes for the Caribbean. Georgina Cipoletta helped to review the country notes for Latin America.
Karina Araya, Alda Díaz and María José Zambrano contributed to the processing and graphical presentation of the statistical data.
United Nations publication
ISBN: 978-92-1-121919-7 (print)
ISBN: 978-92-1-057543-0 (pdf)
ISBN: 978-92-1-358037-0 (ePub)
Sales No.: E.16.II.G.3
LC/G.2684-P
Copyright © United Nations, 2016
All rights reserved
Printed at United Nations, Santiago
S.16-00797
This publication should be cited as: Economic Commission for Latin America and the Caribbean (ECLAC), Economic Survey of Latin America and the Caribbean, 2016 (LC/G.2684-P), Santiago, 2016.
Applications for the right to reproduce this work, either in whole or in part, are welcomed and should be sent to the Secretary of the Publications Board, United Nations Headquarters, New York, N.Y. 10017, United States. Member States and their governmental institutions may reproduce this work without prior authorization, but are requested to mention the source and inform the United Nations of such reproduction.
3ContentsEconomic Survey of Latin America and the Caribbean • 2016
CONTENTS
Presentation.............................................................................................................................................................. 13
Executive summary.................................................................................................................................................. 15
Part I The economic situation and outlook for 2016 ..................................................................................................... 21
Regional overview ................................................................................................................................................... 23A. The external context ........................................................................................................................................ 25
1. Continued low levels of global economic growth are projected for 2016 —about 2.4%, similar to the rate in 2015— with developed countries set to grow more slowly and developing economies likely to maintain similar levels of growth to 2015............................................................................................................... 25
2. World trade is still languishing at levels lower than before the global financial crisis ......................... 26
3. Financial markets were off to a volatile start in 2016 but began stabilizing in February ....................... 27
4. Energy and metals posted the sharpest price declines among commodities; prices for the rest of the year are set to remain close to the levels seen in mid-2016, without significant changes ................................................................................................ 29
5. Uncertainty is likely to persist for the rest of the year in view of various remaining risks ..................... 30B. The external sector .......................................................................................................................................... 32
1. The region’s export commodity prices, particularly in the energy sector, are expected to fall in 2016, but by less than they did in 2015 .................................................................................... 32
2. The terms of trade for South America and Mexico are expected to deteriorate, although less than they did in 2015, while they will improve for Central America and the Caribbean ................................................................................................... 33
3. Latin American goods exports and imports plunged in 2015 and are expected to continue to fall, albeit at a slower rate, in 2016..................................................................................................... 34
4. The current account deficit is expected to improve in 2016, mainly as a result of a smaller goods and services deficit ................................................................................................... 39
5. Total financial inflows to the region ebbed considerably in 2015 and are not expected to pick up much in 2016............................................................................................................................ 41
6. The region’s sovereign risk continued to follow the upward trend that it has been on since mid-2014, peaking in January 2016 with the highest levels seen since 2009 ........................................ 42
7. Debt issuances in international markets by Latin America and the Caribbean declined substantially in 2015, but picked up in April and May 2016 with issues by the new Government of Argentina and the Brazilian State oil company, Petrobras ............................................. 43
C. Domestic performance .................................................................................................................................... 44
1. In 2015, the region’s GDP contracted (by 0.5%) for the first time since 2009 ........................................ 44
2. Consumption has ceased to be the main driver of aggregate domestic demand and has instead been contributing, along with investment, to the drop in aggregate demand in the region since the third quarter of 2015 ........................................................ 47
3. Gross fixed capital formation contracted in the region for the seventh quarter running ........................ 47
4. Only the services sector is contributing positively to the region’s growth ............................................. 48
5. Economic activity in the region will contract for the second year running in 2016 ................................ 49
6. Average inflation in the economies of Latin America and the Caribbean has been driven higher by faster price growth in South America ...................................................................................... 53
7. Inflation was higher for tradable than for non-tradable goods, and food inflation outstripped general inflation .................................................................................................................... 55
8. Inflation continued to rise in the first five months of 2016, especially in South America ...................... 56
9. In 2015, economic weakness was reflected in the first rise in regional unemployment since 2009................................................................................................................................................. 57
10. The region’s labour market performance deteriorated in early 2016, but with marked intraregional differences .......................................................................................................................... 58
11. Economic developments in the region have continued to affect labour markets adversely in 2016 ...... 63

4 Contents Economic Commission for Latin America and the Caribbean (ECLAC)
D. Macroeconomic policy ..................................................................................................................................... 64
1. Mixed results for fiscal indicators in 2015 .............................................................................................. 64
2. Figures indicate a slight improvement in the fiscal balance for 2016 ..................................................... 67
3. Monetary, exchange-rate and macroprudential policy .......................................................................69
4. International reserves............................................................................................................................... 76Bibliography ........................................................................................................................................................... 78
Part IIThe 2030 Agenda for Sustainable Development and the challenges of financing for development ................................................................................................................................. 79
Introduction ........................................................................................................................................................... 81
Chapter IIDomestic resource mobilization ............................................................................................................................ 85
Introduction ........................................................................................................................................................... 87A. Public finances must adapt to new conditions in order to cope with the reduction
in the fiscal space ............................................................................................................................................ 88
1. Public debt growth is gathering momentum ............................................................................................ 88
2. Medium-term conditions are tight for public finances ............................................................................ 90
3. Fiscal institutions must give priority to protecting investment ............................................................... 95B. Given financing difficulties, tax systems must become a pillar for efforts to achieve
the Sustainable Development Goals ............................................................................................................... 97
1. The tax burden remains low in relation to the region’s level of development ........................................ 97
2. The progressiveness of the region’s tax systems is nil ........................................................................... 98
3. Tax evasion remains high ......................................................................................................................... 99
4. The proliferation of tax incentives has eroded tax bases ...................................................................... 101Bibliography ......................................................................................................................................................... 103Annex II.A1 .......................................................................................................................................................... 104Annex II.A2 .......................................................................................................................................................... 106
Chapter III Evasion arising from international operations by multinational enterprises and high net worth individuals ............................................................................................................... 117
Introduction ......................................................................................................................................................... 119A. Profit shifting and aggressive tax planning ................................................................................................... 120B. An estimation of tax losses resulting from trade misinvoicing .................................................................... 123C. Coordinating efforts between countries ....................................................................................................... 131Bibliography ......................................................................................................................................................... 135Annex III.A1 ......................................................................................................................................................... 136Annex III.A2 ......................................................................................................................................................... 140
Chapter IV External private sector financial flows ......................................................................................................................143
Introduction ......................................................................................................................................................... 145A. Changes in external financial flows and the growing importance of private
sector sources and actors .............................................................................................................................. 146
1. Trends in ODA and official flows ........................................................................................................... 146
2. External sector flows .............................................................................................................................. 148
3. The heterogeneous composition of the external flows relied on by the different countries ................ 149B. The Latin American and Caribbean countries’ access to private sector financial markets .......................... 150C. Private sector flows at the service of development ...................................................................................... 156
1. Public-private partnerships in Latin America and the Caribbean .......................................................... 157
2. Social impact bonds ............................................................................................................................... 160Bibliography ......................................................................................................................................................... 162
5ContentsEconomic Survey of Latin America and the Caribbean • 2016
Chapter V Financial inclusion and innovation...................................................................................................................... 163
Introduction ......................................................................................................................................................... 165
A. Financial inclusion should be conceived as part of a policy on production development ............................ 166
B. Financial inclusion: unfinished business for Latin America and the Caribbean ........................................... 167
C. Causes of the financial inclusion gapin Latin America ................................................................................. 172
1. Difficulties of SMEs................................................................................................................................ 172
2. Characteristics and functioning of the financial system in Latin America ............................................ 173
3. The importance of internal funds as a source of financing ................................................................... 175
D. Rethinking financial innovation: a requirement for closing the financial inclusion gap ..................................... 177
1. Financial innovation as the creation of institutions, markets, processes and products ....................... 177
2. Similarities and differences between financial innovation and innovation in other sectors ................ 179
3. Financial innovation as a public good .................................................................................................... 181
E. Conclusions .................................................................................................................................................... 183
Bibliography ......................................................................................................................................................... 184
Annex V.A1 .......................................................................................................................................................... 185
Statistical annex..................................................................................................................................................... 187
ECLAC recent publications ................................................................................................................................... 227
TablesTable I.1 GDP growth 2013-2015 and projections for 2016-2017 ................................................................. 25
Table I.2 Latin America and the Caribbean: 12-month changes in the consumer price index (CPI), December 2013 to May 2016 ......................................................................................................... 54
Table I.3 Latin America and the Caribbean (19 countries): change in central government fiscal indicators, first quarter of 2015 to first quarter of 2016 ....................................................... 67
Table I.4 Latin America and the Caribbean (14 countries): real year-on-year variation in revenue obtained from income tax and value added tax, first quarters of 2014, 2015 and 2016 ............................................................................................ 69
Table I.5 Latin America and the Caribbean (21 countries): nominal currency depreciation against the dollar, annualized changes, 2013 to May 2016 ........................................................... 74
Table II.1 Latin America: initial variables used for public debt scenarios ..................................................... 93
Table II.A1.1 Latin America (selected countries): sovereign funds ................................................................... 104
Table II.A2.1 Latin America and the Caribbean (selected countries): fiscal rules, by country .......................... 114
Table III.1 Financial wealth in tax havens ..................................................................................................... 122
Table III.A1.1 Methodological approaches used to quantify international revenue shifting ................................ 137
Table IV.1 Latin America (17 countries): bond issuance, 2006-2013 ............................................................ 152
Table V.1 Latin America (selected countries) and the European Union: enterprises and employment by size, 2011...................................................................................................... 167
Table V.2 Latin America (selected countries): banking products used by SMEs, 2010 ............................... 171
Table V.3 Brazil, Chile, Ecuador, Mexico and Peru: average credit portfolio, by economic sector, 2015 .............................................................................................................. 174
Table V.4 Latin America (selected countries): number of enterprises, by size and country, 2006 and 2010............................................................................................................................... 176
Table V.5 Latin America (13 countries): econometric estimate of investment level in relation to access to finance, 2010 ........................................................................................... 177
Table V.6 Latin America (selected countries): share of leasing in GDP, 2012 .............................................. 178
Table V.7 Relationship between financial development and growth ........................................................... 180
Table V.A1.1 Latin America: main financial entities with leasing portfolios, 2012 .......................................... 185
Statistical annexTable A.1 Latin America and the Caribbean: main economic indicators ...................................................... 189
Table A.2 Latin America and the Caribbean: gross domestic product in millions of dollars ....................... 190

6 Contents Economic Commission for Latin America and the Caribbean (ECLAC)
Table A.3 Latin America and the Caribbean: annual growth rates in gross domestic product .................... 191
Table A.4 Latin America and the Caribbean: per capita gross domestic product ........................................ 192
Table A.5 Latin America and the Caribbean: quarterly growth rates in gross domestic product ................ 193
Table A.6 Latin America and the Caribbean: gross fixed capital formation ................................................. 193
Table A.7 Latin America and the Caribbean: balance of payments ............................................................. 194
Table A.8 Latin America and the Caribbean: international trade of goods .................................................. 197
Table A.9 Latin America and the Caribbean: exports of goods, f.o.b. .......................................................... 198
Table A.10 Latin America and the Caribbean: imports of goods, c.i.f. ........................................................... 199
Table A.11 Latin America: terms of trade for goods f.o.b./f.o.b. .................................................................... 200
Table A.12 Latin America and the Caribbean (selected countries): remittances from emigrant workers ................................................................................................................. 200
Table A.13 Latin America and the Caribbean: net resource transfer ............................................................. 201
Table A.14 Latin America and the Caribbean: net foreign direct investment ................................................ 202
Table A.15 Latin America and the Caribbean: total gross external debt ....................................................... 203
Table A.16 Latin America and the Caribbean: sovereign spreads on EMBi+ and EMBI global ..................... 205
Table A.17 Latin America and the Caribbean: risk premiums on five-year credit default swaps .................. 205
Table A.18 Latin America and the Caribbean: international bond issues ...................................................... 206
Table A.19 Latin America and the Caribbean: stock exchange indices .......................................................... 206
Table A.20 Latin America and the Caribbean: gross international reserves .................................................. 207
Table A.21 Latin America and the Caribbean: real effective exchange rates ................................................ 208
Table A.22 Latin America and the Caribbean: participation rate ................................................................... 209
Table A.23 Latin America and the Caribbean: open urban unemployment .................................................... 211
Table A.24 Latin America and the Caribbean: employment rate .................................................................... 212
Table A.25 Latin America and the Caribbean: formal employment indicators ............................................... 213
Table A.26 Latin America: visible underemployment by hours ...................................................................... 213
Table A.27 Latin America: real average wages .............................................................................................. 214
Table A.28 Latin America and the Caribbean: monetary indicators ............................................................... 215
Table A.29 Latin America and the Caribbean: domestic credit ...................................................................... 218
Table A.30 Latin America and the Caribbean: monetary policy rates ............................................................ 219
Table A.31 Latin america and the caribbean: representative lending rates .................................................. 220
Table A.32 Latin America and the Caribbean: consumer prices ..................................................................... 221
Table A.33 Latin America and the Caribbean: fiscal balances ....................................................................... 222
Table A.34 Latin America and the Caribbean: composition of tax revenue ................................................... 223
Table A.35 Latin America and the Caribbean: public income and expenditure ............................................. 224
Table A.36 Latin America and the Caribbean: non-financial public sector gross public debt ........................ 225
Table A.37 Latin America and the Caribbean: central government gross public debt .................................. 226
FiguresFigure I.1 World: seasonally adjusted year-on-year trade volume growth, first quarter of 2006
to fourth quarter of 2015................................................................................................................. 27
Figure I.2 Financial market volatility and stock market indices ..................................................................... 28
Figure I.3 International commodity prices, January 2003 to June 2016 ........................................................ 29
Figure I.4 Latin America and the Caribbean: annual changes in export commodity price indices, 2015, and projections for 2016 ....................................................................................................... 32
Figure I.5 Latin America and the Caribbean (selected country groupings): changes in the terms of trade, 2012-2016 .................................................................................................... 33
Figure I.6 Latin America (19 countries): changes on the previous year in goods exports and imports by value, 2015 ............................................................................................................. 34
Figure I.7 Latin America (selected country groupings): year-on-year changes in exports by value, three-month moving averages, January 2013 to April 2016 .......................................................... 35

7ContentsEconomic Survey of Latin America and the Caribbean • 2016
Figure I.8 Latin America (selected country groupings): projected changes in goods export volumes and prices, 2016 .................................................................................................... 36
Figure I.9 Latin America (16 countries): exports to China as a percentage of the total and total exports as a percentage of GDP ...................................................................................... 37
Figure I.10 Latin America (selected country groupings): year-on-year changes in imports by value, three-month moving averages, January 2013 to April 2016 .......................................................... 38
Figure I.11 Latin America (selected country groupings): projected changes in goods imports volumes and prices, 2016 ............................................................................................................... 38
Figure I.12 Latin America (19 countries): balance-of-payments current account by component, 2005-2016 ....................................................................................................................................... 39
Figure I.13 Latin America and the Caribbean (selected countries): changes in income from emigrants’ remittances, 2014-2016 ....................................................................................... 40
Figure I.14 Latin America (18 countries): balance-of-payments current account and capital and financial accounts by component, 2010-2015 ......................................................................... 41
Figure I.15 Latin America (14 countries): sovereign risk according to the Emerging Market Bond Index Global (EMBIG), January 2008 to June 2016 ..............................................................................43
Figure I.16 Latin America: external bond issuance by institutional sector, 12-month running totals, December 2006 to May 2016 ......................................................................................................... 44
Figure I.17 Latin America and the Caribbean: GDP growth rates, 2009-2015 ................................................. 44
Figure I.18 Latin America and the Caribbean: GDP growth rates, 2015 .......................................................... 45
Figure I.19 Latin America and the Caribbean (selected countries and country groupings): contributions to regional GDP growth, 2008-2015 ......................................................................... 46
Figure I.20 Latin America: year-on-year GDP growth rates and growth contribution of aggregate demand components, 2008-2015 .............................................................................. 47
Figure I.21 Latin America: year-on-year rates of change in gross fixed capital formation, 2008-2015 ....................................................................................................................................... 48
Figure I.22 Latin America: year-on-year growth rates in value added and growth contribution of activity sectors, 2008-2015 ........................................................................................................ 48
Figure I.23 Latin America and the Caribbean (selected countries and country groupings): projected GDP growth rates, 2016 ................................................................................................. 50
Figure I.24 Latin America: GDP growth rates, 2008-2016 ................................................................................ 51
Figure I.25 Latin America and the Caribbean (weighted averages): 12-month changes in the consumer price index (CPI), January 2008 to May 2016 ...................................................... 53
Figure I.26 Latin America and the Caribbean (weighted average): 12-month changes in the consumer price index (CPI), January 2008 to December 2015 ............................................. 56
Figure I.27 Latin America and the Caribbean (12 countries): year-on-year changes in the employment, participation and unemployment rates, first quarter of 2013 to first quarter of 2016 ................... 58
Figure I.28 Latin America and the Caribbean (11 countries): simple averages of year-on-year changes in participation, employment and unemployment rates, by sex, first quarter of 2016 .................. 59
Figure I.29 Latin America and the Caribbean (9 countries): year-on-year changes in numbers employed by occupational category and gross domestic product (GDP) growth rate, 2013 to first quarter of 2016 ...................................................................................... 60
Figure I.30 Latin America (8 countries): year-on-year changes in registered employment, January 2013 to April 2016............................................................................................................. 61
Figure I.31 Latin America (7 countries): year-on-year changes in real wages from formal employment, rolling quarters, January-March 2013 to February-April 2016 ................................. 62
Figure I.32 Latin America and the Caribbean: central government fiscal indicators, 2009-2015 .................... 64
Figure I.33 Latin America and the Caribbean: central government gross public debt, 2014 and 2015 ........... 65
Figure I.34 Latin America: public debt interest payments, 2015 ...................................................................... 66
Figure I.35 Latin America and the Caribbean: disaggregated central government public spending, by subregion and country grouping, 2014 and 2015 ...................................................................... 66
Figure I.36 Latin America (14 countries): change in real central government tax revenues, without social security contributions, relative to the same quarter the year before, simple averages, first quarter of 2008 to first quarter of 2016 .......................................... 68

8 Contents Economic Commission for Latin America and the Caribbean (ECLAC)
Figure I.37 Latin America (selected country groupings): monetary policy rates in countries where they are used as the main policy instrument, January 2013 to June 2016 ........................ 70
Figure I.38 Latin America and the Caribbean (selected country groupings): monetary base in countries using monetary aggregates as the main policy instrument, first quarter of 2010 to first quarter of 2016 ................................................................................... 71
Figure I.39 Latin America and the Caribbean (selected country groupings): average annualized lending rates, January 2010 to April 2016 ..................................................................................... 72
Figure I.40 Latin America and the Caribbean (selected country groupings): average annualized growth in domestic lending to the private sector, first quarter of 2013 to first quarter of 2016 .................................................................................................................... 73
Figure I.41 Latin America (selected countries): nominal exchange rates against the dollar, January 2014 to April 2015 ...................................................................................................................74
Figure I.42 Latin America and the Caribbean: effective extraregional exchange rates, by subregion, January 2013 to April 2016............................................................................................................. 76
Figure I.43 Latin America: overall real effective exchange rates, April 2016 and December 2014 ........................76
Figure I.44 Latin America and the Caribbean: international reserves, 2000-2016 .......................................... 77
Figure II.1 Latin America and the Caribbean (19 countries): overall and primary fiscal balance, 1990-2015 ....................................................................................................................................... 88
Figure II.2 Latin America (19 countries): gross public debt of the central government and the non-financial public sector, 1990-2015. ............................................................................. 89
Figure II.3 Latin America (selected countries): differences in public debt levels between the central government and the non-financial public sector, 2008 and 2015 ................................ 89
Figure II.4 Latin America (19 countries): total and external gross public debt of the non-financial public sector, 2000-2015 ................................................................................ 90
Figure II.5 Latin America (19 countries): contributions to variation in public debt, 2008-2015 ...................... 92
Figure II.6 Latin America (19 countries): public debt at 2025, by different primary-balance scenarios ......... 94
Figure II.7 Latin America (16 countries): fiscal multipliers disaggregated by type of expenditure ................. 95
Figure II.8 Latin America (selected countries): tax burden compared with per capita GDP in purchasing power parity, around 2013 ....................................................................................... 97
Figure II.9 Latin America (18 countries) and OECD (34 countries): tax burden, 2000 and 2014 ..................... 98
Figure II.10 Latin America (18 countries) and OCED: breakdown of income tax receipts, 2011 ....................... 99
Figure II.11 Latin America (16 countries) and the European Union (27 countries): effective rate of personal income tax and reduction in inequality due to personal income tax, 2011 ................ 99
Figure II.12 Latin America: tax collection and estimated tax evasion, 2015 ..............................................100
Figure II.13 Latin America: general rates for the main taxes .......................................................................... 101
Figure III.1 Latin America and the Caribbean: tax losses associated with trade misinvoicing, 2004-2013 ..................................................................................................................................... 125
Figure III.2 Latin America and the Caribbean: estimated value of trade misinvoicing, 2004-2013 ..................................................................................................................................... 125
Figure III.3 Latin America and the Caribbean: estimated value of international goods trade price manipulation, by country, 2013 .................................................................................. 126
Figure III.4 Latin America and the Caribbean: estimated cumulative value of international goods trade price manipulation, by partner, 2004-2013 ......................................................................... 128
Figure III.5 Latin America and the Caribbean: estimated cumulative value of international goods trade price manipulation, 2004-2013, by two-digit product groups in the Harmonized System ............................................................................................................ 129
Figure III.6 Latin America and the Caribbean: estimated cumulative value of price manipulation for non-renewable natural resource-related goods, by product groups at the two-digit level of the Harmonized System and transaction type, 2004-2013 ............................................. 130
Figure IV.1 Latin America and the Caribbean: official development assistance (ODA), 1961-2014 .............. 146
Figure IV.2 Latin America and the Caribbean: classification of official financing into concessional and non-concessional bilateral and multilateral flows, averages for each period, 1980-2014 ..................................................................................................................................... 147
9ContentsEconomic Survey of Latin America and the Caribbean • 2016
Figure IV.3 Latin America and the Caribbean: private and official financing flows, 1980-2014 .................... 148
Figure IV.4 Latin America and the Caribbean: relative scale of selected external financing sources, 2010-2012 average ......................................................................................................... 149
Figure IV.5 Value of world financial assets, derivatives and world GDP, 2000-2014 ..................................... 150
Figure IV.6 Lending to borrowers outside the United States, late 2013 ........................................................ 151
Figure IV.7 Latin America and the Caribbean: international bond issuance, December 2006 to May 2016 .................................................................................................................................. 151
Figure IV.8 Bank, corporate, sovereign, quasi-sovereign and supranational shares of international bond issuance, January 2006 to May 2016 ........................................................ 152
Figure IV.9 Latin America and the Caribbean: bond issuance by sector of economic activity, 2006-2014 ..................................................................................................................................... 153
Figure IV.10 Emerging Market Bond Index (EMBI Global) for the world, Latin America and all other developing countries, quarterly data, 2004-2016 ................................................... 154
Figure IV.11 Stock market indices in China, the United States, Japan, Europe and emerging markets, monthly data, 16 July to 17 September 2015 .............................................................................. 155
Figure IV.12 Global stock market volatility (the VIX, V2X and VXEEM) and implied volatility, monthly data, 16 July to 17 September 2015 .............................................................................. 155
Figure IV.13 Latin America and the Caribbean: investment in public-private partnerships, 1990-2013 ......... 157
Figure IV.14 Latin America and the Caribbean: distribution of cumulative investment in public-private partnerships, 2010-2013 .................................................................................... 158
Figure IV.15 Latin America and the Caribbean: number of public-private partnerships and amount of investment by sector of activity, cumulative values, 1990-2013 ............................................. 158
Figure V.1 Adults aged 15 and older having at least one account at a financial institution, 2014 .............. 168
Figure V.2 Latin America and the Caribbean (20 countries): adults aged 15 and older in the top 60% and bottom 40% of income earners having at least one account at a financial institution, 2014 ...................................................................................................... 169
Figure V.3 Regions: adults aged 15 and older in the top 60% and bottom 40% of income earners having at least one account at a financial institution, 2014 ........................................................ 169
Figure V.4 Regions: enterprises with a bank loan or line of credit, 2014 ..................................................... 170
Figure V.5 Selected regions: value of collateral required to obtain a loan, by size of applicant company, 2010-2015 ..................................................................................................................... 172
Figure V.6 Latin America (13 countries): density function of the value of guarantees as a percentage of debt issued, 2006 and 2010...................................................................................................... 173
Figure V.7 Latin America (selected countries): proportion of total financial system assets held by the five main banks, 2006-2015 ....................................................................................... 174
Figure V.8 Latin America: sources of financing for SME investment, simple average, 2010 ....................... 175
Figure V.A1.1 Latin America and the Caribbean (20 countries): adults aged 15 and older with at least one account at a financial institution, 2014 ............................................................ 185
BoxesBox I.1 Economic implications of Brexit for Latin America and the Caribbean .......................................... 31
Box I.2 Aspects of measuring and analysing labour markets in Latin America and the Caribbean .......... 63
Box II.1 Public debt dynamics ...................................................................................................................... 91
Box II.2 Public investment in Latin America (selected countries) ............................................................... 96
Box III.1 Methodology note ......................................................................................................................... 124
Box III.2 The importance of intra-firm transactions in goods trade ............................................................ 127
Box III.A2.1 Six indicators for tracing and detecting base erosion and profit shifting manoeuvres (OECD project) .......................................................................................................... 140
Box IV.1 The operating logic of social impact bonds .................................................................................. 160
Box V.1 Financial innovation for inclusion: projects implemented by development banks in Latin America ............................................................................................................................ 182


Presentation and executive summary

13Economic Survey of Latin America and the Caribbean • 2016 Executive summary
Presentation
This, the sixty-eighth edition of the Economic Survey of Latin America and the Caribbean, which corresponds to the year 2016, consists of three parts. Part I outlines the region’s economic performance in 2015 and analyses trends in the first half of 2016, as well as the outlook for the rest of the year. It examines the external and internal factors influencing the region’s economic performance and highlights some of the macroeconomic policy challenges that have arisen in an external context of weak growth and high levels of uncertainty.
Part II analyses the challenges that the countries of Latin America and the Caribbean face at the domestic and international levels in mobilizing financing for development. On the domestic front, slower growth and tighter fiscal restrictions pose significant challenges for the mobilization of resources. Externally, the classification of many of the region’s countries in the middle-income category limits their access to concessional external financing or international support.
Part III of this publication may be accessed on the web page of the Economic Commission for Latin America and the Caribbean (www.eclac.org). It contains the notes relating to the economic performance of the countries of Latin America and the Caribbean in 2015 and the first half of 2016, together with their respective statistical annexes. The cut-off date for updating the statistical information in this publication was 30 June 2016.

15Economic Survey of Latin America and the Caribbean • 2016 Executive summary
Executive summary
A. The economic situation and outlook for 2016In 2016, the region’s GDP is projected to contract for the second successive year in a context of mounting uncertainty in the world economy and a slump in domestic demand. Output is expected to fall by 0.8% in 2016, a larger decline than the 0.5% observed in 2015, resulting in a 2.0% drop in per capita GDP.
As in previous years, growth patterns differed greatly between countries and subregions. Economies in the north of the region were boosted by lower energy prices, an upturn in external demand and remittance inflows, and inflation trends that allow for a degree of policy space for stimulating domestic aggregate demand. Their southern counterparts are faced with a major deterioration in their terms of trade, weaker external aggregate demand (from China and intraregional partners) and a significant narrowing of their room to manoeuvre in terms of adopting demand-stimulus policies. Against that backdrop, the South American subregion is projected to contract by 2.1% and the Caribbean by 0.3%, while Central America is set to grow by 3.8%.
The economies of four Latin American and two Caribbean countries are expected to contract in 2016: Argentina, the Bolivarian Republic of Venezuela, Brazil, Ecuador, Suriname and Trinidad and Tobago.
These growth trends are a reflection of both external and internal factors. On the external front, global economic growth continues to be weak, and for 2016 is unlikely to surpass the sluggish rates of recent years, at around 2.4% (similar to the 2015 figure). Developed economies are set to grow more slowly this year (1.8%), while developing economies are likely to maintain similar levels of growth to those seen in 2015 (3.8%). In 2015 the Chinese economy, which is particularly important for the region, grew by less than 7% for the first time since 1990 and is projected to expand by 6.4% in 2016.
Coinciding with low GDP growth, world trade volume growth rates continue to languish at levels lower than those that preceded the global financial crisis. In the first three months of 2016, the volume of world trade in goods fell by 1% compared with the year-earlier period. This performance was attributable to lower export volumes from the emerging countries of Asia, Japan and the United States. The projection for 2016 is for goods trade volumes to grow by about 2.8%, similar to the rate posted in 2015.
Weaker external demand has been compounded by falling commodity prices, which declined sharply in early 2016 before gradually recovering later in the year. For the remainder of 2016, prices are expected to stick close to their current levels (as of the second quarter), which implies that average prices will be lower in 2016 than in 2015. For example, crude oil is expected to decline by 21% compared with 2015, copper by 13%, iron ore by 23% and soybean flour by 14%.
International financial markets had a rocky start in 2016, with volatility expected to remain high throughout the year, despite moderating somewhat during the first six months. At the time of writing, news emerged of the United Kingdom’s decision to vote in favour of leaving the European Union (a process termed “Brexit”), which is generating greater financial volatility and uncertainty with regard to economic growth. Should risk aversion increase at the global level, it could reduce the availability of financing for emerging markets, including Latin America and the Caribbean.
The impact of Brexit on growth in Latin American and Caribbean in 2016, if any, is expected to be minor, stemming mainly from greater uncertainty and volatility in global financial markets. Medium-term economic effects could emerge from the trade

16 Economic Commission for Latin America and the Caribbean (ECLAC)Executive summary
channel and from economic growth, although it is thought that the direct trade impact on Latin America and the Caribbean should not be too great, since trade links with the United Kingdom are weak. However, the indirect effects that may materialize owing to the impacts on the economic growth of Latin America’s other trading partners are more difficult to gauge and will depend on the consequences of Brexit for growth in Europe, the United States and the world economy in general.
On the domestic front, a key factor has been the slowdown in domestic demand, with reductions in investment and consumption. In 2015, domestic demand fell by 1.6%, driven by a downturn in final consumption (down by 0.2%) and gross capital formation (down by 6.5%). In the second quarter of 2015, private consumption ceased to be the main component sustaining demand. By contrast, net exports surged in 2015, driven by an upturn in exports (up by 4.1%) and a fall in imports (down by 2.2%).
Domestic demand patterns also revealed major differences between countries. In Central America, GDP growth was spurred chiefly by private consumption, whose contribution has increased at the expense of investment, while that of public consumption remained stable. This contrasts with the trend observed in South America, where private consumption and investment made a negative contribution throughout 2015, while public consumption was mostly insignificant and only net exports made a positive contribution to growth.
In 2016, the economic performance of subregions and countries remained heterogeneous. As in 2015, the regional outcome in 2016 largely reflected contractions in two of the region’s largest economies: Brazil (-3.5%) and the Bolivarian Republic of Venezuela (-8.0%). Excluding these two countries would give a regional GDP growth rate of 1.8%.
Data for the first quarter of 2016 are consistent with a drop in domestic demand as investment and private consumption continued to weaken in Latin America, marking the eighth consecutive quarter of declining investment, and the fifth of falling private consumption. The figures also revealed a further contraction in public consumption, after that posted in the fourth quarter of 2015.
This overall trend was driven largely by the performance of the South American economies, since investment and consumption both made a positive contribution to growth in the economies of Central America and Mexico.
The impact of the economic slowdown on the unemployment rate has increased. In 2015, the region’s open unemployment rate rose for the first time since 2009 and only the second time since 2002. Specifically, the weaker generation of wage employment dragged the urban employment rate down by 0.3 percentage points. One consequence of lower job creation has been an increase in own-account work, to the detriment of employment quality. The unemployment rate in 2015 stood at 7.4%, up sharply from 7.0% in 2014.1
The main regional labour indicators continued to worsen during the first quarter of 2016. A new year-on-year fall in the employment rate was estimated for a group of 12 countries —the eighth consecutive quarterly deterioration. Meanwhile, a year-on-year surge in the labour market participation rate led to a marked upturn in the region’s urban unemployment rate and a deterioration in the employment structure caused by the rise in own-account work. However, a clear difference was observed between South American countries, which generally reported worsening labour indicators, and Mexico and the Central American countries, where these indicators were more favourable. The trends observed in early 2016 are expected to continue for the rest of the year, with
1 The employment rates given here do not match the figures published by ECLAC in Preliminary Overview of the Economies of Latin America and the Caribbean, 2015, owing to methodological changes.
17Economic Survey of Latin America and the Caribbean • 2016 Executive summary
the region’s unemployment rate set to rise by about 0.7 percentage points, taking the unemployment rate to approximately 8.1%.
Meanwhile, in early 2016, countries with available information reported that the rate of real wage growth had slowed by 1% (with real wages falling outright in Brazil and Colombia), which —along with weak job creation— accounts for the sluggishness of household consumption.
The capacity of the region’s countries to invigorate economic growth depends on the space available to them to adopt policies in support of investment, which will be crucial for mitigating the impact of external shocks and avoiding major consequences for their medium- and long-term economic performance. These policies should coincide with efforts to strengthen public-private partnerships for investment.
In the fiscal sphere, the average overall deficit of Latin American countries at the central government level widened to 3.0% of GDP in 2015. The deficit trend reflects varying combinations of falling tax revenues, increased public spending and debt service payments. In most countries, fiscal adjustment led to a sharp reduction in capital expenditure, which in turn has weighed on public investment. With a few exceptions, the public-debt-to-GDP ratio of Latin American countries remained stable at about 30%, although borrowing by State-owned enterprises has risen in some instances.
Preliminary figures for 2016 suggest a continuation of the public income and expenditure trends observed in 2015. In the first quarter of 2016, public revenues continued to shrink; however, public spending was reined in by an even greater margin, leading to an improvement in the overall balance by an average of 0.2 percentage points of GDP.
In the English-speaking Caribbean, central government public debt stood at 73.4% of GDP in 2015. Of the 13 countries analysed, 8 increased their borrowing levels. Jamaica had the highest level of public debt in the subregion (121.7% of GDP), although it was also among the countries with the largest reductions, equivalent to 6 percentage points of GDP since 2014. There was an increase in public debt servicing in 2015; Jamaica’s interest payments amounted to 7.8% of GDP.
With regard to monetary policy, the inflation patterns observed in 2015 and early 2016 determined the actions taken by monetary authorities. The economies of the north of the region —which have lower inflation rates— enjoyed greater margin for applying monetary policies to boost aggregate demand, while this policy space narrowed in the countries of the south.
Movements in monetary policy interest rates or monetary aggregates on average translated to a slowdown in domestic lending, which had a negative impact on domestic demand, particularly consumption and investment.
As in 2015, the region’s currencies continued to depreciate against the dollar in the early part of 2016, with exchange rates remaining at high levels, although the currencies of Brazil, Chile, Colombia, Paraguay and Peru have regained some ground since December 2015. Other countries whose currencies lost value in 2015, such as Argentina and Uruguay, suffered further depreciation in early 2016. Between December 2014 and May 2016, all of the region’s currencies monitored by ECLAC, except that of the Plurinational State of Bolivia, posted nominal depreciation against the dollar. In seven of these countries, nominal currency depreciation topped 20%: Argentina (68.4%), Brazil (34.1%), Haiti (32.2%), Uruguay (30.9%), Colombia (27.1%), Paraguay (20.3%) and Mexico (20.1%).
Shrinking trade surpluses and the spike in exchange-rate volatility caused a 5% fall in the international reserves held by the countries of the region in 2015. However,
18 Economic Commission for Latin America and the Caribbean (ECLAC)Executive summary
reserves picked up 1.8% in the first four months of 2016, compared with year-end 2015, though they remained below 2014 levels. Reserves decreased in 11 economies during this period, and by more than 10% in the Bolivarian Republic of Venezuela, Suriname and Uruguay. Conversely, 15 economies managed to consolidate their international reserves, with five countries (Argentina, the Bahamas, El Salvador, Panama and Paraguay) posting increases of more than 10%.
As mentioned above, inflation patterns determined the monetary policy space. For 2016, the inflation rate is expected to remain in a similar range to that of 2015, when inflation eased in the economies of the north of the region and quickened in those of the south. On average for the region (excluding Argentina and the Bolivarian Republic of Venezuela), cumulative 12-month inflation stood at 6.1% in April 2016, compared with 6.4% in December 2015.
B. Invigorating growth and the challenges of financing for development
As stated previously, the region’s growth pattern reflects, on the one hand, the uncertainties and negative shocks proceeding from the global economy and, on the other, a sharp fall in domestic consumption and investment. Returning to a growth path will require the reversal of these trends through an emphasis on investment, which will require a significant mobilization of financial resources.
The growing difficulty faced by the countries of the region in financing a countercyclical fiscal policy, together with their status as middle-income countries (which makes it harder to access concessional external financing or to benefit from international cooperation), means that mobilizing external and domestic resources for investment is a near-term policy priority.
In that context, the thematic chapters in this edition of the Economic Survey of Latin America and the Caribbean concentrate on the challenges encountered by Latin American and Caribbean countries in mobilizing financing for development from domestic and external perspectives.
Chapter II looks at the impact of the change in the economic cycle on public finances, including the drop in tax and non-tax revenues and the gradual rise in public borrowing, which together have eroded the fiscal space available for financing efforts to meet the Sustainable Development Goals.
It is argued that regaining that space would require comprehensive and sustained reforms to public finances to ensure public sector solvency, protect investment, safeguard achievements on the social front, and broaden tax resources.
Estimates are provided suggesting that fiscal multipliers are high and significant in the region and that, in particular, the public investment multiplier exceeds 2 after two years. Indiscriminate cutting of public expenditure is highly prejudicial because it runs the risk of deepening recessionary conditions: it is thus essential to protect the key role played by public investment in the potential growth of the region’s economies.
In view of the unavoidable need to mobilize resources for financing for development and to ensure the fulfilment of the 2030 Agenda for Sustainable Development, the chapter reaffirms the need to change certain typical characteristics of the countries’ tax structures, namely: tax collection that is too low (with a few notable exceptions); a system that is not progressive because income tax is weak and the rates paid by the richest decile are extremely low; high evasion —estimated at 6.7 percentage points
19Economic Survey of Latin America and the Caribbean • 2016 Executive summary
of regional GDP— and tax bases that have been eroded by the proliferation of tax incentives. These factors all highlight the importance of strengthening income taxation.
Chapter III examines tax evasion in relation to the external linkages of the region’s countries. The more a country is engaged in the world economy, the greater the potential erosion of its tax base. There are essentially three sources of this erosion: the burgeoning of tax incentives; profit shifting and aggressive tax planning; and illicit financial flows arising from international trade and capital movements.
The current capacity of multinational and transnational firms to develop aggressive tax planning and profit shifting mechanisms lessens countries’ ability to retain fiscal revenues that could be used to finance development processes or to deploy redistributive policy tools to achieve social equality and overcome poverty.
The fiscal losses associated with evasion and avoidance around the world are striking. The Organization for Economic Cooperation and Development (OECD) and the United Nations Conference on Trade and Development (UNCTAD) estimate that evasion amounts to between US$ 100 billion and US$ 240 billion per year, equivalent to between 4% and 10% of the corporate income tax take. ECLAC estimates show that the region’s gross trade misinvoicing outflows increased by about 9% a year on average in the period 2004-2013, totalling US$ 765 billion or about 1.8% of regional GDP. The region’s tax losses associated with these flows stood at about US$ 31 billion in 2013 (0.5 percentage points of GDP), equivalent to between 10% and 15% of the corporate income tax take for that year.
Chapter IV notes that the external development finance scene has changed considerably over recent decades in terms of the array of agents providing financing, the funding mechanisms used and the composition of financial flows. There has been a clear fall-off in official development assistance (ODA) flows to the countries of the region, with private flows becoming the main source of financing for these economies. Chief among these is foreign direct investment (FDI), whose value in 2014 equated to approximately 2.6% of Latin America’s GDP, accounting for over 60% of total flows into the region. Remittances and portfolio investment inflows were equivalent to about 1.0% and 1.5% of GDP, respectively.
The reliance on private funds raises significant issues for development finance. First, not all countries have the same access to external financing sources. The degree to which a country or set of countries can access private sector financing depends on a number of factors, including size of the economy; perceived risk (in some cases reflecting the country’s macroeconomic record); the production structure; the state of infrastructure; and the education and specialization level of the workforce. Second, private sector flows, including FDI, are procyclical and sometimes highly volatile, which can amplify business cycle fluctuations. Third, the behaviour of private capital flows reflects the fact that they are mainly profit-driven, which can mean that investment is inadequate in areas crucial to sustainable development, such as poverty reduction or infrastructure improvements, if the expected risk-adjusted return is unsatisfactory relative to alternative investment opportunities.
Channelling and matching private capital to sustainable development needs means creating incentives that can attract private investment into areas where it meets the production and development requirements of the economies of Latin America and the Caribbean. This must involve government action to design appropriate incentives, which means including social returns in cost-benefit analyses, supplying public financing to sectors that generate significant social benefits but do not attract enough private-sector funds, maintaining risk-return profiles that are attractive to private capital and directing this capital towards development objectives, and creating appropriate legal frameworks.
20 Economic Commission for Latin America and the Caribbean (ECLAC)Executive summary
Chapter V studies financial inclusion in the countries of the region, and argues that inclusiveness is a prerequisite for financial systems to work in favour of sustainable economic and social development. In non-inclusive financial systems, small businesses and low-income persons are unable to access financial services; these systems also exhibit wide gender gaps in terms of their access and use.
Financial innovation may serve as a catalyst for the financial inclusion of households and businesses through the greater densification of the financial system. In the policy sphere, this means fostering innovation by introducing new skills, capacities and procedures to increase efficiency, including technological and methodological improvements and changes in forms of intermediation. There is also a need to develop new financial products to meet demand from households and companies.
Strengthening financial inclusion through innovation requires an effort to coordinate public and private agendas in respect of development goals and priorities. Spaces and mechanisms should therefore be created so that public policies can attract and channel private sector endeavours, with the right context and incentives, towards achieving inclusive development goals.
In that regard the presence of development banks should be reinforced, since they increase the availability of and access to financing sources and mechanisms for business, and are capable of deploying them according to the requirements, characteristics and risks inherent to different production activities.

IPART
The economic situation and outlook for 2016


ICHAPTER
Regional overviewA. The external context
B. The external sector
C. Domestic performance
D. Macroeconomic policy
Bibliography

25Chapter IEconomic Survey of Latin America and the Caribbean • 2016 IA. The external contextGlobal economic growth will continue to be lacklustre in 2016. Growth in developed countries, which was already weak, is set to slow, while developing countries on average are not expected to see any further deterioration in their growth rates, though they will remain lower than in the years before the economic crisis. For the rest of 2016, commodity prices are expected to remain close to the levels seen at the end of the first half, with no significant changes. Brexit1 has created new uncertainty and risks against the backdrop of an already vulnerable global economy and has resulted in lower —albeit not significantly— growth projections for Europe and the global economy this year. International financial markets are therefore likely to remain volatile. The main features observed in the international context that have affected and that will continue to affect the region’s economic performance for the rest of 2016 will now be described.
1 On 23 June 2016 the United Kingdom held a referendum on membership of the European Union, in which the majority voted to leave (“Brexit”).
1. Continued low levels of global economic growth are projected for 2016 —about 2.4%, similar to the rate in 2015— with developed countries set to grow more slowly and developing economies likely to maintain similar levels of growth to 2015
The world economy grew by 2.4% in 2015. Developing countries continued to grow much more strongly than developed economies (3.8% versus 1.9% in 2015) despite a downward trend in the past few years and a marked deceleration in 2015. The position of China within this group is significant, as growth rates there have been declining steadily and in 2015 they fell below 7% for the first time since 1990 (6.9%).
Table I.1 GDP growth 2013-2015 and projections for 2016-2017(Percentages)
2013 2014 2015 2016 2017
World 2.3 2.6 2.4 2.4 2.8
United States 1.5 2.4 2.4 2.0 2.1
Japan 1.6 -0.1 0.5 0.5 0.5
Eurozone -0.3 0.9 1.7 1.5 1.0
Transition economies 2.1 0.9 -2.8 -1.2 1.1
Russian Federation 1.3 0.6 -3.7 -1.9 0.6
Developing countries 4.6 4.4 3.8 3.8 4.4
India 6.5 7.2 7.3 7.3 7.5
China 7.7 7.3 6.9 6.4 6.5
Africa 3.3 3.8 3.0 2.8 3.4
Source: Economic Commission for Latin America and the Caribbean (ECLAC), on the basis of United Nations, World Economic Situation and Prospects 2016, December 2015; World Economic Situation and Prospects 2016, Update as of mid-2016, Department of Economic and Social Affairs, New York, 2016; and Latin American Consensus Forecasts, 28 June 2016.
Global economic growth is expected to hold steady in 2016, similar to the level seen in 2015 (2.4%). This is a sharp downward revision (half a percentage point) of the forecast made just a few months ago, in December 2015. Though the projections

26 Chapter I Economic Commission for Latin America and the Caribbean (ECLAC)
have been lowered for both developed and developing economies, the reduction was greater for the latter.
Developing economies are expected to grow by 3.8% in 2016 —the same rate as in 2015, which was the lowest recorded since the 2009 global financial crisis and half a percentage point below the forecast made in December 2015. The main growth drivers in this group include India (which is forecast to grow by 7.3%) and other emerging Asian economies, apart from China, which is expected to see its pace of growth drop to 6.4%. In the first quarter of 2016 China’s growth decelerated slightly to 6.7% compared with the year-earlier period.2
At the end of June, Brexit resulted in lower forecasts for growth (much lower for 2017 than 2016) in some of the major developed economies (eurozone and the United States), in addition to the United Kingdom.3
The growth rate of 2.0% projected for the United States in 2016 is much lower than that for 2015, but should provide momentum in relative terms, given that the country is expected to outperform the eurozone and Japan once again.
Growth in the eurozone is expected to come to 1.5% in 2016, also lower than the 2015 figure, while Japan’s growth is set to remain sluggish, at around the level seen in 2015 (0.5%).
2. World trade is still languishing at levels lower than before the global financial crisis
World trade volume growth rates are still languishing at levels lower than before the global financial crisis. Indeed, trade growth has not exceeded 5% since 2011 (see figure I.1). This is the longest period of growth below 5% since the data series began in the 1980s.
In 2015 world goods trade grew by about 2.8% in volume, while at the start of 2016 there were signs that trade momentum remained weak. According to the Netherlands Bureau of Economic Policy Analysis (CPB), in the first three months of 2016 world merchandise trade volume fell by 1% compared with the year-earlier period.
This fall was attributable to low volumes of exports from the emerging countries of Asia, Japan and the United States where year-on-year growth rates in the first quarter of 2016 were already negative (between -2% and -4%).
Given the sluggish global economic trends expected to persist in 2016, goods trade volumes are unlikely to improve and are expected to continue to grow at similar levels to 2015.
2 In the last quarter of 2015 China had grown by 6.9% compared with the year-earlier period.3 See Latin American Consensus Forecasts, 28 June 2016.

27Chapter IEconomic Survey of Latin America and the Caribbean • 2016
Figure I.1 World: seasonally adjusted year-on-year trade volume growth, first quarter of 2006 to fourth quarter of 2015(Percentages)
7.0%
2.4%
-20
-15
-10
-5
0
5
10
15
20
2006 2007 2008 2009 2010 2011 2012 2013 2014 2015 2016
Trade growth has not exceeded5% since 2011
Sluggish growth in global trade is expected to persist.
Q1 Q2 Q3 Q4 Q1 Q2 Q3 Q4 Q1 Q2 Q3 Q4 Q1 Q2 Q3 Q4 Q1 Q2 Q3 Q4 Q1 Q2 Q3 Q4 Q1 Q2 Q3 Q4 Q1 Q2 Q3 Q4 Q1 Q2 Q3 Q4 Q1 Q2 Q3 Q4Source: Economic Commission for Latin America and the Caribbean (ECLAC), on the basis of figures provided by the World Trade
Organization (WTO).
3. Financial markets were off to a volatile start in 2016 but began stabilizing in February
Financial markets were off to a volatile start in 2016 (see figure I.2A). The main contributing factors, as seen during the period of significant volatility in August 2015, were events in China. The markets overreacted when manufacturing activity indicators were published and revealed a sharper-than-expected deceleration. In one day (4 January 2016), the Shanghai Stock Exchange Index tumbled by almost 7% and the yuan plunged. The panic spread to stock markets in developed and emerging countries (see figure I.2B) and to commodity prices, which plummeted; the price of oil, for instance, fell to its lowest level in 12 years.4
Volatility eased as the months went by. There were positive signs that Chinese economic growth was beginning to stabilize and, though it continues to slow, there has been no hard landing. In March the government published its five-year plan for 2016-2020, which outlines growth of more than 6.5% per year during the period, and China’s growth figures in the first quarter were perfectly aligned with this estimate (growth of 6.7% compared with the year-earlier period).5
4 The Chinese authorities responded with various measures, including a temporary halt in trading, but these measures had the opposite effect of that intended, as they increased fears and triggered massive asset sales and further declines in share prices.
5 The Chinese authorities also injected liquidity into the economy and reduced reserve requirements in order to help it gain momentum.

28 Chapter I Economic Commission for Latin America and the Caribbean (ECLAC)
Figure I.2 Financial market volatility and stock market indices
0
10
20
30
40
50
60
Jan
Feb
Mar Apr
May Jun
Jul
Aug
Sep
Oct
Nov De
c
VIX index V2X index (EURO STOXX) VXEEM index (emerging markets)
70
75
80
85
90
95
100
105
110
115
3 Au
g
28 A
ug
22 S
ep
17 O
ct
11 N
ov
6 De
c
31 D
ec
25 J
an
19 F
eb
15 M
ar
9 Ap
r
4 M
ay
29 M
ay
23 J
un
Shanghai Stock Exchange Index, China Nikkei Index, JapanSTOXX Europe 600 Index, EuropeS&P 500 Index, United States
2014
Jan
Feb
Mar Apr
May Jun
Jul
Aug
Sep
Oct
Nov De
c
2015 2016
Jan
Feb
Mar Apr
May Jun
Jul
2015 2016
A. Financial market volatility B. Stock market indices (3 August 2015=100)
Source: Economic Commission for Latin America and the Caribbean (ECLAC), on the basis of Bloomberg.Note: The VIX index is prepared by the Chicago Board of Exchange (CBOE) from S&P call and put option prices, and measures expected volatility over the next 30 days.
Following the same logic, the CBOE also produces the VXEEM index, which measures volatility in emerging markets, while Deutsche Börse and Goldman Sachs produce the V2X index, which measures eurozone volatility.
The monetary policy decisions of the European Central Bank (ECB) and the Bank of Japan also helped soothe the markets. The Bank of Japan lowered its benchmark rate to -0.1% at the end of January, while the ECB once again extended its quantitative easing programme at its meeting in early March 2016.6
The United States Federal Reserve, for its part, has so far refrained from raising its benchmark rate at its meetings in 2016.
Although Brexit roiled the financial markets once again (see box I.1), the turmoil was short-lived (see figures I.2A and I.2B).
As discussed below, major risks remain for the world economy in a number of areas, and uncertainty and volatility could resurface on financial markets in the second half of the year.
6 It reduced its monetary policy rate to zero and also lowered the interest rate on banks’ deposits in the ECB (from an already negative rate of -0.3% to -0.4%), which means that banks now have to pay more to hold deposits in the ECB. The ECB also increased monthly purchases of securities under its quantitative easing programme to US$ 22 billion and these purchases now include investment grade non-bank corporate bonds. For a description of this programme see ECLAC, 2015.

29Chapter IEconomic Survey of Latin America and the Caribbean • 2016
4. Energy and metals posted the sharpest price declines among commodities; prices for the rest of the year are set to remain close to the levels seen in mid-2016, without significant changes
After declining sharply in 2015, commodity prices continued to slide at the beginning of 2016. The price of crude oil —the largest component of the energy product category— averaged less than US$ 30 per barrel in January 2016, down almost 20% compared with the previous month,7
and at the lowest level seen in 12 years. The above-mentioned events in China and the subsequent market jitters contributed significantly to the decline.
Commodity prices began to pick up in February 2016 as financial market volatility diminished (see figure I.3), reportedly due to various factors including the depreciation of the dollar since the beginning of the year and specific oil supply problems for three major producers, namely Canada, Iraq and Nigeria.8
However, prices improved as of February despite the fact that most markets are expected to face a glut in 2016, which suggests that the recovery is due to other factors and is probably linked to expectations and speculative factors, as mentioned in previous ECLAC publications.
Figure I.3 International commodity prices, January 2003 to June 2016(Monthly averages, January 2011=100)
Price changeFirst half of 2016/First half of 2015
0
20
40
60
80
100
120
140
160
Jan
2003
Aug
200
3
Mar
200
4
Oct 2
004
Ma y
200
5
Dec
200
5
Jul 2
006
Feb
2007
Sep
2007
Apr
200
8
Nov
200
8
Jun
2009
Jan
2010
Aug
201
0
Mar
201
1
Oct 2
011
Ma y
201
2
Dec
201
2
Jul 2
013
Feb
2014
Sep
2014
Apr
201
5
Nov
201
5
Jun
2016
Energy productsa
0%
-4%
-18%
-31%
Agricultural products
Base metals and minerals
Precious metals
Source: Economic Commission for Latin America and the Caribbean (ECLAC), on the basis of World Bank Commodity Price Data (Pink Sheet).
a Includes oil, natural gas and coal.
7 Calculations are based on the average price of West Texas Intermediate (WTI), Brent and Dubai oil, according to the World Bank’s monthly Commodity Price Data (Pink Sheet).
8 Moreover, the crude oil industry took on significant debt when prices were soaring and many companies are now over-indebted, selling off assets and filing for bankruptcy, which is also helping reduce supply to a certain extent.

30 Chapter I Economic Commission for Latin America and the Caribbean (ECLAC)
For the remainder of 2016, commodity prices are expected to stick close to the levels seen in mid-2016, with no significant changes. This stable trend until the end of the year implies that average prices will fall in 2016 compared with 2015. For example, crude oil is expected to decline by 21% compared with 2015, copper by 13%, iron ore by 23% and soybean flour by 14%.
This trend and its impact on the region’s export and import prices are discussed in chapter I, section B.
5. Uncertainty is likely to persist for the rest of the year in view of various remaining risks
As significant risks remain for the global economy on various fronts, uncertainty is likely to persist for the rest of the year. First, there are risks stemming from the future performance of the Chinese economy, which would have a direct impact on aggregate global demand and also demand for commodities. Though at present (mid-2016) there does not seem to be any evidence of the Chinese economy heading for a hard landing, there are various medium-term risks for the health of the financial sector. The Chinese authorities’ efforts to stimulate the economy have led to significant levels of corporate leverage, and debt in this sector alone already stands at around 170% of GDP. Add to this debt for the public sector (44% of GDP) and the housing sector (39% of GDP), and China’s debt is equivalent to 250% of GDP. The Chinese financial system is exposed to a growing proportion of non-performing loans and this situation will naturally continue to be aggravated by the government’s efforts to stimulate economic activity by increasing credit.9
In addition to the risks stemming from China, an equally important issue is developed countries’ inability to stimulate economic growth. Despite expansionary monetary policies of low interest rates and quantitative easing, the results are still not satisfactory and growth rates continue to be low, particularly in Japan. Moreover, monetary policy is being used as the stimulus tool, while fiscal policy has become more contractionary. It has been argued on a number of occasions that some developed economies with greater fiscal space should balance their tools and policies more evenly between fiscal and monetary stimulus (see, for example, United Nations, 2016).
In any case, and despite its greater or lesser effectiveness, monetary stimulus is expected to continue in 2016, given that the European Union and Japan are pursuing expansionary monetary policies and are not expected to change course in the short term.
In the United States on the other hand, projections for interest rate hikes have been pushed out to the medium term. Though global liquidity is not likely to be restricted significantly in the short term, there could be portfolio adjustments as a result of possible rate hikes by the Federal Reserve.
Lastly, Brexit has raised new questions and risks against the backdrop of an already vulnerable global economy (see box I.1).
In light of these uncertainties, financial markets are expected to remain volatile for the rest of the year.
9 Moreover, there is a “shadow” financial system subject to limited regulation and for which loans have grown by 30% per year over the past three years and about which not much is known (The Economist, 2016). The China Banking Regulatory Commission is evaluating ways of removing part of the non-performing portfolio from banks’ balance sheets by securitizing them and selling them to international investors. See Financial Times (2016).

31Chapter IEconomic Survey of Latin America and the Caribbean • 2016
Box I.1 Economic implications of Brexit for Latin America and the Caribbean
News of the outcome of the referendum on the United Kingdom’s membership of the European Union (the vote to leave triggers the process known as “Brexit”) was swiftly followed by a spike in financial market volatility. Share prices plunged, with European bank stocks taking the heaviest losses. Commodity prices also fell sharply, led by oil, which slid by 4.6% in one day. Sterling tumbled to its lowest level against the dollar since 1985, while the euro suffered one of its steepest one-day falls since its introduction in 1999.
Meanwhile, amid growing signs of financial market illiquidity, the major central banks were forced to signal their readiness to provide the liquidity needed to support the orderly functioning of financial systems. In particular, the Bank of England announced the availability of a very large line of liquidity, equivalent to 12% of the United Kingdom’s GDP.
As a result, most of the stock-market losses were recovered over the following days, and volatility eased to pre-referendum levels.
Aside from these short-term impacts, Brexit has created new uncertainties and presents longer-term risks related to the growth of the United Kingdom and the world economy in general, which may materialize through the trading relations of that country.
The news of Brexit comes during a period of sluggish growth in a global economy that was already looking vulnerable. Brexit may cause an even sharper slowdown as the process advances.
In the United Kingdom specifically, repercussions for growth will depend chiefly on the withdrawal conditions that it negotiates with the rest of the European Union. The incoming administration will be responsible for triggering exit negotiations, a process that will last for up to two years,a and which will establish the terms of separation and new agreements that will govern future relations between the United Kingdom and the European Union. Some estimates suggest that the British economy could lose 8 points of GDP growth by 2030 as a result of Brexit (BBVA, 2016).
From the perspective of Latin America and the Caribbean, the impacts of Brexit are related to short- and long-term factors.
Ongoing uncertainty during the rest of 2016 means that volatility can be expected to continue in international financial markets, and that processes of flight to quality may be repeated in a scenario of increased risk aversion at the global level.
Should this be the case, one initial short-term impact on Latin America and the Caribbean could be the reduced availability of external financing, as has occurred in previous periods of heightened financial volatility as investors plump for safe haven assets.
A second impact on the region could stem from steeper commodity price falls than previously envisaged. This would have a renewed impact on the terms of trade of commodity-exporting countries, which already suffered significant losses in this regard in 2015.
Looking to the medium term, the economic effects of Brexit could emerge from the trade channel and from economic growth. In this regard, it is thought that even if Brexit were to weigh on economic growth in the United Kingdom, the direct impact on Latin America and the Caribbean should not be too great, since trade links with that country are weak (only 1% of the region’s exports go to the United Kingdom).b
However, the indirect impacts that may materialize owing to the impacts on the economic growth of Latin America’s other trading partners are more difficult to gauge. In that sense, how Brexit will affect growth in Europe, the United States and the world economy in general, remains an open question.
Source: Economic Commission for Latin America and the Caribbean (ECLAC).a The negotiation period may be extended only by unanimous agreement of all European Union member countries.b The countries of the English-speaking Caribbean are more exposed to trade-related risks. For example, the United Kingdom receives
45% of exports from Belize and 11% of exports from Guyana.

32 Chapter I Economic Commission for Latin America and the Caribbean (ECLAC)
B. The external sector
1. The region’s export commodity prices, particularly in the energy sector, are expected to fall in 2016, but by less than they did in 2015
The fall in commodity prices mentioned in the analysis on the international context has been reflected in the decline in the average prices for which the countries of Latin America and the Caribbean export those products. According to the export commodity price index compiled by ECLAC,10 prices fell by 29% on average in 2015, with the following variations by sector: prices for energy products were down by 42%, metals and minerals by 23% and agricultural products by 16%.
Prices fell sharply in early 2016, but began to pick up again from February. Nevertheless, even if prices remain at similar levels to those seen in the second quarter of the year, average prices for 2016 will still be lower than the average for 2015 (see figure I.4). Prices for energy-related products are expected to decrease by around 20%, minerals by 9% and agricultural products by 5%. These falls, though substantial in the case of energy products, for example, were not as great as those seen in the previous year.
10 The ECLAC regional export commodity price index is based on international market prices for these commodities and the weighting of product groups according to their share of the regional export basket.
Figure I.4 Latin America and the Caribbean: annual changes in export commodity price indices, 2015, and projections for 2016(Percentages)
-16 -15
-21 -22
-6
-23
-42-47
-27
-18
-40
-29
-19
-5 -5 -4-9
-6-4
-9
-20 -21 -20
-13
-20
-12
-5
Agricultural commodities
Food, tropical beveragesand oil products
FoodTotal TotalTotal Total TotalTropicalbeverages
Oil andoilseeds
Agriculturalandforestry-relatedraw materials
Minerals and metals
Energy commodities
Crudeoil Derivatives Coal
Naturalgas
CommoditiesCommodities excluding energy
TotalTotal
-18
20152016
20152016
201520162015
2016
20152016
Source: Economic Commission for Latin America and the Caribbean (ECLAC), on the basis of official figures and projections by Bloomberg, the Economist Intelligence Unit, World Bank and International Monetary Fund (IMF), World Economic Outlook.

33Chapter IEconomic Survey of Latin America and the Caribbean • 2016
2. The terms of trade for South America and Mexico are expected to deteriorate, although less than they did in 2015, while they will improve for Central America and the Caribbean
As expected, the impact of the aforementioned trend in prices on the terms of trade is uneven and depends on the weight of different commodities in the export and import basket of each country.
Commodities account for more than half of exports from Latin America and the Caribbean, meaning that plunging commodity prices have had a major impact on the region’s average export prices. The worst deterioration in the terms of trade since 1986 occurred in 2015, worse even than the fall in 2009 caused by the global crisis.
The countries hardest hit were those whose exports are concentrated mainly in hydrocarbons (Bolivarian Republic of Venezuela, Colombia, Ecuador, Plurinational State of Bolivia and Trinidad and Tobago), as their terms of trade fell by 30%. They were followed by countries whose main exports are minerals and metals and agro-industrial products, whose terms of trade fell by 5% and 3%, respectively. These countries benefited to some extent from the lower oil prices. Brazil’s terms of trade declined by 11%, since several of the commodities whose prices have dropped significantly are heavily represented in the country’s export structure. The export price index fell by 22% in Brazil, where the price of iron, one of its main exports, fell sharply, as have the prices of food, such as soybeans, and, to a lesser extent, sugar and coffee. Although manufactured goods for the United States market account for a large share of its exports, Mexico is a net exporter of energy products —mainly crude oil— and was thus hit by the sharp fall in prices in this sector in 2015, leading to a 5% drop in its terms of trade.
By contrast, the change in commodity prices during 2015 benefited the Central American countries (including the Dominican Republic and Haiti) and the Caribbean countries (excluding Trinidad and Tobago). Their terms of trade improved by 6% and 1%, respectively, in 2015, as they are net importers of food and energy products —with the exception of Trinidad and Tobago— and thus the global drop in the prices of these commodities was to their advantage.
These trends are expected to continue in 2016, but with less intensity (see figure I.5).
Figure I.5 Latin America and the Caribbean (selected country groupings): changes in the terms of trade, 2012-2016a
(Percentages)
-9%-11%
-5%
-3%
-5%
6%
-30%
1%
-3% -3% -2% -2% -1%
1%
-14%
2%
-30
-15
-10
-5
0
5
10
Latin America Brazil MexicoCentral America,Dominican Rep.
and HaitiThe Caribbeane
Countriesexporting
miningcommoditiesb
Countriesexporting
agro-industrialcommoditiesc
Countriesexporting
hydrocarbonsd
2012 2013 2014 2015 2016
Source: Economic Commission for Latin America and the Caribbean (ECLAC), on the basis of official figures.a The figures for 2016 are projections.b Chile and Peru.c Bolivarian Republic of Venezuela, Colombia, Ecuador, Plurinational State of Bolivia and Trinidad and Tobago.d Argentina, Paraguay and Uruguay.e Excluding Trinidad and Tobago.

34 Chapter I Economic Commission for Latin America and the Caribbean (ECLAC)
3. Latin American goods exports and imports plunged in 2015 and are expected to continue to fall, albeit at a slower rate, in 2016
In 2015, the value of Latin American goods exports and imports fell by 15% and 11%, respectively (see figure I.6), the largest declines seen since 2009, when the value of exports plummeted by 22% and the value of imports by 25%.
Figure I.6 Latin America (19 countries): changes on the previous year in goods exports and imports by value, 2015(Percentages)
-11%-15%
-60 -50 -40 -30 -20 -10 0 10
Haiti
El Salvador
Costa Rica
Honduras
Guatemala
Dominican Rep.
Mexico
Nicaragua
Uruguay
Peru
Brazil
Paraguay
Panama
Chile
Argentina
Ecuador
Bolivia (Plur. State of)
Colombia
Venezuela (Bol. Rep. of)
Latin America
Imports Exports
Source: Economic Commission for Latin America and the Caribbean (ECLAC), on the basis of official figures.
35Chapter IEconomic Survey of Latin America and the Caribbean • 2016
The drop in the value of exports was entirely the result of falling prices, as, in terms of volume, exports increased by almost 3% in 2015. Hydrocarbon-exporting South American countries, hard hit by the drop in their export prices, saw sharp declines in the value of their exports: 50% in the case of the Bolivarian Republic of Venezuela, more than 30% in Colombia and the Plurinational State of Bolivia, and 28% in Ecuador. In other South American countries, both exporters of mining products (Chile and Peru) and exporters of agro-industrial products (Argentina, Brazil, Paraguay and Uruguay), the effect of lower export prices was somewhat less intense: the value of their exports fell by between 12% and 17%.
Disparate behaviour among Central America countries was the result of their different national situations. In Panama, exports fell by 17% in 2015, owing mainly to the 12.5% decline in re-exports from the Colón Free Trade Zone; while in the Dominican Republic, Guatemala and Nicaragua lower prices were the biggest factor behind the drop in the value of exports. Meanwhile, exports from Haiti grew by 7% and those from Costa Rica and El Salvador increased slightly by around 3%.11
Exports from all the subregions appear to be improving in 2016, as they are falling at ever slower rates or are even starting to show signs of positive growth (see figure I.7). This can be explained by the depreciation of several of the region’s currencies and, in the case of Central America, the stable growth of the United States economy, which is the main destination of exports from this subregion.
Figure I.7 Latin America (selected country groupings): year-on-year changes in exports by value, three-month moving averages, January 2013 to April 2016(Percentages)
-30
-25
-20
-15
-10
-5
0
5
10
Jan
Feb
Mar Apr
May Jun
Jul
Aug
Sep
Oct
Nov
Dec
Jan
Feb
Mar Apr
May Jun
Jul
Aug
Sep
Oct
Nov
Dec
Jan
Feb
Mar Apr
May Jun
Jul
Aug
Sep
Oct
Nov
Dec
Jan
Feb
Mar Apr
2013 2014 2015 2016
Latin America (14 countries)b
Southern Common Market(MERCOSUR)
Andean countriesc
Central Americaa
Mexico
Source: Economic Commission for Latin America and the Caribbean (ECLAC), on the basis of official figures.a Costa Rica, El Salvador, Guatemala and Nicaragua.b Argentina, Brazil, Chile, Colombia, Costa Rica, Ecuador, El Salvador, Guatemala, Mexico, Nicaragua, Paraguay, Peru, Plurinational
State of Bolivia and Uruguay.c Chile, Colombia, Ecuador, Peru and Plurinational State of Bolivia.
11 The methodological change in the sixth edition of the Balance of Payments and International Investment Position Manual published by the International Monetary Fund has isolated the effect of Intel’s decision to pull some operations out of Costa Rica. When calculated using the old methodology, total exports fell by 15% in 2015.

36 Chapter I Economic Commission for Latin America and the Caribbean (ECLAC)
The fall in commodity prices will continue to drag down regional exports in 2016. As the projected 3% growth in volume will not be enough to offset the 6% fall in prices, Latin American exports could be down by 3% this year (see figure I.8).
Figure I.8 Latin America (selected country groupings): projected changes in goods export volumes and prices, 2016(Percentages)
-6%-7%-7%-5%-4%
-2%
-17%
3%
8%
1%
8%
3%
-2%-3%
-20
-15
-10
-5
0
5
10
LatinAmerica
BrazilMexicoCentral America,Dominican Rep.
and Haiti
Countriesexporting
miningcommoditiesc
Countriesexporting
agro-industrialcommoditiesb
Countriesexporting
hydrocarbonsa
Volume Price
Source: Economic Commission for Latin America and the Caribbean (ECLAC).a Bolivarian Republic of Venezuela, Colombia, Ecuador, Plurinational State of Bolivia and Trinidad and Tobago.b Argentina, Paraguay and Uruguay.c Chile and Peru.
However, there are several factors, both internal and external, that could lead regional export projections to take a turn for the worse. First, the heavy dependency of some South American countries on the Brazilian market could have negative effects given the current situation in Brazil. While Brazil absorbed only about 4% of total exports from Latin America and the Caribbean in 2014, that figure was more than 20% for members of the Southern Common Market (MERCOSUR).The impact that lower Brazilian external demand may eventually have on MERCOSUR countries will depend on their ability to diversify their exports to other markets.
A second factor that could shift the downward projection of regional exports is countries’ exposure, direct and indirect, to China’s economy. Given the size of the country’s economy, its weight in global economic activity and its demand for raw materials, the health of China’s economy and the question of whether growth might slow more than forecast is a future latent risk.12
In addition to the indirect effect of Chinese demand on Latin America and the Caribbean through its impact on commodity prices, there is also a direct effect on the external demand of various Latin American countries, for which China is a very important export market. If exports account for a significant part of these countries’ economic activity, then their exposure to a slowdown is naturally greater (see figure I.9).
12 In 2015, China accounted for 15% of global GDP and 11.9% of world trade, used 12% of the world’s crude oil and was the largest consumer of most of the major metals and minerals (around 50% of global demand for iron, aluminium, copper and nickel came from China) (see [online] https://www.weforum.org/agenda/2015/09/china-king-of-commodity-consumption/).

37Chapter IEconomic Survey of Latin America and the Caribbean • 2016
Figure I.9 Latin America (16 countries): exports to China as a percentage of the total and total exports as a percentage of GDP(Percentages)
Argentina
Bolivia (Plur. State of)
Brazil
Chile
Colombia
Ecuador
Paraguay
Peru
Uruguay
El SalvadorGuatemala
Honduras
Mexico
Nicaragua
Panama
Dominican Rep.
0
10
10
20
30
40
50
0 5 15 20 25 30
Greater direct exposure to a slowdown
in China
Exports to China as a percentage of total exports
Expo
rts
as a
per
cent
age
of G
DP
Source: Economic Commission for Latin America and the Caribbean (ECLAC), on the basis of United Nations Commodity Trade Statistics Database (COMTRADE) and CEPALSTAT database.
With regard to imports, the combined effect of low commodity prices and lower import volumes (due to the effect of depreciating real effective exchange rate in several countries in the region and low levels of economic activity in most of them) explain the 11% fall in the value of imports seen in 2015.
Imports dropped in almost all Latin American countries, some by over 20%, as was the case in the Bolivarian Republic of Venezuela, Brazil and Ecuador. The economic slowdown in Brazil in 2015 led imports to fall by 25% in terms of value and 15% in terms of volume, with declines in all categories, particularly fuel (47%), durable consumer goods (30%), capital goods (22%), intermediate goods (20%) and non-durable consumer goods (14%). Imports fell by 22% in the Bolivarian Republic of Venezuela as the shortage of foreign currency caused an economic slump and importing difficulties, and also in Ecuador owing to the balance-of-payment safeguard policies in place and the economic slowdown.
Imports continued to fall sharply in the first months of 2016 as a result of the same factors as in 2015 (see figure I.10). However, total imports into Latin America are expected to fall by 7% for the whole of 2016 (much less than the previous year), owing to a 3% drop in import prices and a 4% decline in import volumes (see figure I.11).13
13 The smaller fall in the volume of imports in 2016 can be partly explained by the impact of countries, such as Argentina, where —as a result of relaxing existing restrictions on imports by the new government— the volume of imports has already seen double-digit growth rates in the first three months of the year compared with the same period in 2015.

38 Chapter I Economic Commission for Latin America and the Caribbean (ECLAC)
Figure I.10 Latin America (selected country groupings): year-on-year changes in imports by value, three-month moving averages, January 2013 to April 2016(Percentages)
-30
-25
-20
-15
-10
-5
0
5
10
15
Jan
Feb
Mar Apr
May Jun
Jul
Aug
Sep
Oct
Nov Dec
Jan
Feb
Mar Apr
May Jun
Jul
Aug
Sep
Oct
Nov Dec
Jan
Feb
Mar Apr
May Jun
Jul
Aug
Sep
Oct
Nov Dec
Jan
Feb
Mar Apr
2013 2014 2015 2016
Latin America (14 countries) b
Southern Common Market(MERCOSUR)
Andean countriesc
Central Americaa
Mexico
Source: Economic Commission for Latin America and the Caribbean (ECLAC), on the basis of official figures.a Costa Rica, El Salvador, Guatemala and Nicaragua.b Argentina, Brazil, Chile, Colombia, Costa Rica, Ecuador, El Salvador, Guatemala, Mexico, Nicaragua, Paraguay, Peru, Plurinational State of Bolivia and Uruguay.c Chile, Colombia, Ecuador, Peru and Plurinational State of Bolivia.
Figure I.11 Latin America (selected country groupings): projected changes in goods imports volumes and prices, 2016(Percentages)
-3%-4%
-5%
-3%-3%-3%
-4%
-20
-15
-10
-5
0
5
LatinAmericaBrazilMexico
Central America,Dominican Rep.
and Haiti
Countriesexporting
miningcommoditiesc
Countriesexporting
agro-industrialcommoditiesb
Countriesexporting
hydrocarbonsa
-4%
-15%
4%2%
1%
-13%
-3%
Volume Price
Source: Economic Commission for Latin America and the Caribbean (ECLAC).a Chile and Peru.b Argentina, Paraguay and Uruguay.c Bolivarian Republic of Venezuela, Colombia, Ecuador, Plurinational State of Bolivia and Trinidad and Tobago.
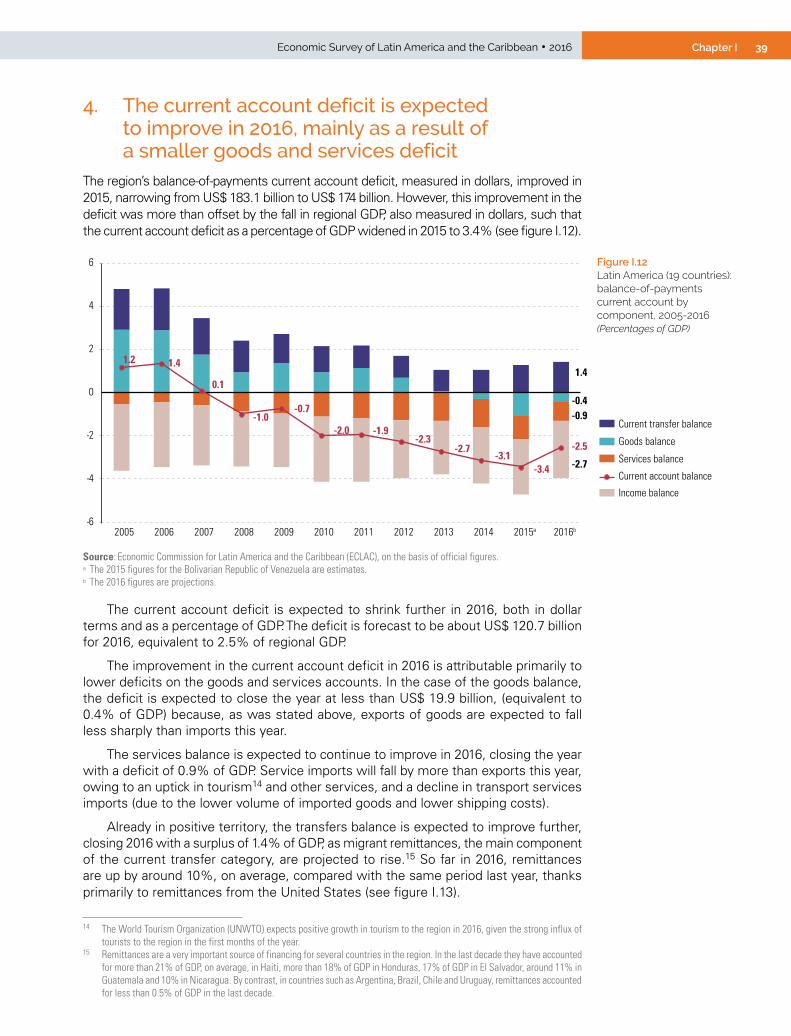
39Chapter IEconomic Survey of Latin America and the Caribbean • 2016
4. The current account deficit is expected to improve in 2016, mainly as a result of a smaller goods and services deficit
The region’s balance-of-payments current account deficit, measured in dollars, improved in 2015, narrowing from US$ 183.1 billion to US$ 174 billion. However, this improvement in the deficit was more than offset by the fall in regional GDP, also measured in dollars, such that the current account deficit as a percentage of GDP widened in 2015 to 3.4% (see figure I.12).
Figure I.12 Latin America (19 countries): balance-of-payments current account by component, 2005-2016(Percentages of GDP)
-0.4-0.9
-2.7
1.41.2 1.4
0.1
-1.0-0.7
-2.0 -1.9-2.3
-2.7-3.1
-3.4
-2.5
-6
-4
-2
0
2
4
6
2005 2006 2007 2008 2009 2010 2011 2012 2013 2014 2015a 2016b
Current transfer balance
Income balance
Services balance
Goods balance
Current account balance
Source: Economic Commission for Latin America and the Caribbean (ECLAC), on the basis of official figures.a The 2015 figures for the Bolivarian Republic of Venezuela are estimates.b The 2016 figures are projections.
The current account deficit is expected to shrink further in 2016, both in dollar terms and as a percentage of GDP. The deficit is forecast to be about US$ 120.7 billion for 2016, equivalent to 2.5% of regional GDP.
The improvement in the current account deficit in 2016 is attributable primarily to lower deficits on the goods and services accounts. In the case of the goods balance, the deficit is expected to close the year at less than US$ 19.9 billion, (equivalent to 0.4% of GDP) because, as was stated above, exports of goods are expected to fall less sharply than imports this year.
The services balance is expected to continue to improve in 2016, closing the year with a deficit of 0.9% of GDP. Service imports will fall by more than exports this year, owing to an uptick in tourism14 and other services, and a decline in transport services imports (due to the lower volume of imported goods and lower shipping costs).
Already in positive territory, the transfers balance is expected to improve further, closing 2016 with a surplus of 1.4% of GDP, as migrant remittances, the main component of the current transfer category, are projected to rise.15 So far in 2016, remittances are up by around 10%, on average, compared with the same period last year, thanks primarily to remittances from the United States (see figure I.13).
14 The World Tourism Organization (UNWTO) expects positive growth in tourism to the region in 2016, given the strong influx of tourists to the region in the first months of the year.
15 Remittances are a very important source of financing for several countries in the region. In the last decade they have accounted for more than 21% of GDP, on average, in Haiti, more than 18% of GDP in Honduras, 17% of GDP in El Salvador, around 11% in Guatemala and 10% in Nicaragua. By contrast, in countries such as Argentina, Brazil, Chile and Uruguay, remittances accounted for less than 0.5% of GDP in the last decade.
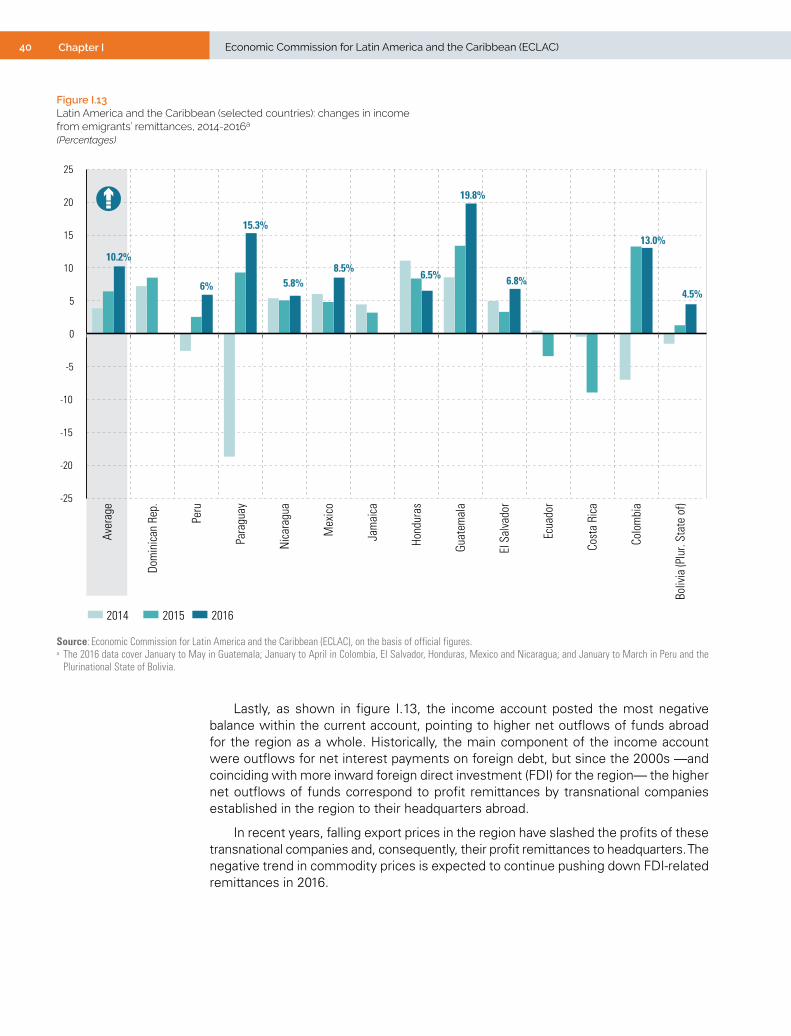
40 Chapter I Economic Commission for Latin America and the Caribbean (ECLAC)
Figure I.13 Latin America and the Caribbean (selected countries): changes in income from emigrants’ remittances, 2014-2016a
(Percentages)
4.5%
13.0%
6.8%
19.8%
6.5%8.5%
5.8%
15.3%
6%
10.2%
-25
-20
-15
-10
-5
0
5
10
15
20
25
Boliv
ia (P
lur.
Stat
e of
)
Colo
mbi
a
Cost
a Ri
ca
Ecua
dor
El S
alva
dor
Guat
emal
a
Hond
uras
Jam
aica
Mex
ico
Nic
arag
ua
Para
guay
Peru
Dom
inic
an R
ep.
Aver
age
201620152014
Source: Economic Commission for Latin America and the Caribbean (ECLAC), on the basis of official figures.a The 2016 data cover January to May in Guatemala; January to April in Colombia, El Salvador, Honduras, Mexico and Nicaragua; and January to March in Peru and the
Plurinational State of Bolivia.
Lastly, as shown in figure I.13, the income account posted the most negative balance within the current account, pointing to higher net outflows of funds abroad for the region as a whole. Historically, the main component of the income account were outflows for net interest payments on foreign debt, but since the 2000s —and coinciding with more inward foreign direct investment (FDI) for the region— the higher net outflows of funds correspond to profit remittances by transnational companies established in the region to their headquarters abroad.
In recent years, falling export prices in the region have slashed the profits of these transnational companies and, consequently, their profit remittances to headquarters. The negative trend in commodity prices is expected to continue pushing down FDI-related remittances in 2016.
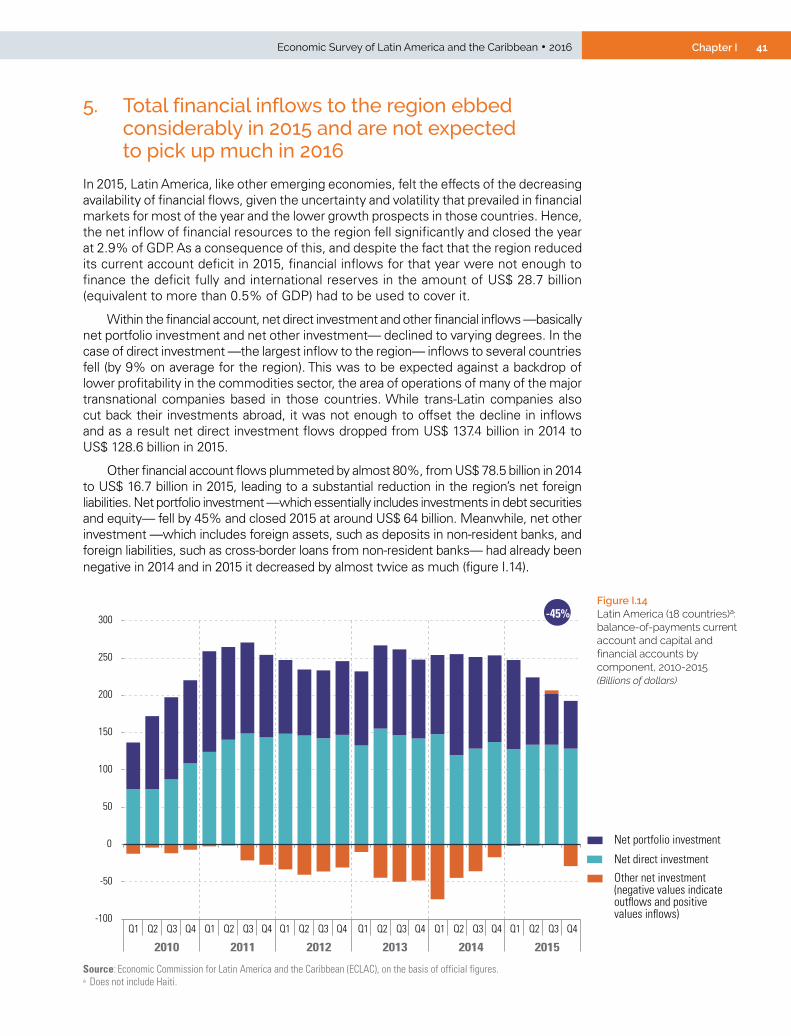
41Chapter IEconomic Survey of Latin America and the Caribbean • 2016
5. Total financial inflows to the region ebbed considerably in 2015 and are not expected to pick up much in 2016
In 2015, Latin America, like other emerging economies, felt the effects of the decreasing availability of financial flows, given the uncertainty and volatility that prevailed in financial markets for most of the year and the lower growth prospects in those countries. Hence, the net inflow of financial resources to the region fell significantly and closed the year at 2.9% of GDP. As a consequence of this, and despite the fact that the region reduced its current account deficit in 2015, financial inflows for that year were not enough to finance the deficit fully and international reserves in the amount of US$ 28.7 billion (equivalent to more than 0.5% of GDP) had to be used to cover it.
Within the financial account, net direct investment and other financial inflows —basically net portfolio investment and net other investment— declined to varying degrees. In the case of direct investment —the largest inflow to the region— inflows to several countries fell (by 9% on average for the region). This was to be expected against a backdrop of lower profitability in the commodities sector, the area of operations of many of the major transnational companies based in those countries. While trans-Latin companies also cut back their investments abroad, it was not enough to offset the decline in inflows and as a result net direct investment flows dropped from US$ 137.4 billion in 2014 to US$ 128.6 billion in 2015.
Other financial account flows plummeted by almost 80%, from US$ 78.5 billion in 2014 to US$ 16.7 billion in 2015, leading to a substantial reduction in the region’s net foreign liabilities. Net portfolio investment —which essentially includes investments in debt securities and equity— fell by 45% and closed 2015 at around US$ 64 billion. Meanwhile, net other investment —which includes foreign assets, such as deposits in non-resident banks, and foreign liabilities, such as cross-border loans from non-resident banks— had already been negative in 2014 and in 2015 it decreased by almost twice as much (figure I.14).
Figure I.14 Latin America (18 countries)a: balance-of-payments current account and capital and financial accounts by component, 2010-2015(Billions of dollars)
-100
-50
0
50
100
150
200
250
300
Q1 Q2 Q3 Q4 Q1 Q2 Q3 Q4 Q1 Q2 Q3 Q4 Q1 Q2 Q3 Q4 Q1 Q2 Q3 Q4 Q1 Q2 Q3 Q4
2010 2011 2012 2013 2014 2015
Other net investment(negative values indicateoutflows and positivevalues inflows)
Net portfolio investment
Net direct investment
-45%
Source: Economic Commission for Latin America and the Caribbean (ECLAC), on the basis of official figures.a Does not include Haiti.
42 Chapter I Economic Commission for Latin America and the Caribbean (ECLAC)
Although the behaviour of the various balance-of-payments components was heterogeneous at the country level in the region in 2015, for most countries available external financing decreased relative to the previous year. This meant that in several cases, external financing was not enough to cover the current account deficit and countries had to use international reserves to make up the difference.
Financial flows are not expected to recover significantly in 2016; rather they are forecast to remain at the levels recorded towards the end of 2015 or even to decrease to some extent.
ECLAC forecasts a fall of around 8% in FDI inflows in 2016, compared with 2015 (see ECLAC, 2016a). In addition, any sharp increases in risk aversion globally, as seen already in the first quarter of 2016, could further restrict the availability of external financing for emerging markets, including Latin America. Data on non-FDI financial flows for early 2016 reveal significant falls compared with the same quarter of the previous year, in line with the stressed financial conditions.16
6. The region’s sovereign risk continued to follow the upward trend that it has been on since mid-2014, peaking in January 2016 with the highest levels seen since 2009
The drop in non-FDI financial flows occurred in a context of growing regional sovereign risk (measured using the Emerging Market Bond Index Global (EMBIG)). That risk increased markedly in 2015, linked, in part, to episodes of increased volatility in global financial markets and to specific national factors in some countries that pushed up the regional index. In January 2016, EMBIG reached almost 700 basis points: the highest level seen since 2009 when the world was in the middle of the global economic and financial crisis.
Sovereign risk levels began to decrease in most countries in the region in February, in line with a less tense global financial market (see figure I.15). Between 1 January and 30 June 2016, the regional EMBIG dropped 83 basis points, largely because of the decline in the sovereign risk of countries that had seen significant increases in 2015, such as Brazil and Ecuador. The regional index is currently at 522 basis points and the countries with the highest sovereign risk are now the Bolivarian Republic of Venezuela (2,659 basis points), Ecuador (913 basis points), Argentina, (495 basis points), the Dominican Republic (428 basis points) and Brazil (366 basis points).
16 Balance-of payments data for the first quarter of 2016 are available for only four economies (Brazil, Chile, Mexico and Peru), which accounted for more than 70% of total financial flows in the region in 2014.

43Chapter IEconomic Survey of Latin America and the Caribbean • 2016
Figure I.15 Latin America (14 countries): sovereign risk according to the Emerging Market Bond Index Global (EMBIG), January 2008 to June 2016a
(Basis points)
Argentina 719 438 495
Bolivia (Plur. State of)
Latin America
277 250 152
508 605 522
Brazil 270 548 366
Chile 169 253 202
Colombia 196 317 257
Ecuador 883 1 266 913
Mexico 213 315 293
Panama 185 214 214
Paraguay
Dominican Rep.
291 338 318
Peru 182 240 200
31 December2014
31 December2015
30 June2016a
381 421 428
Uruguay 208 280 270
Venezuela (Bol. Rep. of) 2 457 2 807 2 659
Highest levels seen since 2009
340
571
677
522
0
100
200
300
400
500
600
700
800
900
31 J
an
31 J
ul
28 N
ov
2008 2009 2010 2011 2012 2013 2014 2015 2016
30 J
an
31 J
ul
30 N
ov
29 J
an
30 J
ul
30 N
ov
31 J
an
29 J
ul
30 N
ov
31 J
an
31 J
ul
30 N
ov
31 J
an
31 J
ul
27 N
ov
31 J
an
31 J
ul
26 N
ov
30 J
an
31 J
ul
30 N
ov29
Jan
30 J
un
Source: Economic Commission for Latin America and the Caribbean (ECLAC), on the basis of figures from JP Morgan.a Data for Paraguay and the Plurinational State of Bolivia cover the period up to 31 May 2016.
7. Debt issuances in international markets by Latin America and the Caribbean declined substantially in 2015, but picked up in April and May 2016 with issues by the new Government of Argentina and the Brazilian State oil company, Petrobras
In keeping with the performance of balance-of-payments financial flows, primary issues in international debt markets plunged in 2015 (down 40% compared with 2014). At the sector level, issues were down by 71% for banks, 48% for the private sector, 44% for quasi-sovereigns, 21% for sovereigns, and 4% for supranationals.17
Two major issuances were carried out in April and May 2016: one by the new Government of Argentina to pay its holdout investors, having reached an agreement with them following a drawn-out law suit and default; the other marked the return of the Brazilian State-controlled oil company, Petrobras, to the international markets in May (with a US$ 6.75 billion issuance). Petrobras was able to issue bonds for such an amount, despite the well-publicized problems the company is facing, because of the high rates offered.18
Thus, in the first five months of 2016, total issues increased by 22% compared with the same period in 2015 (see figure I.16).
17 The quasi-sovereign sector includes public development banks or State enterprises, among other entities. The supranational sector includes regional development banks, such as the Latin American Development Bank (CAF) or the Central American Bank for Economic Integration (CABEI).
18 Of the total bonds issued, the majority (US$ 5 billion) were in five-year dollar-denominated notes at an annual rate of 8.375%. The rest (US$ 1.75 billion) were offered at an annual rate of 8.750% over 10 years. These are high rates in the current international financial climate. In addition, demand was spread across a large number of investors (629) instead of concentrating the risk among a few large ones.
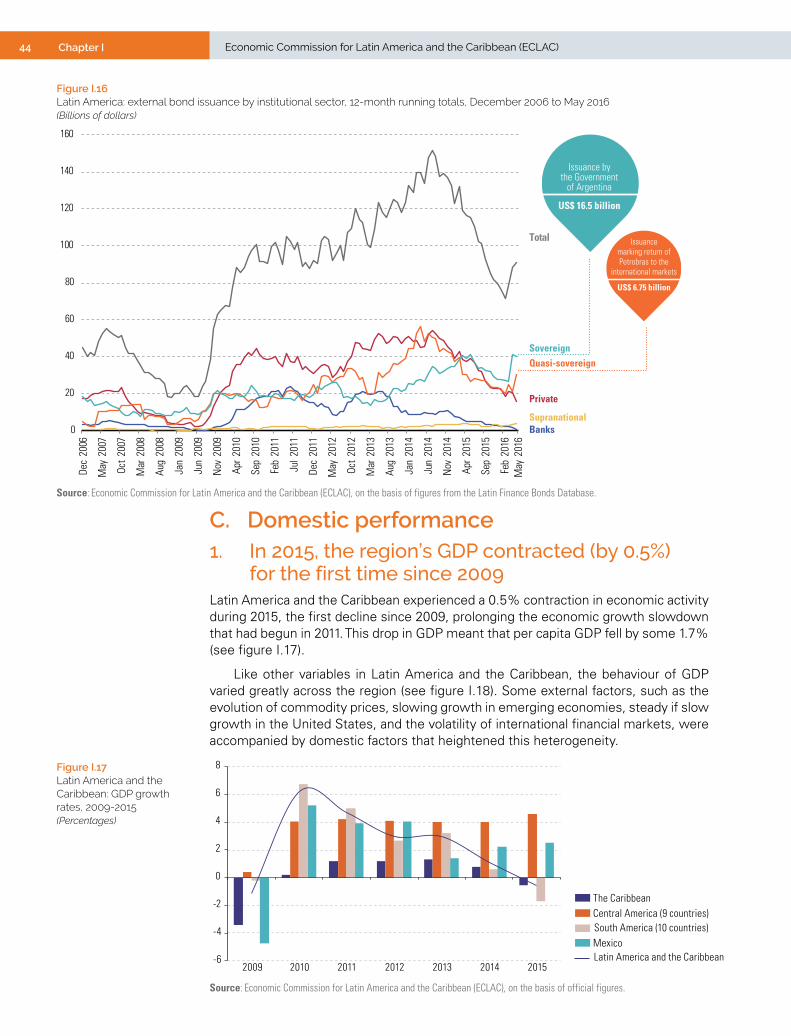
44 Chapter I Economic Commission for Latin America and the Caribbean (ECLAC)
Figure I.16 Latin America: external bond issuance by institutional sector, 12-month running totals, December 2006 to May 2016 (Billions of dollars)
0
20
40
60
80
100
120
140
160
Dec
2006
May
2007
Oct
2007
Mar
2008
Aug
2008
Jan
2009
Jun
2009
Nov
2009
Apr
2010
Sep
2010
Feb
2011
Jul2
011
Dec
2011
May
2012
Oct
2012
Mar
2013
Aug
2013
Jan
2014
Jun
2014
Nov
2014
Apr
2015
Sep
2015
Feb
2016
Banks
Private
Quasi-sovereignSovereign
Supranational
Total
Issuance bythe Government
of Argentina
US$ 16.5 billion
Issuance marking return of Petrobras to the
international markets
US$ 6.75 billion
May
2016
Source: Economic Commission for Latin America and the Caribbean (ECLAC), on the basis of figures from the Latin Finance Bonds Database.
C. Domestic performance1. In 2015, the region’s GDP contracted (by 0.5%)
for the first time since 2009Latin America and the Caribbean experienced a 0.5% contraction in economic activity during 2015, the first decline since 2009, prolonging the economic growth slowdown that had begun in 2011. This drop in GDP meant that per capita GDP fell by some 1.7% (see figure I.17).
Like other variables in Latin America and the Caribbean, the behaviour of GDP varied greatly across the region (see figure I.18). Some external factors, such as the evolution of commodity prices, slowing growth in emerging economies, steady if slow growth in the United States, and the volatility of international financial markets, were accompanied by domestic factors that heightened this heterogeneity.
Figure I.17 Latin America and the Caribbean: GDP growth rates, 2009-2015(Percentages)
-6
-4
-2
0
2
4
6
8
2009 2010 2011 2012 2013 2014 2015
The CaribbeanCentral America (9 countries)South America (10 countries)MexicoLatin America and the Caribbean
Source: Economic Commission for Latin America and the Caribbean (ECLAC), on the basis of official figures.
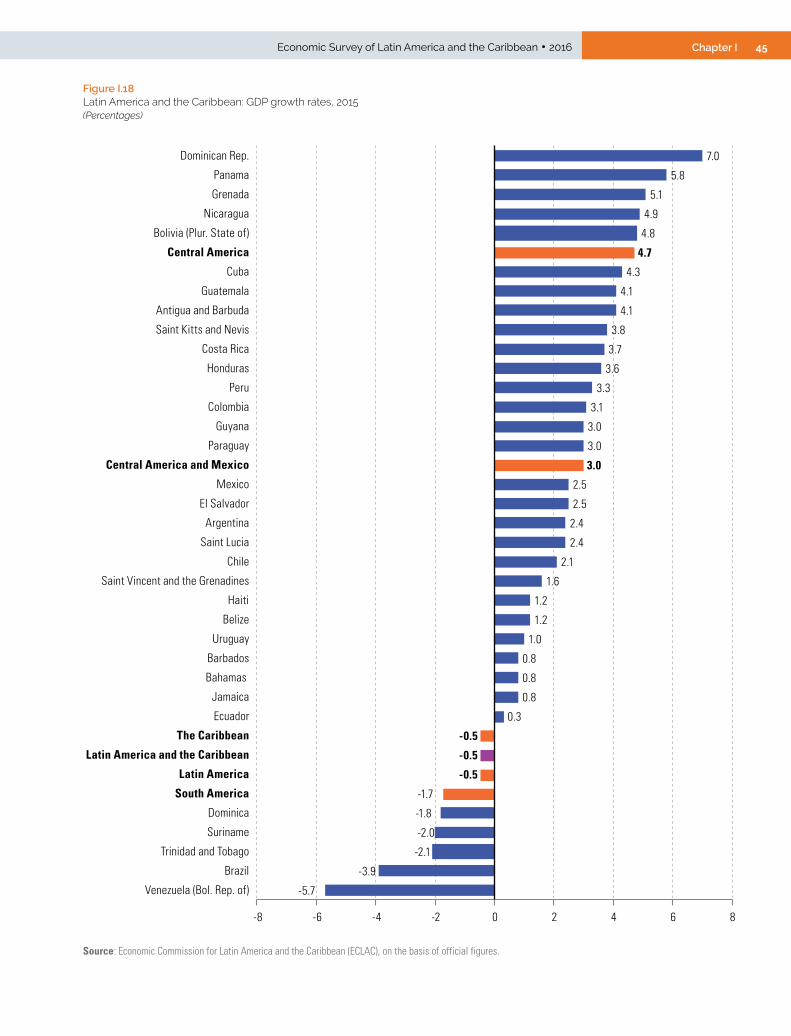
45Chapter IEconomic Survey of Latin America and the Caribbean • 2016
Figure I.18 Latin America and the Caribbean: GDP growth rates, 2015(Percentages)
-5.7
-3.9
-2.1
-2.0
-1.8
-1.7
-0.5
-0.5
-0.5
0.3
0.8
0.8
0.8
1.0
1.2
1.2
1.6
2.1
2.4
2.4
2.5
2.5
3.0
3.0
3.0
3.1
3.3
3.6
3.7
3.8
4.1
4.1
4.3
4.7
4.8
4.9
5.1
5.8
7.0
-8 -6 -4 -2 0 2 4 6 8
Venezuela (Bol. Rep. of)
Brazil
Trinidad and Tobago
Suriname
Dominica
South America
Latin America
Latin America and the Caribbean
The Caribbean
Ecuador
Jamaica
Bahamas
Barbados
Uruguay
Belize
Haiti
Saint Vincent and the Grenadines
Chile
Saint Lucia
Argentina
El Salvador
Mexico
Central America and Mexico
Paraguay
Guyana
Colombia
Peru
Honduras
Costa Rica
Saint Kitts and Nevis
Antigua and Barbuda
Guatemala
Cuba
Central America
Bolivia (Plur. State of)
Nicaragua
Grenada
Panama
Dominican Rep.
Source: Economic Commission for Latin America and the Caribbean (ECLAC), on the basis of official figures.

46 Chapter I Economic Commission for Latin America and the Caribbean (ECLAC)
While the economies of Central America have had the benefit of lower energy prices, a recovery in external demand and remittance inflows, and a drop in inflation that has increased the scope for policies to stimulate aggregate domestic demand, those of South America have experienced a major deterioration in their terms of trade, lower aggregate external demand (from China and intraregional partners), and a considerable reduction in the scope for demand-stimulus policies because of higher inflation and lower fiscal revenues from commodity exports.
In this context, the northern economies of Latin America were able to grow at higher rates than in 2014, with those of Central America expanding by 4.7% and Mexico’s by 2.5%. The best growth performers in Central America were the Dominican Republic (7.0%) and Panama (5.8%). Meanwhile, the economies of South America contracted by 1.7%, a much worse performance than during the global financial crisis of 2009, when they shrank by just 0.2%. In fact, this was the largest contraction in the subregion since the 1980s. Internally, differences between the South American economies were sharp, so that while the Bolivarian Republic of Venezuela and Brazil contracted by 5.7% and 3.9%, respectively, the Plurinational State of Bolivia was able to grow by 4.8%. This subregional GDP dynamic meant a greater (negative) contribution from South America to the contraction in regional GDP.
Contrary to what was anticipated in the Preliminary Overview of the Economies of Latin America and the Caribbean, 2015 (ECLAC, 2015b), the economies of the non-Spanish-speaking Caribbean contracted (by 0.5%). This was due to: (i) a slowing of growth in the Caribbean economies specializing in services from 1.1% in 2014 to 0.5% in 2015; and (ii) a larger contraction in 2015 (-1.6%) than in 2014 (-0.1%) in the Caribbean economies specializing in commodity production.19 The best performers among the economies of the non-Spanish-speaking Caribbean were Grenada (5.1%), Antigua and Barbuda (4.1%) and Saint Kitts and Nevis (3.8%), while Trinidad and Tobago (-2.1%) and Suriname (-2.0%) experienced the largest contractions.
The scale of the contribution made by Brazil and the Bolivarian Republic of Venezuela to the contraction of GDP in the region is particularly noteworthy, with the former being responsible for -1.38 percentage points and the latter for -0.23 percentage points, as figure I.19 shows.
19 The economies of the non-Spanish-speaking Caribbean specializing in services are Antigua and Barbuda, the Bahamas, Barbados, Belize, Dominica, Grenada, Jamaica, Saint Kitts and Nevis, Saint Lucia and Saint Vincent and the Grenadines. Those specializing in commodities are Guyana, Suriname and Trinidad and Tobago.
Figure I.19 Latin America and the Caribbean (selected countries and country groupings): contributions to regional GDP growth, 2008-2015(Percentages based on dollars at constant 2010 prices)
-3
-2
-1
0
1
2
3
4
5
6
7
2008 2009 2010 2011 2012 2013 2014 2015
Brazil
Mexico
The Caribbean
Latin America and the Caribbean
Central AmericaSouth America (except Brazil and Venezuela (Bol. Rep. of))Venezuela (Bol. Rep. of)
Source: Economic Commission for Latin America and the Caribbean (ECLAC), on the basis of official figures.
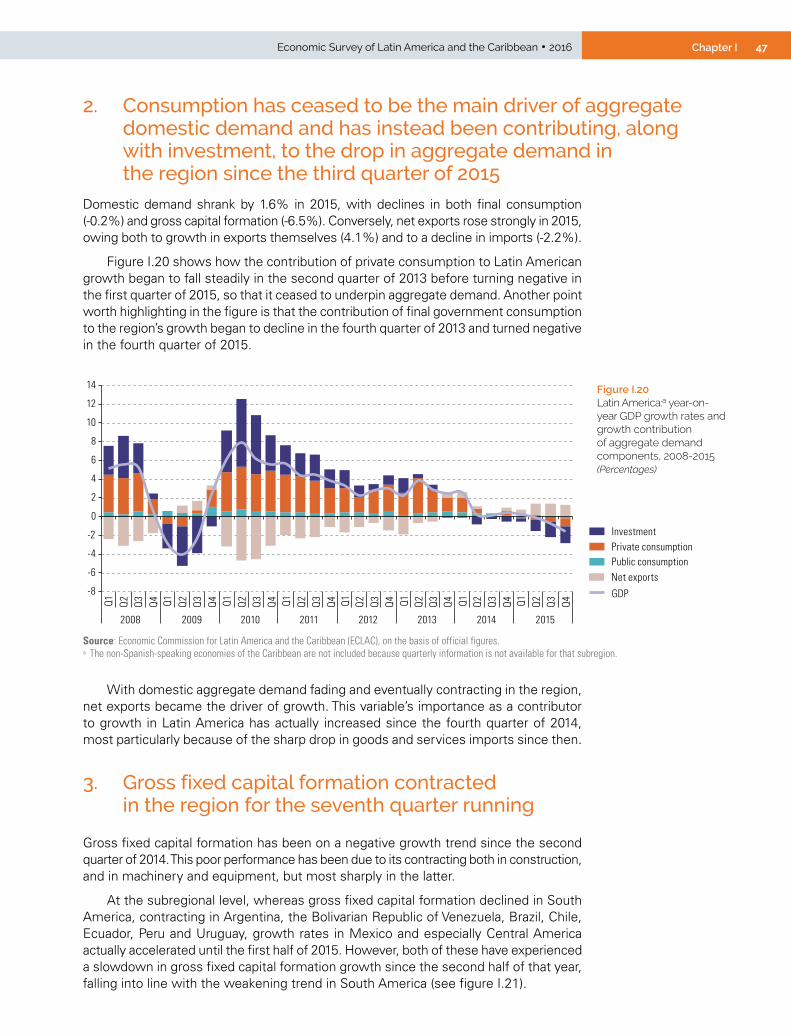
47Chapter IEconomic Survey of Latin America and the Caribbean • 2016
2. Consumption has ceased to be the main driver of aggregate domestic demand and has instead been contributing, along with investment, to the drop in aggregate demand in the region since the third quarter of 2015
Domestic demand shrank by 1.6% in 2015, with declines in both final consumption (-0.2%) and gross capital formation (-6.5%). Conversely, net exports rose strongly in 2015, owing both to growth in exports themselves (4.1%) and to a decline in imports (-2.2%).
Figure I.20 shows how the contribution of private consumption to Latin American growth began to fall steadily in the second quarter of 2013 before turning negative in the first quarter of 2015, so that it ceased to underpin aggregate demand. Another point worth highlighting in the figure is that the contribution of final government consumption to the region’s growth began to decline in the fourth quarter of 2013 and turned negative in the fourth quarter of 2015.
Figure I.20 Latin America:a year-on-year GDP growth rates and growth contribution of aggregate demand components, 2008-2015(Percentages)
-8
-6
-4
-2
0
2
4
6
8
10
12
14
2009 2010 2011 2012 2013 2014 2015
GDP
Q1 Q2
Q3 Q4 Q1 Q2
Q3 Q4 Q1 Q2
Q3 Q4 Q1 Q2
Q3 Q4 Q1 Q2
Q3 Q4 Q1 Q2
Q3 Q4 Q1 Q2
Q3 Q4 Q1 Q2
Q3 Q4
2008
Public consumptionPrivate consumptionInvestment
Net exports
Source: Economic Commission for Latin America and the Caribbean (ECLAC), on the basis of official figures. a The non-Spanish-speaking economies of the Caribbean are not included because quarterly information is not available for that subregion.
With domestic aggregate demand fading and eventually contracting in the region, net exports became the driver of growth. This variable’s importance as a contributor to growth in Latin America has actually increased since the fourth quarter of 2014, most particularly because of the sharp drop in goods and services imports since then.
3. Gross fixed capital formation contracted in the region for the seventh quarter running
Gross fixed capital formation has been on a negative growth trend since the second quarter of 2014. This poor performance has been due to its contracting both in construction, and in machinery and equipment, but most sharply in the latter.
At the subregional level, whereas gross fixed capital formation declined in South America, contracting in Argentina, the Bolivarian Republic of Venezuela, Brazil, Chile, Ecuador, Peru and Uruguay, growth rates in Mexico and especially Central America actually accelerated until the first half of 2015. However, both of these have experienced a slowdown in gross fixed capital formation growth since the second half of that year, falling into line with the weakening trend in South America (see figure I.21).
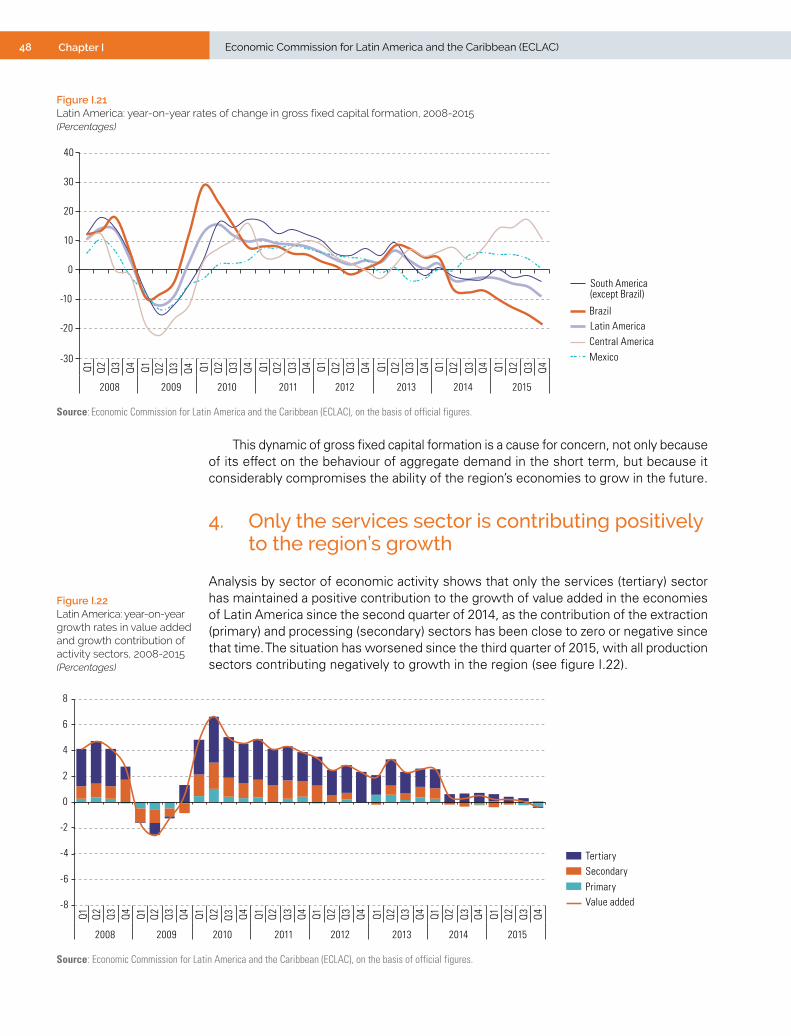
48 Chapter I Economic Commission for Latin America and the Caribbean (ECLAC)
Figure I.21 Latin America: year-on-year rates of change in gross fixed capital formation, 2008-2015(Percentages)
-30
-20
-10
0
10
20
30
40
Latin America
South America(except Brazil)
Brazil
MexicoCentral America
Q1 Q2
Q3 Q4 Q1 Q2
Q3 Q4 Q1 Q2
Q3 Q4 Q1 Q2
Q3 Q4 Q1 Q2
Q3 Q4 Q1 Q2
Q3 Q4 Q1 Q2
Q3 Q4 Q1 Q2
Q3 Q4
2009 2010 2011 2012 2013 2014 20152008
Source: Economic Commission for Latin America and the Caribbean (ECLAC), on the basis of official figures.
This dynamic of gross fixed capital formation is a cause for concern, not only because of its effect on the behaviour of aggregate demand in the short term, but because it considerably compromises the ability of the region’s economies to grow in the future.
4. Only the services sector is contributing positively to the region’s growth
Analysis by sector of economic activity shows that only the services (tertiary) sector has maintained a positive contribution to the growth of value added in the economies of Latin America since the second quarter of 2014, as the contribution of the extraction (primary) and processing (secondary) sectors has been close to zero or negative since that time. The situation has worsened since the third quarter of 2015, with all production sectors contributing negatively to growth in the region (see figure I.22).
Figure I.22 Latin America: year-on-year growth rates in value added and growth contribution of activity sectors, 2008-2015(Percentages)
-8
-6
-4
-2
0
2
4
6
8
Value added
Q1 Q2 Q3 Q4 Q1 Q2 Q3 Q4 Q1 Q2
Q3 Q4 Q1 Q2 Q3 Q4 Q1 Q2 Q3 Q4 Q1 Q2 Q3 Q4 Q1 Q2 Q3 Q4 Q1 Q2 Q3 Q4
2009 2010 2011 2012 2013 2014 20152008
TertiarySecondaryPrimary
Source: Economic Commission for Latin America and the Caribbean (ECLAC), on the basis of official figures.
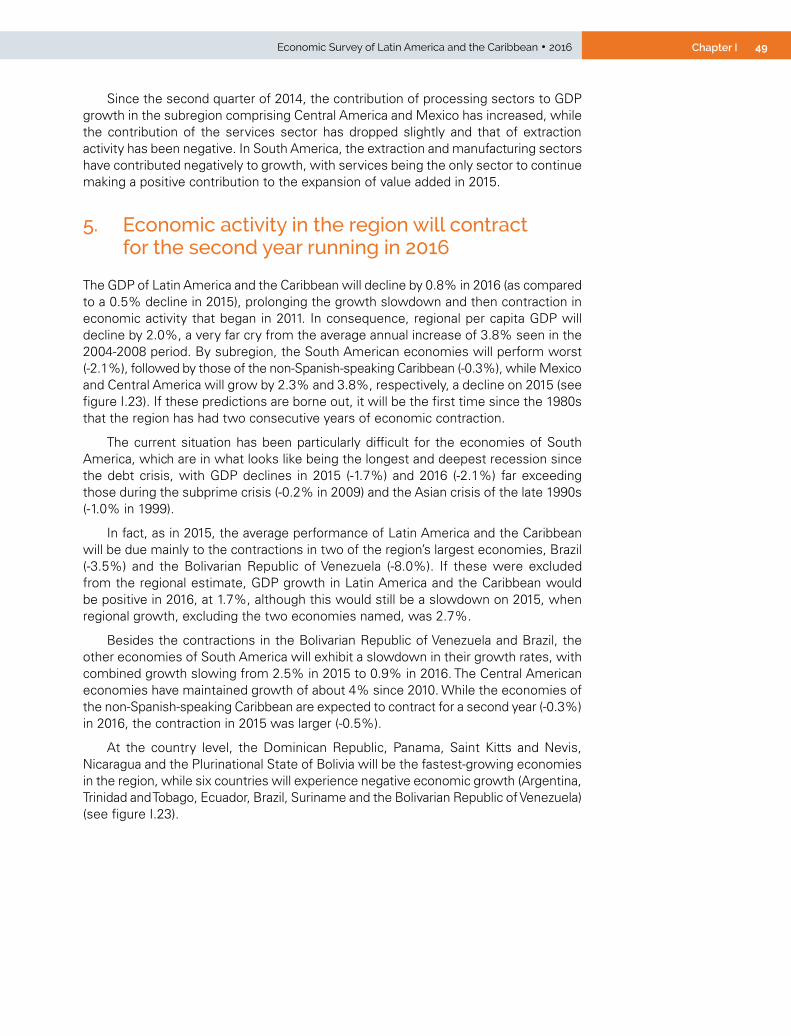
49Chapter IEconomic Survey of Latin America and the Caribbean • 2016
Since the second quarter of 2014, the contribution of processing sectors to GDP growth in the subregion comprising Central America and Mexico has increased, while the contribution of the services sector has dropped slightly and that of extraction activity has been negative. In South America, the extraction and manufacturing sectors have contributed negatively to growth, with services being the only sector to continue making a positive contribution to the expansion of value added in 2015.
5. Economic activity in the region will contract for the second year running in 2016
The GDP of Latin America and the Caribbean will decline by 0.8% in 2016 (as compared to a 0.5% decline in 2015), prolonging the growth slowdown and then contraction in economic activity that began in 2011. In consequence, regional per capita GDP will decline by 2.0%, a very far cry from the average annual increase of 3.8% seen in the 2004-2008 period. By subregion, the South American economies will perform worst (-2.1%), followed by those of the non-Spanish-speaking Caribbean (-0.3%), while Mexico and Central America will grow by 2.3% and 3.8%, respectively, a decline on 2015 (see figure I.23). If these predictions are borne out, it will be the first time since the 1980s that the region has had two consecutive years of economic contraction.
The current situation has been particularly difficult for the economies of South America, which are in what looks like being the longest and deepest recession since the debt crisis, with GDP declines in 2015 (-1.7%) and 2016 (-2.1%) far exceeding those during the subprime crisis (-0.2% in 2009) and the Asian crisis of the late 1990s (-1.0% in 1999).
In fact, as in 2015, the average performance of Latin America and the Caribbean will be due mainly to the contractions in two of the region’s largest economies, Brazil (-3.5%) and the Bolivarian Republic of Venezuela (-8.0%). If these were excluded from the regional estimate, GDP growth in Latin America and the Caribbean would be positive in 2016, at 1.7%, although this would still be a slowdown on 2015, when regional growth, excluding the two economies named, was 2.7%.
Besides the contractions in the Bolivarian Republic of Venezuela and Brazil, the other economies of South America will exhibit a slowdown in their growth rates, with combined growth slowing from 2.5% in 2015 to 0.9% in 2016. The Central American economies have maintained growth of about 4% since 2010. While the economies of the non-Spanish-speaking Caribbean are expected to contract for a second year (-0.3%) in 2016, the contraction in 2015 was larger (-0.5%).
At the country level, the Dominican Republic, Panama, Saint Kitts and Nevis, Nicaragua and the Plurinational State of Bolivia will be the fastest-growing economies in the region, while six countries will experience negative economic growth (Argentina, Trinidad and Tobago, Ecuador, Brazil, Suriname and the Bolivarian Republic of Venezuela) (see figure I.23).

50 Chapter I Economic Commission for Latin America and the Caribbean (ECLAC)
Figure I.23 Latin America and the Caribbean (selected countries and country groupings): projected GDP growth rates, 2016(Percentages)
-0.8
LATI
N A
MER
ICA
AN
DTH
E CA
RIB
BEA
N6.0 5.9
4.5 4.3
3.83.5 3.4
2.62.3 2.3
1.51.0
Dom
inic
an R
ep.
Pana
ma
Nic
arag
ua
Cost
a Ri
ca
CEN
TRA
L A
MER
ICA
Guat
emal
a
Hond
uras
CEN
TRA
L A
MER
ICA
AN
D M
EXIC
O
El S
alva
dor
Mex
ico
Haiti
Cuba
4.74.2
3.5
2.31.9
1.61.2 1.2
0.80.5
-0.3
-2.5
-4.0
Sain
t Kitt
s and
Nev
is
Dom
inic
a
Antig
ua a
nd B
arbu
da
Sain
t Vin
cent
and
the
Gren
adin
es
Gren
ada
Barb
ados
Jam
aica
Sain
t Luc
ia
Beliz
e
Baha
mas
THE
CARI
BB
EAN
Trin
idad
and
Tob
ago
Surin
ame
4.5
4.4
3.9
2.8 2.7
1.6
0.5
-1.5
-2.1-2.5
-3.5
-8.0
Boliv
ia (P
lur.
Stat
e of
)Gu
yana
Peru
Para
guay
Colo
mbi
a
Chile
Urug
uay
Arge
ntin
a
SOU
TH A
MER
ICA
Ecua
dor
Braz
il
Vene
zuel
a (B
ol.
Rep.
of)
Source: Economic Commission for Latin America and the Caribbean (ECLAC), on the basis of official figures.

51Chapter IEconomic Survey of Latin America and the Caribbean • 2016
The dynamic of production in the region’s economies, and South America in particular, will undoubtedly be determined in large part by the effects of an external context that will remain adverse (because of lower growth in major trading partners that has fed through to weaker external demand and commodity prices), the prolonged reduction in investment and a considerable slowdown in consumption. Furthermore, situations such as rising inflation and the volatility of some of the subregion’s currencies will restrict the scope for monetary policy to be employed more actively to stimulate aggregate domestic demand, while lower fiscal revenues from commodity-exporting activities are constraining the scope for expansionary fiscal policies.
At the same time, the steady if slow recovery of the United States has led to an improvement in remittance and tourist flows to the economies of the north of the region, which have been sufficient to keep economic activity growing steadily there, even though they remain well below the levels seen before the 2008 financial crisis. Another factor favourable to potential growth in these economies is the increased scope for monetary policy opened up by the easing of inflationary pressures that has been a feature of most of the subregion’s economies.
Data for the first quarter of 2016 show a year-on-year GDP decline of 1.5% in Latin America, this being the fourth consecutive quarter in which the region’s GDP has contracted. Figures for aggregate demand in the quarter show that investment and private consumption have continued to contract, and that public sector consumption has also been falling since the fourth quarter of 2015. This makes the first three months of 2016 the eighth quarter of contraction for gross fixed capital formation, the fifth for private sector consumption and the second for final government consumption (see figure I.24A).
Once again, this regional dynamic is essentially explained by developments in the South American economies, since in those of Central America and Mexico both gross fixed capital formation and consumption are still contributing positively to growth (see figure I.24B and C).
Figure I.24 Latin America: GDP growth rates, 2008-2016(Percentages)
GDP
InvestmentPrivate consumptionPublic consumptionNet exports
-8
-6
-4
-2
0
2
4
6
8
10
12
14
2015 2016
Q1 Q2 Q3 Q4 Q1 Q2 Q3 Q4 Q1 Q2 Q3 Q4 Q1 Q2 Q3 Q4 Q1 Q2 Q3 Q4 Q1 Q2 Q3 Q4 Q1 Q2 Q3 Q4
2009 2010 2011 2012 2013 20142008
Q1 Q2 Q3 Q4 Q1
A. Latin America

52 Chapter I Economic Commission for Latin America and the Caribbean (ECLAC)
Figure I.24 (concluded)
B. South America
-10
-5
0
5
10
15
2015 2016
Q1 Q2 Q3 Q4 Q1 Q2 Q3 Q4 Q1 Q2 Q3 Q4 Q1 Q2 Q3 Q4 Q1 Q2 Q3 Q4 Q1 Q2 Q3 Q4 Q1 Q2 Q3 Q4
2009 2010 2011 2012 2013 20142008
Q1 Q2 Q3 Q4 Q1
-10
-8
-6
-4
-2
0
2
4
6
8
10
C. Central America and Mexico
GDP
InvestmentPrivate consumptionPublic consumptionNet exports
2015 2016
Q1 Q2 Q3 Q4 Q1 Q2 Q3 Q4 Q1 Q2 Q3 Q4 Q1 Q2 Q3 Q4 Q1 Q2 Q3 Q4 Q1 Q2 Q3 Q4 Q1 Q2 Q3 Q4
2009 2010 2011 2012 2013 20142008
Q1 Q2 Q3 Q4 Q1
Source: Economic Commission for Latin America and the Caribbean (ECLAC), on the basis of official figures.
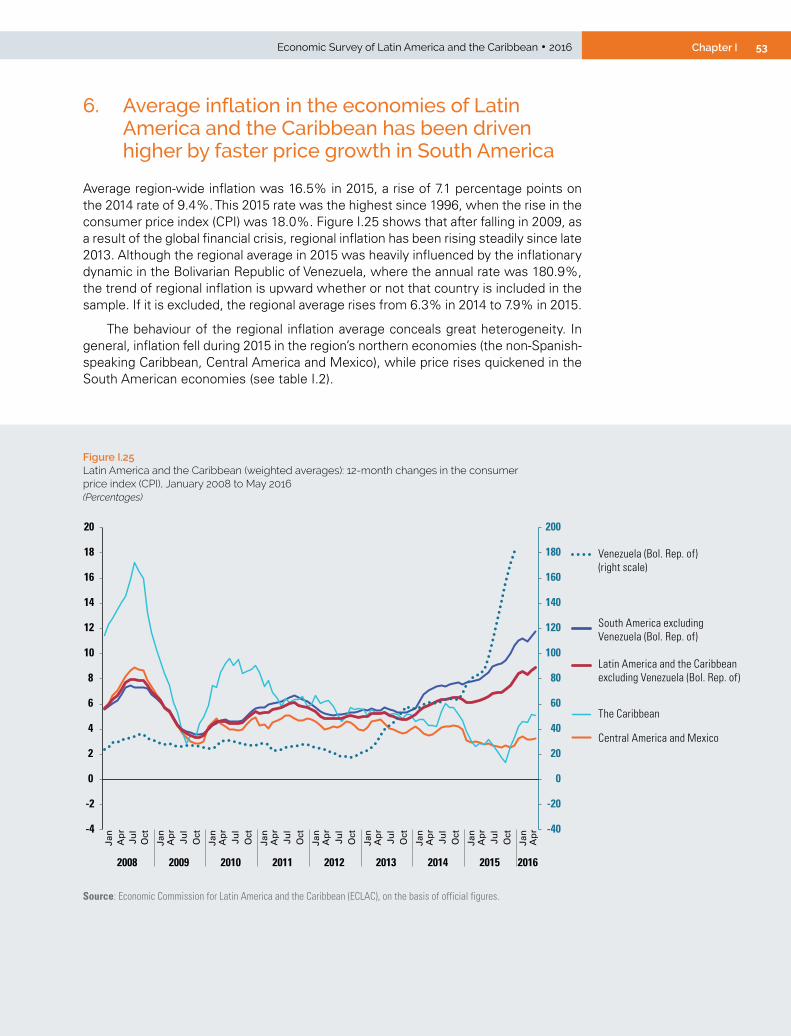
53Chapter IEconomic Survey of Latin America and the Caribbean • 2016
6. Average inflation in the economies of Latin America and the Caribbean has been driven higher by faster price growth in South America
Average region-wide inflation was 16.5% in 2015, a rise of 7.1 percentage points on the 2014 rate of 9.4%. This 2015 rate was the highest since 1996, when the rise in the consumer price index (CPI) was 18.0%. Figure I.25 shows that after falling in 2009, as a result of the global financial crisis, regional inflation has been rising steadily since late 2013. Although the regional average in 2015 was heavily influenced by the inflationary dynamic in the Bolivarian Republic of Venezuela, where the annual rate was 180.9%, the trend of regional inflation is upward whether or not that country is included in the sample. If it is excluded, the regional average rises from 6.3% in 2014 to 7.9% in 2015.
The behaviour of the regional inflation average conceals great heterogeneity. In general, inflation fell during 2015 in the region’s northern economies (the non-Spanish-speaking Caribbean, Central America and Mexico), while price rises quickened in the South American economies (see table I.2).
Figure I.25 Latin America and the Caribbean (weighted averages): 12-month changes in the consumer price index (CPI), January 2008 to May 2016(Percentages)
-40
-20
0
20
40
60
80
100
120
140
160
180
200
-4
-2
0
2
4
6
8
10
12
14
16
18
20
Jan
Ap
rJu
lO
ct
Jan
Ap
rJu
lO
ct
Jan
Ap
rJu
lO
ct
Jan
Ap
rJu
lO
ct
Jan
Ap
rJu
lO
ct
Jan
Ap
rJu
lO
ct
Jan
Ap
rJu
lO
ct
Jan
Ap
rJu
lO
ct
Jan
Ap
r
2008 2009 2010 2011 2012 2013 2014 2015 2016
Latin America and the Caribbeanexcluding Venezuela (Bol. Rep. of)
South America excluding Venezuela (Bol. Rep. of)
Central America and Mexico
The Caribbean
Venezuela (Bol. Rep. of) (right scale)
Source: Economic Commission for Latin America and the Caribbean (ECLAC), on the basis of official figures.
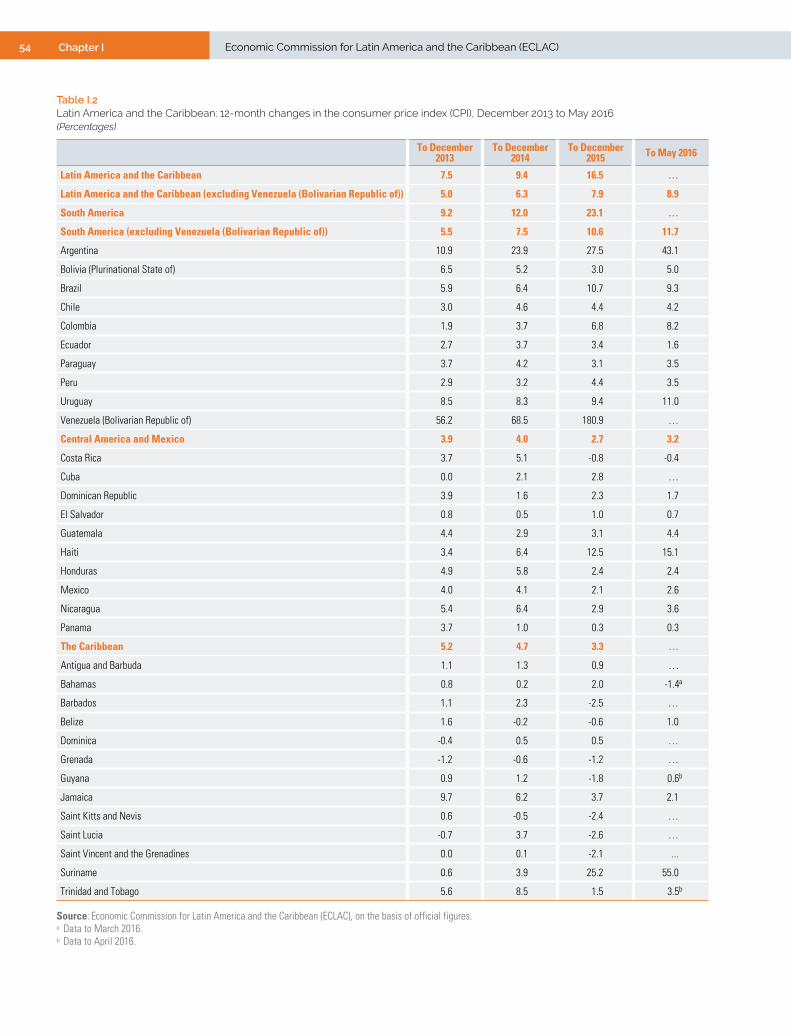
54 Chapter I Economic Commission for Latin America and the Caribbean (ECLAC)
Table I.2 Latin America and the Caribbean: 12-month changes in the consumer price index (CPI), December 2013 to May 2016(Percentages)
To December 2013
To December 2014
To December 2015 To May 2016
Latin America and the Caribbean 7.5 9.4 16.5 …
Latin America and the Caribbean (excluding Venezuela (Bolivarian Republic of)) 5.0 6.3 7.9 8.9
South America 9.2 12.0 23.1 …
South America (excluding Venezuela (Bolivarian Republic of)) 5.5 7.5 10.6 11.7
Argentina 10.9 23.9 27.5 43.1
Bolivia (Plurinational State of) 6.5 5.2 3.0 5.0
Brazil 5.9 6.4 10.7 9.3
Chile 3.0 4.6 4.4 4.2
Colombia 1.9 3.7 6.8 8.2
Ecuador 2.7 3.7 3.4 1.6
Paraguay 3.7 4.2 3.1 3.5
Peru 2.9 3.2 4.4 3.5
Uruguay 8.5 8.3 9.4 11.0
Venezuela (Bolivarian Republic of) 56.2 68.5 180.9 …
Central America and Mexico 3.9 4.0 2.7 3.2
Costa Rica 3.7 5.1 -0.8 -0.4
Cuba 0.0 2.1 2.8 …
Dominican Republic 3.9 1.6 2.3 1.7
El Salvador 0.8 0.5 1.0 0.7
Guatemala 4.4 2.9 3.1 4.4
Haiti 3.4 6.4 12.5 15.1
Honduras 4.9 5.8 2.4 2.4
Mexico 4.0 4.1 2.1 2.6
Nicaragua 5.4 6.4 2.9 3.6
Panama 3.7 1.0 0.3 0.3
The Caribbean 5.2 4.7 3.3 …
Antigua and Barbuda 1.1 1.3 0.9 …
Bahamas 0.8 0.2 2.0 -1.4a
Barbados 1.1 2.3 -2.5 …
Belize 1.6 -0.2 -0.6 1.0
Dominica -0.4 0.5 0.5 …
Grenada -1.2 -0.6 -1.2 …
Guyana 0.9 1.2 -1.8 0.6b
Jamaica 9.7 6.2 3.7 2.1
Saint Kitts and Nevis 0.6 -0.5 -2.4 …
Saint Lucia -0.7 3.7 -2.6 …
Saint Vincent and the Grenadines 0.0 0.1 -2.1 ...
Suriname 0.6 3.9 25.2 55.0
Trinidad and Tobago 5.6 8.5 1.5 3.5b
Source: Economic Commission for Latin America and the Caribbean (ECLAC), on the basis of official figures.a Data to March 2016.b Data to April 2016.

55Chapter IEconomic Survey of Latin America and the Caribbean • 2016
Thus, inflation in the non-Spanish-speaking Caribbean as a group fell from 4.5% in 2014 to 3.3% in 2015. Inflation was negative in 2015 in seven economies: Barbados, Belize, Grenada, Guyana, Saint Kitts and Nevis, Saint Lucia and Saint Vincent and the Grenadines). Inflation fell between 2014 and 2015 in Antigua and Barbuda, Jamaica and Trinidad and Tobago, while in Dominica it held steady at 0.5%. The only countries in the non-Spanish-speaking Caribbean where inflation rose in 2015 were the Bahamas and Suriname. In the subregion formed by Central America and Mexico, average inflation fell from 4.0% in 2014 to 2.7% in 2015, with a decline in five economies (Costa Rica, Honduras, Mexico, Nicaragua and Panama) and an increase in four (the Dominican Republic, El Salvador, Guatemala and Haiti).
The dynamic has been different in the economies of South America, with inflation rising from 12.0% in 2014 to 23.1% in 2015. Inflation increased in six economies within this subregion (Argentina, the Bolivarian Republic of Venezuela, Brazil, Colombia, Peru and Uruguay) and was over 20% in Argentina and the Bolivarian Republic of Venezuela. Inflation fell in 2015 in Chile, Ecuador, Paraguay and the Plurinational State of Bolivia, being below 5% in all these cases.
The marked differences between the north and south of the region can be explained by a number of factors, chief among them is the favourable impact on the economies of the north of the sharp drop in energy prices, which bore down on inflation in a context of largely stable exchange rates.
In the South American economies, inflation was driven upward by an increase in exchange-rate volatility (in a context of depreciation), a rise in fiscal dominance and the consequent expansion of monetary aggregates. In 2015, the economies where prices rose most, namely the Bolivarian Republic of Venezuela (180.9%), Argentina (27.5%), Suriname (25.2%), Haiti (12.5%) and Brazil (10.7%), also recorded the largest movements in their nominal exchange rates and the highest growth in monetary aggregates such as the monetary base.
7. Inflation was higher for tradable than for non-tradable goods, and food inflation outstripped general inflation
Tradable goods inflation in the region was 21.9% in 2015, 10.1 percentage points more than the 11.8% recorded in 2014. The rate was 30.7% in South America, 3.7% in Central America and Mexico and 1.1% in the non-Spanish-speaking Caribbean. Once again, the large rise in prices in the Bolivarian Republic of Venezuela affected these regional and subregional averages; the regional average without that country was 8.0% in 2015, a rise of just 0.3 percentage points over 2014, while the South American average was 10.3%, a rise of 1.3 percentage points. Meanwhile, non-tradable goods inflation averaged 15.4% across the region in 2015 if the Bolivarian Republic of Venezuela is included and 7.6% if it is excluded, with figures of 23.6% and 10.6%, respectively, for South America, and rates of 1.8% in Central America and Mexico and 1.1% in the non-Spanish-speaking Caribbean.
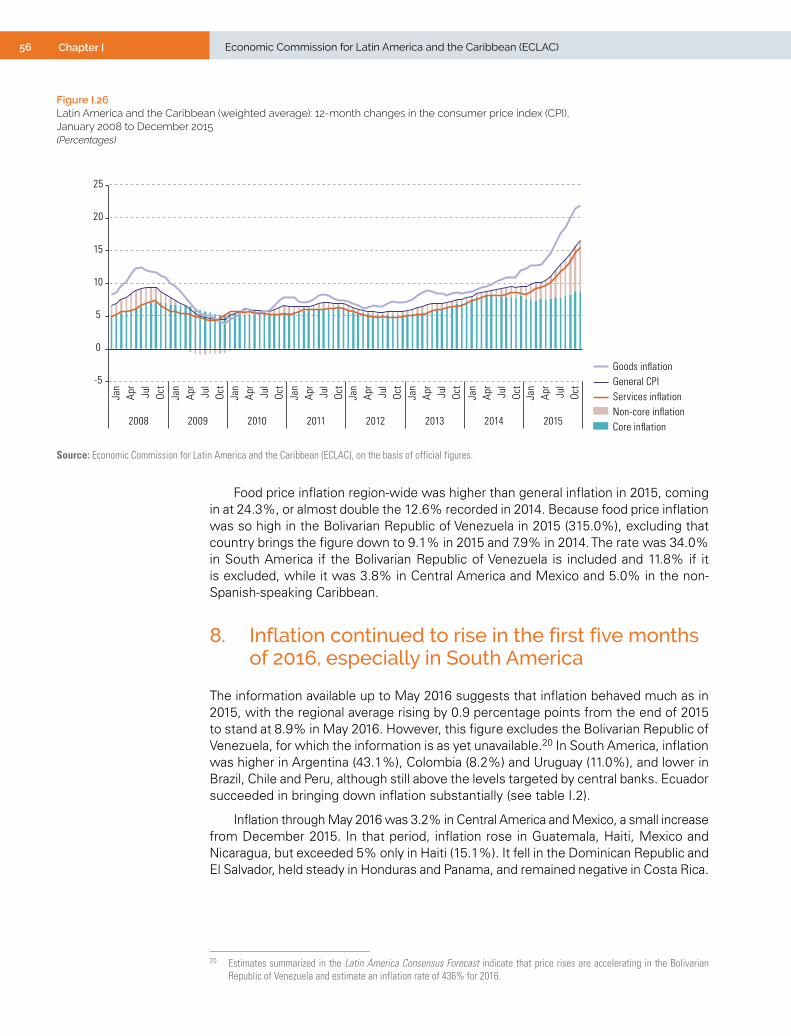
56 Chapter I Economic Commission for Latin America and the Caribbean (ECLAC)
Figure I.26 Latin America and the Caribbean (weighted average): 12-month changes in the consumer price index (CPI), January 2008 to December 2015(Percentages)
General CPIServices inflationNon-core inflationCore inflation
Goods inflation-5
0
5
10
15
20
25
Jan
Apr
Jul
Oct
Jan
Apr
Jul
Oct
Jan
Apr
Jul
Oct
Jan
Apr
Jul
Oct
Jan
Apr
Jul
Oct
Jan
Apr
Jul
Oct
Jan
Apr
Jul
Oct
Jan
Apr
Jul
Oct
2008 2009 2010 2011 2012 2013 2014 2015
Source: Economic Commission for Latin America and the Caribbean (ECLAC), on the basis of official figures.
Food price inflation region-wide was higher than general inflation in 2015, coming in at 24.3%, or almost double the 12.6% recorded in 2014. Because food price inflation was so high in the Bolivarian Republic of Venezuela in 2015 (315.0%), excluding that country brings the figure down to 9.1% in 2015 and 7.9% in 2014. The rate was 34.0% in South America if the Bolivarian Republic of Venezuela is included and 11.8% if it is excluded, while it was 3.8% in Central America and Mexico and 5.0% in the non-Spanish-speaking Caribbean.
8. Inflation continued to rise in the first five months of 2016, especially in South America
The information available up to May 2016 suggests that inflation behaved much as in 2015, with the regional average rising by 0.9 percentage points from the end of 2015 to stand at 8.9% in May 2016. However, this figure excludes the Bolivarian Republic of Venezuela, for which the information is as yet unavailable.20 In South America, inflation was higher in Argentina (43.1%), Colombia (8.2%) and Uruguay (11.0%), and lower in Brazil, Chile and Peru, although still above the levels targeted by central banks. Ecuador succeeded in bringing down inflation substantially (see table I.2).
Inflation through May 2016 was 3.2% in Central America and Mexico, a small increase from December 2015. In that period, inflation rose in Guatemala, Haiti, Mexico and Nicaragua, but exceeded 5% only in Haiti (15.1%). It fell in the Dominican Republic and El Salvador, held steady in Honduras and Panama, and remained negative in Costa Rica.
20 Estimates summarized in the Latin America Consensus Forecast indicate that price rises are accelerating in the Bolivarian Republic of Venezuela and estimate an inflation rate of 436% for 2016.
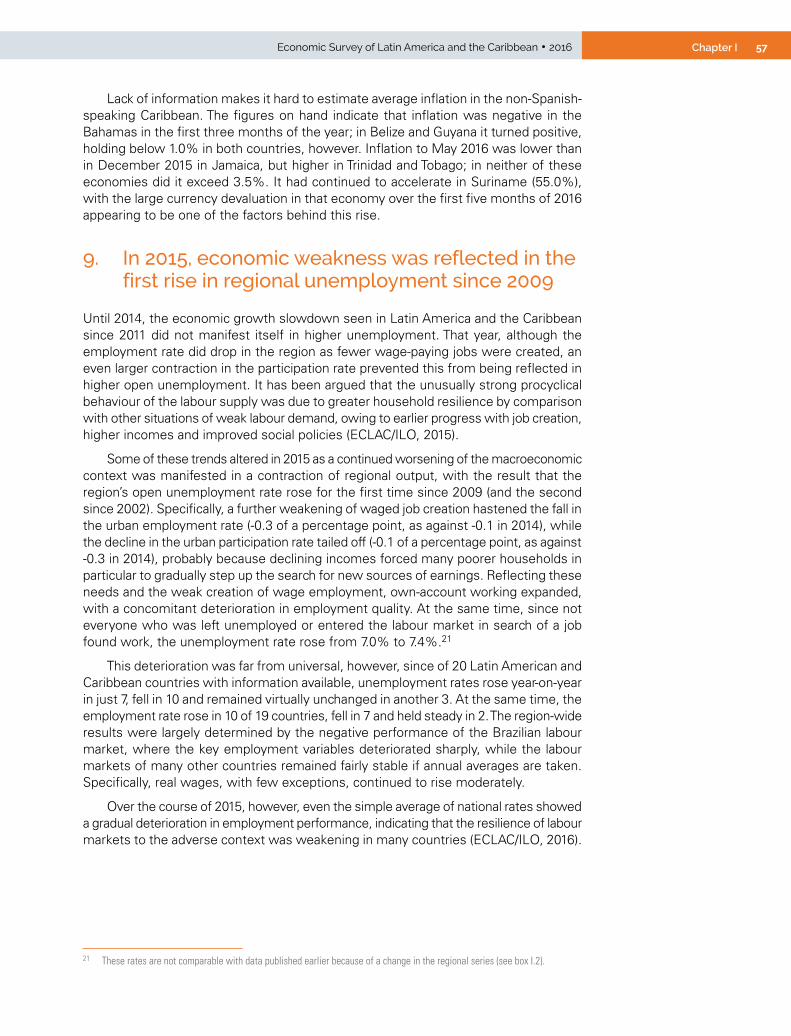
57Chapter IEconomic Survey of Latin America and the Caribbean • 2016
Lack of information makes it hard to estimate average inflation in the non-Spanish-speaking Caribbean. The figures on hand indicate that inflation was negative in the Bahamas in the first three months of the year; in Belize and Guyana it turned positive, holding below 1.0% in both countries, however. Inflation to May 2016 was lower than in December 2015 in Jamaica, but higher in Trinidad and Tobago; in neither of these economies did it exceed 3.5%. It had continued to accelerate in Suriname (55.0%), with the large currency devaluation in that economy over the first five months of 2016 appearing to be one of the factors behind this rise.
9. In 2015, economic weakness was reflected in the first rise in regional unemployment since 2009
Until 2014, the economic growth slowdown seen in Latin America and the Caribbean since 2011 did not manifest itself in higher unemployment. That year, although the employment rate did drop in the region as fewer wage-paying jobs were created, an even larger contraction in the participation rate prevented this from being reflected in higher open unemployment. It has been argued that the unusually strong procyclical behaviour of the labour supply was due to greater household resilience by comparison with other situations of weak labour demand, owing to earlier progress with job creation, higher incomes and improved social policies (ECLAC/ILO, 2015).
Some of these trends altered in 2015 as a continued worsening of the macroeconomic context was manifested in a contraction of regional output, with the result that the region’s open unemployment rate rose for the first time since 2009 (and the second since 2002). Specifically, a further weakening of waged job creation hastened the fall in the urban employment rate (-0.3 of a percentage point, as against -0.1 in 2014), while the decline in the urban participation rate tailed off (-0.1 of a percentage point, as against -0.3 in 2014), probably because declining incomes forced many poorer households in particular to gradually step up the search for new sources of earnings. Reflecting these needs and the weak creation of wage employment, own-account working expanded, with a concomitant deterioration in employment quality. At the same time, since not everyone who was left unemployed or entered the labour market in search of a job found work, the unemployment rate rose from 7.0% to 7.4%.21
This deterioration was far from universal, however, since of 20 Latin American and Caribbean countries with information available, unemployment rates rose year-on-year in just 7, fell in 10 and remained virtually unchanged in another 3. At the same time, the employment rate rose in 10 of 19 countries, fell in 7 and held steady in 2. The region-wide results were largely determined by the negative performance of the Brazilian labour market, where the key employment variables deteriorated sharply, while the labour markets of many other countries remained fairly stable if annual averages are taken. Specifically, real wages, with few exceptions, continued to rise moderately.
Over the course of 2015, however, even the simple average of national rates showed a gradual deterioration in employment performance, indicating that the resilience of labour markets to the adverse context was weakening in many countries (ECLAC/ILO, 2016).
21 These rates are not comparable with data published earlier because of a change in the regional series (see box I.2).
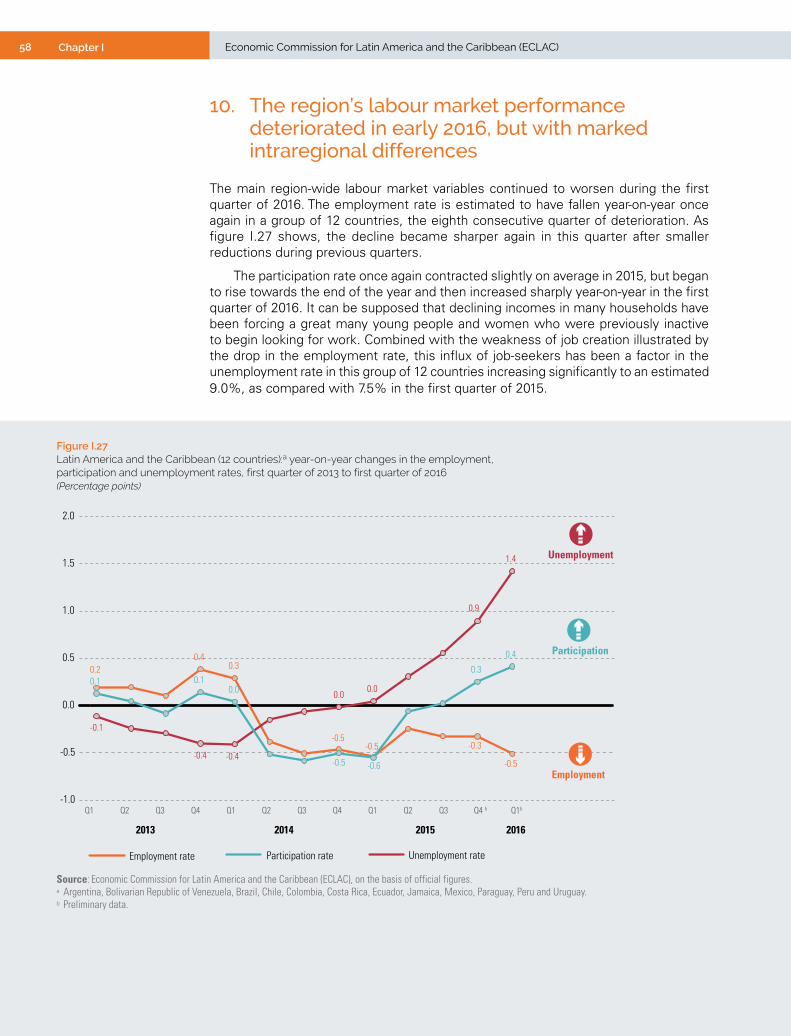
58 Chapter I Economic Commission for Latin America and the Caribbean (ECLAC)
10. The region’s labour market performance deteriorated in early 2016, but with marked intraregional differences
The main region-wide labour market variables continued to worsen during the first quarter of 2016. The employment rate is estimated to have fallen year-on-year once again in a group of 12 countries, the eighth consecutive quarter of deterioration. As figure I.27 shows, the decline became sharper again in this quarter after smaller reductions during previous quarters.
The participation rate once again contracted slightly on average in 2015, but began to rise towards the end of the year and then increased sharply year-on-year in the first quarter of 2016. It can be supposed that declining incomes in many households have been forcing a great many young people and women who were previously inactive to begin looking for work. Combined with the weakness of job creation illustrated by the drop in the employment rate, this influx of job-seekers has been a factor in the unemployment rate in this group of 12 countries increasing significantly to an estimated 9.0%, as compared with 7.5% in the first quarter of 2015.
Figure I.27 Latin America and the Caribbean (12 countries):a year-on-year changes in the employment, participation and unemployment rates, first quarter of 2013 to first quarter of 2016(Percentage points)
0.20.4
0.3
--0.5
-0.5 -0.3
-0.5
-
-0.1
-0.4 -0.4
0.00.0
0.9
1.4
0.1 0.10.0
--
-0.5 -0.6
0.3
0.4
-1.0
-0.5
0.0
0.5
1.0
1.5
2.0
Q1 Q2 Q3 Q4 Q1 Q2 Q3 Q4 Q1 Q2 Q3 Q4 b Q1b
2013 2014 2015 2016
Employment rate Unemployment rateParticipation rate
Unemployment
Employment
Participation
Source: Economic Commission for Latin America and the Caribbean (ECLAC), on the basis of official figures.a Argentina, Bolivarian Republic of Venezuela, Brazil, Chile, Colombia, Costa Rica, Ecuador, Jamaica, Mexico, Paraguay, Peru and Uruguay.b Preliminary data.
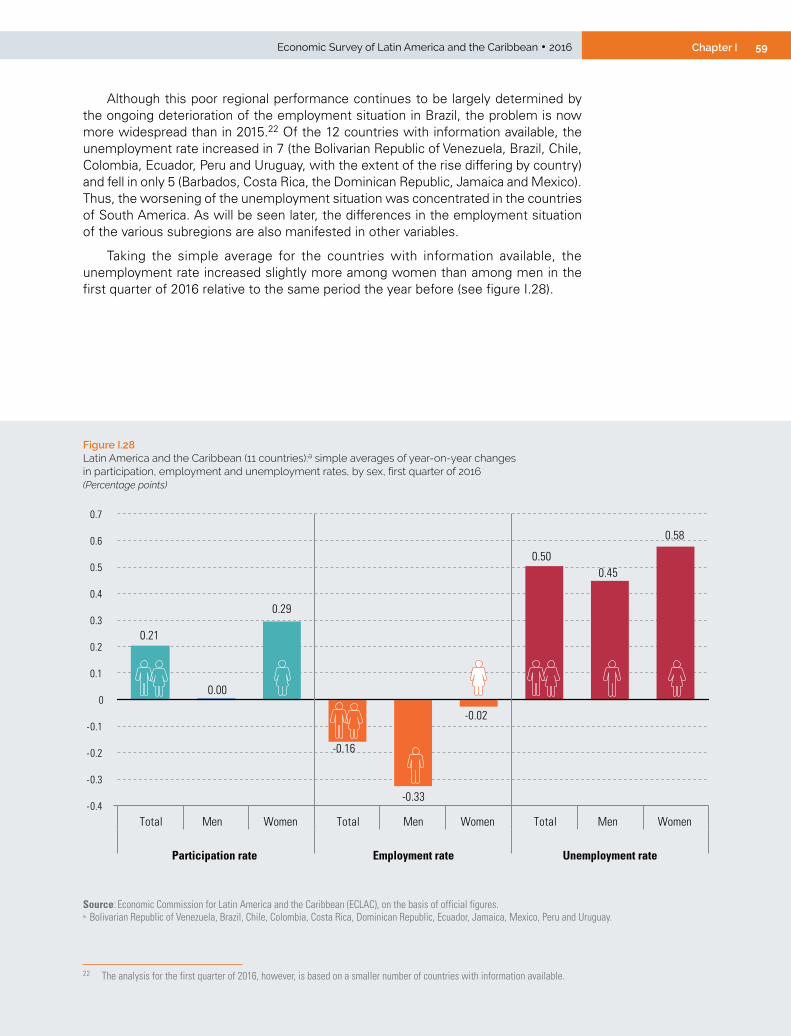
59Chapter IEconomic Survey of Latin America and the Caribbean • 2016
Although this poor regional performance continues to be largely determined by the ongoing deterioration of the employment situation in Brazil, the problem is now more widespread than in 2015.22 Of the 12 countries with information available, the unemployment rate increased in 7 (the Bolivarian Republic of Venezuela, Brazil, Chile, Colombia, Ecuador, Peru and Uruguay, with the extent of the rise differing by country) and fell in only 5 (Barbados, Costa Rica, the Dominican Republic, Jamaica and Mexico). Thus, the worsening of the unemployment situation was concentrated in the countries of South America. As will be seen later, the differences in the employment situation of the various subregions are also manifested in other variables.
Taking the simple average for the countries with information available, the unemployment rate increased slightly more among women than among men in the first quarter of 2016 relative to the same period the year before (see figure I.28).
22 The analysis for the first quarter of 2016, however, is based on a smaller number of countries with information available.
Figure I.28 Latin America and the Caribbean (11 countries):a simple averages of year-on-year changes in participation, employment and unemployment rates, by sex, first quarter of 2016(Percentage points)
-0.4
-0.3
-0.2
-0.1
0
0.1
0.2
0.3
0.4
0.5
0.6
0.7
Total Men Women Total Men Women Total Men Women
Participation rate Employment rate Unemployment rate
0.21
0.00
0.29
-0.16
-0.33
-0.02
0.500.45
0.58
Source: Economic Commission for Latin America and the Caribbean (ECLAC), on the basis of official figures.a Bolivarian Republic of Venezuela, Brazil, Chile, Colombia, Costa Rica, Dominican Republic, Ecuador, Jamaica, Mexico, Peru and Uruguay.

60 Chapter I Economic Commission for Latin America and the Caribbean (ECLAC)
The factors behind the increase in the unemployment rate varied by sex. The male unemployment rate rose because of a sharp contraction in the employment rate, while the participation rate held steady. By contrast, the female unemployment rate rose because of a large increase in labour market participation that was not accompanied by a higher level of employment, as the employment rate held steady.
Thus, the gaps between the male and female participation and employment rates have been tending to close, but the unemployment gap has increased slightly.
The weakness of job creation has been due to the stagnation of wage employment. The rate of job creation in this category has slowed continuously over recent years, from 1.6% in 2013 to 0.8% in 2014 and 0.3% in 2015. Mainly because of the sharp year-on-year drop in wage employment in Brazil (-3.7%) in the first quarter of 2016, employment in this category was down by 0.5% region-wide on the same period the year before (see figure I.29).
Figure I.29 Latin America and the Caribbean (9 countries):a year-on-year changes in numbers employed by occupational category and gross domestic product (GDP) growth rate, 2013 to first quarter of 2016(Percentages)
-2
-1
0
1
2
3
4
5
2013 2014 2015 First quarterof 2016b
Total employed
Wage workers
Own-account workers
Gross domestic product
Source: Economic Commission for Latin America and the Caribbean (ECLAC), on the basis of official figures.a Bolivarian Republic of Venezuela, Brazil, Chile, Colombia, Costa Rica, Dominican Republic, Ecuador, Mexico and Peru. b GDP growth rate projected for 2016.
Although wage employment carried on expanding in most of the countries (in contrast to the region-wide rate), the increase was weak, and own-account work grew at higher rates than wage employment in six of the nine countries with information available. This reflects the need of many households for some extra income, even if it is from low-quality work, in a context of low demand for labour. The exceptions are Mexico, where wage employment grew by more than own-account employment, and Costa Rica and the Dominican Republic, where the former held steady or expanded while the latter contracted.
In any event, quite apart from the deterioration in job quality entailed by the expansion of own-account work,23 this expansion was not enough to quantitatively offset the contraction in wage work, and the employment rate in the 12 countries mentioned fell from 57.5% in the first quarter of 2015 to an estimated 56.9% in the same period of 2016.
23 In Latin America as a whole, the informality rate is 82.3% among own-account workers and 33.7% among wage workers (ILO, 2014, p. 12).
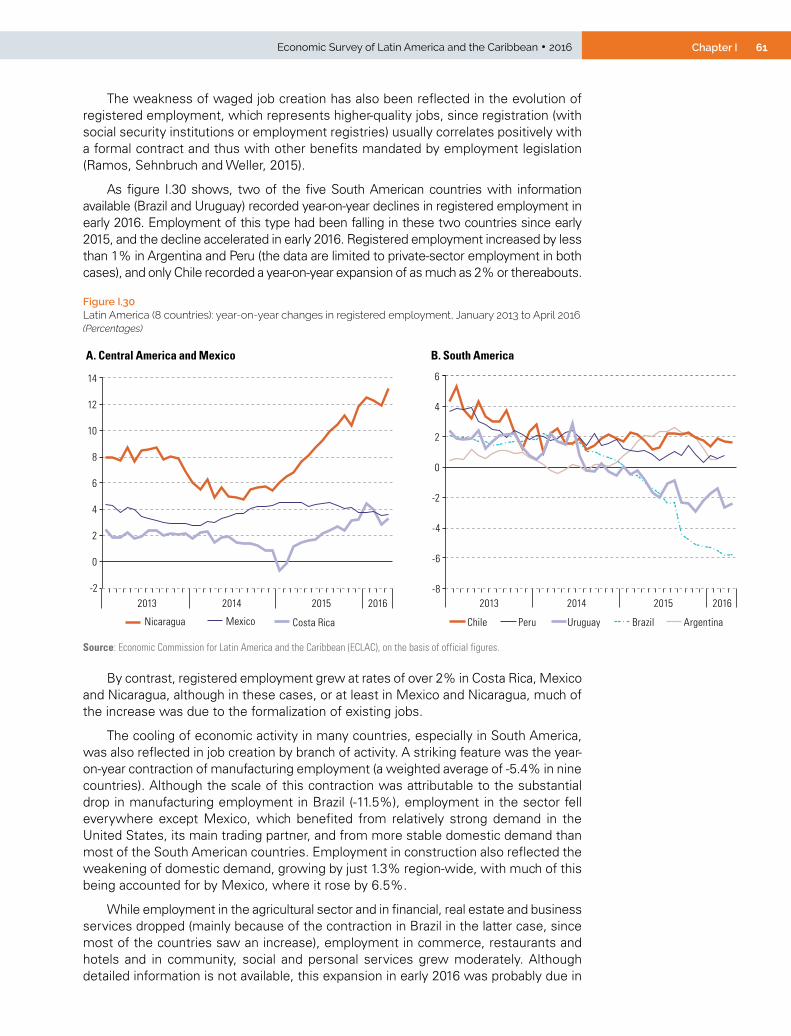
61Chapter IEconomic Survey of Latin America and the Caribbean • 2016
The weakness of waged job creation has also been reflected in the evolution of registered employment, which represents higher-quality jobs, since registration (with social security institutions or employment registries) usually correlates positively with a formal contract and thus with other benefits mandated by employment legislation (Ramos, Sehnbruch and Weller, 2015).
As figure I.30 shows, two of the five South American countries with information available (Brazil and Uruguay) recorded year-on-year declines in registered employment in early 2016. Employment of this type had been falling in these two countries since early 2015, and the decline accelerated in early 2016. Registered employment increased by less than 1% in Argentina and Peru (the data are limited to private-sector employment in both cases), and only Chile recorded a year-on-year expansion of as much as 2% or thereabouts.
Figure I.30 Latin America (8 countries): year-on-year changes in registered employment, January 2013 to April 2016(Percentages)
A. Central America and Mexico B. South America
-2
0
2
4
6
8
10
12
14
2013 2014 2015 2016
Costa RicaMexicoNicaragua
-8
-6
-4
-2
0
2
4
6
2013 2014 2015 2016
ArgentinaBrazilChile Peru Uruguay
Source: Economic Commission for Latin America and the Caribbean (ECLAC), on the basis of official figures.
By contrast, registered employment grew at rates of over 2% in Costa Rica, Mexico and Nicaragua, although in these cases, or at least in Mexico and Nicaragua, much of the increase was due to the formalization of existing jobs.
The cooling of economic activity in many countries, especially in South America, was also reflected in job creation by branch of activity. A striking feature was the year-on-year contraction of manufacturing employment (a weighted average of -5.4% in nine countries). Although the scale of this contraction was attributable to the substantial drop in manufacturing employment in Brazil (-11.5%), employment in the sector fell everywhere except Mexico, which benefited from relatively strong demand in the United States, its main trading partner, and from more stable domestic demand than most of the South American countries. Employment in construction also reflected the weakening of domestic demand, growing by just 1.3% region-wide, with much of this being accounted for by Mexico, where it rose by 6.5%.
While employment in the agricultural sector and in financial, real estate and business services dropped (mainly because of the contraction in Brazil in the latter case, since most of the countries saw an increase), employment in commerce, restaurants and hotels and in community, social and personal services grew moderately. Although detailed information is not available, this expansion in early 2016 was probably due in
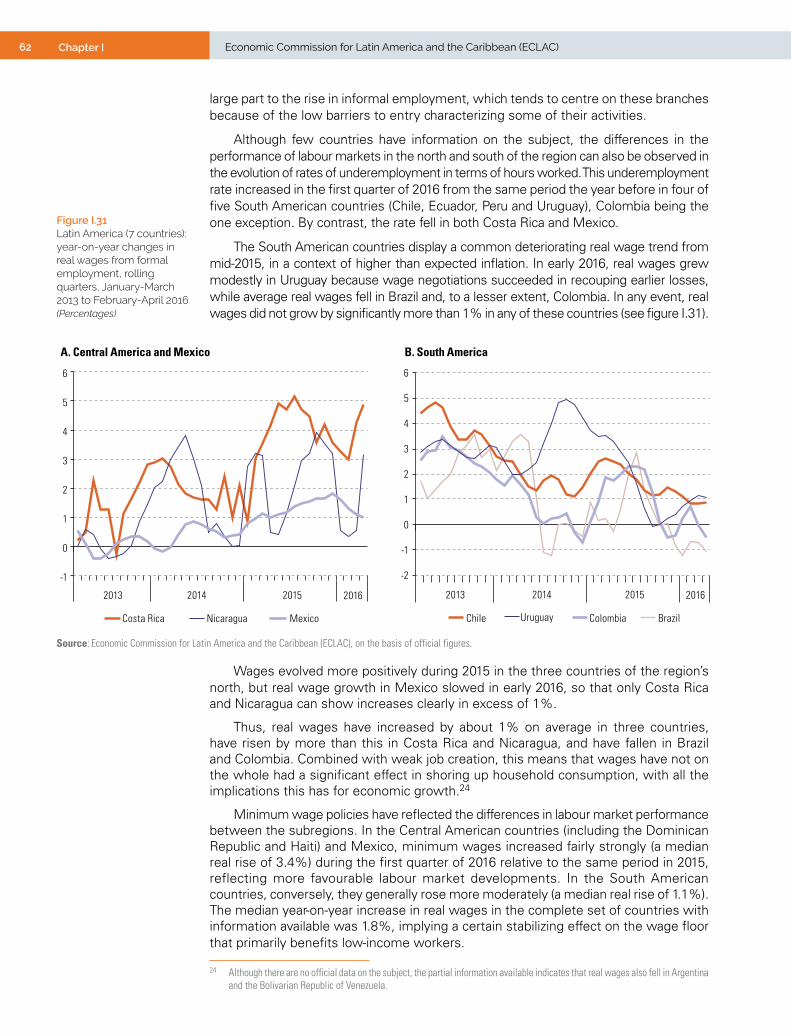
62 Chapter I Economic Commission for Latin America and the Caribbean (ECLAC)
large part to the rise in informal employment, which tends to centre on these branches because of the low barriers to entry characterizing some of their activities.
Although few countries have information on the subject, the differences in the performance of labour markets in the north and south of the region can also be observed in the evolution of rates of underemployment in terms of hours worked. This underemployment rate increased in the first quarter of 2016 from the same period the year before in four of five South American countries (Chile, Ecuador, Peru and Uruguay), Colombia being the one exception. By contrast, the rate fell in both Costa Rica and Mexico.
The South American countries display a common deteriorating real wage trend from mid-2015, in a context of higher than expected inflation. In early 2016, real wages grew modestly in Uruguay because wage negotiations succeeded in recouping earlier losses, while average real wages fell in Brazil and, to a lesser extent, Colombia. In any event, real wages did not grow by significantly more than 1% in any of these countries (see figure I.31).
Figure I.31 Latin America (7 countries): year-on-year changes in real wages from formal employment, rolling quarters, January-March 2013 to February-April 2016(Percentages)
A. Central America and Mexico B. South America
Nicaragua Colombia BrazilChile Uruguay
-1
0
1
2
3
4
5
6
2013 2014 2015 2016
Costa Rica Mexico
-2
-1
0
1
2
3
4
5
6
2013 2014 2015 2016
Source: Economic Commission for Latin America and the Caribbean (ECLAC), on the basis of official figures.
Wages evolved more positively during 2015 in the three countries of the region’s north, but real wage growth in Mexico slowed in early 2016, so that only Costa Rica and Nicaragua can show increases clearly in excess of 1%.
Thus, real wages have increased by about 1% on average in three countries, have risen by more than this in Costa Rica and Nicaragua, and have fallen in Brazil and Colombia. Combined with weak job creation, this means that wages have not on the whole had a significant effect in shoring up household consumption, with all the implications this has for economic growth.24
Minimum wage policies have reflected the differences in labour market performance between the subregions. In the Central American countries (including the Dominican Republic and Haiti) and Mexico, minimum wages increased fairly strongly (a median real rise of 3.4%) during the first quarter of 2016 relative to the same period in 2015, reflecting more favourable labour market developments. In the South American countries, conversely, they generally rose more moderately (a median real rise of 1.1%). The median year-on-year increase in real wages in the complete set of countries with information available was 1.8%, implying a certain stabilizing effect on the wage floor that primarily benefits low-income workers.
24 Although there are no official data on the subject, the partial information available indicates that real wages also fell in Argentina and the Bolivarian Republic of Venezuela.
63Chapter IEconomic Survey of Latin America and the Caribbean • 2016
11. Economic developments in the region have continued to affect labour markets adversely in 2016
At the regional level, the GDP contraction projected for 2016 as a whole indicates that the demand for labour is expected to remain weak and wage employment growth low. In addition to increasing the supply of labour and thence the participation rate, this can be expected to result in a higher unemployment rate and lower average job quality as a larger number of substandard jobs are created.
For the year on average, the region’s urban unemployment rate is expected to rise by between 0.7 and 0.8 percentage points, leaving it (in the new series) at 8.1% or 8.2%.
Meanwhile, subregional differences in projected growth are expected to carry on affecting the labour market performance of the South American countries, on the one hand, and Mexico and the Central American countries, on the other.
Open unemployment is still at fairly low levels by historical standards in most of the countries, which is helping to stabilize real wages. The pattern of the early part of the year, consisting of small real-term increases in average wages for those in registered employment, can be expected to continue, except in countries where inflation is high or rises unexpectedly.
Box I.2 Aspects of measuring and analysing labour markets in Latin America and the Caribbean
Over recent years, many of the region’s countries have been gradually expanding the geographical coverage of their household surveys, which are the main source of information on the evolution of labour markets. This expansion has been from the main metropolitan area or major metropolitan areas towards a larger number of urban areas or all of them, until full coverage of the country’s territory has been achieved. This new situation means that the main labour market variables can be analysed nationwide in more and more countries, which facilitates international comparison. However, the analysis presented in this Economic Survey is still centred on urban areas, since certain characteristics of labour markets are reflected most clearly there. In this context, the expanded coverage of some surveys allows all urban areas to be considered, and not just a limited number of metropolitan areas.
In addition, the countries adjust their measuring methodologies quite frequently in order to adapt them to the recommendations of the International Conference of Labour Statisticians, among other reasons. Other changes concern the frequency of information-gathering. In recent years, for example, some countries have supplemented or replaced an annual survey with continuous or quarterly surveys to enhance their ability to analyse the labour market situation.
Regional analysis tends to use weighted averages, so the recent decision to introduce the Continuous National Household Survey (PNAD-C) in Brazil has a major impact. This survey replaces the annual National Household Survey (PNAD), carried out for the last time in 2014, and the Monthly Employment Survey (PME), which was carried out in six metropolitan areas until February 2016 and was the source of data used until then to analyse the Brazilian labour market situation. Starting with this Economic Survey, data collected under PNAD-C will be used. There are significant differences in coverage between PME and PNAD-C, which, together with changes in the way data are gathered and measured, will affect not just the series for Brazil, but the regional series as well.
This change in the regional series is being used as an opportunity to improve the way information on urban labour markets is incorporated, so that there are changes in coverage in the following cases:
• Brazil: coverage is expanded from 6 to 20 metropolitan areas.
• Colombia: coverage is expanded from 13 cities and metropolitan areas to all municipal capitals.
• Mexico: coverage is expanded from 32 cities to all urban areas.
• Dominican Republic: use is being made of the information on urban areas that is now available, whereas previously national-level variables were presented.
In consequence of the changes in methodology and coverage, the levels of the regional series for urban unemployment, participation and employment rates have likewise changed relative to the figures published in earlier editions of this report.
Source: Economic Commission for Latin America and the Caribbean (ECLAC).

64 Chapter I Economic Commission for Latin America and the Caribbean (ECLAC)
D. Macroeconomic policy
1. Mixed results for fiscal indicators in 2015
As estimated in Preliminary Overview of the Economies of Latin America and the Caribbean, 2015 (ECLAC, 2015b), the overall deficit of Latin American countries at the central government level —taking the simple average of countries with available information— increased from 2.8% of GDP in 2014 to 3.0% of GDP in 2015 (see figure I.32). The primary deficit, which does not include interest payments, remained stable at 1.0% of GDP.
Figure I.32 Latin America and the Caribbean: central government fiscal indicators, 2009-2015(Percentages of GDP)
-2.8-1.9 -1.6 -1.9 -2.3 -2.8 -3.0
-1.0 -0.3 0.1 -0.2 -0.6 -1.0 -1.0
-6
-4
-2
0
2
4
6
8
10
12
10
12
14
16
18
20
22
24
2009 2010 2011 2012 2013 2014 2015
Overall balance (right scale) Primary balance (right scale)Total revenue (left scale)Total spending (left scale)
A. Latin America (19 countries)
-4.5-3.6 -3.6 -3.3 -4.0
-2.6 -2.6
-0.2 0.0 0.0 0.1-0.7
0.7 0.6
-6
-4
-2
0
2
4
6
8
10
12
10
15
20
25
30
35
2009 2010 2011 2012 2013 2014 2015
B. The Caribbean (13 countries)
Source: Economic Commission for Latin America and the Caribbean (ECLAC), on the basis of official figures.
While the overall deficit deteriorated in 12 of the 19 Latin American countries under consideration, the annual trend was largely defined by Brazil, where the deficit jumped from 5.3% of GDP to 9.3% of GDP, and Peru, where it widened from 0.5% to 2.9% of GDP. Brazil’s performance reflected both an increase in interest payments (which rose from 5.0% of GDP to 7.3% of GDP) and a drop in tax revenues, while the widening of Peru’s deficit was caused chiefly by shrinking public revenues (down from 19.1% of GDP to 16.7% of GDP) as a result of tax cuts implemented in late 2014 and a further decline in revenues from non-renewable natural resources.
In contrast with the trend observed in Latin America, in Caribbean countries the central government fiscal balance held steady between 2014 and 2015. In fact, the overall balance improved in 8 out of 13 countries in the subregion, notably Grenada (which reduced its deficit by 3.4 percentage points of GDP) and Guyana (whose deficit narrowed by 4.1 points). However, the overall deficit deteriorated sharply in Suriname, widening by 4.5 percentage points of GDP, and Trinidad and Tobago (3 points of GDP). An increase in public revenues —which rose from an average of 26.4% of GDP in 2013 to 27.8% of GDP in 2015— was the key factor behind the improvement in the fiscal balance in recent years. This increase was concentrated in service-oriented economies, in stark contrast to the trend observed in commodity-exporting countries, where revenues from raw materials exports have slumped.

65Chapter IEconomic Survey of Latin America and the Caribbean • 2016
The public debt-to-GDP ratio for Latin America as a whole has increased, with average central government debt standing at 35.9% of GDP in 2015, up 2.5 percentage points on the previous year (see figure I.33). Public debt increased in 15 out of 19 Latin American countries, with Brazil reporting the highest figure (66.5% of GDP), followed by Argentina (53.3%) and Uruguay (46%). By contrast, Paraguay had the region’s lowest debt at 17.3% of GDP, followed by Chile and Peru (17.5% and 19.5% of GDP, respectively).
Figure I.33 Latin America and the Caribbean: central government gross public debt, 2014 and 2015(Percentages of GDP)
35.9
0
10
20
30
40
50
60
70
80
2014 2015
71.673.0 67.8 65.250.9
47.9 42.937.1
76.377.5
78.680.0
106.8
127.0
0
20
40
60
80
100
120
140
2014 2015
66.5
53.3
46.0 45.2 44.2 42.4 43.938.4 36.035.9 35.5
31.4 31.027.4 27.1
24.619.5
17.5 16.6
Latin
Am
eric
a (1
9 co
untr
ies)
Braz
il
Arge
ntin
a
Urug
uay
El S
alva
dor
Hond
uras
Cost
a Ri
ca
Colo
mbi
a
Pana
ma
Dom
inic
an R
ep.
Haiti
Mex
ico
Nic
arag
ua
Ecua
dor
Vene
zuel
a (B
ol. R
ep. o
f)
Boliv
ia (P
lur.
Stat
e of
)
Guat
emal
a
Peru
Chile
Para
guay
The
Carib
bean
(13
coun
tries
)
Jam
aica
Barb
ados
Gren
ada
Beliz
e
Antig
ua a
nd B
arbu
da
Baha
mas
Sain
t Luc
ia
Dom
inic
a
Sain
t Vin
cent
and
the
Gren
adin
es
Sain
t Kitt
s an
d N
evis
Guya
na
Trin
idad
and
Tob
ago
Surin
ame
A. Latin America B. The Caribbean
Source: Economic Commission for Latin America and the Caribbean (ECLAC), on the basis of official figures.
In the Caribbean, central government public debt diminished slightly to 71.6% of GDP in 2015, albeit with debt levels increasing in 6 of the 13 countries studied. Jamaica had the highest public debt in the subregion (equivalent to 127% of GDP), although it also achieved one of the region’s largest reductions, equivalent to 6 percentage points of GDP since 2014. There was an increase in public debt servicing in 2015: Jamaica’s interest payments amounted to 7.8% of GDP, while those of Barbados, which had the next highest debt-to-GDP ratio, were equivalent to 7.5% of GDP.
Debt service costs have risen; in 2015 they equated to 2% of GDP in Latin America and 3.2% of GDP in the Caribbean. As figure I.34 shows, Brazil had the region’s highest level of interest payments in 2015, at 7.3% of GDP, ahead of the Dominican Republic and Costa Rica (2.9% of GDP in both cases). At the other extreme, Chile, Paraguay and Haiti had the region’s lowest interest payments in 2015, reporting figures below 0.7% of GDP, equivalent to 3% of public revenues.
As described in chapter II of this edition of the Economic Survey, public spending and especially capital expenditure declined in 2015 as a result of adjustments. On average, Latin America observed a reduction in capital expenditure of 0.5 points of GDP, chiefly in hydrocarbon-exporting countries such as the Bolivarian Republic of Venezuela, Colombia, Ecuador and the Plurinational State of Bolivia (see figure I.35). Public investment also slipped by 0.6 points of GDP in the Caribbean, whereas Brazil and the mineral- and metal-exporting countries (Chile and Peru) increased capital expenditure, albeit only slightly.

66 Chapter I Economic Commission for Latin America and the Caribbean (ECLAC)
0
1
2
3
4
5
6
7
8
Braz
il
Dom
inic
an R
ep.
Cost
a Ri
ca
Hond
uras
Colo
mbi
a
El S
alva
dor
Urug
uay
Arge
ntin
a
Latin
Am
eric
a (1
9 co
untri
es)
Pana
ma
Mex
ico
Ecua
dor
Guat
emal
a
Vene
zuel
a (B
ol. R
ep. o
f)
Peru
Nic
arag
ua
Boliv
ia (P
lur.
Stat
e of
)
Chile
Para
guay
Haiti
Source: Economic Commission for Latin America and the Caribbean (ECLAC), on the basis of official figures.
Figure I.34 Latin America: public debt interest payments, 2015(Percentages of GDP)
Figure I.35 Latin America and the Caribbean: disaggregated central government public spending, by subregion and country grouping, 2014 and 2015a b
(Percentages of GDP)
15.4 15.321.2 22.4 20.7 21.4
15.0 15.612.4 12.4
18.3 16.8 15.8 16.2 17.7 18.2 19.9 20.4
1.8 2.0
3.3 3.2 5.07.3
1.7 1.7
1.8 1.9
1.71.7
0.8 0.91.5 1.6
3.2 3.14.6 4.1
5.5 4.81.7
2.0
2.9 3.33.5 3.3
9.17.5
4.3 4.53.1 2.6
5.8 5.5
21.8 21.4
30.0 30.327.4
30.7
19.6 20.617.7 17.7
29.126.0
21.0 21.6 22.3 22.4
29.0 29.0
2014 2015 2014 2015 2014 2015 2014 2015 2014 2015 2014 2015 2014 2015 2014 2015 2014 2015
Latin America(19 countries)
The Caribbean(13 countries)
Brazil Mexico Central Americaand
Dominican Rep.
Hydrocarbonexporters
Current primary spendingInterestCapital spending
Foodexporters
Servicesexporters
Mineral and metalexporters
Source: Economic Commission for Latin America and the Caribbean (ECLAC), on the basis of official figures.a Federal public sector coverage in the case of Mexico.b The hydrocarbon exporter category consists of the Bolivarian Republic of Venezuela, Colombia, Ecuador and the Plurinational State of Bolivia. Chile and Peru are classified
as mineral and metal exporters, while the food exporters are Argentina, Paraguay and Uruguay. Services exporters are Antigua and Barbuda, the Bahamas, Barbados, Belize, Dominica, Grenada, Jamaica, Panama, Saint Kitts and Nevis, Saint Lucia and Saint Vincent and the Grenadines.
Current primary spending in Latin America diminished slightly during 2015 after rising continuously as a share of GDP for a number of years. There was a sharp fall in hydrocarbon-exporting countries (1.4 percentage points of GDP), contrasting with a solid increase (0.5 points of GDP) in food-exporting countries (Argentina, Paraguay and Uruguay). In the Caribbean, current primary spending jumped by 1.1 points of GDP, with the largest rises in Guyana, Suriname and Trinidad and Tobago.

67Chapter IEconomic Survey of Latin America and the Caribbean • 2016
2. Figures indicate a slight improvement in the fiscal balance for 2016
Slower growth and deteriorating terms of trade have been having very substantial effects on the public finances in several of the region’s countries, giving rise to large fiscal adjustments. Preliminary figures for the first quarter of 2016 suggest that public revenues continued to shrink; however, unlike in 2015, public spending was reined in by an even greater margin. Consequently, the overall balance improved by an average of 0.2 percentage points of GDP in the first quarter of 2016, which in turn reflects the fact that 12 out of 16 Latin American countries reported improvements for this indicator (see table I.3).
Table I.3 Latin America and the Caribbean (19 countries): change in central government fiscal indicators, first quarter of 2015 to first quarter of 2016a
(Percentages of annual GDP)
Revenues Spending
Overall balanceTotal
Tax revenues (excluding
social security
contributions)
Other revenuesb Total
Current primary
spendingInterest Capital
expenditure
Latin America 0.0 0.0 0.0 -0.2 -0.1 -0.1 0.0 0.2
Argentinac 0.6 0.0 0.5 0.0 0.1 0.0 -0.1 0.6
Bolivia (Plurinational State of)d -1.0 -0.3 -0.6 -1.3 -0.6 -0.1 -0.6 0.4
Brazil -0.1 -0.2 0.1 -1.0 0.3 -1.2 -0.1 0.9
Chile 0.5 0.5 0.0 0.1 0.1 0.0 0.0 0.4
Costa Rica 0.0 0.0 0.0 -0.3 -0.3 0.1 -0.1 0.3
Dominican Republice 0.0 0.0 0.0 1.0 0.3 0.1 0.6 -0.9
Ecuador -0.3 -0.2 -0.1 0.2 -0.1 0.1 0.2 -0.5
El Salvador -0.2 -0.1 -0.1 -0.2 -0.2 0.0 0.0 0.1
Guatemala -0.2 -0.2 0.0 -0.5 -0.3 0.0 -0.1 0.3
Honduras 0.2 0.2 0.0 0.1 0.1 0.0 -0.1 0.1
Mexico -0.4 0.1 -0.4 -0.3 -0.3 0.0 -0.1 0.0
Nicaragua 0.3 0.3 0.0 -0.3 -0.4 0.0 0.1 0.5
Panama 0.2 0.2 0.0 0.0 -0.2 0.0 0.2 0.2
Paraguay 0.1 -0.1 0.2 0.1 0.1 0.1 0.0 0.0
Peru -0.3 -0.2 -0.2 0.0 0.2 0.1 -0.2 -0.4
Uruguayf -0.1 -0.1 0.0 -0.6 -0.6 0.0 0.0 0.5
The Caribbean -0.4 -0.7 0.3 0.3 0.2 0.0 0.1 -0.7
Guyana 0.1 -0.5 0.6 1.1 1.1 0.0 0.1 -1.0
Jamaica 0.3 0.1 0.2 0.3 0.1 0.0 0.1 0.0
Trinidad and Tobago -1.7 -1.8 0.1 -0.5 -0.5 0.0 0.0 -1.3
Source: Economic Commission for Latin America and the Caribbean (ECLAC), on the basis of official sources.a Figures may not add up to the corresponding total because of rounding. b Social-security contributions, income from capital and external donations.c National non-financial public sector.d General government.e For the purposes of analysis, the extraordinary donation received by the country in January 2015 is not included.f Consolidated central government.
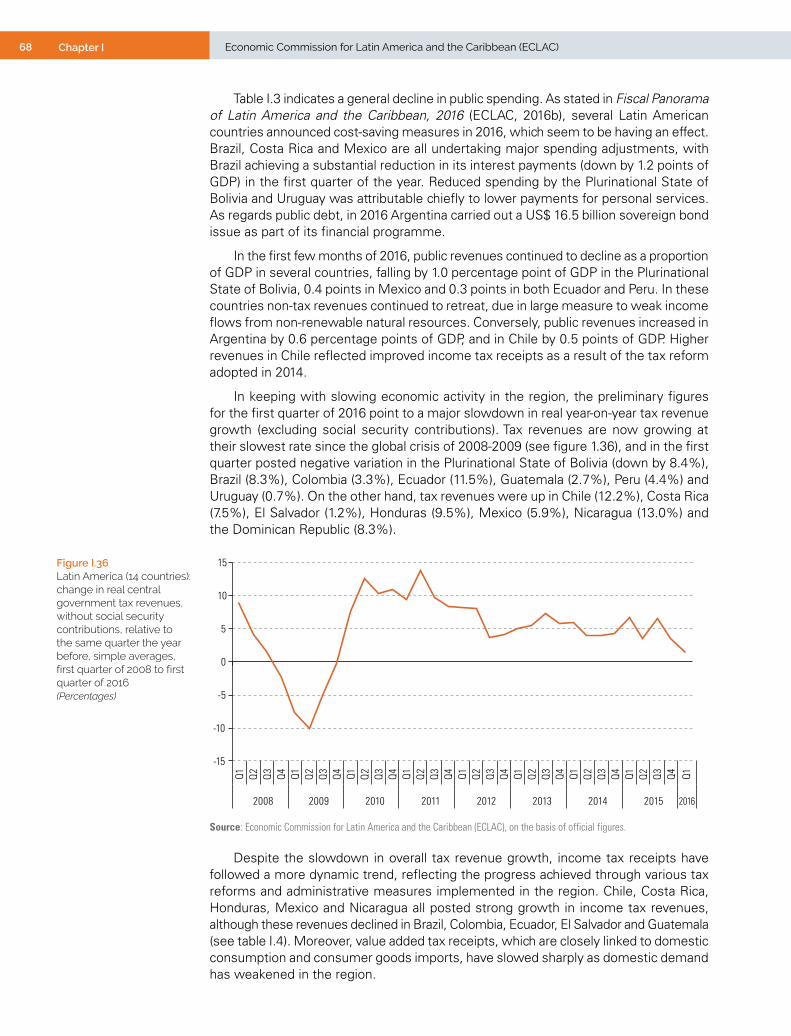
68 Chapter I Economic Commission for Latin America and the Caribbean (ECLAC)
Table I.3 indicates a general decline in public spending. As stated in Fiscal Panorama of Latin America and the Caribbean, 2016 (ECLAC, 2016b), several Latin American countries announced cost-saving measures in 2016, which seem to be having an effect. Brazil, Costa Rica and Mexico are all undertaking major spending adjustments, with Brazil achieving a substantial reduction in its interest payments (down by 1.2 points of GDP) in the first quarter of the year. Reduced spending by the Plurinational State of Bolivia and Uruguay was attributable chiefly to lower payments for personal services. As regards public debt, in 2016 Argentina carried out a US$ 16.5 billion sovereign bond issue as part of its financial programme.
In the first few months of 2016, public revenues continued to decline as a proportion of GDP in several countries, falling by 1.0 percentage point of GDP in the Plurinational State of Bolivia, 0.4 points in Mexico and 0.3 points in both Ecuador and Peru. In these countries non-tax revenues continued to retreat, due in large measure to weak income flows from non-renewable natural resources. Conversely, public revenues increased in Argentina by 0.6 percentage points of GDP, and in Chile by 0.5 points of GDP. Higher revenues in Chile reflected improved income tax receipts as a result of the tax reform adopted in 2014.
In keeping with slowing economic activity in the region, the preliminary figures for the first quarter of 2016 point to a major slowdown in real year-on-year tax revenue growth (excluding social security contributions). Tax revenues are now growing at their slowest rate since the global crisis of 2008-2009 (see figure 1.36), and in the first quarter posted negative variation in the Plurinational State of Bolivia (down by 8.4%), Brazil (8.3%), Colombia (3.3%), Ecuador (11.5%), Guatemala (2.7%), Peru (4.4%) and Uruguay (0.7%). On the other hand, tax revenues were up in Chile (12.2%), Costa Rica (7.5%), El Salvador (1.2%), Honduras (9.5%), Mexico (5.9%), Nicaragua (13.0%) and the Dominican Republic (8.3%).
Figure I.36 Latin America (14 countries): change in real central government tax revenues, without social security contributions, relative to the same quarter the year before, simple averages, first quarter of 2008 to first quarter of 2016(Percentages)
-15
-10
-5
0
5
10
15
Q1 Q2 Q3 Q4 Q1 Q2 Q3 Q4 Q1 Q2 Q3 Q4 Q1 Q2 Q3 Q4 Q1 Q2 Q3 Q4 Q1 Q2 Q3 Q4 Q1 Q2 Q3 Q4 Q1 Q2 Q3 Q4 Q1
2008 2009 2010 2011 2012 2013 2014 2015 2016
Source: Economic Commission for Latin America and the Caribbean (ECLAC), on the basis of official figures.
Despite the slowdown in overall tax revenue growth, income tax receipts have followed a more dynamic trend, reflecting the progress achieved through various tax reforms and administrative measures implemented in the region. Chile, Costa Rica, Honduras, Mexico and Nicaragua all posted strong growth in income tax revenues, although these revenues declined in Brazil, Colombia, Ecuador, El Salvador and Guatemala (see table I.4). Moreover, value added tax receipts, which are closely linked to domestic consumption and consumer goods imports, have slowed sharply as domestic demand has weakened in the region.

69Chapter IEconomic Survey of Latin America and the Caribbean • 2016
Table I.4 Latin America and the Caribbean (14 countries): real year-on-year variation in revenue obtained from income tax and value added tax, first quarters of 2014, 2015 and 2016(Percentages)
Income tax Value added tax2014 2015 2016 2014 2015 2016
Brazil -0.2 -0.9 -6.9 2.5 -3.5 -9.2
Chile -13.2 13.3 12.1 5.0 4.5 4.8
Colombia 13.0 -13.6 -1.9 17.5 4.2 -4.3
Costa Rica 3.5 17.5 16.9 6.3 0.3 6.7
Dominican Republic 14.1 9.6 16.5 11.7 13.4 5.1
Ecuador 5.0 4.0 -8.6 2.2 10.1 -19.5
El Salvador 4.7 7.9 -1.1 -1.6 5.6 0.2
Guatemala 1.7 -1.4 -2.0 1.1 0.5 -5.1
Honduras -2.3 17.0 13.3 23.5 17.0 8.3
Jamaica -8.1 9.7 1.1 10.3 7.8 4.7
Mexico 6.9 31.5 8.8 16.9 -0.6 5.2
Nicaragua 31.4 7.9 16.1 12.5 -1.0 10.7
Peru 8.8 -8.8 0.9 8.5 -1.7 -2.2
Uruguay 10.2 0.8 6.8 10.2 -2.1 -1.4
Simple average for Latin America and the Caribbean 5.4 6.7 5.1 9.1 3.9 0.3
Source: Economic Commission for Latin America and the Caribbean (ECLAC), on the basis of official figures.
3. Monetary, exchange-rate and macroprudential policy
(a) Inflation patterns have shaped the policy space available to the region’s monetary authorities: in the south, rising inflation has reduced the scope for policies to stimulate aggregate demand, while in the north, lower inflation has widened it
Three crucial factors determined monetary and exchange rate policy in Latin America and the Caribbean during 2015 and the first half of 2016. The first of these factors was the heavy fall in commodity prices, especially those of energy and mineral products. The second factor (partly related to the first) was growing uncertainty over the trend in external aggregate demand due to the slowdown in emerging economies, especially China, and the slow recovery of developed economies. The third and final factor was the volatility that has prevailed in international financial markets as a result of monetary policy normalization in the United States and the adoption of monetary stimulus in Europe and Japan, together with uncertainty created by other circumstances, such as political disruption in Brazil, the referendum on the United Kingdom’s membership of the European Union, and concerns about the situation of the Chinese financial system.
This general context has brought about major changes in the terms of trade and modifications in the fiscal balance and current account position of certain Latin American and Caribbean economies, while also diminishing capital inflows to the region. The impact of each of the aforementioned factors on variables such as inflation and economic activity varies greatly, depending on each country’s structural characteristics (production structure, levels of financial and trade integration, and the funding base of government) and circumstantial aspects (political and electoral cycles and exchange rate volatility). Consequently, authorities have responded in very different ways.
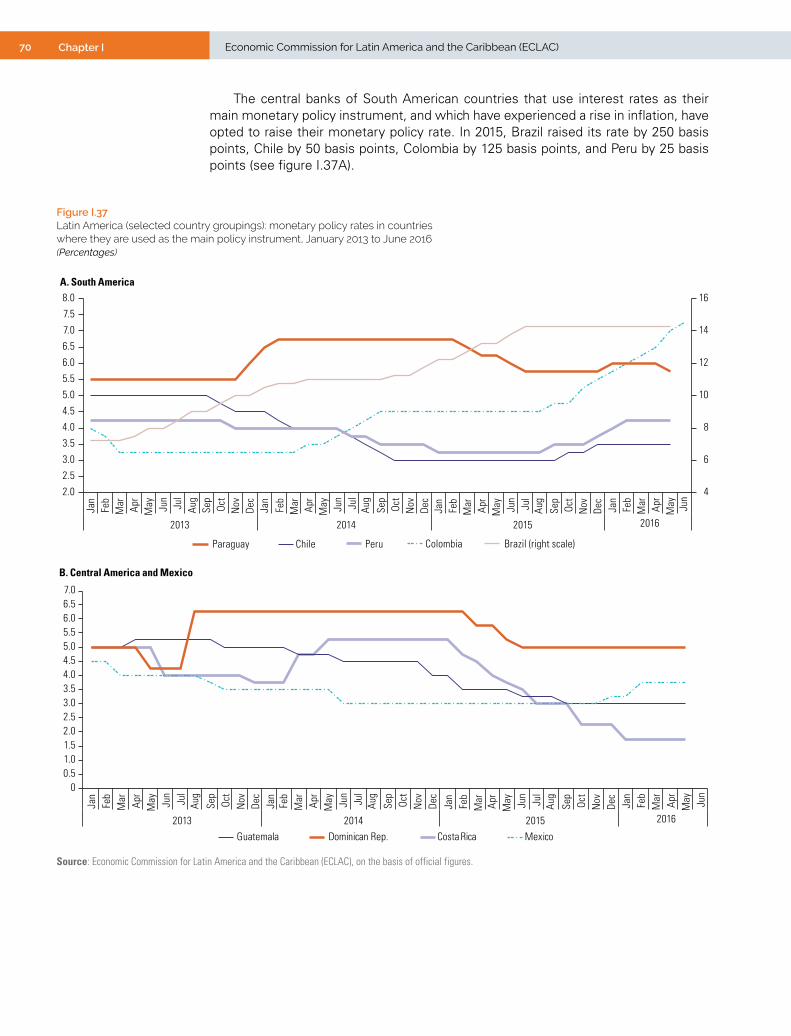
70 Chapter I Economic Commission for Latin America and the Caribbean (ECLAC)
The central banks of South American countries that use interest rates as their main monetary policy instrument, and which have experienced a rise in inflation, have opted to raise their monetary policy rate. In 2015, Brazil raised its rate by 250 basis points, Chile by 50 basis points, Colombia by 125 basis points, and Peru by 25 basis points (see figure I.37A).
Figure I.37 Latin America (selected country groupings): monetary policy rates in countries where they are used as the main policy instrument, January 2013 to June 2016(Percentages)
4
6
8
10
12
14
16
2.0
2.5
3.0
3.5
4.0
4.5
5.0
5.5
6.0
6.5
7.0
7.5
8.0
Jan
Feb
Mar Ap
rM
ay Jun
Jul
Aug
Sep
Oct
Nov
Dec
2013 2014 2015 2016
Chile ColombiaParaguay Peru Brazil (right scale)
Jan
Feb
Mar Ap
rM
ay Jun
Jul
Aug
Sep
Oct
Nov
Dec
Jan
Feb
Mar Ap
rM
ay Jun
Jul
Aug
Sep
Oct
Nov
Dec
Jan
Feb
Mar Ap
rM
ay Jun
A. South America
00.51.01.52.02.53.03.54.04.55.05.56.06.57.0
Costa RicaGuatemala MexicoDominican Rep.
Jan
Feb
Mar Ap
rM
ay Jun
Jul
Aug
Sep
Oct
Dec
2013 2014 2015 2016
Jan
Feb
Mar Ap
rM
ay Jun
Jul
Aug
Sep
Oct
Nov
Dec
Jan
Feb
Mar Ap
rM
ay Jun
Jul
Aug
Sep
Oct
Nov
Dec
Jan
Feb
Mar Ap
rM
ay Jun
Nov
B. Central America and Mexico
Source: Economic Commission for Latin America and the Caribbean (ECLAC), on the basis of official figures.

71Chapter IEconomic Survey of Latin America and the Caribbean • 2016
With the exception of Brazil, most of these rate adjustments were made in the second half of the year, partly in response to the uncertainty sown by the announcement of monetary policy normalization and a possible hike of the federal funds rate in the United States, which was eventually implemented by the Federal Reserve in December 2015.
In the first six months of 2016, Colombia and Peru both raised their monetary policy rate. In Peru the rate was increased on two occasions, in January and February, by a total of 50 basis points, while in Colombia there were five successive interventions (in February, March, April, May and June) which raised the rate by 150 basis points in total. Interest rates in Brazil and Chile remained unchanged in the first half of 2016.
Of the South American economies that use the monetary policy rate as their main policy instrument, only Paraguay posted a drop in inflation during 2015, allowing the country’s central bank to cut the monetary policy rate by 100 basis points. In May 2016, the Central Bank of Paraguay again reduced rates by 25 basis points, taking advantage of the available space to stimulate domestic aggregate demand.
Although inflation has been above the ceiling of the established target range in the group of South American countries that use the monetary policy rate as their main policy instrument, central banks reported that, according to several indicators, expectations are for 12-month inflation to remain within the target range.25
In the South American economies that use monetary aggregates as the principal policy instrument, the slowdown in economic activity has persuaded the monetary authorities to adopt policies to boost aggregate demand. As a result, the monetary base expanded at a faster rate during 2015. However, the rise in prices observed during 2015 led the monetary authorities to slow the growth of monetary base in the first quarter of 2016, as figure I.38 shows.
Figure I.38 Latin America and the Caribbean (selected country groupings): monetary base in countries using monetary aggregates as the main policy instrument, first quarter of 2010 to first quarter of 2016(Percentages)
-20
0
20
40
60
80
100
120
140
0
5
10
15
20
25
30
35
Q1 Q2 Q3 Q4 Q1 Q2 Q3 Q4 Q1 Q2 Q3 Q4 Q1 Q2 Q3 Q4 Q1 Q2 Q3 Q4 Q1 Q1Q2 Q3 Q4
2010 2011 2012 2013 2014 2015 2016
South America(except Venezuela(Bol. Rep. of))
The Caribbean
Venezuela (Bol. Rep. of)(right scale)
Dollarized economies
Source: Economic Commission for Latin America and the Caribbean (ECLAC), on the basis of official figures.
25 In Brazil, 12-month inflation is expected to exceed the ceiling of the target range.
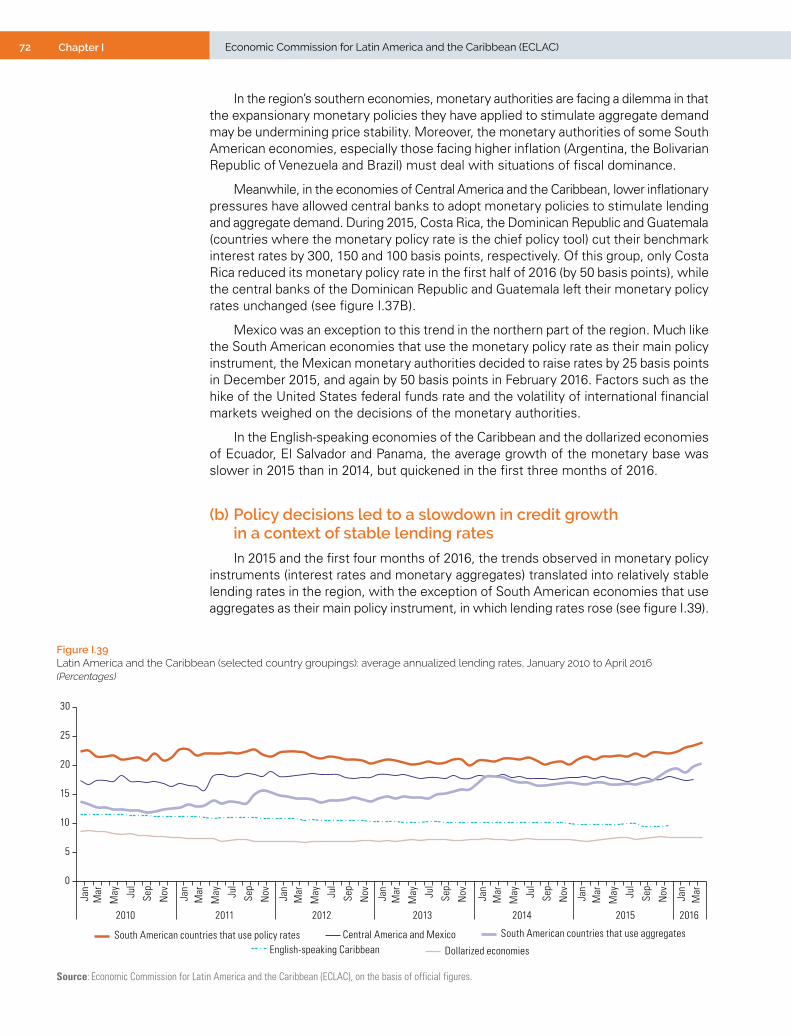
72 Chapter I Economic Commission for Latin America and the Caribbean (ECLAC)
In the region’s southern economies, monetary authorities are facing a dilemma in that the expansionary monetary policies they have applied to stimulate aggregate demand may be undermining price stability. Moreover, the monetary authorities of some South American economies, especially those facing higher inflation (Argentina, the Bolivarian Republic of Venezuela and Brazil) must deal with situations of fiscal dominance.
Meanwhile, in the economies of Central America and the Caribbean, lower inflationary pressures have allowed central banks to adopt monetary policies to stimulate lending and aggregate demand. During 2015, Costa Rica, the Dominican Republic and Guatemala (countries where the monetary policy rate is the chief policy tool) cut their benchmark interest rates by 300, 150 and 100 basis points, respectively. Of this group, only Costa Rica reduced its monetary policy rate in the first half of 2016 (by 50 basis points), while the central banks of the Dominican Republic and Guatemala left their monetary policy rates unchanged (see figure I.37B).
Mexico was an exception to this trend in the northern part of the region. Much like the South American economies that use the monetary policy rate as their main policy instrument, the Mexican monetary authorities decided to raise rates by 25 basis points in December 2015, and again by 50 basis points in February 2016. Factors such as the hike of the United States federal funds rate and the volatility of international financial markets weighed on the decisions of the monetary authorities.
In the English-speaking economies of the Caribbean and the dollarized economies of Ecuador, El Salvador and Panama, the average growth of the monetary base was slower in 2015 than in 2014, but quickened in the first three months of 2016.
(b) Policy decisions led to a slowdown in credit growth in a context of stable lending rates
In 2015 and the first four months of 2016, the trends observed in monetary policy instruments (interest rates and monetary aggregates) translated into relatively stable lending rates in the region, with the exception of South American economies that use aggregates as their main policy instrument, in which lending rates rose (see figure I.39).
Figure I.39 Latin America and the Caribbean (selected country groupings): average annualized lending rates, January 2010 to April 2016(Percentages)
0
5
10
15
20
25
30
Jan
Mar
May Ju
l
Sep
Nov Jan
Mar
May Ju
l
Sep
Nov Jan
Mar
May Ju
l
Sep
Nov Jan
Mar
May Ju
l
Sep
Nov Jan
Mar
May Ju
l
Sep
Nov Jan
Mar
May Ju
l
Sep
Nov Jan
Mar
2010 2011 2012 2013 2014 2015 2016
South American countries that use policy rates Central America and Mexico South American countries that use aggregates
English-speaking Caribbean Dollarized economies
Source: Economic Commission for Latin America and the Caribbean (ECLAC), on the basis of official figures.

73Chapter IEconomic Survey of Latin America and the Caribbean • 2016
In 2015 and the first quarter of 2016, domestic lending to the private sector slowed across the region, with the exception of South American economies. The deceleration was slight in Central America and Mexico, but fairly marked in the dollarized economies, especially Ecuador, where lending contracted. The Caribbean economies also reported a decline in credit during this period.
Credit trends in the region are consistent with reduced economic activity and, in particular, with the sharp slowdown in investment and private consumption. In South American economies that use aggregates as the main policy instrument, lending to the private sector contracted in real terms, amid high levels of inflation (see figure I.40).
Figure I.40 Latin America and the Caribbean (selected country groupings): average annualized growth in domestic lending to the private sector, first quarter of 2013 to first quarter of 2016(Percentages)
0
20
40
60
80
100
120
140
-5
0
5
10
15
20
25
30
2013 2014 2015 2016
South American countriesthat use aggregatesa
Central America and Mexico
English-speaking Caribbean
South American countriesthat use policy rates
Dollarized economies
Venezuela (Bol. Rep. of)(right scale)
Q1 Q2 Q3 Q4 Q1 Q2 Q3 Q4 Q1 Q1Q2 Q3 Q4
Source: Economic Commission for Latin America and the Caribbean (ECLAC), on the basis of official figures.a Excluding the Bolivarian Republic of Venezuela.
(c) The region’s currencies tended to weaken against the dollar
During 2015, the region’s currencies continued to depreciate: 16 countries reported nominal currency depreciation against the United States dollar; in 9 countries the depreciation topped 10% (see table I.5) The strengthening of the dollar against other world currencies amid growing expectations that the United States Federal Reserve would raise its benchmark interest rate (as occurred in December 2015), combined with falling prices for the region’s commodity exports, reduced the appetite for assets denominated in the currencies of the region. This trend was compounded by the deceleration of growth in several South American countries, and by specific events in Argentina and Brazil.
Figure I.41 depicts exchange rate movements for the five countries that experienced the largest currency devaluations against the dollar in 2015. The figure does not include the Bolivarian Republic of Venezuela, whose parallel exchange rate at the end of 2015 was several times the official rate.
Currency weakness continued in the first four months of 2016, although the currencies of Brazil, Chile, Colombia, Paraguay and Peru regained some ground after December 2015. Other countries whose currencies lost value in 2015, such as Argentina and Uruguay, suffered further depreciation in early 2016. Accordingly, between December 2014 and May 2016, all of the region’s tracked currencies (except that of the Plurinational State of Bolivia) experienced nominal depreciations against the dollar. For seven countries, nominal currency depreciation surpassed 20%: Argentina (68.4%), Brazil (34.1%), Haiti (32.2%), Uruguay (30.9%), Colombia (27.1%), Paraguay (20.3%) and Mexico (20.1%).

74 Chapter I Economic Commission for Latin America and the Caribbean (ECLAC)
Table I.5 Latin America and the Caribbean (21 countries):a nominal currency depreciation against the dollar, annualized changes, 2013 to May 2016
Country or subregion 2013 2014 2015 May 2016
Latin America
Argentina 32.6 29.8 52.8 56.1
Bolivia (Plurinational State of) 0.0 0.0 -0.1 -0.2
Brazil 15.1 12.5 49.0 13.2
Chile 9.7 15.4 16.8 11.8
Colombia 9.2 23.2 33.6 22.0
Costa Rica -1.3 7.6 -0.4 0.6
Dominican Republic 7.0 4.0 2.5 2.2
Guatemala -0.8 -3.1 0.5 -0.6
Haiti 3.6 8.1 20.0 27.5
Honduras 1.8 3.8 6.4 3.5
Mexico 1.4 13.2 16.6 19.8
Nicaragua 5.0 5.0 5.0 5.0
Paraguay 9.0 0.8 24.7 11.6
Peru 9.6 6.5 14.6 6.9
Uruguay 12.1 13.1 23.0 14.4
Venezuela (Bolivarian Republic of)b 46.5 0.0 0.0 58.7
The Caribbean
Belize -0.5 1.0 -0.8 -0.7
Guyana 1.5 -0.1 0.2 0.1
Jamaica 14.7 7.9 4.9 7.6
Suriname 0.0 3.8 16.8 98.8
Trinidad and Tobago -0.1 -0.6 0.8 4.4
Source: Economic Commission for Latin America and the Caribbean (ECLAC), on the basis of information from Bloomberg.a Excludes economies with fixed exchange rates.b Corresponds to changes in the exchange rate for priority imports.
Figure I.41 Latin America (selected countries): nominal exchange rates against the dollar, January 2014 to April 2015(Index: January 2008=100)
80
100
120
140
160
180
BrazilColombiaUruguay
ParaguayMexico
2014 2015 2016
May Jun
Jul
Aug
Sep
Oct
NovJan
Feb
Mar Apr
Dec
May Jun
Jul
Aug
Sep
Oct
NovJan
Feb
Mar Apr
MayJan
Feb
Mar Apr
Dec
Source: Economic Commission for Latin America and the Caribbean (ECLAC), on the basis of official figures.

75Chapter IEconomic Survey of Latin America and the Caribbean • 2016
The above analysis does not include the Bolivarian Republic of Venezuela, which does not have a single exchange rate. In March 2016, the country’s exchange-rate system underwent several changes, including the devaluation of the preferential official exchange rate (DIPRO) by 59% and the adoption of an adjustable exchange rate (DICOM), which depreciated by 175% between March and the end of May 2016. The DIPRO rate will be applied to imports that the Government establishes as a priority, such as food and medicines, while the DICOM rate will be used for all other transactions concluded in the country.
In Argentina, the depreciation of the peso in late 2015 resulted from the incoming administration’s decision to lift controls on dollar transactions, which had been applied in various ways since 2011, in a move to unify the official and the parallel exchange rates. In a context of high inflation, associated in particular with the problem of fiscal dominance facing the country’s monetary authorities, the parallel rate was about 50% higher than the official rate. Consequently, in mid-December 2015 the peso depreciated 36.1% at the official rate on the first business day of the unified regime, accounting for most of the depreciation posted during the period.
Exchange rates remained highly volatile in several countries amid shifting expectations over the price of commodities (oil, copper and other metals), quickening inflation in countries such as Brazil and Colombia and the steps taken by authorities in response, and, in Brazil, uncertainty over the process that resulted in the suspension from office of President Dilma Rousseff in April 2016.
The real effective extraregional exchange rate of 18 Latin American and Caribbean countries depreciated by an average of 1% between 2014 and 2015. South America registered an effective depreciation against the rest of the world of 4.6%, while the other subregions (Central America, Mexico and the Caribbean) in aggregate experienced an appreciation of 1.8%. Between December 2014 and December 2015, depreciation in South America became much more pronounced (9.2%), while appreciation in Central America, Mexico and the Caribbean slipped to 0.5%. These regional and subregional aggregates mask considerable dissimilarities between countries, caused by differences in their exchange-rate regimes and patterns of trade. This is particularly true of the subregions other than South America, whose effective appreciation against the rest of the world was significantly diminished by the depreciation of the Mexican peso. The region’s dollarized economies and countries with inflexible exchange rates registered effective appreciation, with domestic inflationary processes often coinciding with currency depreciation in the economies of extraregional trading partners. During the first four months of 2016, the impact of these depreciations was observed in Central American and Caribbean countries such as Honduras and the Dominican Republic. Consequently, the basket of Central American, Mexican and Caribbean currencies depreciated by 3.1% against the December 2015 figure. Meanwhile in South America, rising inflation and the nominal appreciation of the Brazilian real and the Colombian peso, among others, resulted in a 2.6% appreciation for the currencies of the subregion during this period (see figure I.42).
The total effective exchange rate26 of the region’s countries reflects movements in their own and in trading partners’ exchange rates, as well as rising inflation in several countries. Figure I.43 shows that between December 2014 and April 2016, real effective exchange rates jumped in countries with greater exchange-rate flexibility (depreciation) and fell sharply in countries such as Ecuador and the Plurinational State of Bolivia (appreciation). These two countries, one with a fixed exchange rate (the Plurinational State of Bolivia) and the other a dollarized economy (Ecuador), experienced a combination of domestic inflation and the depreciation of their trading partners’ floating currencies. In the Caribbean, the slight depreciation of the Trinidad and Tobago dollar in 2016 was insufficient to raise the total real effective exchange rate.
26 Unlike the effective extraregional exchange rate, where the weighting excludes trade with Latin American and Caribbean countries, the total effective exchange rate includes trade with all the trading partners of each country.

76 Chapter I Economic Commission for Latin America and the Caribbean (ECLAC)
Figure I.42 Latin America and the Caribbean: effective extraregional exchange rates, by subregion, January 2013 to April 2016(Index: 2005=100)
Latin America and the CaribbeanSouth America
Central America, Mexicoand the Caribbean
60
70
80
90
100
Jul
Jan
Jul
Jan
Jul
Jan
Jan
Apr
2013 2014 2015 2016
Source: Economic Commission for Latin America and the Caribbean (ECLAC), on the basis of official figures.
Figure I.43 Latin America: overall real effective exchange rates, April 2016 and December 2014 (Index: 1990-2009 average=100)
50 75 100 125 150Trinidad and Tobago
GuatemalaBolivia (Plur. State of)
EcuadorHonduras
Costa RicaParaguayUruguayPanama
BarbadosEl Salvador
PeruColombia
ChileJamaica
BrazilNicaraguaDominica
MexicoDominican Rep.
April 2016
December 2014
Source: Economic Commission for Latin America and the Caribbean (ECLAC), on the basis of official figures.
4. International reserves
(a) International reserves declined in 2015 but recovered slightly in the first five months of 2016
International reserves in Latin America and the Caribbean contracted in 2015 due to the deterioration of the region’s trade balance since the second half of 2014 (especially among commodity-exporting economies) and currency interventions by central banks seeking to counteract the effects of exchange rate volatility. Consequently, at year-end 2015 international reserves in Latin America and the Caribbean had fallen by

77Chapter IEconomic Survey of Latin America and the Caribbean • 2016
5% compared with the previous year, reaching their lowest level since 2011. In total, reserves declined in 19 of the region’s countries in 2015, and were depleted by more than 10% in 12 countries.
The largest declines were in Suriname (-47.2%), Ecuador (-36.8%), Bolivarian Republic of Venezuela (-25.8%), Argentina (-18.7%) and Haiti (-16.0%). The group of five countries with the highest levels of international reserves (Brazil, Chile, Colombia, Mexico and Peru), saw their external assets decrease by 4.0% in 2015, with Mexico’s reserves significantly down by 9.2%.
Thirteen economies were able to increase their reserves in 2015, with five countries (Antigua and Barbuda, Dominica, Grenada, Jamaica and Saint Lucia) posting gains of more than 10%. This accumulation was possible thanks to falling energy costs and consolidation programmes implemented in conjunction with multilateral institutions.
In the first five months of 2016, international reserves in Latin America and the Caribbean picked up by 1% compared with year-end 2015, albeit remaining below 2014 levels. Reserves decreased in 10 economies during this period, declining by more than 10% in the Bolivarian Republic of Venezuela, Ecuador, the Plurinational State of Bolivia, Suriname and Uruguay. Conversely, 16 economies managed to consolidate their international reserves in early 2016, with six countries (Argentina, Bahamas, El Salvador, Guatemala, Panama and Paraguay) posting increases of more than 10% (see figure I.44).
Figure I.44 Latin America and the Caribbean: international reserves, 2000-2016a
(Billions of dollars and percentages of GDP)
0
2
4
6
8
10
12
14
16
18
20
0
100
200
300
400
500
600
700
800
900
1 000
2000
2001
2002
2003
2004
2005
2006
2007
2008
2009
2010
2011
2012
2013
2014
2015
2016
Billions of dollars (left scale)
Percentages of GDP (right scale)
Source: Economic Commission for Latin America and the Caribbean (ECLAC), on the basis of official figures. a The 2015 figures are ECLAC estimates. The 2016 figures are for May and contain preliminary data.
Notwithstanding the trend described above, the ratio of international reserves to GDP has increased in 2015 and 2016 to date, reflecting the aforementioned recovery of reserves on the one hand, and the effects of the region’s slower growth on the other.
(b) Macroprudential regulations continue to be strengthened throughout the region
In the wake of the 2009 financial crisis, the region’s economic authorities applied a raft of amendments to their regulatory frameworks with a view to ensuring macrofinancial stability. The region has continued its progress in this direction during 2015 and the first five months of 2016. Steps have been taken to reduce exchange rate volatility and bolster the international reserves position, notably the currency swaps
78 Chapter I Economic Commission for Latin America and the Caribbean (ECLAC)
between China and countries such as Argentina, Chile and Suriname; the renewal of the International Monetary Fund’s flexible credit line for Colombia and Mexico, and the securing of resources from multilateral agencies by Honduras and Jamaica. Argentina, the Bahamas and the Bolivarian Republic of Venezuela have implemented regulatory changes in the process of allocating foreign currency; in Argentina this meant the lifting of currency controls in late 2015. Several countries maintained their efforts to de-dollarize their payment systems, as in the Plurinational State of Bolivia, Costa Rica, Haiti and Peru. Ecuador pursued initiatives focused on new payment methods; Costa Rica and Peru made changes to reserve requirements in dollar-denominated deposits and other instruments, and Trinidad and Tobago tightened its restrictions on illegal currency transactions. Jamaica and Paraguay accorded their central banks a higher degree of autonomy, together with responsibility for safeguarding financial stability, with Jamaica also relaxing its restrictions on currency transactions by pension funds and insurance companies.
Some countries have also undertaken initiatives to prevent credit-risk situations from acquiring a systemic dimension, notably the regulatory amendments concerning financial services provision in the Bahamas, Barbados, Costa Rica, El Salvador, Guyana and Jamaica. Jamaica and the member countries of the Eastern Caribbean Currency Union (ECCU) are strengthening their credit markets (by establishing credit rating agencies). Nicaragua has strengthened its payment clearing system, while Brazil, the Dominican Republic and Peru have changed their reserve requirements for bank deposits. Steps have also been taken to develop capital markets. Brazil has promoted the development of its corporate bond market; Paraguay has introduced a secondary bond market; Guatemala has developed its leasing market, and Mexico and Peru have amended the regulations applied to their respective derivatives markets. Lastly, several authorities in the region have announced the strengthening of oversight mechanisms applied to offshore banking in the wake of the “Panama Papers” scandal.
BibliographyBBVA (2016) “The economic consequences of Brexit”, June [online] https://info.bbva.com/es/
data/8663062016/Brexit_watch.pdf. ECLAC (Economic Commission for Latin America and the Caribbean) (2016a), Foreign Direct
Investment in Latin America and the Caribbean 2016. Briefing paper, Santiago.(2016b), Fiscal Panorama of Latin America and the Caribbean 2016: Public finances and the challenge of reconciling austerity with growth and equality (LC/L.4140), Santiago.(2015a), Economic Survey of Latin America and the Caribbean, 2015 (LC/G.2645-P), Santiago. (2015b), Preliminary Overview of the Economies of Latin America and the Caribbean, 2015 (LC/G.2655-P), Santiago.
ECLAC/ILO (Economic Commission for Latin America and the Caribbean/International Labour Organization) (2016), “Recent improvements and persistent gaps in rural employment”, Employment Situation in Latin America and the Caribbean, No. 14 (LC/L.4141), Santiago. (2015), “Universal social protection in labour markets with high levels of informality”, Employment Situation in Latin America and the Caribbean, No. 12 (LC/L.3998), Santiago.
Financial Times (2016), “China plans securitization to tackle banks’ bad debt burden” [online] http://www.ft.com/cms/s/0/7debf7a6-e116-11e5-8d9b-e88a2a889797.html#axzz4CRCNgnAO.
ILO (International Labour Organization) (2014), Thematic Labour Overview 1: Transition to Formality in Latin America and the Caribbean, Lima.
Ramos, J., K. Sehnbruch and J. Weller (2015), “Calidad del empleo en América Latina. Teoría y datos empíricos”, Revista Internacional del Trabajo, vol. 134, No. (2015/2).
The Economist (2016) “The coming debt burst”, 7 May. United Nations (2016), World Economic Situation and Prospects 2016. Update as of mid-2016,
New York, Department of Economic and Social Affairs (DESA).

IIPART
The 2030 Agenda for Sustainable Development and the challenges of financing for development


81Chapter IIEconomic Survey of Latin America and the Caribbean • 2016
Introduction
As set out in Horizons 2030: Equality at the Centre of Sustainable Development (ECLAC, 2016), fulfilling the goals and targets of the 2030 Agenda for Sustainable Development will require a considerable effort to mobilize development financing, with both public- and private-sector involvement. In terms of domestic resource mobilization, one of the key challenges for the region’s governments is raising the tax burden and improving the tax structure. This means addressing the problems of tax evasion and avoidance, both domestically and on the external front.
The resources mobilized for development purposes are not limited to those secured from fiscal sources, and may also be drawn from private savings. This implies the need to further develop the region’s financial systems and markets, and to increase financial inclusion.
Moreover, since most of the region’s countries are classed as middle-income or high-income economies, they have limited ability to tap international cooperation funding, official development assistance, and concessional loans. The region’s countries also differ enormously in terms of their potential access to private international finance flows.
In this context, the thematic chapters of this edition of the Economic Survey of Latin America and the Caribbean concentrate on the challenges encountered by Latin American and Caribbean countries in mobilizing finance for development from domestic and external perspectives.
Chapter II looks at the impact of the change in economic cycle on public finances, including the drop in tax and non-tax revenues and the gradual rise in public borrowing, which together have eroded the fiscal space available for financing efforts to meet the Sustainable Development Goals.
It is argued that regaining that space would require comprehensive and sustained reforms to public finances to ensure public sector solvency, protect investment, safeguard achievements on the social front, and broaden tax resources.
Estimates are provided suggesting that fiscal multipliers are high and significant in the region and that, in particular, the public investment multiplier exceeds 2 after two years. Indiscriminate cutting of public expenditure is highly prejudicial because it runs the risk of deepening recessionary conditions; it is thus essential to protect the key role played by public investment in the potential growth of the region’s economies.
In view of the unavoidable need to mobilize resources for financing for development and to ensure the fulfilment of the 2030 Agenda for Sustainable Development, the chapter reaffirms the need to change certain typical characteristics of the countries’ tax structures, namely: tax collection that is too low (with a few notable exceptions); a system that is not progressive because income tax is weak and the rates paid by the richest decile are extremely low; high evasion —estimated at 6.7 percentage points of regional GDP— and tax bases that have been eroded by the proliferation of tax incentives. These factors all highlight the importance of strengthening income taxation.
Chapter III examines tax evasion in relation to the external linkages of the region’s countries. The more a country is engaged in the world economy, the greater the potential erosion of its tax base. There are essentially three sources of this erosion: the burgeoning of tax incentives, profit shifting and aggressive tax planning, and illicit financial flows arising from international trade and capital movements.

82 Economic Commission for Latin America and the Caribbean (ECLAC)Introducción
The current capacity of multinational and transnational firms to develop aggressive tax planning mechanisms and to shift profits lessens countries’ ability to retain fiscal revenues that could be used to finance development processes or to deploy distributive policy tools to achieve social equality and overcome poverty.
The fiscal losses associated with evasion and avoidance around the world are striking. The Organization for Economic Cooperation and Development (OECD) and the United Nations Conference on Trade and Development (UNCTAD) estimate that evasion amounts to between US$ 100 billion and US$ 240 billion per annum, equivalent to between 4% and 10% of the corporate income tax take. ECLAC estimates show that the region’s losses from gross trade misinvoicing outflows increased by about 9% a year on average in the period 2004-2013, totalling US$ 765 billion or about 1.8% of regional GDP. The region’s tax losses associated with these flows stood at about US$ 31 billion in 2013 (0.5 percentage points of GDP), equivalent to between 10% and 15% of the corporate income tax take for that year.
Chapter IV notes that the external development finance scene has changed considerably over recent decades in terms of the array of agents providing financing, the funding mechanisms used and the composition of financial flows. There has been a clear fall-off in official development assistance (ODA) flows to the countries of the region, with private flows becoming the main source of financing for these economies. Chief among these is foreign direct investment (FDI), whose value in 2014 equated to approximately 2.6% of Latin America’s GDP, accounting for over 60% of total flows into the region. Remittances and portfolio investment inflows were equivalent to 1.0% and 1.5% of GDP, respectively.
The reliance on private funds raises significant issues for development finance. First, not all countries enjoy the same access to external financing sources. The degree to which a country or set of countries can access private sector financing depends on a number of factors, including size of the economy; perceived risk (in some cases reflecting the country’s macroeconomic record); the production structure; the state of infrastructure; and the education and specialization level of the workforce. Second, private sector flows, including FDI, are procyclical and sometimes highly volatile, which can amplify business cycle fluctuations. Third, the behaviour of private capital flows reflects the fact that they are mainly profit-driven, which can mean that investment is inadequate in areas crucial to sustainable development, such as poverty reduction or infrastructure improvements, if the expected risk-adjusted return is unsatisfactory relative to alternative investment opportunities.
Channelling and matching private capital to sustainable development needs means creating incentives to attract private investment into areas where it meets the production and development requirements of the economies of Latin America and the Caribbean. This requires government action to design appropriate incentives, which means including social returns in cost-benefit analyses, supplying public financing to sectors that generate significant social benefits but do not attract enough private-sector funds, maintaining risk-return profiles attractive to private capital and directing this capital towards development objectives, and creating appropriate legal frameworks.
Chapter V studies financial inclusion in the countries of the region, and argues that inclusiveness is a prerequisite for financial systems to work in favour of sustainable economic and social development. In non-inclusive financial systems, small businesses and low-income individuals are unable to access financial services; these systems also exhibit wide gender gaps in terms of their access and use.
83Economic Survey of Latin America and the Caribbean • 2016 Introducción
Financial innovation may serve as a catalyst for the financial inclusion of households and businesses through the greater densification of the financial system. In the policy sphere, this means fostering innovation by introducing new skills, capacities and procedures to increase efficiency, including technological and methodological improvements and changes in forms of intermediation. There is also a need to develop new financial products to meet demand from households and companies.
Strengthening financial inclusion through innovation requires an effort to coordinate public and private agendas in respect of development goals and priorities. Spaces and mechanisms should therefore be created so that public policies can attract and channel private-sector endeavours, with the right context and incentives, towards achieving inclusive development goals.
In that regard the presence of development banks should be reinforced, since they increase the availability of and access to financing sources and mechanisms for business, and are capable of deploying them according to the requirements, characteristics and risks inherent to different production activities.


IICHAPTER
Domestic resource mobilization
Introduction
A. Public finances must adapt to new conditions in order to cope with the reduction in the fiscal space
B. Given financing difficulties, tax systems must become a pillar for efforts to achieve the Sustainable Development Goals
Bibliography
Annex II.A1
Annex II.A2

Economic Survey of Latin America and the Caribbean • 2016 IIIntroduction
Proposals for mobilizing domestic resources to achieve the Sustainable Development Goals by 2030 are a key pillar of the development model put forth by the United Nations and the Economic Commission for Latin America and the Caribbean (ECLAC). As explained in previous publications by ECLAC (2015b, 2016), the commodities boom lifted fiscal revenues from primary goods in producing countries, thereby providing resources to pay down external debt, among other things.
The change in the business cycle has generated the opposite effect: a drop in tax and non-tax revenues and a gradual rise in public borrowing in countries that rely on commodities, which has eroded the fiscal space available for financing efforts to meet the Sustainable Development Goals. Regaining that space would require comprehensive and sustained reforms to public finances to ensure public sector solvency, protect investment, safeguard achievements on the social front and broaden tax resources.
This chapter considers these challenges. Section A looks at how public debt has risen, in line with policies that were devised to stabilize national economies and soften the effects of the cyclical shift, but which have also imposed limitations, tightened budgetary constraints and forced countries to adopt strict financial controls. These changes and, especially, the drop in gross fixed capital formation, have inevitable consequences for the potential growth capacity of the region’s economies. By extension, borrowing conditions have turned harsher, and are unlikely to ease for some time. The deterioration in the macroeconomic environment thus ushers in a medium-term dynamic that, although not alarming for the region overall, will require active fiscal policies to keep public debt within reasonable bounds.
Indiscriminate cutting of public expenditure is also highly prejudicial, because it runs the risk of deepening recessionary conditions. ECLAC estimates show that fiscal multipliers are high and significant in the region and that, in particular, the public investment multiplier exceeds 2 after two years. The calculations presented in this chapter conclusively demonstrate the key role played by public investment in the growth potential of the region’s economies. As ECLAC has emphasized in previous publications (ECLAC, 2015a), investment behaviour not only affects the speed and rate of capital accumulation but also has a direct bearing on productivity. The causal relationship between capital accumulation and productivity makes the cyclical characteristics of investment an important determinant of long-run growth capacity.
Section B discusses the diagnostic put forward by ECLAC on the region’s tax systems, in view of the unavoidable need to mobilize domestic resources given the drop in financing and slowdown in investment. With a few notable exceptions, the region’s tax collection is too low to meet the needs of the Sustainable Development Goals, the system is not progressive because income tax is weak and the rates paid by the richest decile are extremely low, evasion is high —estimated here at 6.7 percentage points of regional GDP, worth US$ 340 billion in 2015— and the tax bases have been eroded by the proliferation of tax incentives.
The high rate of tax evasion illustrates the magnitude of the challenge of mobilizing domestic resources. Just as the 1990s were marked in tax terms by the broadening of value added tax and tariff reduction, and the first decade of the 2000s by generalized taxation on non-renewable natural resources and commodities, in the future the reforms begun in the present decade —aimed at strengthening taxes on income and assets— will have to be consolidated.
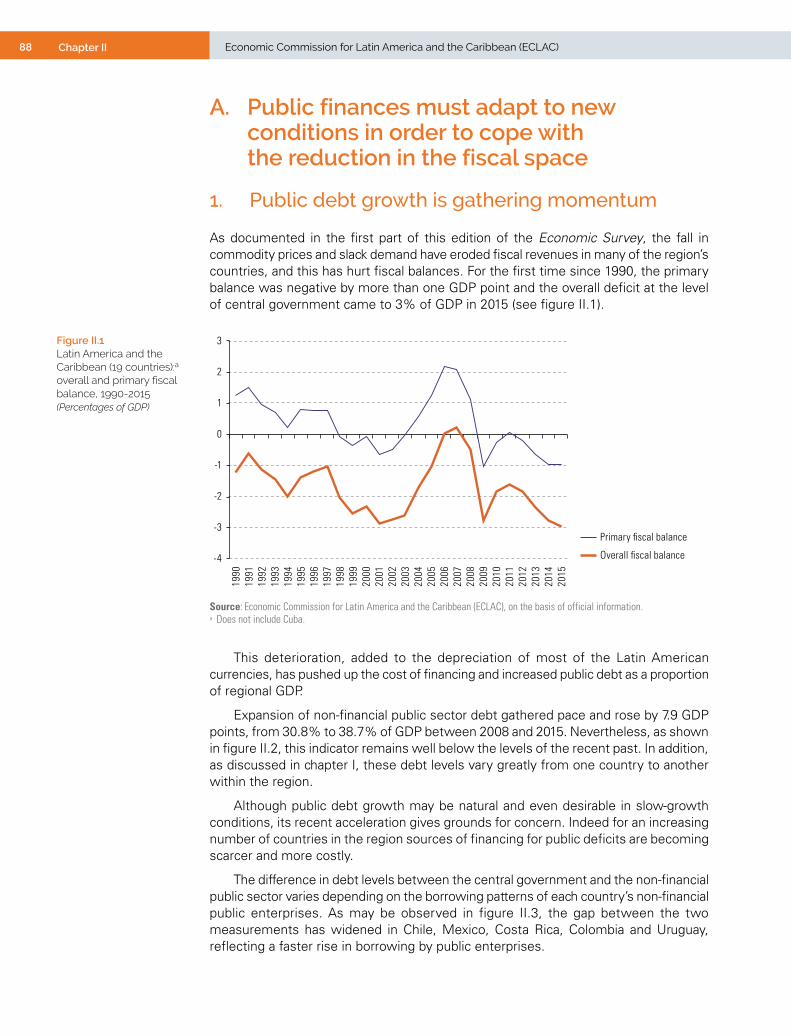
88 Chapter II Economic Commission for Latin America and the Caribbean (ECLAC)
A. Public finances must adapt to new conditions in order to cope with the reduction in the fiscal space
1. Public debt growth is gathering momentum
As documented in the first part of this edition of the Economic Survey, the fall in commodity prices and slack demand have eroded fiscal revenues in many of the region’s countries, and this has hurt fiscal balances. For the first time since 1990, the primary balance was negative by more than one GDP point and the overall deficit at the level of central government came to 3% of GDP in 2015 (see figure II.1).
Figure II.1 Latin America and the Caribbean (19 countries):a overall and primary fiscal balance, 1990-2015(Percentages of GDP)
-4
-3
-2
-1
0
1
2
3
1990
1991
1992
1993
1994
1995
1996
1997
1998
1999
2000
2001
2002
2003
2004
2005
2006
2007
2008
2009
2010
2011
2012
2013
2014
2015
Overall fiscal balance
Primary fiscal balance
Source: Economic Commission for Latin America and the Caribbean (ECLAC), on the basis of official information. a Does not include Cuba.
This deterioration, added to the depreciation of most of the Latin American currencies, has pushed up the cost of financing and increased public debt as a proportion of regional GDP.
Expansion of non-financial public sector debt gathered pace and rose by 7.9 GDP points, from 30.8% to 38.7% of GDP between 2008 and 2015. Nevertheless, as shown in figure II.2, this indicator remains well below the levels of the recent past. In addition, as discussed in chapter I, these debt levels vary greatly from one country to another within the region.
Although public debt growth may be natural and even desirable in slow-growth conditions, its recent acceleration gives grounds for concern. Indeed for an increasing number of countries in the region sources of financing for public deficits are becoming scarcer and more costly.
The difference in debt levels between the central government and the non-financial public sector varies depending on the borrowing patterns of each country’s non-financial public enterprises. As may be observed in figure II.3, the gap between the two measurements has widened in Chile, Mexico, Costa Rica, Colombia and Uruguay, reflecting a faster rise in borrowing by public enterprises.

89Chapter IIEconomic Survey of Latin America and the Caribbean • 2016
Figure II.2 Latin America (19 countries):a gross public debt of the central government and the non-financial public sector, 1990-2015.(Percentages of GDP)
0
10
20
30
40
50
60
70
80
1990
1991
1992
1993
1994
1995
1996
1997
1998
1999
2000
2001
2002
2003
2004
2005
2006
2007
2008
2009
2010
2011
2012
2013
2014
2015
Central government
Non-financial public sector
Source: Economic Commission for Latin America and the Caribbean (ECLAC), on the basis of official information. a Does not include Cuba.
Figure II.3 Latin America (selected countries): differences in public debt levels between the central government and the non-financial public sector, 2008 and 2015(Percentage points of GDP)
0
2
4
6
8
10
12
Chile
Mex
ico
Cost
a Ri
ca
Colo
mbi
a
Urug
uay
Latin
Am
eric
a (1
2 co
untri
es)
El S
alva
dor
Boliv
ia(P
lur.
Stat
e of
)
Para
guay
Ecua
dor
Peru
Nic
arag
ua
Pana
ma
2008
2015
Source: Economic Commission for Latin America and the Caribbean (ECLAC), on the basis of official information.
Overall, the composition of the public debt has shifted over the past few years, with a larger share borne by domestic financing. This has eased the pressure on the fiscal accounts compared with previous decades, when the weight of external debt meant that fiscal sustainability depended directly on external conditions (twin deficits).
Figure II.4 shows that the external debt of the non-financial public sector (i.e. including subnational government and public enterprises, as well as the central government) stands at below 20% of GDP, contrasting heavily with historical levels in the region, notably during the debt crisis, when this category of debt exceeded 100% of GDP.
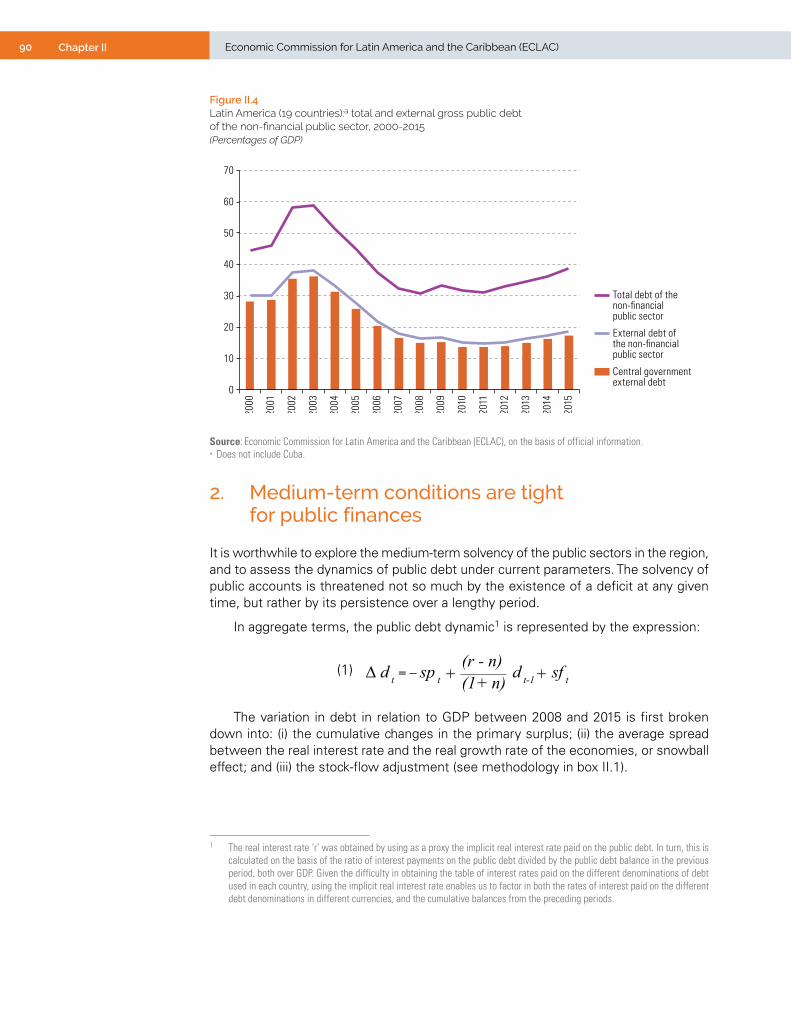
90 Chapter II Economic Commission for Latin America and the Caribbean (ECLAC)
Figure II.4 Latin America (19 countries):a total and external gross public debt of the non-financial public sector, 2000-2015(Percentages of GDP)
0
10
20
30
40
50
60
70
2000
2001
2002
2003
2004
2005
2006
2007
2008
2009
2010
2011
2012
2013
2014
2015
Central government external debt
External debt of the non-financial public sector
Total debt of the non-financial public sector
Source: Economic Commission for Latin America and the Caribbean (ECLAC), on the basis of official information. a Does not include Cuba.
2. Medium-term conditions are tight for public finances
It is worthwhile to explore the medium-term solvency of the public sectors in the region, and to assess the dynamics of public debt under current parameters. The solvency of public accounts is threatened not so much by the existence of a deficit at any given time, but rather by its persistence over a lengthy period.
In aggregate terms, the public debt dynamic1 is represented by the expression:
(1) + +(r - n)(1+ n)∆ d t d t-1 sf tsp t
The variation in debt in relation to GDP between 2008 and 2015 is first broken down into: (i) the cumulative changes in the primary surplus; (ii) the average spread between the real interest rate and the real growth rate of the economies, or snowball effect; and (iii) the stock-flow adjustment (see methodology in box II.1).
1 The real interest rate ‘r’ was obtained by using as a proxy the implicit real interest rate paid on the public debt. In turn, this is calculated on the basis of the ratio of interest payments on the public debt divided by the public debt balance in the previous period, both over GDP. Given the difficulty in obtaining the table of interest rates paid on the different denominations of debt used in each country, using the implicit real interest rate enables us to factor in both the rates of interest paid on the different debt denominations in different currencies, and the cumulative balances from the preceding periods.
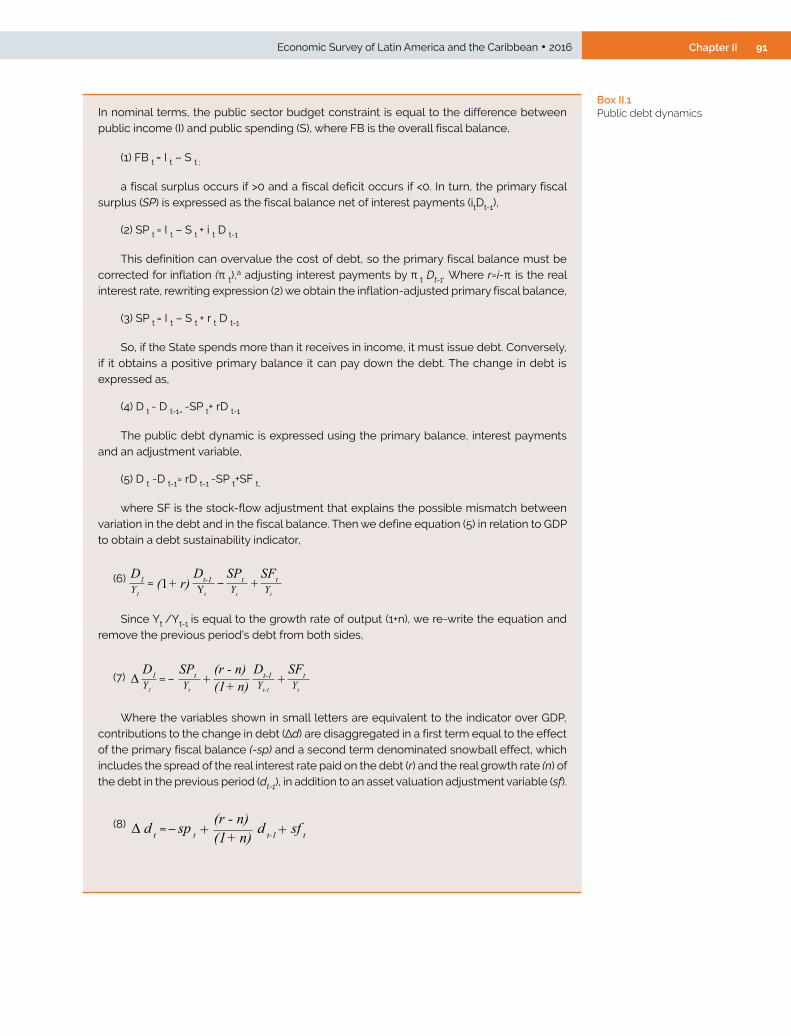
91Chapter IIEconomic Survey of Latin America and the Caribbean • 2016
In nominal terms, the public sector budget constraint is equal to the difference between public income (I) and public spending (S), where FB is the overall fiscal balance,
(1) FB t = I t – S t ;
a fiscal surplus occurs if >0 and a fiscal deficit occurs if <0. In turn, the primary fiscal surplus (SP) is expressed as the fiscal balance net of interest payments (itDt-1),
(2) SP t = I t – S t + i t D t-1
This definition can overvalue the cost of debt, so the primary fiscal balance must be corrected for inflation (π t),
a adjusting interest payments by π t Dt-1. Where r=i-π is the real interest rate, rewriting expression (2) we obtain the inflation-adjusted primary fiscal balance,
(3) SP t = I t – S t + r t D t-1
So, if the State spends more than it receives in income, it must issue debt. Conversely, if it obtains a positive primary balance it can pay down the debt. The change in debt is expressed as,
(4) D t - D t-1= -SP t+ rD t-1
The public debt dynamic is expressed using the primary balance, interest payments and an adjustment variable,
(5) D t -D t-1= rD t-1 -SP t+SF t,
where SF is the stock-flow adjustment that explains the possible mismatch between variation in the debt and in the fiscal balance. Then we define equation (5) in relation to GDP to obtain a debt sustainability indicator,
(6) D1 (1+ r) +Y1
Dt-1Yt
SPtYt
SFtYt
Since Yt /Yt-1 is equal to the growth rate of output (1+n), we re-write the equation and remove the previous period’s debt from both sides,
(7) D1 + +Y1
SPtYt
(r - n)(1+ n)
Dt-1Yt-1
SFtYt
∆
Where the variables shown in small letters are equivalent to the indicator over GDP, contributions to the change in debt (∆d) are disaggregated in a first term equal to the effect of the primary fiscal balance (-sp) and a second term denominated snowball effect, which includes the spread of the real interest rate paid on the debt (r) and the real growth rate (n) of the debt in the previous period (dt-1), in addition to an asset valuation adjustment variable (sf).
(8) + +(r - n)(1+ n)∆ d t d t-1 sf tsp t
Box II.1 Public debt dynamics

92 Chapter II Economic Commission for Latin America and the Caribbean (ECLAC)
Box II.1 (concluded)As the figure below illustrates, the spread (r-n) rises gradually starting in 2011, and reaches
a value of around 3 percentage points in 2015.
Latin America (19 countries):a spread between the real interest rate paid on public debt and the GDP growth rate, and change in public debt(Percentage points)
-10
-5
0
5
10
15
1991
1992
1993
1994
1995
1996
1997
1998
1999
2000
2001
2002
2003
2004
2005
2006
2007
2008
2009
2010
2011
2012
2013
2014
2015
Change in public debt
Spread r-n
Source: Economic Commission for Latin America and the Caribbean (ECLAC), on the basis of official information. a Does not include Cuba.
Source: Economic Commission for Latin America and the Caribbean (ECLAC).a See Blanchard and others (2012) for a definition of public debt sustainability concepts.
Figure II.5 shows, in terms of the regional average, the clear contribution to the increase in public debt made by the primary balance —with the deterioration mentioned earlier— that was exacerbated by the negative impact of interest rate variations not offset by economic growth. For the period 2008-2015, the average implicit real interest rate was 5.6% and the real growth rate of output was 2.5%.
Figure II.5 Latin America (19 countries):a contributions to variation in public debt, 2008-2015(Percentage points of GDP)
0 1 2 3 4 5 6
Stock-flow adjustment
Spread (r-n)
Primary balance
Change in the publicdebt balance
Source: Economic Commission for Latin America and the Caribbean (ECLAC), on the basis of official information.a Does not include Cuba.
More precisely, according to equation (1), the cumulative change in the public debt between 2008 and 2015 amounted to 5.6 GDP percentage points at the central government level. Of these, 3 GDP points were attributable to the cumulative primary

93Chapter IIEconomic Survey of Latin America and the Caribbean • 2016
fiscal deficit, and the effect of the average real interest rate over the period (5.6%) was 1.7 GDP points, offset in turn by average real GDP growth (2.5%), amounting to 0.7 points. Accordingly, the effect of the average interest rate spread (3.1%) over the previous period’s debt contributed one GDP point to the increase in public debt over the period 2008-2015. The stock-flow effect, equivalent to the discrepancies between the variations in the debt and the fiscal balance, was 1.7 GDP percentage points, largely because of the exchange-rate depreciation that occurred at the end of the period.
The construction of scenarios to 2025 shows a clear upward path in public debt. Table II.1 summarizes the initial conditions. The arithmetic is relatively simple: assuming zero variation in the exchange rate or in other valuation effects (sf=0), public debt will rise by three GDP points per year, at an implicit interest rate of 5.5%, with trend growth of 3.5% and primary deficit of 1 GDP point (see equation 1). These generic averages and scenarios mask wide heterogeneities; some countries maintain very solid fiscal positions, having used the gains from the now depleted boom period to consolidate stabilization funds, which can now fulfil their function in the downswing (see details in annex II.A1).
Table II.1 Latin America: initial variables used for public debt scenarios(Percentages)
Growth rate of potential GDPa
Implicit real interest rateb
Primary fiscal balance over GDP
Public debt over GDP
Latest data available 2015
Latin America 3.5 5.5 -1.0 35.9
Argentina 3.7 4.7 -1.1 53.3
Bolivia (Plurinational State of) 6.0 3.0 -3.3 27.1
Brazil 3.0 12.5 -2.0 66.5
Chile 3.0 4.5 -1.5 17.5
Colombia 3.7 6.4 -0.4 43.9
Costa Rica 4.0 7.3 -3.1 42.4
Dominican Republic 5.6 7.9 0.5 36.0
Ecuador 5.0 6.0 -1.9 31.0
El Salvador 2.0 5.6 1.3 45.2
Guatemala 4.0 6.5 0.1 24.4
Haiti 3.0 0.6 0.3 35.9
Honduras 5.0 6.1 -0.6 44.2
Mexico 4.0 5.4 -1.3 35.5
Nicaragua 4.0 3.1 0.3 31.4
Panama 6.0 4.6 -2.4 38.4
Paraguay 6.0 3.8 -1.1 16.6
Peru 5.8 5.7 -1.9 19.5
Uruguay 2.8 5.7 -0.5 46.0
Source: Economic Commission for Latin America and the Caribbean (ECLAC). a Growth rate for 2025 equivalent to the growth rate of potential GDP.b The implicit real interest rate is defined as the ratio of interest payments (divided by GDP) to the previous period’s public debt
(divided by GDP).
Under current parameters, in the next 10 years central government public debt could reach 54.8% of GDP on average for the region (see figure II.6). Although such a situation would not be unprecedented, the exercise illustrates the need to correct this trajectory if indebtedness levels are to be controlled. An adjustment of one point in the primary balance would break the upward spiral of debt; and adjustment of two points would be enough to return the debt-to-GDP ratio to a downward trajectory.
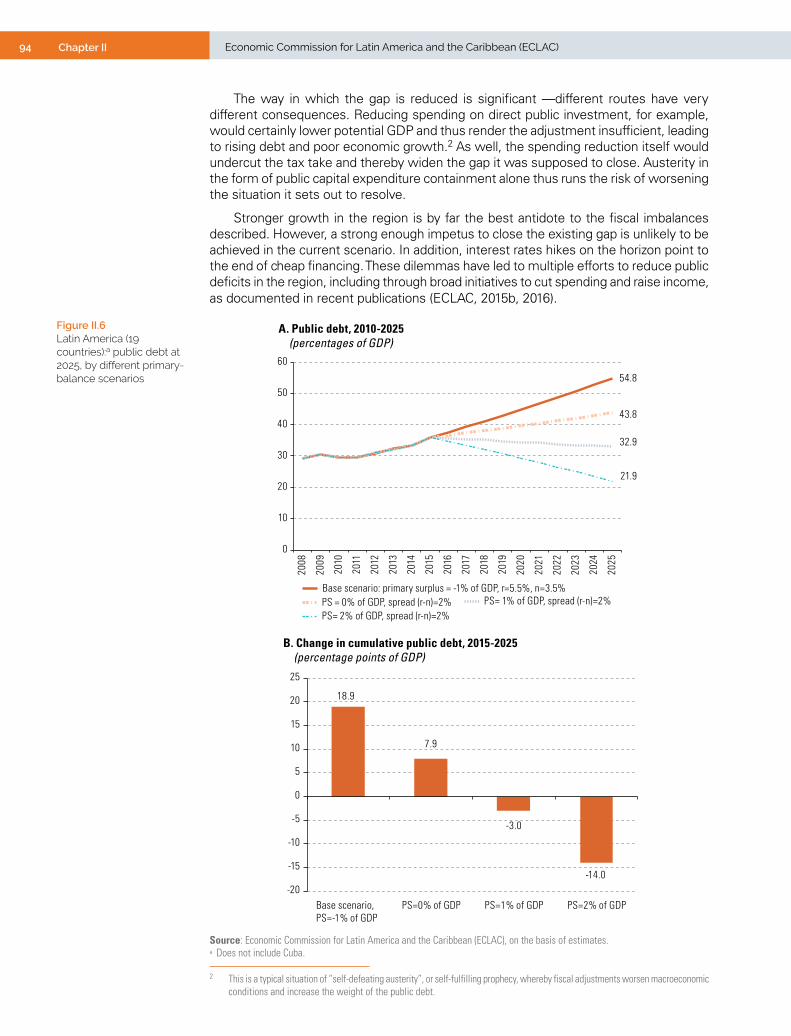
94 Chapter II Economic Commission for Latin America and the Caribbean (ECLAC)
The way in which the gap is reduced is significant —different routes have very different consequences. Reducing spending on direct public investment, for example, would certainly lower potential GDP and thus render the adjustment insufficient, leading to rising debt and poor economic growth.2 As well, the spending reduction itself would undercut the tax take and thereby widen the gap it was supposed to close. Austerity in the form of public capital expenditure containment alone thus runs the risk of worsening the situation it sets out to resolve.
Stronger growth in the region is by far the best antidote to the fiscal imbalances described. However, a strong enough impetus to close the existing gap is unlikely to be achieved in the current scenario. In addition, interest rates hikes on the horizon point to the end of cheap financing. These dilemmas have led to multiple efforts to reduce public deficits in the region, including through broad initiatives to cut spending and raise income, as documented in recent publications (ECLAC, 2015b, 2016).
2 This is a typical situation of “self-defeating austerity”, or self-fulfilling prophecy, whereby fiscal adjustments worsen macroeconomic conditions and increase the weight of the public debt.
Figure II.6 Latin America (19 countries):a public debt at 2025, by different primary-balance scenarios 54.8
43.8
32.9
21.9
0
10
20
30
40
50
60
2008
2009
2010
2011
2012
2013
2014
2015
2016
2017
2018
2019
2020
2021
2022
2023
2024
2025
Base scenario: primary surplus = -1% of GDP, r=5.5%, n=3.5%PS = 0% of GDP, spread (r-n)=2% PS= 1% of GDP, spread (r-n)=2%PS= 2% of GDP, spread (r-n)=2%
A. Public debt, 2010-2025 (percentages of GDP)
B. Change in cumulative public debt, 2015-2025 (percentage points of GDP)
18.9
7.9
-3.0
-14.0-20
-15
-10
-5
0
5
10
15
20
25
Base scenario, PS=-1% of GDP
PS=0% of GDP PS=1% of GDP PS=2% of GDP
Source: Economic Commission for Latin America and the Caribbean (ECLAC), on the basis of estimates. a Does not include Cuba.

95Chapter IIEconomic Survey of Latin America and the Caribbean • 2016
3. Fiscal institutions must give priority to protecting investment
Given the need to steer public finances along a sustainable path, it is essential to fully assess the importance of fiscal policy for medium-term growth in the economies of the region. This is, in fact, a global discussion: recent estimates of fiscal multipliers have yielded widely varying results, depending on the methodologies used and the structural features of economies, including their degree of openness and terms of trade, and the stage of the economic cycle they are traversing (Auerbach and Gorodnichenko, 2012).
The region is no stranger to this discussion. There is ample evidence that the formulation of fiscal rules needs to protect public investment, because of its proven significance in boosting medium-term growth. Or, put the other way around, that cutting investment spending during slowdowns damages economies in the longer run. Using the ECLAC database, Riera-Crighton (2015) estimates the cumulative effects on output of changes in public spending for 16 countries of the region. The multipliers are estimated for both current and capital spending, using a panel model with annual data from 1990 to 2014.
Figure II.7 shows that the investment spending multiplier is substantially higher than the consumption multiplier. A one-unit rise in investment spending has a short-term impact close to 1, whereas the current spending multiplier is around 0.7. After two years, the current spending and investment multipliers are 1.3 and 2, respectively.
Figure II.7 Latin America (16 countries):a fiscal multipliers disaggregated by type of expenditure
0
0.5
1.0
1.5
2.0
2.5
3.0
3.5
4.0
4.5
1 2 3 4 5 6
Years
Investment spending
Current spending
Source: Economic Commission for Latin America and the Caribbean (ECLAC), on the basis of estimates. a Argentina, Bolivarian Republic of Venezuela, Brazil, Chile, Colombia, Costa Rica, Dominican Republic, Ecuador, Guatemala, Honduras,
Mexico, Nicaragua, Paraguay, Peru, Plurinational State of Bolivia and Uruguay.
These results show that although public spending in Latin America has a small impact in the short term, its effects are lasting and rise significantly after two years. They also show that spending multipliers have stronger impacts during recessions or slowdowns. In these conditions, countercyclical fiscal policy has a positive impact, whereas procyclical policies have harmful effects on the economy. Unfortunately, the rules now in place in the region are largely along the lines of debt ceilings and limits on balances and spending (see box II.2 and annex II.A2) and afford little importance to investment for inclusive growth.
Achieving the Sustainable Development Goals, especially in relation to domestic resource mobilization, requires addressing the dual challenge of improving the quality of public spending and increasing tax resources, in a context of increasing budgetary constraints.

96 Chapter II Economic Commission for Latin America and the Caribbean (ECLAC)
The level of central government investment rose until 2014, as a result of stimulus measures adopted to cushion the effects of the crisis that broke out in 2008. This trend changed drastically in 2015, however, when public investment dropped by 0.5 percentage points of GDP, reflecting fiscal adjustments carried out in most countries in the region. As shown in the figure below, 13 of the 19 countries in the region reduced capital spending in 2015, with the heaviest cuts in the Plurinational State of Bolivia (4 GDP points) and Ecuador (2.5 GDP points), although both these countries still show by far the highest rates of public investment in the region. Argentina, Guatemala and Panama all decreased their capital spending by more than the regional average of 0.5 points. Only Chile, Mexico and Nicaragua raised capital spending by more than 0.4 percentage points of GDP.
Latin America (19 countries): central government capital spending by country, 2015
A. Capital spending (percentages of GDP)
12.6
9.2
6.35.0 4.9 4.8 4.7 4.3 4.1 3.9 3.3
2.7 2.7 2.7 2.6 2.2 2.0 1.9 1.4 1.3
0
2
4
6
8
10
12
14
Boliv
ia (P
lur.
Stat
e of
)
Ecua
dor
Pana
ma
Vene
zuel
a (B
ol. R
ep. o
f)
Hond
uras
Peru
Nic
arag
ua
Chile
Latin
Am
eric
a (1
9 co
untri
es)
Para
guay
Mex
ico
Arge
ntin
a
El S
alva
dor
Colo
mbi
a
Dom
inic
an R
ep.
Guat
emal
a
Braz
il
Cost
a Ri
ca
Haiti
Urug
uay
B. Annual variation in capital spending(percentage points of GDP)
0.70.5 0.4 0.2 0.2 0.2
0.0 -0.1 -0.1 -0.1-0.2 -0.3 -0.4 -0.5 -0.5-0.5-0.7
-1.7-2.5
-4.0
-5
-4
-3
-2
-1
0
1
2
Nic
arag
ua
Chile
Mex
ico
Braz
il
Para
guay
Cost
a Ri
ca
Peru
Urug
uay
El S
alva
dor
Dom
inic
an R
ep.
Vene
zuel
a (B
ol. R
ep. o
f)
Hond
uras
Colo
mbi
a
Haiti
Pana
ma
Guat
emal
a
Arge
ntin
a
Ecua
dor
Boliv
ia (P
lur.
Stat
e of
)
Latin
Am
eric
a (1
9 co
untri
es)
Source: Economic Commission for Latin America and the Caribbean (ECLAC), on the basis of official information.
Box II.2 Public investment in Latin America (selected countries)

97Chapter IIEconomic Survey of Latin America and the Caribbean • 2016
B. Given financing difficulties, tax systems must become a pillar for efforts to achieve the Sustainable Development Goals
1. The tax burden remains low in relation to the region’s level of development
Although the tax burden in the Latin American countries has expanded moderately as a result of the reforms implemented over the past few years, it remains low in relation to the region’s level of development, as may be observed in figure II.8, which shows a sample from 133 countries.
Figure II.8 Latin America (selected countries): tax burden compared with per capita GDP in purchasing power parity, around 2013a
0
5
10
15
20
25
30
35
40
45
50
6 7 8 9 10 11 12
Tax
burd
en (a
s a
perc
enta
ge o
f GDP
)
Log GDP per capita (PPP)
ARG
BOL
BRA
CHLCOLCRI
ECU
SLV
GTMHTI
HND
MEX
NICPAN
PRY
PER
DOM
URY
VEN
Countries from outside the region
Countries of Latin America and the Caribbean
Source: Economic Commission for Latin America and the Caribbean (ECLAC), on the basis of official information; Organization for Economic Cooperation and Development (OECD) y World Bank, World Development Indicators.
a Corresponds to the latest data available for the period 2011-2013. The coverage refers to central government for the Latin American countries, except for Argentina, Brazil, Chile, Colombia, Costa Rica, Mexico and the Plurinational State of Bolivia, where it refers to general government.
There are exceptions, however: in Argentina, Brazil, Nicaragua, the Plurinational State of Bolivia and Uruguay, tax pressure is higher than in other countries with similar levels of development. Costa Rica, Haiti and Honduras have an average level of tax pressure, while the 11 remaining countries have a lower tax burden than other countries with similar levels of per capita GDP. The Bolivarian Republic of Venezuela, Chile, the Dominican Republic, Mexico and Panama show the largest gaps with respect to the global average. These statistics include direct and indirect taxes and contributions to social security, i.e. public contributions in some cases and private in others; more detailed comparison of the tax burden would have to take these differences into account.
Many countries have been able to raise their tax receipts in relation to GDP since the start of the century, especially Argentina, Brazil, Ecuador, Nicaragua and the Plurinational State of Bolivia. Without the structural reforms made to tax systems, the current economic slowdown and falling commodity prices would threaten to undo the progress made on the tax front for most of the countries.
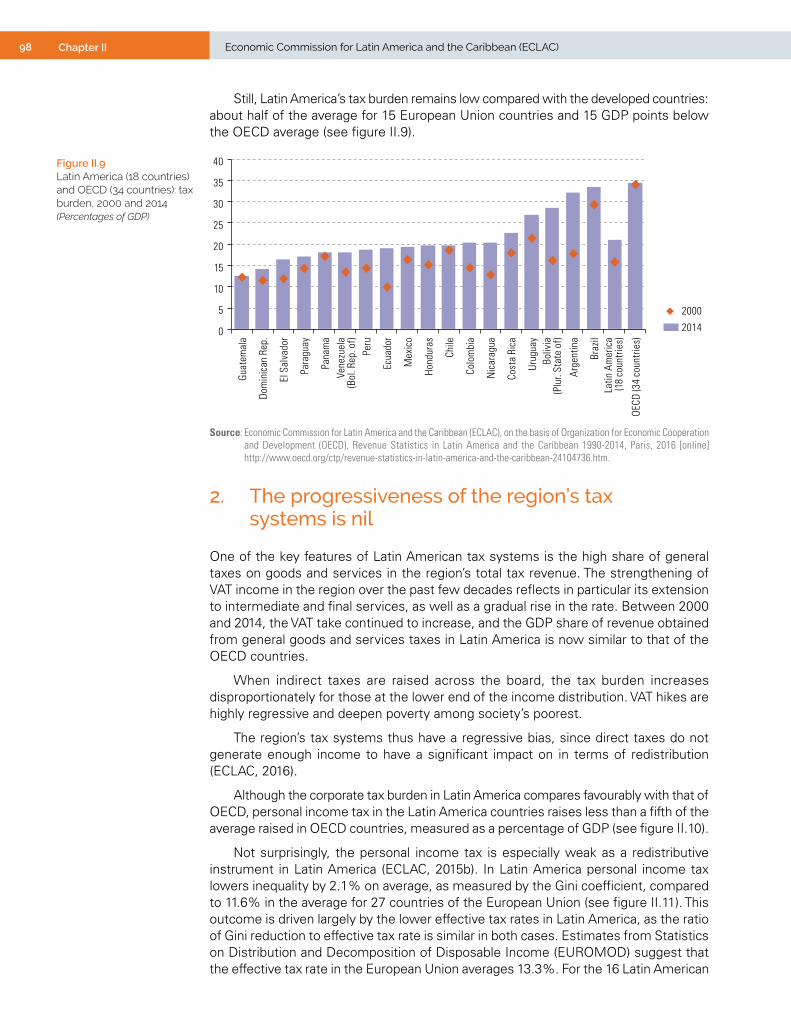
98 Chapter II Economic Commission for Latin America and the Caribbean (ECLAC)
Still, Latin America’s tax burden remains low compared with the developed countries: about half of the average for 15 European Union countries and 15 GDP points below the OECD average (see figure II.9).
Figure II.9 Latin America (18 countries) and OECD (34 countries): tax burden, 2000 and 2014(Percentages of GDP)
0
5
10
15
20
25
30
35
40
Guat
emal
a
Dom
inic
an R
ep.
El S
alva
dor
Para
guay
Pana
ma
Vene
zuel
a (B
ol. R
ep. o
f)Pe
ru
Ecua
dor
Mex
ico
Hond
uras
Chile
Colo
mbi
a
Nic
arag
ua
Cost
a Ri
ca
Urug
uay
Boliv
ia (P
lur.
Stat
e of
)
Arge
ntin
a
Braz
ilLa
tin A
mer
ica
(18
coun
tries
)
OECD
(34
coun
tries
)
2014
2000
Source: Economic Commission for Latin America and the Caribbean (ECLAC), on the basis of Organization for Economic Cooperation and Development (OECD), Revenue Statistics in Latin America and the Caribbean 1990-2014, Paris, 2016 [online] http://www.oecd.org/ctp/revenue-statistics-in-latin-america-and-the-caribbean-24104736.htm.
2. The progressiveness of the region’s tax systems is nil
One of the key features of Latin American tax systems is the high share of general taxes on goods and services in the region’s total tax revenue. The strengthening of VAT income in the region over the past few decades reflects in particular its extension to intermediate and final services, as well as a gradual rise in the rate. Between 2000 and 2014, the VAT take continued to increase, and the GDP share of revenue obtained from general goods and services taxes in Latin America is now similar to that of the OECD countries.
When indirect taxes are raised across the board, the tax burden increases disproportionately for those at the lower end of the income distribution. VAT hikes are highly regressive and deepen poverty among society’s poorest.
The region’s tax systems thus have a regressive bias, since direct taxes do not generate enough income to have a significant impact on in terms of redistribution (ECLAC, 2016).
Although the corporate tax burden in Latin America compares favourably with that of OECD, personal income tax in the Latin America countries raises less than a fifth of the average raised in OECD countries, measured as a percentage of GDP (see figure II.10).
Not surprisingly, the personal income tax is especially weak as a redistributive instrument in Latin America (ECLAC, 2015b). In Latin America personal income tax lowers inequality by 2.1% on average, as measured by the Gini coefficient, compared to 11.6% in the average for 27 countries of the European Union (see figure II.11). This outcome is driven largely by the lower effective tax rates in Latin America, as the ratio of Gini reduction to effective tax rate is similar in both cases. Estimates from Statistics on Distribution and Decomposition of Disposable Income (EUROMOD) suggest that the effective tax rate in the European Union averages 13.3%. For the 16 Latin American
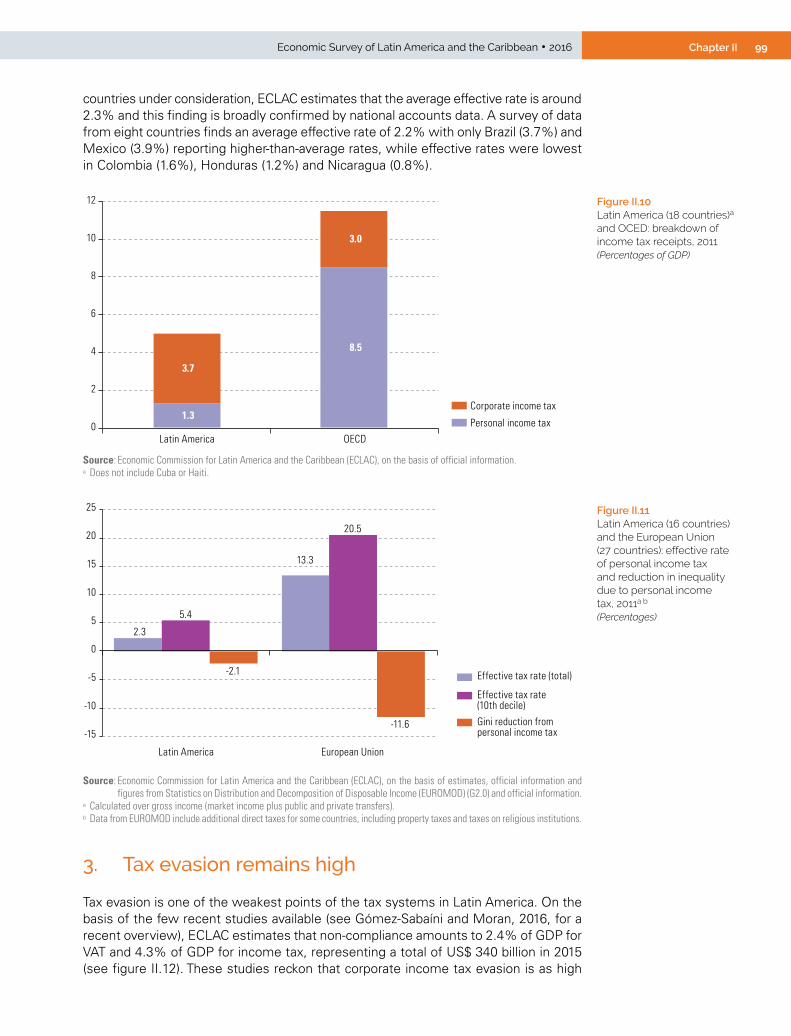
99Chapter IIEconomic Survey of Latin America and the Caribbean • 2016
countries under consideration, ECLAC estimates that the average effective rate is around 2.3% and this finding is broadly confirmed by national accounts data. A survey of data from eight countries finds an average effective rate of 2.2% with only Brazil (3.7%) and Mexico (3.9%) reporting higher-than-average rates, while effective rates were lowest in Colombia (1.6%), Honduras (1.2%) and Nicaragua (0.8%).
Figure II.10 Latin America (18 countries)a and OCED: breakdown of income tax receipts, 2011(Percentages of GDP)
1.3
8.5
3.7
3.0
0
2
4
6
8
10
12
Latin America OECD
Personal income tax
Corporate income tax
Source: Economic Commission for Latin America and the Caribbean (ECLAC), on the basis of official information.a Does not include Cuba or Haiti.
Figure II.11 Latin America (16 countries) and the European Union (27 countries): effective rate of personal income tax and reduction in inequality due to personal income tax, 2011a b
(Percentages)
-15
2.3
5.4
-2.1
13.3
20.5
-11.6
-10
-5
0
5
10
15
20
25
Latin America European Union
Effective tax rate (total)
Effective tax rate (10th decile)
Gini reduction from personal income tax
Source: Economic Commission for Latin America and the Caribbean (ECLAC), on the basis of estimates, official information and figures from Statistics on Distribution and Decomposition of Disposable Income (EUROMOD) (G2.0) and official information.
a Calculated over gross income (market income plus public and private transfers).b Data from EUROMOD include additional direct taxes for some countries, including property taxes and taxes on religious institutions.
3. Tax evasion remains high
Tax evasion is one of the weakest points of the tax systems in Latin America. On the basis of the few recent studies available (see Gómez-Sabaíni and Moran, 2016, for a recent overview), ECLAC estimates that non-compliance amounts to 2.4% of GDP for VAT and 4.3% of GDP for income tax, representing a total of US$ 340 billion in 2015 (see figure II.12). These studies reckon that corporate income tax evasion is as high
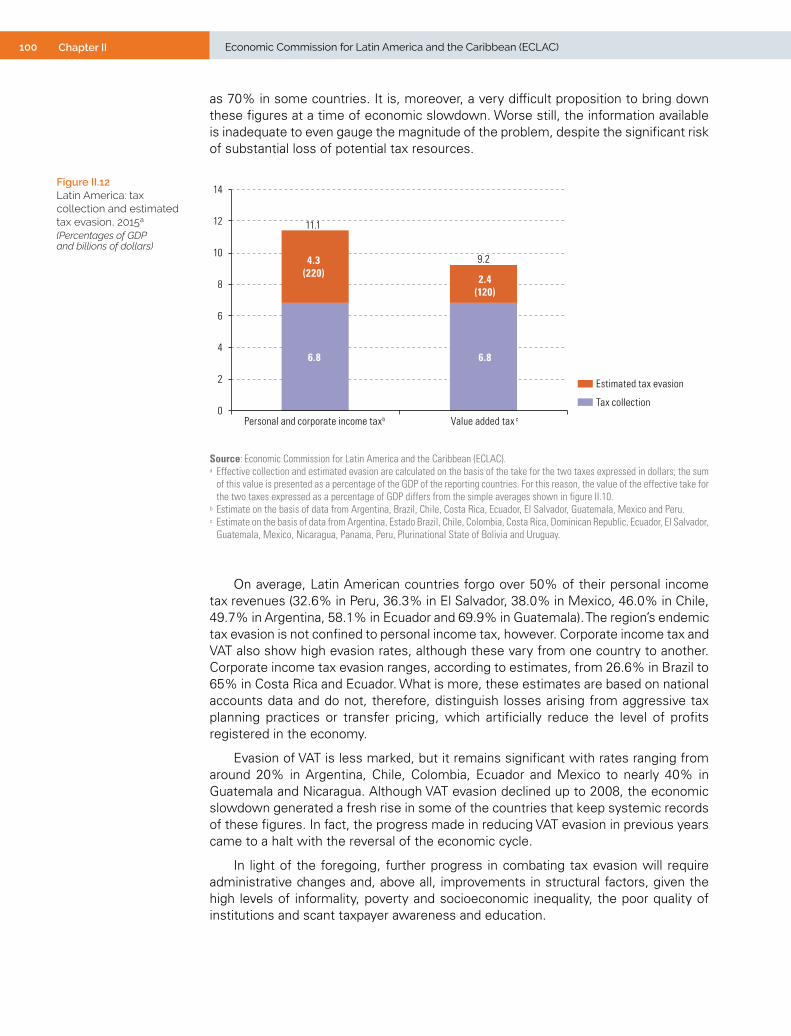
100 Chapter II Economic Commission for Latin America and the Caribbean (ECLAC)
as 70% in some countries. It is, moreover, a very difficult proposition to bring down these figures at a time of economic slowdown. Worse still, the information available is inadequate to even gauge the magnitude of the problem, despite the significant risk of substantial loss of potential tax resources.
Figure II.12 Latin America: tax collection and estimated tax evasion, 2015a
(Percentages of GDP and billions of dollars)
6.8 6.8
4.3(220) 2.4
(120)
11.1
9.2
0
2
4
6
8
10
12
14
Personal and corporate income taxb Value added tax c
Tax collection
Estimated tax evasion
Source: Economic Commission for Latin America and the Caribbean (ECLAC). a Effective collection and estimated evasion are calculated on the basis of the take for the two taxes expressed in dollars; the sum
of this value is presented as a percentage of the GDP of the reporting countries. For this reason, the value of the effective take for the two taxes expressed as a percentage of GDP differs from the simple averages shown in figure II.10.
b Estimate on the basis of data from Argentina, Brazil, Chile, Costa Rica, Ecuador, El Salvador, Guatemala, Mexico and Peru.c Estimate on the basis of data from Argentina, Estado Brazil, Chile, Colombia, Costa Rica, Dominican Republic, Ecuador, El Salvador,
Guatemala, Mexico, Nicaragua, Panama, Peru, Plurinational State of Bolivia and Uruguay.
On average, Latin American countries forgo over 50% of their personal income tax revenues (32.6% in Peru, 36.3% in El Salvador, 38.0% in Mexico, 46.0% in Chile, 49.7% in Argentina, 58.1% in Ecuador and 69.9% in Guatemala). The region’s endemic tax evasion is not confined to personal income tax, however. Corporate income tax and VAT also show high evasion rates, although these vary from one country to another. Corporate income tax evasion ranges, according to estimates, from 26.6% in Brazil to 65% in Costa Rica and Ecuador. What is more, these estimates are based on national accounts data and do not, therefore, distinguish losses arising from aggressive tax planning practices or transfer pricing, which artificially reduce the level of profits registered in the economy.
Evasion of VAT is less marked, but it remains significant with rates ranging from around 20% in Argentina, Chile, Colombia, Ecuador and Mexico to nearly 40% in Guatemala and Nicaragua. Although VAT evasion declined up to 2008, the economic slowdown generated a fresh rise in some of the countries that keep systemic records of these figures. In fact, the progress made in reducing VAT evasion in previous years came to a halt with the reversal of the economic cycle.
In light of the foregoing, further progress in combating tax evasion will require administrative changes and, above all, improvements in structural factors, given the high levels of informality, poverty and socioeconomic inequality, the poor quality of institutions and scant taxpayer awareness and education.
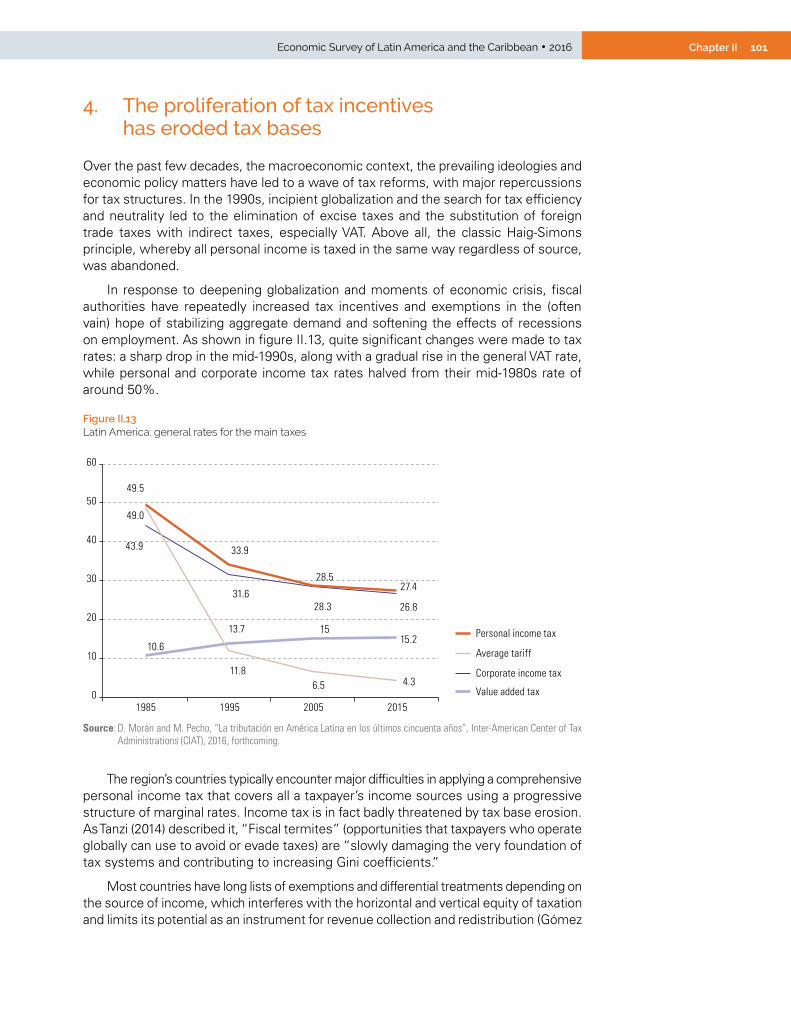
101Chapter IIEconomic Survey of Latin America and the Caribbean • 2016
4. The proliferation of tax incentives has eroded tax bases
Over the past few decades, the macroeconomic context, the prevailing ideologies and economic policy matters have led to a wave of tax reforms, with major repercussions for tax structures. In the 1990s, incipient globalization and the search for tax efficiency and neutrality led to the elimination of excise taxes and the substitution of foreign trade taxes with indirect taxes, especially VAT. Above all, the classic Haig-Simons principle, whereby all personal income is taxed in the same way regardless of source, was abandoned.
In response to deepening globalization and moments of economic crisis, fiscal authorities have repeatedly increased tax incentives and exemptions in the (often vain) hope of stabilizing aggregate demand and softening the effects of recessions on employment. As shown in figure II.13, quite significant changes were made to tax rates: a sharp drop in the mid-1990s, along with a gradual rise in the general VAT rate, while personal and corporate income tax rates halved from their mid-1980s rate of around 50%.
Figure II.13 Latin America: general rates for the main taxes
43.9
31.628.3 26.8
49.5
33.9
28.527.4
10.6
13.7 1515.2
49.0
11.86.5 4.3
0
10
20
30
40
50
60
1985 1995 2005 2015
Corporate income tax
Personal income tax
Value added tax
Average tariff
Source: D. Morán and M. Pecho, “La tributación en América Latina en los últimos cincuenta años”, Inter-American Center of Tax Administrations (CIAT), 2016, forthcoming.
The region’s countries typically encounter major difficulties in applying a comprehensive personal income tax that covers all a taxpayer’s income sources using a progressive structure of marginal rates. Income tax is in fact badly threatened by tax base erosion. As Tanzi (2014) described it, “Fiscal termites” (opportunities that taxpayers who operate globally can use to avoid or evade taxes) are “slowly damaging the very foundation of tax systems and contributing to increasing Gini coefficients.”
Most countries have long lists of exemptions and differential treatments depending on the source of income, which interferes with the horizontal and vertical equity of taxation and limits its potential as an instrument for revenue collection and redistribution (Gómez
102 Chapter II Economic Commission for Latin America and the Caribbean (ECLAC)
Sabaíni and Morán, 2014). The recent reforms and the adoption of what are known as “semi-dual systems” in many countries have enshrined this virtual dismemberment of the income tax by limiting taxation on capital income. Generalized capital incentive schemes, with low taxation on profits, dividends and interests —which tend to be justified by the difficulty of capital oversight in open economies and by the need to stimulate private investment— may be the least beneficial and perhaps even the most damaging feature of “harmful tax competition”.
In many of the region’s countries, the justification for tax incentives is that they attract foreign direct investment (FDI), which should by nature have significant positive externalities for the recipient economies (such as the take-up of new technologies or increased productivity). The question is establishing the net impact of these special arrangements, which at first glance might be described as merely a transfer of resources from poor (recipient) countries to rich ones.
Though it is difficult to generalize, the reasons sometimes used to justify tax incentives, such as the potential benefits of FDI for growth and jobs, or the multiplier effects of special economic zones, cease to be valid in a context of globalization and trade and financial openness. In terms of mobilizing financial resources for development, it would seem much more efficient to take more steps to reduce tax evasion and avoidance than to subsidize investments that very probably would have materialized anyway, given the region’s static and dynamic comparative advantages.
As discussed in ECLAC (2015a), investment decisions are largely determined by the quality of the institutional framework, and firms in fact appear to afford little importance to tax advantages. On this basis, more systemic approaches to investment dynamics could be built. For example, prioritizing public spending on social matters or public safety could boost private capital expenditure more effectively than exemptions or incentives.
A basic principle for investment promotion, then, is the need to avoid the proliferation of tax incentives or widespread subsidies. Public and private investment complement each other; one cannot replace the other. Attempting to stimulate private investment by reducing public investment is not a viable path towards development.
The question of tax incentives is also being raised in the international discussion on base erosion and profit shifting. One notable project within the United Nations aims to strengthen developing countries’ capacity to protect their tax bases by developing methods and practices to deal with tax incentives and the taxation of extractive industries. The countries participating in a number of Latin American and Caribbean forums have requested analytical frameworks and technical assistance to carry out cost-benefit studies and to consider the gradual dismantling of incentive systems. These initiatives show some promise, but they will need to garner willingness to prevent tax competition among countries with similar economic activities.
103Chapter IIEconomic Survey of Latin America and the Caribbean • 2016
BibliographyAuerbach, A.J. and Y. Gorodnichenko (2012), “Measuring the output responses to fiscal policy”,
American Economic Journal: Economic Policy, vol. 4, No. 2.Blanchard, O., A. Amighini and F. Giavazzi (2012), Macroeconomía, Pearson Education S.A.District Finance Secretariat (2014), Marco Fiscal de Mediano Plazo 2015- 2025, Bogota, November
[online] http://www.shd.gov.co/shd/sites/default/files/documentos/MFMP_2015_2025.pdf.ECLAC (Economic Commission for Latin America and the Caribbean) (2016), Fiscal Panorama
of Latin America and the Caribbean 2016: Public finances and the challenge of reconciling austerity with growth and equality (LC/L.4140), Santiago, March.
(2015a), Economic Survey of Latin America and the Caribbean, 2015 (LC/G.2645-P), Santiago. (2015b), Panorama Fiscal de América Latina y el Caribe, 2015 (LC/L.3961), Santiago.Gomez-Sabaini, J.C. and D. Morán (2016), “Evasión tributaria en América Latina: nuevos y antiguos
desafíos en la cuantificación del fenómeno en los países de la región”, Macroeconomía del Desarrollo series, No. 172 (LC/L.4155), Santiago, Economic Commission for Latin America and the Caribbean (ECLAC).
(2014), “Política tributaria en América Latina: agenda para una segunda generación de reformas”, Macroeconomía del Desarrollo series, No. 133 (LC/L.3632), Santiago, Economic Commission for Latin America and the Caribbean (ECLAC).
Jamaica, Government of (2016), Public Debt Annual Report, FY2015/2016, Kingston. (2015), Fiscal Policy Paper FY 2015/16. Interim Report, Kingston.Jiménez, J.P. and T. Ter-Minassian (2016), “Política fiscal y ciclo en América Latina: el rol de
los gobiernos subnacionales”, Santiago, Economic Commission for Latin America and the Caribbean (ECLAC), unpublished.
Marcel, M. and others (2001) “Balance estructural del gobierno central: metodología y estimaciones para Chile 1987-2000”, Estudios de Finanzas Públicas, No. 1, Santiago, Budget Office (DIPRES), Ministry of Finance, September.
MEF (Ministry of Economy and Finance) (2013), Marco macroeconómico multianual 2014-2016, Lima.
Morán, D. and M. Pecho (2016), “La tributación en América Latina en los últimos cincuenta años”, Inter-American Center of Tax Administrations (CIAT), forthcoming.
OECD (Organization for Economic Cooperation and Development) (2016), Revenue Statistics in Latin America and the Caribbean, 1990-2014, Paris [online] http://www.oecd.org/ctp/revenue-statistics-in-latin-america-and-the-caribbean-24104736.htm.
Riera-Crichton, D. (2015), “Fiscal multipliers in Latin America”, unpublished.Rossignolo, D. (2015), “Efectos económicos y macrofiscales de los recursos naturales en América
Latina”, Macroeconomía del Desarrollo series, No. 170 (LC/L.4112), Santiago, Economic Commission for Latin America and the Caribbean (ECLAC).
Tanzi, V. (2014), “Taxation and Equitable Economic Development: A Historical Note” [online]http://www. wilsoncenter.org/sites/default/files/VitoTanzi_2014_final.pdf.

104 Chapter II Economic Commission for Latin America and the Caribbean (ECLAC)
Annex II.A1
Stabilization funds in Latin America
Given the fall in raw materials prices, and the impact this has on public revenues, it is worthwhile to consider the region’s stabilization funds and how they tie in with fiscal rules. The past few years in Latin America have illustrated the benefits to be gained from developing the capacity to deploy countercyclical policy, such as that used to soften the impact of the international crisis by managing the fiscal savings built up during the price boom between 2003 and 2008. Stabilization funds are one of the tools used for achieving this.
In countries which have established these types of funds, stabilization takes priority over guaranteeing pensions or intergenerational equity. Eight Latin American countries have stabilization funds: Bolivarian Republic of Venezuela, Brazil, Chile (2), Mexico, Panama, Peru and Trinidad and Tobago. Four of the eight finance their funds with revenues from extractive activities: the Economic and Social Stabilization Fund (FEES) and the Pension Reserve Fund in Chile; the Macroeconomic Stabilization Fund in the Bolivarian Republic of Venezuela; the Heritage and Stabilization Fund in Trinidad and Tobago; and the Mexican Petroleum Fund for Stabilization and Development. Only Chile’s two funds and the Heritage and Stabilization Fund in Trinidad and Tobago have a built-in long-term perspective. Instruments such as stabilization funds offer countries in which natural resources are a major source of income the possibility of decoupling and stabilizing government revenues.
The priority of stabilization funds, in the strict sense, is to isolate the domestic economy from fluctuations in external conditions. Because they are necessarily cyclical, these funds must have a portfolio weighted towards liquid, low-risk assets. They are usually managed by central banks and, as noted earlier, are often linked to a fiscal policy rule. By assets in GDP terms, Chile’s Economic and Social Stabilization Fund stands out at 5.6% of GDP, as does Peru’s Fiscal Stabilization Fund, at 4.3%. Most of the funds, as shown in table II.A1.1, perform a stabilization function.
Table II.A1.1 Latin America (selected countries): sovereign funds
Country Name of fund Year established
Assets as a percentage
of GDPFinanced from
natural resources Type of fund
Chile Economic and Social Stabilization Fund (FEES)
2007 6.2 Yes Stabilization
Pension Reserve Fund 2007 3.6 Yes SavingsMexico Mexican Petroleum Fund for
Stabilization and Development2014 0.4 Yes Stabilization
Peru Fiscal Stabilization Fund of Peru 1999 5.5 No SavingsPanama Panama Savings Fund (FAP) 2012 2.9 No Savings
Source: Economic Commission for Latin America and the Caribbean (ECLAC), on the basis of D. Rossignolo, “Efectos económicos y macrofiscales de los recursos naturales en América Latina”, Macroeconomía del Desarrollo series, No. 170 (LC/L.4112), Santiago, ECLAC, 2015.
105Chapter IIEconomic Survey of Latin America and the Caribbean • 2016
Chile’s Economic and Social Stabilization Fund can be used to finance potential fiscal deficits and to pay down public debt, helping to avoid spending being affected by the economic cycle and the volatility of income from taxes, copper and other sources. The fund is financed from the surplus remaining after the contributions to the Pension Reserve Fund (FRP) and the central bank are deducted from the effective fiscal surplus, as established in the Fiscal Responsibility Act. Any debt paydowns or prepayments made the previous year are also deducted. The Pension Reserve Fund, in turn, finances obligations arising from the State guarantee of basic old-age and invalidity pensions, as well as solidary social security contributions included under the social security reform. This instrument complements financing for future pension contingencies. The Fiscal Responsibility Act decrees an annual rise in the value of the fund, of at least 0.2% and up to 0.5% of the previous year’s GDP.
In Mexico, the recently established Mexican Petroleum Fund for Stabilization and Development receives, administers and distributes the income from hydrocarbons allotments and extraction contracts. The Fund also administers the financial aspects of those contracts, i.e. relating to calculation and payment of the respective contributions of the State and the contractors. The Fund transfers resources into existing stabilization funds, as well as funds with other specific purposes. Once these obligations have been covered, the remaining resources are channeled into long-term saving. Once the value of the Fund has risen above 3% of the previous year’s GDP, the surplus may be spent within certain guidelines, but not for current spending (except for scholarships). If it rises above 10% of GDP, the real annual financial yield must be transferred to the Federal Treasury.
The Fiscal Stabilization Fund in Peru is financed from treasury budget surpluses, 10% of concessional rates and 10% of privatization proceeds. The fund has a ceiling of 4% of GDP, with any excess going to pay down debt.
The Panama Savings Fund, created in 2012, is financed from resources from the operation of the Panama Canal. The fund acts in both a savings and a stabilization capacity.
The Panama Savings Fund was set up to create long-term savings mechanisms for the Panamanian State, through careful investment strategies, with a view to ensuring cover for emergencies caused by natural disasters or economic slowdown, and to benefit future generations of Panamanians, as well as to reduce the need to issue debt. The Fund was started with US$ 300 million from the Development Trust Fund, which it replaced in June 2012, then received further income of around US$ 5.25 billion in 2015, with the broadening of the Canal. This Fund can be used only for transfers to the Treasury to cover the costs of a state of emergency exceeding 0.5% of GDP (since 2012) and economic slowdown (since 2015). The Treasury may also draw up to 0.5% of GDP annually to prepay sovereign debt, providing that the Fund’s assets exceed 5% of the previous year’s nominal GDP. The assets may not fall below 2% of GDP.
106 Chapter II Economic Commission for Latin America and the Caribbean (ECLAC)
Annex II.A2
A summary of macrofiscal rules in place in Latin America and the Caribbean (selected countries)
Argentina
In Argentina, the Federal Fiscal Responsibility Regime was created under Act 25.917 (2004), whose provisions indicate that the nominal rate of growth of primary public spending in national, provincial and Buenos Aires City budgets3 may not exceed the nominal rate of GDP growth projected in the corresponding macrofiscal framework. When the nominal rate of variation of GDP is negative, at most primary public spending may remain constant.
The spending provisions also indicate that the proceeds of sales of fixed assets of any kind and borrowing by the national, provincial or Buenos Aires City governments may not be used for current spending nor may they generate automatic increases for the following year, except credit operations to restructure debt under more favourable conditions, financing from multilateral lending agencies and resources from national programmes for financing public works and social purposes. Proceeds from the sale of fixed assets are thus explicitly allowed to be used for capital outlays.
The legislation also provides that national, provincial and Buenos Aires City governments must execute their budgets preserving financial balance.4 The provincial and Buenos Aires City governments must take the necessary measures to ensure that borrowing by their jurisdictions is such that the debt service in any fiscal year amounts to no more than 15% of net current transfers through municipal revenue-sharing. Lastly, the Federal Fiscal Responsibility Council was set up to oversee fulfilment of the law in this regard.
As a result of the heavy recession that began in 1998 and deepened in 2002, subnational finances deteriorated significantly owing to the burden of servicing subnational debt, and to the closure of financial markets. Accordingly, in 2002 the provinces signed an agreement with the federal government, which up Orderly Financing Programmes (PFO) (these became Financial Assistance Programmes (PAF) after 2005). These programmes established the conditions for restructuring subnational debt and implementing the Monetary Unification Programme, among other things.
The most substantial change to the Federal Fiscal Responsibility Regime occurred in 2009, when complementary provisions (Act 26.530 of 2009) rescinded the provisions on spending (on promoting economic activity, supporting employment levels, providing coverage for health emergencies and social welfare) and on the borrowing limits to which provinces were subject for the following fiscal years.
Brazil
Brazil’s Fiscal Responsibility Act was adopted in 2000 with a view to consolidating fiscal institutionality and establishing a broad framework for fiscal planning, execution
3 This refers to the sum of current and capital spending, excluding interest on public debt, expenditure financed from loans by international agencies and capital spending on basic social infrastructure necessary for economic and social development, financed any authorized use of credit in the case of the provinces and the Autonomous City of Buenos Aires.
4 This balance is measured as the difference between resources received —including current and capital resources— and accrued spending, including current spending net of expenditure financed by international agencies and capital spending net of expenditure on the basic social infrastructure necessary for economic and social development financed from any use of credit.
107Chapter IIEconomic Survey of Latin America and the Caribbean • 2016
and transfers at the federal, state and municipal levels. The Act established that a balance must exist between public income and expenditure at the federal level and in the states, Federal District and municipalities. On the income side, credit operations may not exceed capital expenditures included in the corresponding draft budget. The debt ceiling is proposed by the Office of the President and adopted by the Senate. Subnational governments may not issue or guarantee debt without the authorization of the Ministry of Finance and are also subject to the debt ceiling approved by the Senate. No debt ceiling has yet been established for the federal government. On the spending side, the Act established rules for staff spending, which may not exceed certain percentages of current revenues: 50% at the federal level, 60% for the states and 60% for the municipalities.
The Fiscal Responsibility Act obliges governments to set annual fiscal targets for the following three years. The government sets multiyear targets for the budgetary balance (for the present year and the following two years), and for spending and debt. These targets exclude the balances of public enterprises, mainly Petrobras and Electrobras. The Act does provide escape clauses, however. The timescale established may be extended if economy has contracted 1% or more in the four preceding quarters, or if Congress declares a national catastrophe or a state of emergency.
The national government has the power to hold back transfers to subnational levels if they do not meet the established targets. Lastly, in 2010 fiscal transparency provisions were added, including the obligation to adopt comprehensive financial administration and accounting systems.
Chile
Since 2001, fiscal policy in Chile has been guided by a target based on the cyclically adjusted balance, or structural balance. This delinks public spending from the natural and cyclical evolution of fiscal revenues and links it instead to structural fiscal income, thereby avoiding sharp adjustments to public spending in the event of economic downturns and allowing savings during upturns. Savings and their yields can be used to ride out periods of lower fiscal income or events requiring higher public spending, thereby facilitating countercyclical policy without jeopardizing the long-run stability of the fiscal accounts.5
Initially, the target set was a structural surplus of 1% of GDP. In 2006, the Fiscal Responsibility Act established that the President, within 90 days of taking office, must lay down the bases of the fiscal policy to be applied during his or her administration, including an explicit statement on the implications and effects the policy will have for the structural balance over the period.6 In the budget law of 2008, the structural balance target was lowered to 0.5% of GDP, then in 2009 it was cut to 0% in light of the prevailing crisis conditions, although the actual structural surplus that year was 3.1% of GDP.
The structural balance target has been changed twice since 2014. That year, the administration set as a target the gradual achievement of structural equilibrium —i.e. 0% of GDP— by 2018.7 The decree setting that target explicitly indicated that it would be maintained unless objective macroeconomic circumstances warranted an amendment. In this regard, in light of a deeper and longer downturn than expected, in combination with a substantial fall in the copper price, the target was changed for 2016 and up to 2018, for a reduction of approximately a quarter of a GDP percentage
5 For more details on the methodology, see Marcel and others (2001).6 See Article 1 of Act 20.128 on fiscal responsibility.7 See Decree 892, Ministry of Finance, published on 3 July 2014.

108 Chapter II Economic Commission for Latin America and the Caribbean (ECLAC)
point each year, measured by structural parameters that are comparable from one year to the next.8
In 2013 the Fiscal Advisory Council was created to collaborate, at the express request of the Ministry of Finance, in the discussion, analysis and issuing of recommendations concerning the cyclically adjusted balance. The Council takes part as an observer in meetings of the committees on trend GDP and copper benchmark price, and is expected to issue statements on the calculation of the cyclical adjustment to the structural balance performed by the Budget Office (DIPRES). Lastly, during the recent annual budget statement the President announced the Regional Fiscal Responsibility Act, which will cover regional financing, hitherto a direct responsibility of the central government.
Colombia
In 2011 Colombia passed into law a fiscal rule aimed at ensuring the long-term sustainability of public finances and contributing to the country’s macroeconomic stability. The Act defines the structural balance as the total fiscal balance adjusted for the effects of the macroeconomic cycle, non-recurrent and temporary impacts of mining and energy activity and other similar effects. The sphere of application of the Act is the national central government.
Structural spending may not exceed structural income by more than the annual target established in the structural balance; accordingly, the structural deficit of the national central government may not exceed 1% of GDP as of 2022. A paragraph on interim measures provides that the central government will reduce the deficit on the structural fiscal balance year-on-year. Accordingly it must not exceed 2.3% of GDP in 2014, 1.9% of GDP in 2018 and 1% of GDP in 2022.9 Subject to approval by the Supreme Council on Fiscal Policy (CONFIS), the fiscal rule may be temporarily suspended in case of on-off events that threaten the country’s macroeconomic stability.
According to Colombia’s medium-term fiscal framework (District Finance Secretariat, 2015), the fiscal balance has maintained a total deficit of 2.4% of GDP, within the 2014 target for the structural deficit under the fiscal rule described above.
Regarding countercyclical spending, the national government may execute spending programmes under countercyclical policy when real economic growth in any given year is projected at two percentage points below the real long-term growth rate, providing that a negative output gap is also projected. Spending may not exceed 20% of the estimated gap. CONFIS, which reports to the Ministry of Finance and Public Credit, determines the methodology for calculating the output gap, the amount of countercyclical expenditure allowed and its withdrawal trajectory, considering the evolution of the output gap and the economic situation in general.
Ecuador
Ecuador’s fiscal rule was established under the Organic Code of Planning and Public Finances passed in 2010. The Code provides that regular outlays may be financed only from regular income, in order to guarantee the conduct of public finances in a sustainable, responsible and transparent manner, and in the interests of economic stability. Regular outlays may be financed from non-regular income only in exceptional situations which are laid down in the Constitution, for the purposes of health, education and justice. Under the fiscal rule, capital expenditures are financed from non-recurrent income; accordingly, the rise in oil revenues enabled a large rise in direct public investment.
8 See Decree 1378, Ministry of Finance, published on 29 September 2015.9 See Act 1473 of 2011, which establishes a fiscal rule and other provisions.

109Chapter IIEconomic Survey of Latin America and the Caribbean • 2016
Regarding public borrowing, the Code established that the total public debt balance of a set of public bodies and agencies may in no circumstances exceed 40% of GDP. An absolute majority of the National Assembly is required to authorize exceptional borrowing in excess of this amount. The decentralized autonomous governments may not incur debt of more than 200% of their total annual revenues, and debt service payments may not exceed 25% of total annual revenues net of debt liabilities. Borrowing may be used to finance programmes, investment projects, infrastructure and refinancing of public debt under more favourable conditions, but not to finance regular spending10 except where provided in the Constitution for health, education and justice and subject to a declaration of exceptional circumstances by the President of the Republic.
In April 2016 the President decreed a state of emergency following a major earthquake which caused serious damage to several areas of the country. In this case, the state of emergency applied to the provinces of Esmeraldas, Manabi, Santa Elena, Santo Domingo de los Tsáchilas, Los Ríos and Guayas. To date, the main fiscal implications of this natural disaster consist of changes to budget items and the establishment of legally binding solidary contributions.11
Jamaica
The Fiscal Responsibility Framework was adopted in 2010 and includes two pieces of legislation: one on the budget balance and the other on debt. This framework also contains provisions that restrict public-private partnership agreements and escape clauses in the event of imbalances in the national accounts.
The Financial Administration and Audit Act sets the following quantitative targets: elimination of the fiscal deficit by the end of the fiscal year (31 March 2016); reduction of the public debt to 100% of GDP or less; and reduction of expenditure on wages and salaries to no more than 9% of GDP. The aforementioned targets can be breached in the case of eventualities relating to national security or a national emergency, which have a major impact on the economy.
The Annual Fiscal Policy Paper (2015-2016 (Jamaica, Government of, 2015) estimates that government operations in fiscal 2015/2016, generated a primary surplus of 7.4% of GDP, compared to the projected 7.25%; the fiscal deficit is estimated at 0.3% of GDP. The report states that expenditure on wages and salaries amounted to 10.3% of GDP, up from the 10.2% recorded in the previous fiscal year. The public debt declined by about four percentage points, dropping from 130.6% of GDP to 126.8%.
The Public Debt Annual Report, FY 2015/2016 (Jamaica, Government of, 2016) states that since fiscal 2012/2013, in which the debt grew to 135.6% of GDP from 132% in fiscal 2011/2012, the debt has been declining gradually, mainly thanks to rapid nominal GDP growth. In fiscal 2013/2014, the debt amounted to 133% of GDP, after which it fell to 130.6% in 2014/2015; and it reached 126.8% of GDP in the most recent fiscal year.
10 The Code defines regular outlays as operational expenditures made by its entities, institutions and agencies, that need to be repeated regularly to ensure the continuous provision of public goods and services to society. Regular outlays do not directly generate capital accumulation or public assets.
11 The fiscal changes are as follows: (i) modification of budgetary spending items in accordance with legal bases accounting for the origin and nature of the resources and their destination to public sector income and expenditure classifications and the corresponding entries in the general accounts catalogue (in order to properly identify, record and administer public funds that are being used for emergency situations); (ii) the passing of a Solidarity Act (the Law for Solidarity and Joint Responsibility of Citizens in the Reconstruction and Recovery of Zones Affected by the Earthquake of 16 April 2016), to raise solidary contributions for planning, construction and reconstruction of public and private infrastructure, and to reactivate the economy. Among other things, this will include plans, programmes, incentives and policies to tackle the consequences of the disaster. Solidary contributions are levied on wages, assets, profits and real estate, as well as on the book value of equity interests held in Ecuador by entities resident in tax havens or other foreign jurisdictions.
110 Chapter II Economic Commission for Latin America and the Caribbean (ECLAC)
The aforementioned report highlights the changes in the business cycle and stresses the need to reconcile fiscal accountability and consolidation —specified in the laws— with fiscal policy flexibility and discretion, to be able to respond to contingencies, such as those mentioned in the previous paragraph. The legislation also provides for the suspension of the fiscal rules in specific situations, subject to approval by the Auditor General and Parliament.
Mexico
On 24 January 2014 modifications to the Federal Budget and Fiscal Responsibility Act were published in Mexico’s official gazette, aimed at boosting prudential and disciplined management of public finances. The Act established that the income projected therein and under the Revenues Act, as well as the expenditure projected in the outlays budget, and expenditures executed during the fiscal year, must contribute to achieving the annual target for public sector financing requirements. The Ministry of Finance and Public Credit must, in its last quarterly report of the year, justify any deviation of more than 2% from the total approved expenditure at the end of the fiscal year.
Under the Act, total net expenditure must be consistent with budget balance. The target budget position for 2015 was set at 1.0% of GDP, resulting from a projected budget deficit of 3.5% of GDP minus investment amounting to 2.5% of GDP by Petróleos Mexicanos (PEMEX) and its subsidiaries. In the event that income falls below projections for the year, budget discipline rules come into effect under the Act that require offsets through other revenue items. As well, resources can be drawn from the Federal Agencies Revenue Stabilization Fund, and budgets must be cut for government departments, agencies, funds and programmes, in the following order: (i) communications costs; (ii) administrative spending not linked to services for the population; (iii) spending on personal services; (iv) budgetary savings and economies to be determined according to the authorized budget calendars.
The modifications to the Federal Budget and Fiscal Responsibility Act provided that public sector financing requirements are the financing needs of the federal government and federal public sector entities, and must cover the difference between income and expenditure other than net acquisition of financial assets and liabilities.12 This is based on the premise that the final financial position (liabilities minus assets) of an institutional unit or sector vis-à-vis the rest of the economy in a given period of time is the sum of the financial position at the start of the period and the economic flows occurring during that period of time.
The methodological guide to the fiscal balance —which by law the Ministry of Finance and Public Credit must make available at all times— indicates that policies on public sector income, expenditure and financing impact directly on the financial position through transactions in which total income less total expenditure determines financing needs (financial requirements or fiscal balance). Financing needs are covered by acquiring liabilities or selling financial assets. The financial position is thus equal to the initial balance plus the acquisition of liabilities, the sale of financial assets and other economic flows corresponding to valuation and adjustments to the volume of financial assets and liabilities.
In sum, public sector financing requirements serve to assess the fiscal position on a cash flow and accrual basis showing the net variation in the public sector’s financial
12 Under article 2, paragraph XLVII, public sector financing requirements are defined as the financing needs of the federal government and the federal public sector entities, covering the difference between income and expenditure other than net acquisition of financial assets and liabilities, including the activities of the private and social sector when acting on behalf of the federal government or its public sector entities.
111Chapter IIEconomic Survey of Latin America and the Caribbean • 2016
position and asset position, as recommended in the Government Finance Statistics Manual published by the International Monetary Fund in 2001.
At the subnational level, the Federated Entities and Municipalities Financial Discipline Act (2016) was approved recently. As discussed in Ter Minassian and Jiménez (2016), the governments of Mexico’s federated entities maintain unsustainable levels of debt.13 The new Act establishes that the total expenditure proposed in the draft outlays budgets of federal entities and municipalities must contribute to a sustainable budget position.14 Both these levels of government are thus obliged to generate sustainable balances: at the end of the fiscal year the balance must be greater or equal to zero on an accruals basis. The balance may be negative in the event of GDP contractions or natural disasters.
Federal entities are obliged to plan resources to assist the population affected by infrastructure damage caused by natural disasters. They must lay aside at least 10% of the amount needed to rebuild damaged infrastructure on average over the preceding five fiscal years. A ceiling is applied to spending on personal services, based on the multiplication of the amount approved in the outlays budget for the preceding year by the value obtained by adding a real growth rate of 3% to the real rate of GDP growth indicated in the country’s general economic policy criteria. In the event that income falls below projections for the year, federal entities must adjust spending items in the following order: (i) communications costs; (ii) current spending other than subsidies transferred directly to the population; and (iii) spending on personal services.
The Act also prohibits public entities from directly or indirectly borrowing or incurring other liabilities with the governments of other countries or with foreign firms or private individuals. They may incur liabilities only for public investment in production areas, refinancing or restructuring. Federal entities and municipalities may incur liabilities without authorization from local legislatures if the total outstanding balance of the principal of short-term liabilities does not exceed 6% of total income approved in the Revenues Act, after subtracting net borrowing. A number of provisions on borrowing apply exclusively to Mexico City.
The federal government may guarantee state and municipal debt if the respective contract is in place, if federal revenue-sharing is affected (the funds must be sufficient) and if the debt does not exceed 3.5% of GDP. An early warning system was set up that classifies debt levels as sustainable, under observation or high. Lastly, a single register of debt was created to record all public agency financing and liabilities in a transparent manner, for reporting and information purposes only. Failure to properly record borrowing is punishable under the legislation on the administrative responsibilities of public servants.
Panama
Panama’s Fiscal Social Responsibility Act (2012) and Savings Fund Act introduce the concept of the adjusted balance of the non-financial public sector, which is defined as the balance less annual deposits in the Panama Savings Fund (FAP). Under the Act, this balance is measured on a cash basis in relation to the year’s nominal GDP, and must not run into deficit by more than 1%.
In the event of natural disaster, national emergency or a real GDP growth rate of 1% or less, the Act provides that the Cabinet, through the Ministry of Economic Affairs
13 For example, the work cited indicates that debt ratios exceed 200% in most states, owing to the low proportion of independent state resources within their total income.
14 By budget position, the Act understands the difference between total income included in the Revenues Act and expenditure included in the outlays budget, minus debt service payments.
112 Chapter II Economic Commission for Latin America and the Caribbean (ECLAC)
and Finance and on the basis of a substantiated report endorsed by the Office of the Comptroller General of the Republic, may ask the National Assembly to waive the financial ceilings. Within three calendar months of the waiver, the Executive must submit a revised financial programme to the National Assembly, reflecting and substantiating how finances will be brought back within the stipulated parameters. This must happen within three years, with a maximum deficit of 3% of nominal GDP during the first year of adjustment, 2% during the second year, and 1% in the third year.
In the case of debt, the law requires government fiscal policy to target a reduction in the level of the net public debt of the non-financial public sector as a percentage of nominal GDP, such that interest payments decrease as a proportion of current income. As an indicative target, it requires the net public debt of the non-financial sector to drop to 40% of nominal GDP over a seven-year period, as from fiscal 2008. The government will set partial targets for the next seven years, in the framework of its five-year plans, to comply with this law. Once the 40% target has been attained, the Ministry of Economy and Finance will apply public debt policies to prevent it from being breached in the future.
As described below, amounts obtained from fees and duties paid for using the Panama Canal, in excess of 3.5% of GDP, must be transferred to the Panama Savings Fund. The budget deficit ceilings were set at 2.9% of GDP for 2012, falling to 0.5% of GDP as from 2018. Escape clauses are also specified in the event of states of emergency and economic recession. The 2009 rule imposes a debt ceiling of 40% of GDP for 2015; and the balance must be brought below this level by 2017.
Peru
In 2013, the Fiscal Responsibility and Transparency Strengthening Act was passed, the main principle of which requires the government to permanently ensure fiscal sustainability, and finance public expenditure on a predictable basis, by decoupling it from the most volatile component of public income and adequately managing short and long-term fiscal risks. No later than 90 days after taking office, the government must publish a macrofiscal political statement for the presidential term, This must specify the ex-ante target for the structural fiscal balance of the non-financial public sector, which may not exceed a deficit of 1% of GDP, in accordance with the main guidelines of macrofiscal policy; and the consequent referential limits on the non-financial expenditure of the national, regional and local governments, and the primary balance of non-financial public enterprises.
With a few exceptions,15 non-financial expenditure may not exceed the limit set by Supreme Decree issued by the Ministry of Economy and Finance, and is subject to the ex-ante target for the structural fiscal outturn mentioned above. National government non-financial expenditure on permanent or temporary employees is subject to a limit defined by applying the growth rate of potential nominal GDP to the ceiling estimated for the previous year’s non-financial expenditure on personnel and pensions.
In reference to the political cycle, this law states that national government non-financial expenditure executed in the first seven months of the electoral year may not exceed 60% of the limit set for the year as a whole. It further provides that in the first seven months of the year, measures may not be approved or enter into force which
15 The ceiling on this expense can be altered in the following situations: (i) if the non-financial expenditure of the national government accrued in the previous year was less than the limit set for that year, the expenditure limit can be raised by up to the equivalent amount, without exceeding 0.2% of GDP; (ii) if a positive or negative output gap of at least 2.0% of potential GDP is projected, the expenditure limit must be altered only through countercyclical transitory measures which as a whole do not exceed 25% of the estimated gap, or 0.5% of GDP; (iii) when tax policy measures have been adopted that generate permanent changes in fiscal income of at least 0.3% of GDP, the expenditure limit must be altered by up to the equivalent amount.

113Chapter IIEconomic Survey of Latin America and the Caribbean • 2016
reduce fiscal space for the new administration, or increase the current expenditure of the national government and entail payment commitments after the outgoing administration has left office.
The law also limits the balance of the total debt of regional and local governments at 100% of total current income. The annual percentage variation in non-financial expenditure may not exceed the percentage variation of the four-year moving average of annual income, measured from the second year prior to each corresponding fiscal year. Transfers to fund public investment projects will not be considered for this purpose. Lastly, the law allows regional and local governments to obtain financing through external borrowing only with State backing and only if the proceeds are destined for public infrastructure.
This legal instrument requires a quarterly report to be published on the degree of progress in the expenditure rules. For that purpose, expenditure limits are defined in the Multi-year Macroeconomic Framework 2014-2016 (MEF, 2013), while the rules governing the national government’s total non-financial expenditure and non-financial expenditure on personnel and pensions are set in a Supreme Decree.
The Law in question entered into force in 2015 and created the Fiscal Council as an autonomous committee attached to the Ministry of Economy and Finance, with a mission to contribute to the technical and independent analysis of macrofiscal policy. Nonetheless, under the law, the council’s opinions, which are not binding, must relate to the following issues: amendment and fulfilment of the fiscal rules provided for in the law; the fiscal projections included in the Multi-Year Macroeconomic Framework; the short and medium-term trend of public finances; the methodology used to calculate the structural accounts, potential GDP, and long-term export prices.

114 Chapter II Economic Commission for Latin America and the Caribbean (ECLAC)Ta
ble
II.A
2.1
Lat
in A
me
rica
and
the
Car
ibb
ean
(se
lect
ed
co
unt
ries)
: fis
cal r
ule
s, b
y co
unt
ry
Coun
trySp
endi
ngBa
lanc
eDe
btEs
cape
cla
use
Pref
eren
tial t
reat
men
t fo
r inv
estm
ent
Subn
atio
nal g
over
nmen
tsM
ain
chan
ges
afte
r 200
8-20
09
Arge
ntin
aPr
imar
y sp
endi
ng m
ay
not e
xcee
d pr
ojec
ted
nom
inal
GDP
gro
wth
Subn
atio
nal b
orro
win
g m
ay n
ot e
xcee
d 15
% o
f m
unic
ipal
reve
nue-
shar
ing
Curre
nt s
pend
ing
may
no
t be
finan
ced
with
de
bt o
r the
pro
ceed
s of
sa
les
of fi
xed
asse
ts
Borro
win
g lim
it: 1
5% ru
le
and
Fina
ncia
l Ass
ista
nce
Prog
ram
mes
(200
5)
The
ban
on fi
nanc
ing
curre
nt
spen
ding
from
bor
row
ing
or th
e pr
ocee
ds o
f sal
es
of fi
xed
asse
ts w
as li
fted,
as
was
the
ceili
ng o
n su
bnat
iona
l bor
row
ing
Braz
ilSt
aff e
xpen
ditu
res
may
not
exc
eed
certa
in
ceili
ngs,
dep
endi
ng o
n th
e le
vel o
f gov
ernm
ent
Gove
rnm
ents
mus
t set
an
nual
fisc
al ta
rget
s fo
r th
e fo
llow
ing
thre
e ye
ars
Subn
atio
nal g
over
nmen
ts
may
not
issu
e de
bt w
ithou
t au
thor
izatio
n fro
m th
e M
inis
try o
f Fin
ance
, su
bjec
t to
a de
bt c
eilin
g ap
prov
ed b
y th
e Se
nate
Thes
e lim
its c
an b
e m
ade
mor
e fle
xibl
e in
the
even
t of
eco
nom
ic c
ontra
ctio
n (1
%),
a ca
tast
roph
e or
a
stat
e of
em
erge
ncy
Any
volu
me
of in
vest
men
t m
ay b
e fin
ance
d th
roug
h bo
rrow
ing,
with
the
sole
re
stric
tion
refe
rring
to th
e cu
rrent
acc
ount
bal
ance
The
fede
ral g
over
nmen
t is
empo
wer
ed to
with
hold
tra
nsfe
rs in
cas
e of
no
n-co
mpl
ianc
e
Fisc
al tr
ansp
aren
cy
prov
isio
ns a
nd c
hang
es to
an
nual
targ
ets
publ
ishe
d in
the
budg
et la
w
Chile
Stru
ctur
al s
urpl
us o
f 1%
, whi
ch m
ay b
e am
ende
d by
dec
ree
Targ
ets
may
be
amen
ded
by
decr
ee, p
rovi
ding
that
the
varia
bles
sub
stan
tiatin
g th
e ch
ange
are
mad
e ex
plic
it
The
stru
ctur
al b
alan
ce h
as
been
mad
e m
ore
flexi
ble:
in
201
4 th
e ta
rget
was
ch
ange
d tw
ice,
firs
t to
0%
and
late
r -0.
25%
of G
DP
Colo
mbi
aCo
unte
rcyc
lical
spe
ndin
g is
allo
wed
whe
n an
out
put
gap
is p
roje
cted
: up
to 2
0%
of th
e es
timat
ed g
ap
The
stru
ctur
al d
efic
it of
the
natio
nal c
entra
l gov
ernm
ent
may
not
exc
eed
1% o
f GD
P st
artin
g in
202
2
Rule
on
non-
recu
rrent
ev
ents
that
com
prom
ise
mac
roec
onom
ic s
tabi
lity
is
susp
ende
d by
agr
eem
ent
with
the
Supr
eme
Coun
cil
on F
isca
l Pol
icy
Rule
cre
ated
in 2
011
Ecua
dor
Regu
lar o
utla
ys to
be
finan
ced
from
regu
lar
inco
me
only
The
debt
cei
ling
is
set a
t 40%
of G
DPRu
les
on s
pend
ing
and
debt
hav
e co
nstit
utio
nal
exce
ptio
ns in
rela
tion
to
educ
atio
n, h
ealth
and
ju
stic
e, a
nd e
xcep
tions
ar
e al
so m
ade
for s
tate
s of
em
erge
ncy
decl
ared
by
the
Pres
iden
t
Borro
win
g ca
n be
use
d to
fina
nce
prog
ram
mes
, in
vest
men
t pro
ject
s an
d in
frast
ruct
ure,
am
ong
othe
r thi
ngs
Dece
ntra
lized
aut
onom
ous
gove
rnm
ents
may
not
bo
rrow
mor
e th
an 2
00%
of
thei
r tot
al a
nnua
l inc
ome
and
paym
ents
on
debt
se
rvic
e m
ust n
ot e
xcee
d 25
% o
f tot
al a
nnua
l in
com
e ne
t of b
orro
win
g
The
Code
was
ad
opte
d in
201
0
Jam
aica
Quan
titat
ive
targ
ets
are
set t
o re
duce
exp
endi
ture
on
wag
es a
nd s
alar
ies
Quan
titat
ive
targ
ets
are
set t
o re
duce
the
defic
itQu
antit
ativ
e ta
rget
s ar
e se
t to
redu
ce th
e de
btTh
e ta
rget
s ca
n be
bre
ache
d in
the
even
t of c
ontin
genc
ies
rela
ting
to n
atio
nal s
ecur
ity
or a
nat
iona
l em
erge
ncy,
w
hich
hav
e a
stro
ng
impa
ct o
n th
e ec
onom
y
Quan
titat
ive
targ
ets
are
set t
o re
duce
exp
endi
ture
on
wag
es a
nd s
alar
ies
Quan
titat
ive
targ
ets
are
set t
o re
duce
the
defic
itQu
antit
ativ
e ta
rget
s ar
e se
t to
redu
ce th
e de
bt
Mex
ico
Tota
l net
exp
endi
ture
m
ust c
ontri
bute
to
budg
etar
y ba
lanc
e.
Annu
al ta
rget
for t
he
publ
ic s
ecto
r’s n
et
finan
cing
requ
irem
ent.
The
Fede
ral P
ublic
Deb
t Act
w
hich
spe
cifie
s m
easu
res
for c
ontra
ctin
g de
bt b
y th
e fe
dera
l gov
ernm
ent.
In th
e ev
ent o
f eco
nom
ic
and
soci
al c
ondi
tions
that
im
pove
rish
the
coun
try,
a de
ficit
is p
rem
issi
ble
Tota
l net
exp
endi
ture
m
ust c
ontri
bute
to
budg
etar
y ba
lanc
e.
Annu
al ta
rget
for t
he
publ
ic s
ecto
r’s n
et
finan
cing
requ
irem
ent.
The
Fede
ral P
ublic
Deb
t Act
w
hich
def
ines
mea
sure
s fo
r con
tract
ing
debt
by
the
fede
ral g
over
nmen
t.

115Chapter IIEconomic Survey of Latin America and the Caribbean • 2016
Coun
trySp
endi
ngBa
lanc
eDe
btEs
cape
cla
use
Pref
eren
tial t
reat
men
t fo
r inv
estm
ent
Subn
atio
nal g
over
nmen
tsM
ain
chan
ges
afte
r 200
8-20
09
Pana
ma
The
adju
sted
bal
ance
of t
he
non-
finan
cial
pub
lic s
ecto
r m
ay n
ot e
xcee
d 1%
per
yea
r
An in
dica
tive
targ
et is
set
w
here
by th
e ba
lanc
e of
th
e ne
t pub
lic d
ebt o
f the
no
n-fin
anci
al p
ublic
sec
tor
is re
duce
d to
no
less
than
40
% o
f nom
inal
GDP
ove
r a
seve
n-ye
ar p
erio
d
In s
ituat
ions
of n
atur
al
disa
ster
of e
mer
genc
y, o
r w
hen
real
GDP
gro
wth
is
1% o
r les
s, a
requ
est c
an b
e m
ade
to w
aive
app
licat
ion
of th
e fin
anci
al li
mits
The
adju
sted
bal
ance
of t
he
non-
finan
cial
pub
lic s
ecto
r m
ay n
ot e
xcee
d 1%
per
yea
r
An in
dica
tive
targ
et is
set
w
here
by th
e ba
lanc
e of
th
e ne
t pub
lic d
ebt o
f the
no
n-fin
anci
al p
ublic
sec
tor
is re
duce
d to
no
less
than
40
% o
f nom
inal
GDP
ove
r a
seve
n-ye
ar p
erio
d
Peru
Non
-fina
ncia
l pub
lic
expe
nditu
re m
ay e
xcee
d th
e le
vel s
peci
fied
by
decr
ee, w
hile
resp
ectin
g th
e es
tabl
ishe
d fis
cal
outtu
rn; l
imits
are
als
o se
t on
per
sonn
el e
xpen
ditu
re
and
for e
lect
oral
per
iods
The
stru
ctur
al fi
scal
out
turn
of
the
non-
finan
cial
pub
lic
sect
or m
ay n
ot e
xcee
d a
defic
it of
1%
of G
DP
Borro
win
g lim
its fo
r reg
iona
l an
d lo
cal g
over
nmen
tsTh
e ex
pend
iture
lim
its
can
be a
ltere
d if
natio
nal
gove
rnm
ent n
on-fi
nanc
ial
expe
nditu
re a
ccru
ed in
th
e pr
evio
us y
ear i
s le
ss
than
the
limit
set f
or th
at
year
, and
a re
duct
ion
in
the
GDP
gap
equi
vale
nt to
at
leas
t 2%
of p
oten
tial
GDP
is p
roje
cted
Non
-fina
ncia
l pub
lic
expe
nditu
re m
ay e
xcee
d th
e le
vel s
peci
fied
by
decr
ee, w
hile
resp
ectin
g th
e es
tabl
ishe
d fis
cal
outtu
rn; l
imits
are
als
o se
t on
per
sonn
el e
xpen
ditu
re
and
for e
lect
oral
per
iods
The
stru
ctur
al fi
scal
out
turn
of
the
non-
finan
cial
pub
lic
sect
or m
ay n
ot e
xcee
d a
defic
it of
1%
of G
DP
Borro
win
g lim
its fo
r re
gion
al a
nd lo
cal
gove
rnm
ents
Sour
ce: E
cono
mic
Com
mis
sion
for L
atin
Am
eric
a an
d th
e Ca
ribbe
an (E
CLAC
), on
the
basi
s of
offi
cial
info
rmat
ion.
Tab
le II
.A2.
1 (c
on
clu
de
d)


IIICHAPTER
Evasion arising from international operations by multinational enterprises and high net worth individuals
Introduction
A. Profit shifting and aggressive tax planning
B. An estimation of tax losses resulting from trade misinvoicing
C. Coordinating efforts between countries
Bibliography
Annex III.A1
Annex III.A2


Chapter IIIEconomic Survey of Latin America and the Caribbean • 2016 IIIIntroduction
Tax evasion is not just a domestic issue: the more a country is engaged in the world economy, the greater the potential erosion of its tax base —the problem of so-called fiscal termites. These termites exist because of the proliferation of avoidance mechanisms, making it helpful to differentiate between three sources of erosion: (a) the burgeoning of tax incentives already described, (b) profit shifting and aggressive tax planning and (c) illicit financial flows arising from international trade and capital movements.
In today’s world order, financial globalization and the progressive monopolization of the economy by corporations have enabled multinational and transnational enterprises to gain greater control over production and trade, giving them a degree of economic power that makes them better able to adapt to regulatory frameworks and deploy sophisticated strategies for reducing their overall tax burden. The corollary is a lessening of countries’ ability to retain fiscal revenues that could be used to finance their development.
Strictly speaking, these practices and strategies do not entail tax evasion insofar as they do not involve any illegal manoeuvre (the breaking of laws or formal rules) but rather a systematic search for scope within tax legislation to reduce their tax obligations. From the point of view of States, therefore, efforts to deal with base erosion need to encompass the study of all these phenomena, legal or otherwise, including incentives, exemptions, avoidance, evasion and, of course, illegal activities.
What is certain, in any event, is that the tax planning of multinationals (and high net worth individuals) creates serious distortions in the equity of tax systems, reflected in large differences in effective tax rates for similar firms in a country and its residents. While these manoeuvres are not always illegal, their existence and persistence are bound up with limitations and shortcomings in tax systems, which need to be understood so that accurate diagnoses can be arrived at and action taken to resolve these issues. The rest of this chapter will deal with the impact of profit shifting and illicit flows on the tax systems of Latin America.
The fiscal losses associated with evasion and avoidance around the world are striking. The Organization for Economic Cooperation and Development (OECD) estimates that treasuries worldwide are losing between US$ 100 billion and US$ 240 billion a year, equivalent to between 4% and 10% of the corporate income tax take. Estimates by the United Nations Conference on Trade and Development (UNCTAD), based on a different methodology, yield a similar result, but reveal that losses in developing countries could be much greater in absolute and relative terms (see annex III.A1).
In this context, it is important to analyse and quantify these trends in Latin America and the Caribbean. Estimates of illicit financial flows for the region are presented below. One key finding is that outflows from international trade price manipulation have increased sharply in the last decade, representing 1.8% of regional GDP (totalling US$ 765 billion in the period 2004-2013). In 2013, illicit outflows climbed to US$ 101.6 billion and the associated tax losses stood at about US$ 31 billion (0.5 percentage points of GDP) as a result of foreign trade price manipulation. This amount represents between 10% and 15% of the actual corporate income tax take.

120 Chapter III Economic Commission for Latin America and the Caribbean (ECLAC)
A. Profit shifting and aggressive tax planning
Three principles have guided the design of corporate income taxation, first in developed countries and then in developing ones: (a) the jurisdictional criterion of the income source or place of residence; (b) arm’s length pricing; and (c) bilateral tax harmonization agreements (Zucman, 2015). These guiding principles date from the 1920s and, with growing economic and financial globalization, have now been seriously undermined by the ever more sophisticated strategies being deployed by multinational enterprises in their determination to reduce their global tax payments. In relation to the precepts listed, Zucman particularly highlights the abuse of bilateral treaties to generate untaxed revenues (treaty shopping), transfer pricing manipulation and profit shifting.
In this context, stress has been laid on the importance of practices involving the transfer of profits or costs between subsidiaries of a single multinational enterprise, from countries or States with high tax levels or administrative constraints on capital flows to jurisdictions with systems applying relatively low or zero taxation (tax havens), via the manipulation of transfer prices.
These are defined as payments deriving from commercial transactions between parts of a single multinational business group, and when they differ from what would be paid for similar operations between independent firms through the operation of market forces (the “arm’s length” or free competition principle), this gap is very likely to conceal an intent to reduce the amount of taxes payable in a particular country. Insofar as these actions cannot be detected and proven by the fiscal authorities, the result is a silent erosion of the tax base and consequent loss of fiscal resources in the country where the subsidiary generating the taxable revenue operates.
Where international trade is concerned, multinationals generally have incentives to overstate the expenses deductible from taxable income to reduce their tax bill. Similarly, a firm may sell goods and services at below market prices to a related entity, thus reducing the base on which corporate income tax is chargeable. Multinationals using this tax planning mechanism carry out multiple transactions in a variety of countries, including tax havens and low-tax jurisdictions, thus reducing the size of the tax base in the place where the income is generated.
There are actually many other ways of shifting profits to subsidiaries in low-tax countries. Firms may opt to locate real activities (employment, assets, production) in these jurisdictions, but they can also use a variety of legal and accounting techniques to switch profits to them. One of these mechanisms of tax evasion via transfer prices is to restructure businesses in ways that usually entail shifting functions, assets and risks between subsidiaries in different countries. In this case, the tax base in a particular country is eroded both because the amount of profits that can be obtained from the main activity conducted within a given territory is limited and because the profits of other local activities are reduced through the deduction of payments to related firms abroad for intra-group services, interest charges or royalties.
Another strategy much used by multinationals, especially manufacturing ones, is to underinvoice exports and overinvoice imports, in both cases with a view to reducing taxable income and also, in some instances, taxes payable on international trade. In both cases, there may be a third country (usually one with low or zero taxation) acting as an intermediary between the related firms, giving rise to trade triangulations that hinder fiscal oversight of these operations. Even imports of capital goods at market prices by one subsidiary from another can generate a loss for the treasury if it allows the amortization of investments that have already been amortized in the country of origin.
121Chapter IIIEconomic Survey of Latin America and the Caribbean • 2016
This does not exhaust the catalogue of aggressive fiscal planning strategies involving transfer prices, and mention may be made of others that are becoming increasingly prevalent, such as providing marketing or logistics services from abroad via a commission agent, making sales from abroad through a marketing company located in a country with low or zero taxation, registering ownership of intangible assets in these same countries (with subsidiaries in higher-tax countries making periodic payments to them to transfer profits) and providing intra-group and business services from headquarters or a third country to subsidiaries.
It has also been shown that the subsidiaries of multinational firms located in low-tax countries declare a profit margin twice as high as the average for their group and pay lower effective tax rates than similar firms operating in only one country. At the same time, the ratio of interest to revenues for the subsidiaries of multinationals located in high-tax countries is practically three times as high as the ratio for the multinational with third parties. All these indicators reveal the scale of base erosion and profit shifting around the world.
In response to this, following the principles and guidelines laid out by OECD, countries have been adopting and refining a number of methods to ensure proper calculation of transfer prices between entities forming part of a single multinational and situated in States or countries with different fiscal regimes, on the supposition that these differences give rise to aggressive fiscal planning manoeuvres and have the effect of eroding a country’s tax base as a result of profits being shifted abroad.
In line with international developments, recent years have seen the gradual introduction in Latin American countries of specific regulations for dealing with transfer prices in order to prevent avoidance manoeuvres. Brazil, Chile and Mexico were the pioneers in the region, introducing provisions of this type in 1996-1997. Argentina, Colombia and Peru also included similar instruments in their tax legislation in the late 1990s and early 2000s. Ecuador, El Salvador, Panama and Uruguay have followed the same path since 2004, with differing degrees of practical implementation. Even so, the variety of situations and methodologies is the most striking feature of the region where the specific treatment of transfer prices is concerned.
Latin American countries generally follow OECD (2010) guidelines when it comes to specific regulations within tax legislation to control the abuse of transfer prices between related firms. An exception is Brazil, which has adopted a fixed margin methodology using the cost plus and resale price approaches. Conversely, a majority of the countries, such as Argentina, Colombia, Ecuador, Mexico, Peru and Uruguay, use different methods simultaneously, including the two above and the comparable uncontrolled price, profit split and transactional net margin approaches (Arias and others, 2010). Most of the countries that have brought in other methods, such as Brazil, Ecuador, Guatemala, Honduras, Peru and Uruguay, have also included the “sixth method” of Argentine legislation for commodity import and export operations.
Given the region’s specific characteristics, the use and abuse of transfer prices is probably one of the main channels (along with exploitation of generous schemes of tax benefits and incentives in some cases) whereby tax bases are eroded in the countries of Latin America. Fortunately, the debate over these issues has gained a degree of prominence among the region’s governments over the last few years, leading to the adoption of a number of decisions and concrete measures aimed at strengthening tax administrations in the areas mentioned.
The region’s countries are also regulating transactions with tax havens, as they entail similar effects in terms of erosion of domestic tax bases. Tax havens and preferential regimes are pernicious, as their deliberate lack of transparency encourages
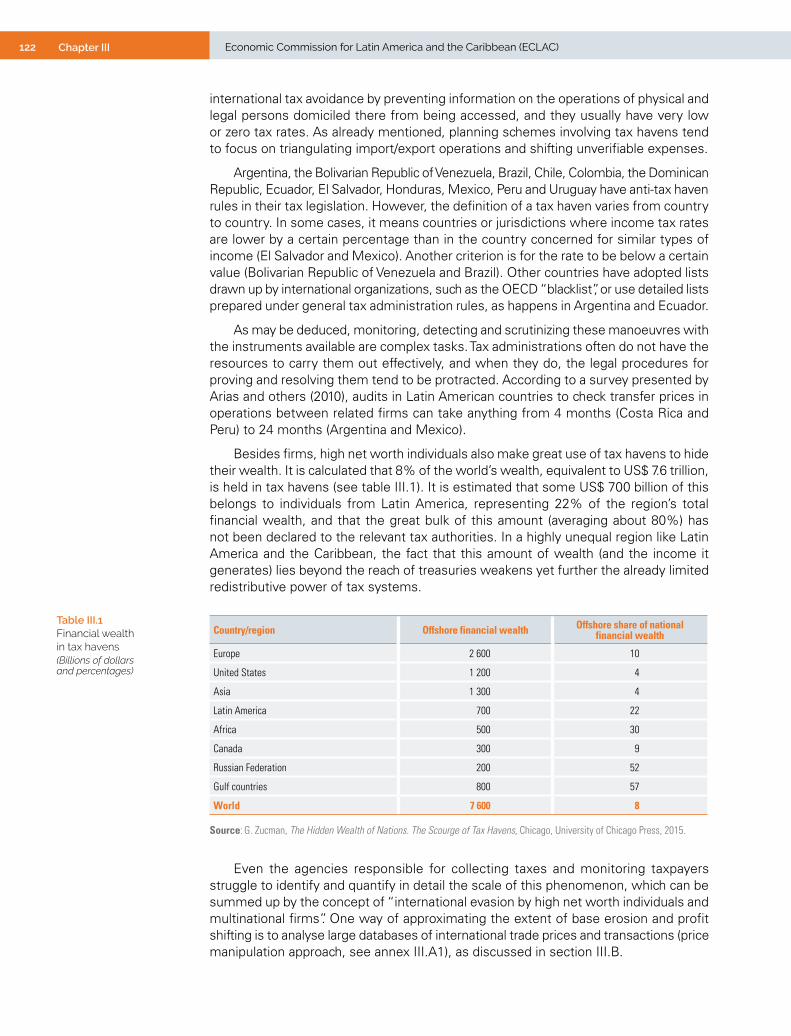
122 Chapter III Economic Commission for Latin America and the Caribbean (ECLAC)
international tax avoidance by preventing information on the operations of physical and legal persons domiciled there from being accessed, and they usually have very low or zero tax rates. As already mentioned, planning schemes involving tax havens tend to focus on triangulating import/export operations and shifting unverifiable expenses.
Argentina, the Bolivarian Republic of Venezuela, Brazil, Chile, Colombia, the Dominican Republic, Ecuador, El Salvador, Honduras, Mexico, Peru and Uruguay have anti-tax haven rules in their tax legislation. However, the definition of a tax haven varies from country to country. In some cases, it means countries or jurisdictions where income tax rates are lower by a certain percentage than in the country concerned for similar types of income (El Salvador and Mexico). Another criterion is for the rate to be below a certain value (Bolivarian Republic of Venezuela and Brazil). Other countries have adopted lists drawn up by international organizations, such as the OECD “blacklist”, or use detailed lists prepared under general tax administration rules, as happens in Argentina and Ecuador.
As may be deduced, monitoring, detecting and scrutinizing these manoeuvres with the instruments available are complex tasks. Tax administrations often do not have the resources to carry them out effectively, and when they do, the legal procedures for proving and resolving them tend to be protracted. According to a survey presented by Arias and others (2010), audits in Latin American countries to check transfer prices in operations between related firms can take anything from 4 months (Costa Rica and Peru) to 24 months (Argentina and Mexico).
Besides firms, high net worth individuals also make great use of tax havens to hide their wealth. It is calculated that 8% of the world’s wealth, equivalent to US$ 7.6 trillion, is held in tax havens (see table III.1). It is estimated that some US$ 700 billion of this belongs to individuals from Latin America, representing 22% of the region’s total financial wealth, and that the great bulk of this amount (averaging about 80%) has not been declared to the relevant tax authorities. In a highly unequal region like Latin America and the Caribbean, the fact that this amount of wealth (and the income it generates) lies beyond the reach of treasuries weakens yet further the already limited redistributive power of tax systems.
Table III.1 Financial wealth in tax havens(Billions of dollars and percentages)
Country/region Offshore financial wealth Offshore share of national financial wealth
Europe 2 600 10
United States 1 200 4
Asia 1 300 4
Latin America 700 22
Africa 500 30
Canada 300 9
Russian Federation 200 52
Gulf countries 800 57
World 7 600 8
Source: G. Zucman, The Hidden Wealth of Nations. The Scourge of Tax Havens, Chicago, University of Chicago Press, 2015.
Even the agencies responsible for collecting taxes and monitoring taxpayers struggle to identify and quantify in detail the scale of this phenomenon, which can be summed up by the concept of “international evasion by high net worth individuals and multinational firms”. One way of approximating the extent of base erosion and profit shifting is to analyse large databases of international trade prices and transactions (price manipulation approach, see annex III.A1), as discussed in section III.B.
123Chapter IIIEconomic Survey of Latin America and the Caribbean • 2016
B. An estimation of tax losses resulting from trade misinvoicing
Illicit financial flows have taken on greater and greater importance in the international debate on development financing, within the framework of the 2030 Agenda for Sustainable Development. This debate has been informed by contributions from both governments and civil society. Of particular note is the work of the High Level Panel on Illicit Financial Flows from Africa convened by the finance ministers of that continent during the joint conference of the African Union and the Economic Commission for Africa (ECA) in 2011. Also prominent has been the role of civil society in generating greater awareness of the phenomenon (Christian Aid, 2009; Tax Justice Network, 2012). In particular, the annual reports by Global Financial Integrity (GFI) on illicit financial flows from developing countries have informed the debate with estimates of tax losses associated with these flows.
The intensification of the international debate on this issue led to the importance of illicit flows being recognized at the Third International Conference on Financing for Development held in Addis Ababa in July 2015. Among the measures it contains, the final summit document establishes the importance of mobilizing domestic resources by widening the tax base, improving collection systems and combating tax evasion and illicit financial flows (United Nations, 2015). Specifically, governments have undertaken to: (i) redouble efforts to substantially reduce illicit financial flows by 2030, with a view to eventually eliminating them, including by combating tax evasion and corruption through strengthened national regulation and increased international cooperation; (ii) invite other regions to carry out exercises similar to the High Level Panel on Illicit Financial Flows from Africa; (iii) invite appropriate international institutions and regional organizations to publish estimates of the volume and composition of illicit financial flows; (iv) strive to eliminate safe havens that create incentives for transfer abroad of stolen assets and international financial flows (United Nations, 2016).
Despite illicit financial flows being put on the international development agenda, their scale and composition are still a matter of intense debate. Because of their nature —they usually take the form of concealed transactions— there is no single measuring methodology and no definitive statistics on their extent. The estimates most often used in the current debate come from Global Financial Integrity and are based on analysis of international trade and balance-of-payments statistics (GFI, 2015). Studies aim to identify trade misinvoicing, that is, the underdeclaration or overdeclaration of imported and exported goods. These distortions may arise in trade transactions both between related firms forming part of a single multinational (through transfer prices) and between independent firms (where there is collusion between the exporter and the importer).
Although the methodology has been refined in recent years, the results do not yield enough detail to identify the key products or the trading partners involved in generating illicit financial flows, which in turn makes specific policies hard to design.
Aware of these shortcomings, the High Level Panel on Illicit Financial Flows from Africa asked ECA to construct regional estimates in order to identify key products and partners (ECA, 2015). This study concluded that illicit flows had increased substantially in recent years and mainly involved transactions with raw materials, chiefly crude oil, minerals and metals. It also highlighted the heavy concentration of flows to a small group of developed countries, plus China and India. The ECA report stresses that trade activities are the main driver of illicit flows from Africa. These findings serve to underpin the recommendations of the High Level Panel, which highlight the need for African countries to address the issues of trade misinvoicing, transfer pricing and base erosion and profit shifting, particularly with regard to the extractive sector.
124 Chapter III Economic Commission for Latin America and the Caribbean (ECLAC)
In this context, it is important to analyse and quantify these flows in the countries of Latin America and the Caribbean, and to identify the sectors generating the greatest flows from trade misinvoicing. The estimates prepared by ECLAC, based on a methodology inspired by that of ECA (see box III.1), represent a lower bound and offer greater insights into the phenomenon.
Box III.1 Methodology note Illicit financial flows are movements from one country to another of money that has been
earned, transferred or used illegally. These funds usually originate in trade activities (falsification of trade invoices and abusive transfer pricing), criminal activities or corruption.a
The estimation of illicit financial flows from the region that is presented here includes gross outflows from misinvoicing of international goods trade transactions. It does not include estimates for trade in services, owing to the lack of available data.b
The export data come from the United Nations Commodity Trade Statistics Database (COMTRADE) and are calculated at the six-digit level of the 1996 Harmonized System (HS6). They are expressed in dollars in free on board (FOB) terms.
The import data come from the International Trade Database (BACI) operated by the Centre for International Prospective Studies and Information (CEPII). They likewise correspond to HS6 and are expressed in dollars in FOB terms, with cost, insurance and freight (CIF) figures being adjusted to FOB prices using an econometric model (Gaulier and Zignago, 2010).
Gross outflows due to trade misinvoicing are calculated in two stages. First, the value of export underinvoicing (ExpDisc) is calculated as the discrepancy between the value of imports recorded in partner countries (j) at the product level (hs6) and the value of exports recorded in the region’s countries (i) at the product level (hs6). Second, the value of import overinvoicing (ImpDisc) is calculated as the discrepancy between the value of imports recorded in the region’s countries (i) at the product level (hs6) and the value of exports recorded in the partner countries (j) at the product level (hs6).
The existence of global value chains creates asymmetries in bilateral statistics on global goods trade (ESCAP, 2016).c These asymmetries result in large discrepancies in international goods trade volumes at the partner and product level. To mitigate this, the discrepancies calculated are weighted by the degree of concordance between the import and export volumes (ImpVol and ExpVol) reported by the two partners.
To make the calculations more manageable, they exclude transactions between countries by product where the discrepancies in value are less than US$ 1 million.
The gross outflows from misinvoicing thus calculated represent a lower bound to the illicit flows from the region.
Source: Economic Commission for Latin America and the Caribbean (ECLAC).a This definition has been adopted in a number of studies. See, for example, those of Global Financial Integrity (GFI) and the High
Level Panel on Illicit Financial Flows from Africa.b Non-inclusion of fraudulent invoicing in international services trade means that illicit financial flows tend to be underestimated,
besides which there are other types of illicit flows that are very hard to estimate because concealment is intrinsic to them, examples being illicit flows deriving from criminal activities such as drug and human trafficking, the illegal arms trade, contraband and any other illicit transaction carried out in cash.
c See [online] http://www.unescap.org/sites/default/files/SD_Working_Paper_April2016_Asymmetries_in_International_Trade_Statistics.pdf.

125Chapter IIIEconomic Survey of Latin America and the Caribbean • 2016
As figure III.1 shows, estimated tax losses in the region resulting from trade misinvoicing were approximately US$ 31 billion in 2013 (0.5 of a percentage point of GDP). This represented between 10% and 15% of the actual corporate income tax take in that year. Potential losses at the country level vary greatly, with illicit outflows estimated to be particularly large in countries such as Costa Rica (mainly involving integrated circuits and electronic microstructures) and Mexico (because the country is highly integrated into value chains in different sectors).
Figure III.1 Latin America and the Caribbean: tax losses associated with trade misinvoicing, 2004-2013(Billions of dollars and percentages of GDP)
0
0.1
0.2
0.3
0.4
0.5
0
5
10
15
20
25
30
35
2004 2005 2006 2007 2008 2009 2010 2011 2012 2013
Tax losses from trade misinvoicing (left scale)
As percentages of GDP (simple averages)
Source: Economic Commission for Latin America and the Caribbean (ECLAC).
A key finding of this analysis is that illicit financial flows have increased sharply in the last decade, with outflows from trade misinvoicing rising by an average of some 9% a year in the Latin America and Caribbean region. These flows averaged 1.8% of regional GDP over the 10 years considered, implying a cumulative total of US$ 765 billion in 2004-2013 (two thirds being due to overinvoicing of imports and a third to underinvoicing of exports). Illicit outflows climbed to US$ 101.6 billion in 2013, the latest year with full information available (see figure III.2).
Figure III.2 Latin America and the Caribbean: estimated value of trade misinvoicing, 2004-2013(Billions of dollars)
54.551.3
55.3
70.4
92.2
63.9
85.3
96.793.5
101.6
0
20
40
60
80
100
120
2004 2005 2006 2007 2008 2009 2010 2011 2012 2013Underinvoicing of exportsOverinvoicing of imports
Source: Economic Commission for Latin America and the Caribbean (ECLAC).

126 Chapter III Economic Commission for Latin America and the Caribbean (ECLAC)
Illicit flows are distributed unevenly between the Latin American and Caribbean countries, as they tend to be concentrated in the region’s largest economies (see figure III.3). The exception is Costa Rica, which produces a little under 1% of the region’s GDP, but ranks third in the region for the volume of illicit outflows, with almost 8% of the total. Mexico was in first place in 2013 with US$ 48 billion, followed by Brazil with some US$ 18 billion. These figures indicate that the two countries generated roughly 48% and 18%, respectively, of all trade misinvoicing outflows from the region. After these three countries came Chile, Argentina and Colombia, accounting for between 7% and 3% of the regional total.
Figure III.3 Latin America and the Caribbean: estimated value of international goods trade price manipulation, by country, 2013(Billions of dollars and percentages of GDP)
15172385911571711762673295045957151.0961.2721.9982.4622.8693.259
4.7166.8307.773
17.83048.314
0 10 000 20 000 30 000 40 000 50 000 60 000
BelizeAntigua and Barbuda
BarbadosSurinameBahamas
GuyanaJamaicaPanama
NicaraguaUruguay
Bolivia (Plur. State of)Paraguay
El SalvadorDominican Rep.
GuatemalaEcuador
Venezuela (Bol. Rep. of)Peru
ColombiaArgentina
ChileCosta Rica
BrazilMexico
0.40.50.60.60.70.80.90.91.11.21.41.41.61.61.71.82.12.12.42.52.52.9
3.85.3
3.4 12.4
0 5 10 15 20
PanamaBarbadosUruguay
Venezuela (Bol. Rep. of)Brazil
ArgentinaColombia
BelizeBahamasJamaica
PeruAntigua and Barbuda
Latin America and the CaribbeanBolivia (Plur. State of)
SurinameDominican Rep.
ParaguayEcuador
GuatemalaNicaragua
ChileEl Salvador
MexicoGuyana
Costa Rica Semiconductors
A. Billions of dollars B. Percentages of GDP
Source: Economic Commission for Latin America and the Caribbean (ECLAC).
When these illicit financial flows are measured as a share of GDP in each country, a number of Central American economies come out near the top of the ranking. Costa Rica was an outlier at 15% of GDP, but these illicit flows were also significant in El Salvador, Guatemala and Nicaragua, with values of some 2.5% of GDP or more. In Guyana and Mexico, illicit capital outflows represented 5.3% and 3.8% of GDP, respectively, in 2013.
In the cases of Costa Rica and Mexico, the large scale of illicit financial outflows is related to these countries’ participation in global value chains (such as the production of semiconductors in the former and of electrical machinery and motor vehicles in the latter), where related party transactions are very substantial, as analysed in box III.2. In general, the findings underline the very large part played by intra-firm transactions in capital outflows. The products generating the largest discrepancies tend to be traded between entities in the same firm.
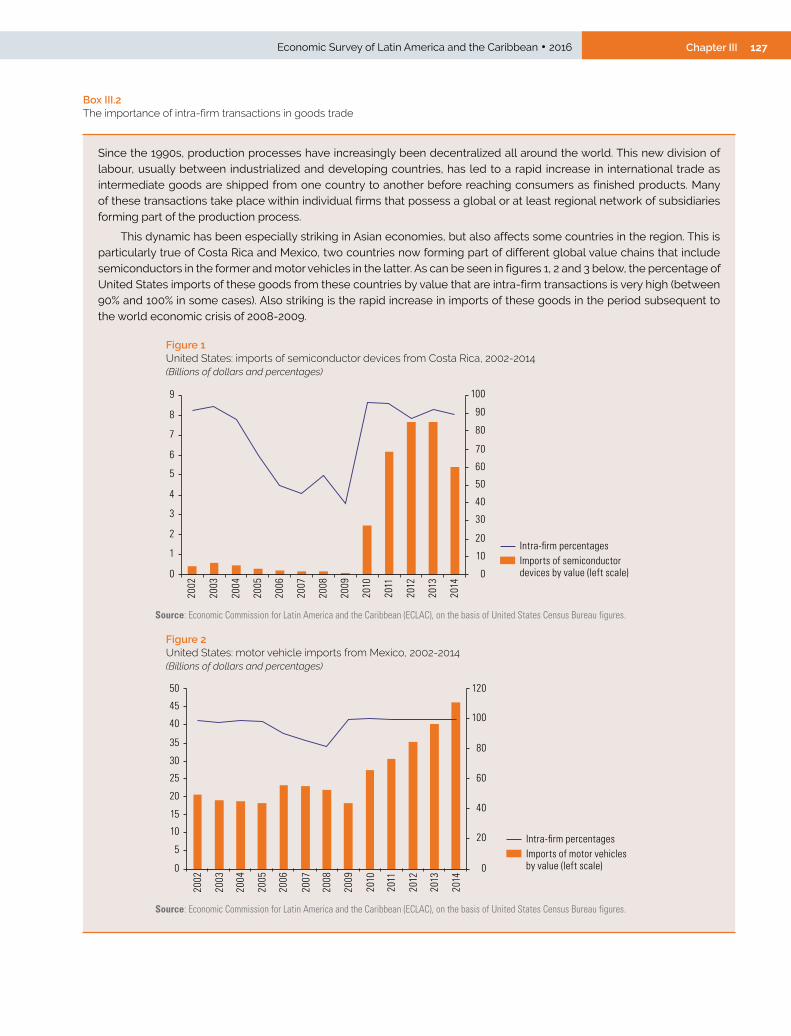
127Chapter IIIEconomic Survey of Latin America and the Caribbean • 2016
Since the 1990s, production processes have increasingly been decentralized all around the world. This new division of labour, usually between industrialized and developing countries, has led to a rapid increase in international trade as intermediate goods are shipped from one country to another before reaching consumers as finished products. Many of these transactions take place within individual firms that possess a global or at least regional network of subsidiaries forming part of the production process.
This dynamic has been especially striking in Asian economies, but also affects some countries in the region. This is particularly true of Costa Rica and Mexico, two countries now forming part of different global value chains that include semiconductors in the former and motor vehicles in the latter. As can be seen in figures 1, 2 and 3 below, the percentage of United States imports of these goods from these countries by value that are intra-firm transactions is very high (between 90% and 100% in some cases). Also striking is the rapid increase in imports of these goods in the period subsequent to the world economic crisis of 2008-2009.
Figure 1 United States: imports of semiconductor devices from Costa Rica, 2002-2014(Billions of dollars and percentages)
0
1
2
3
4
5
6
7
8
9
2002
2003
2004
2005
2006
2007
2008
2009
2010
2011
2012
2013
2014
0
10
20
30
40
50
60
70
80
90
100
Imports of semiconductor devices by value (left scale)
Intra-firm percentages
Source: Economic Commission for Latin America and the Caribbean (ECLAC), on the basis of United States Census Bureau figures.
Figure 2 United States: motor vehicle imports from Mexico, 2002-2014(Billions of dollars and percentages)
2002
2003
2004
2005
2006
2007
2008
2009
2010
2011
2012
2013
2014
Imports of motor vehicles by value (left scale)
Intra-firm percentages
00
20
40
60
80
100
120
5
10
15
20
25
30
35
40
45
50
Source: Economic Commission for Latin America and the Caribbean (ECLAC), on the basis of United States Census Bureau figures.
Box III.2 The importance of intra-firm transactions in goods trade

128 Chapter III Economic Commission for Latin America and the Caribbean (ECLAC)
Figure 3 United States: imports of motor vehicle parts from Mexico, 2002-2014(Billions of dollars and percentages)
2002
2003
2004
2005
2006
2007
2008
2009
2010
2011
2012
2013
2014
Imports of motor vehicle parts by value (left scale)
Intra-firm percentages
58
60
62
64
66
68
70
72
5
10
15
20
25
30
35
40
45
0
Source: Economic Commission for Latin America and the Caribbean (ECLAC), on the basis of United States Census Bureau figures.
Source: Economic Commission for Latin America and the Caribbean (ECLAC).
The great bulk of the illicit financial flows estimated derive from transactions with the United States (38% of cumulative flows between 2004 and 2013) and China (19% of the cumulative total). In this 10-year period, the United States received about US$ 292 billion in illicit financial flows from Latin America and the Caribbean, while the largest emerging economy received about US$ 147 billion (see figure III.4). Other countries numbering among the 10 largest recipients of trade misinvoicing flows from the region are Japan, the Republic of Korea, Germany, Canada, Italy and France. However, not all illicit financial flows end up outside the region, since both Mexico and Brazil have received substantial sums from their neighbours, with Mexico taking in US$ 17 billion in illicit flows from other Latin American and Caribbean countries and Brazil US$ 12.5 billion during the decade analysed.
Box III.2 (concluded)
Figure III.4 Latin America and the Caribbean: estimated cumulative value of international goods trade price manipulation, by partner, 2004-2013(Billions of dollars)
11.4
12.5
12.9
17.1
27.0
27.9
30.8
35.3
147.1
292.2
0 50 100 150 200 250 300 350
France
Brazil
Italy
Mexico
Canada
Germany
Rep. of Korea
Japan
China
United States
Source: Economic Commission for Latin America and the Caribbean (ECLAC).
These capital outflows are largely confined not just to a small number of trading partners, but to certain product categories strongly associated with global production chains. By contrast with the situation in African countries, where most illicit flows come

129Chapter IIIEconomic Survey of Latin America and the Caribbean • 2016
from extractive industries (especially oil, precious metals and minerals), the bulk of illicit financial flows identified at the product level in Latin America and the Caribbean originate from the manufacturing sector, particularly the electronics and automotive industries (ECA, 2015). This difference is connected to the production structure and degree of diversification of exports on each continent.
The greatest losses from illicit financial outflows in the region during the 2004-2013 period were in two sectors, namely electrical machinery (including computers) and nuclear reactors, boilers, machinery, etc. (including integrated circuits). These sectors generated just over 40% of total flows, i.e., a cumulative total of US$ 310 billion in 10 years (see figure III.5). In the last-mentioned sector in particular, there has been very significant growth in integrated circuits and electronic microstructures and parts thereof, especially since 2010. Also striking is the increase of illicit flows in operations related to electrical telephony apparatus and parts for radiotelephony, radiotelegraphy, radio broadcasting or television.
Figure III.5 Latin America and the Caribbean: estimated cumulative value of international goods trade price manipulation, 2004-2013, by two-digit product groups in the Harmonized System(Billions of dollars)
15.5
16.9
20.0
24.0
24.4
27.3
63.3
64.7
130.0
179.9
0 20 40 60 80 100 120 140 160 180 200
Organic chemicals
Articles of iron or steel
Ores, slag and ash
Plastics and articles thereof
Optical, photographic, cinematographic, measuring,etc., and medical or surgical apparatus and parts
Pharmaceutical products
Mineral fuels and oils and distillation products;bituminous substances; mineral waxes
Motor vehicles, tractors, cycles and other land vehiclesand parts and accessories
Nuclear reactors, boilers, machinery and mechanicalappliances and parts
Electrical machinery, sound and television imageequipment, parts and accessories
Source: Economic Commission for Latin America and the Caribbean (ECLAC).
Trade misinvoicing of automobiles and other land vehicles (together with their parts and accessories) was worth close to US$ 65 billion in the period between 2004 and 2013, equivalent to 8% of illicit outflows from the region. The group comprising mineral fuels, mineral oils and products of their distillation accounted for the same percentage share, with an amount of US$ 63 billion.
Other products among the 10 generating the greatest illicit flows include: pharmaceutical products (4% of the total), photographic, cinematographic and medical instruments and apparatus (3%), plastics and articles thereof (3%), non-metallic minerals (2.6%), articles of iron or steel (2%) and organic chemicals (2%). In the specific case of pharmaceuticals, there has been significant and steady growth of illicit outflows in transactions connected with medicines that are pre-measured or packaged for retail. This growing trend is also very apparent in the trade in medical, surgical and dental instruments and apparatus and the like.

130 Chapter III Economic Commission for Latin America and the Caribbean (ECLAC)
Although illicit financial flows deriving from non-renewable natural resource-related transactions are smaller, they did total a cumulative US$ 131.5 billion or so in 2004-2013. Besides the mineral fuels and oils, non-metallic minerals and iron and steel articles mentioned earlier, there are other activities that give rise to illicit capital outflows in the non-renewable commodities sector, with amounts in some cases ranging from US$ 5.2 billion to US$ 12.2 billion, such as iron and steel smelting, production of copper, aluminium and articles thereof, and pearls and precious stones and metals and the like (see figure III.6).
A portion of gross capital outflows in the non-renewable commodities sector is accounted for by overinvoicing of imports, with a higher value being declared for imports than are reported by the exporting partners, generating illicit capital outflows. This is seen especially in the cases of oil, iron, steel and aluminium (although undervaluation of exports is also important for the first of these). The opposite is true of minerals, copper and precious metals: there is a greater proportion of export underinvoicing, potentially reducing the income reported in the country exporting these non-renewable resources.
There is evidence that these methodologies are underestimating illicit flows, as they do not capture cases where both the country in the region and its trading partner report a below- or above-market price for a given product. Results from other methodologies suggest that capital losses from underinvoicing of mineral and metal exports could be large. The abuse of transfer prices in related party transactions, for instance, is well documented. This is when transactions between related firms, especially within multinationals, are priced differently from similar operations conducted between independent firms under market conditions.
Figure III.6 Latin America and the Caribbean: estimated cumulative value of price manipulation for non-renewable natural resource-related goods, by product groups at the two-digit level of the Harmonized System and transaction type, 2004-2013(Billions of dollars)
0 10 20 30 40 50 60 70
Lead and articles thereof
Zinc and articles thereof
Nickel and articles thereof
Aluminium and articles thereof
Pearls, precious stones and metals and articles thereof; imitation jewellery; coin
Copper and articles thereof
Iron and steel
Articles of iron or steel
Ores, slag and ash
Mineral fuels and oils and distillation products; bituminous substances; mineral waxes
Underinvoicing of exports
Overinvoicing of imports
Source: Economic Commission for Latin America and the Caribbean (ECLAC).
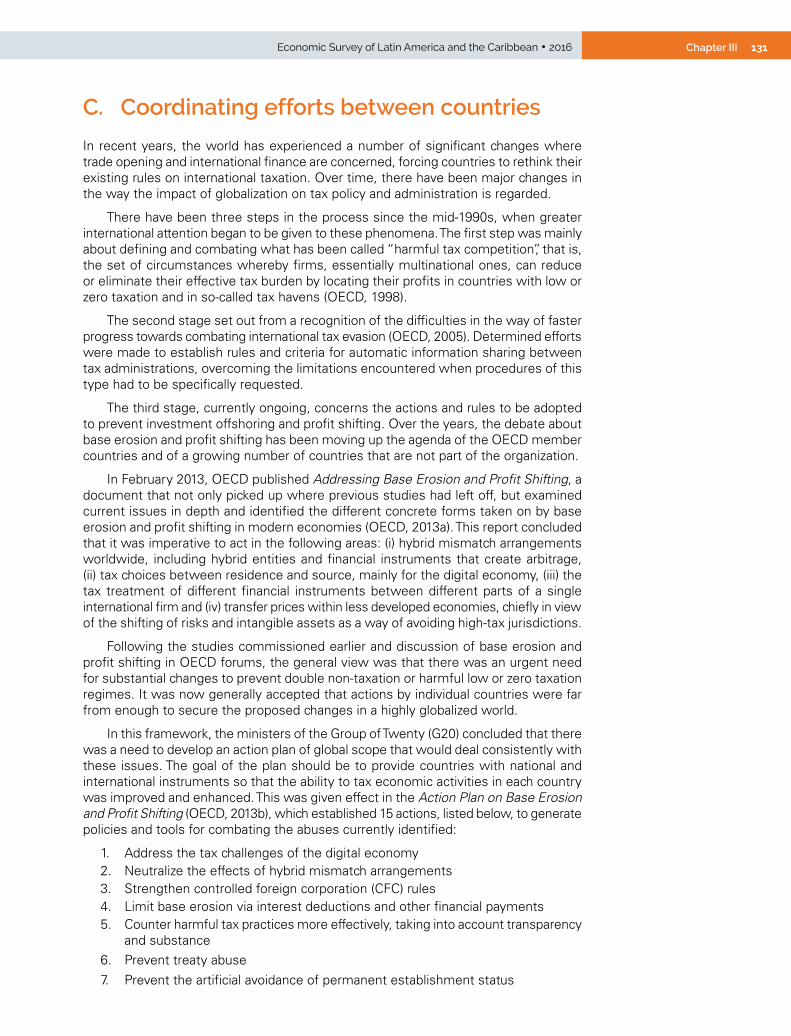
131Chapter IIIEconomic Survey of Latin America and the Caribbean • 2016
C. Coordinating efforts between countries
In recent years, the world has experienced a number of significant changes where trade opening and international finance are concerned, forcing countries to rethink their existing rules on international taxation. Over time, there have been major changes in the way the impact of globalization on tax policy and administration is regarded.
There have been three steps in the process since the mid-1990s, when greater international attention began to be given to these phenomena. The first step was mainly about defining and combating what has been called “harmful tax competition”, that is, the set of circumstances whereby firms, essentially multinational ones, can reduce or eliminate their effective tax burden by locating their profits in countries with low or zero taxation and in so-called tax havens (OECD, 1998).
The second stage set out from a recognition of the difficulties in the way of faster progress towards combating international tax evasion (OECD, 2005). Determined efforts were made to establish rules and criteria for automatic information sharing between tax administrations, overcoming the limitations encountered when procedures of this type had to be specifically requested.
The third stage, currently ongoing, concerns the actions and rules to be adopted to prevent investment offshoring and profit shifting. Over the years, the debate about base erosion and profit shifting has been moving up the agenda of the OECD member countries and of a growing number of countries that are not part of the organization.
In February 2013, OECD published Addressing Base Erosion and Profit Shifting, a document that not only picked up where previous studies had left off, but examined current issues in depth and identified the different concrete forms taken on by base erosion and profit shifting in modern economies (OECD, 2013a). This report concluded that it was imperative to act in the following areas: (i) hybrid mismatch arrangements worldwide, including hybrid entities and financial instruments that create arbitrage, (ii) tax choices between residence and source, mainly for the digital economy, (iii) the tax treatment of different financial instruments between different parts of a single international firm and (iv) transfer prices within less developed economies, chiefly in view of the shifting of risks and intangible assets as a way of avoiding high-tax jurisdictions.
Following the studies commissioned earlier and discussion of base erosion and profit shifting in OECD forums, the general view was that there was an urgent need for substantial changes to prevent double non-taxation or harmful low or zero taxation regimes. It was now generally accepted that actions by individual countries were far from enough to secure the proposed changes in a highly globalized world.
In this framework, the ministers of the Group of Twenty (G20) concluded that there was a need to develop an action plan of global scope that would deal consistently with these issues. The goal of the plan should be to provide countries with national and international instruments so that the ability to tax economic activities in each country was improved and enhanced. This was given effect in the Action Plan on Base Erosion and Profit Shifting (OECD, 2013b), which established 15 actions, listed below, to generate policies and tools for combating the abuses currently identified:
1. Address the tax challenges of the digital economy2. Neutralize the effects of hybrid mismatch arrangements3. Strengthen controlled foreign corporation (CFC) rules4. Limit base erosion via interest deductions and other financial payments5. Counter harmful tax practices more effectively, taking into account transparency
and substance6. Prevent treaty abuse7. Prevent the artificial avoidance of permanent establishment status

132 Chapter III Economic Commission for Latin America and the Caribbean (ECLAC)
8. Assure that transfer pricing outcomes are in line with value creation (intangibles)9. Assure that transfer pricing outcomes are in line with value creation (risks and capital)10. Assure that transfer pricing outcomes are in line with value creation (other
high-risk transactions)11. Establish methodologies to collect and analyse data on base erosion and profit
shifting and the actions to address it12. Require taxpayers to disclose their aggressive tax planning arrangements13. Re-examine transfer pricing documentation14. Make dispute resolution mechanisms more effective15. Develop a multilateral instrument
More recently, although the initiative of addressing the issue in the OECD and G20 framework came from the finance ministers of the member countries, it has been emphasized that tax erosion is not a phenomenon exclusive to the developed world. Nonetheless, the different forms taken by base erosion and profit shifting strategies in a highly globalized world mean that the nature of the problem is very different in economies with dissimilar characteristics. The Action Plan itself constantly stresses the need for the most global approach possible so that harmful fiscal practices can be attacked more effectively, in recognition of the limited ability of countries to act alone and independently.
Given the importance of including developing countries in the debate on base erosion and profit shifting, the G20 finance ministers asked OECD to address the issue with a view to opening up a new channel of dialogue with these countries and thus engaging them in the base erosion and profit shifting project. This new channel of dialogue relies on three fundamental planks:
(i) The direct involvement of developing countries in the activities of the OECD Committee on Fiscal Affairs (CFA) and its subsidiary bodies.
(ii) The creation of regional networks that bring together those responsible for tax policy and administration.
(iii) Support for training in countries’ tax administrations, with the involvement of the Inter-American Centre of Tax Administrations (CIAT) being particularly important for Latin America.
In the first place, OECD has considered it necessary to invite a number of developing countries, representing different regions and income levels, to attend the meetings of CFA, the high level body for the base erosion and profit shifting project. Some regional organizations such as the African Tax Administration Forum (ATAF) and CIAT have also been invited, while the International Monetary Fund (IMF), the World Bank and the United Nations are already part of the initiative.
Second, alongside the regional consultations that have been going on since 2014, processes of ongoing dialogue about regional networks of tax policy and administration officials have continued to be created. The countries participating in the base erosion and profit shifting project will play a fundamental role by acting as a channel into the project itself, transmitting the questions and comments raised by their regional peers.
Lastly, support for capacity-building in lower-income countries in areas covered by the base erosion and profit shifting project will be crucial. The regional networks referred to will play a key role in implementing the proposals put forward within the project framework, turning each of them into a different forum. In this context, the Development Working Group asked OECD to illustrate the experiences of developing countries. Thus, a year after publication of the Action Plan, between July and August 2014, OECD presented the full report addressing the issue (OECD, 2014a and 2014b).
One of the main aspects highlighted in the report is that developing countries tend to encounter obstacles to effective action on base erosion and profit shifting. Particular attention is drawn to:

133Chapter IIIEconomic Survey of Latin America and the Caribbean • 2016
• Gaps in the legislation and information needed to deal with base erosion and profit shifting.
• Difficulty creating the capacity to implement complex measures and deal with multinational firms, which have a great deal of expertise.
• Both (a) and (b) can potentially result in more aggressive tax avoidance than is usual in developed countries.
Meanwhile, developing countries and international organizations have identified the following as the main problems with the base erosion and profit shifting initiative:
• base erosion caused by excessive payments to foreign subsidiaries by way of interest, service charges, and payments and royalties for technical management;
• profit shifting through supply chain restructuring that reallocates risks and the associated profits to subsidiaries in low-tax jurisdictions;
• significant difficulties in obtaining the data needed to address the problems of base erosion and profit shifting and applying their respective transfer price rules;
• fiscal losses resulting from the techniques used to avoid tax on sales of assets located in developing countries;
• pressures in developing countries to attract investment through tax breaks, which can erode the tax base of these economies in exchange for benefits that are difficult to quantify.
Although tax composition varies greatly among medium-low- and low-income countries, the fact is that some depend substantially on tax revenues from multinationals, usually deriving from the exploitation of their natural resources. For these economies, then, it is essential to be able to tax all profits generated by firms of this type. In any event, the impact of base erosion and profit shifting in developing countries extends beyond the revenue generated by multinationals, as local firms and individual taxpayers are typically discouraged from cooperating with the tax system if more sophisticated corporations are avoiding their tax liabilities.
Lastly, in October 2015, OECD presented its definitive package of measures for conducting a comprehensive, coherent and coordinated reform of international tax rules with a view to counteracting the phenomenon of base erosion and profit shifting on the basis of the 15 actions laid down in the Action Plan of the OECD/G20 Project. Among other measures, this package includes new minimum standards laying down country by country reporting requirements that, for the first time, will give tax administrations an overview of multinational firms’ operations; prevention of treaty abuse (seeking out the most favourable agreement) to eradicate the use of investment channelling companies; limitation of harmful tax practices, mainly in the sphere of intellectual property and via automatic sharing of certain decisions or agreements between the administration and taxpayers; and effective mutual agreement procedures, to ensure that efforts to combat double non-taxation do not give rise to situations of double taxation.
Great progress on information-sharing between countries has already been consolidated. So far, over 90 countries have undertaken to adopt the Standard for Automatic Exchange of Financial Account Information, also known as the Common Reporting Standard (CRS), whose aim is to facilitate the automatic exchange of financial information between governments. This instrument came into force in most countries on 1 January 2016 (with the first annual report due in 2017 for that calendar year).
Given the scale of the project, while the CRS does allow bilateral information-sharing arrangements to be made, priority has also been given to adapting the international legal framework by means of a multilateral instrument allowing for cost savings and greater homogeneity. In 2014, accordingly, 51 countries signed the Multilateral Competent Authority Agreement, a vital milestone in international cooperation on joint actions to combat tax evasion. In the last year, a number of other countries, including Chile and Costa Rica, have been added to the list of signatory jurisdictions, bringing the number

134 Chapter III Economic Commission for Latin America and the Caribbean (ECLAC)
up to the current 74 countries. They have all undertaken to implement automatic financial information-sharing from late 2017 or 2018.1
In the context of the discussion presented so far, mention should be made of the effort to incorporate the region’s countries into the debate. In February 2015, the Regional Meeting on the Base Erosion and Profit Shifting Project in Latin America and the Caribbean was held in Lima, centring on the following priority areas and their respective lines of action:
• Transfer price and revenue recharacterization risks: the countries stressed that more and better information was needed for transfer price audits and requested technical assistance to acquire the necessary skills and capabilities.
• Operations with raw materials: much of the debate turned on the particular experiences of some administrations in applying what has come to be called the “sixth method” (the method used to determine transfer prices, special measures and anti-abuse rules, among others) and approaches for dealing effectively with the problem. Specifically, observations and comments centred on the need for orientation and clear guidelines on: (i) the use of clearly defined methods so that appropriate transfer prices could be set and (ii) the data to be considered in calculating transfer prices to prevent multinationals from resorting to arbitrage. The importance of these issues for the whole region was made clear.
• Documentation on transfer prices and country by country reporting: the participants emphasized the need for tax administrations to have access to these documents.
• Automatic information exchange: the countries showed great interest in designing appropriate mechanisms for sharing information and expressed concern about whether they possessed the administrative skills and capabilities needed to meet standards.
Because of emerging countries’ institutional weaknesses and limited direct involvement in the base erosion and profit shifting process, much scepticism has been expressed about the usefulness of the exercise. The process is perceived as a unilateral and highly complicated package of recommendations for international fiscal rules that will not put an end to global tax evasion (which is now organized as an “industry” or structured system of aggressive planning), does not address the share-out of fiscal sovereignty over taxes or urgently needed tax harmonization measures, and will not end the “race to the bottom”, as countries are continuing to practise tax competition. This means that corporate income tax, with all its many exemptions and benefits, will continue to be eroded, undermining fiscal revenues worldwide (Barreix, Roca and Velayos, 2016).
In summary, there is clearly a need in the current international context to enhance international mechanisms for cooperation between countries and regional blocs, to which end multilateral organizations can provide spaces where agreements and consensus can be reached. The central goal is for these to create conditions of viability for progressive tax coordination and harmonization regionally and internationally, especially between the countries of Latin America and the Caribbean, rather than being confined merely to bilateral negotiations.
Cooperation from international organizations is highly beneficial for the countries of Latin America and the Caribbean in this area. ECLAC and CIAT have the necessary technical capabilities and great potential for cooperating actively with the region’s countries by making available the knowledge and information they are constantly producing on tax policy and administration trends, the behaviour of trade and foreign direct investment (FDI) flows and the workings and operation of multinational firms in the region.
1 The technical aspects and the list of countries involved can be consulted on the OECD website [online] http://www.oecd.org/tax/automatic-exchange/.

135Chapter IIIEconomic Survey of Latin America and the Caribbean • 2016
BibliographyArias, I. and others (2010), “Estudio comparado sobre la situación actual de las legislaciones
sobre precios de transferencia en Latinoamérica”, Documento de Trabajo, No. 1-2010, Inter-American Center of Tax Administrations (CIAT).
Barreix, A., J. Roca and F. Velayos (2016), “Breve historia de la transparencia tributaria”, Documento para Discusión, No. IDB-DP-453 [online] https://publications.iadb.org/bitstream/handle/11319/7670/Breve-historia-de-la-transparencia-tributaria.pdf?sequence=1.
Christian Aid (2009), False Profits: Robbing the Poor to Keep the Rich Tax-Free, London [online] https://www.christianaid.org.uk/Images/false-profits.pdf.
ECA (Economic Commission for Africa) (2015), Illicit Financial Flow: Report of the High Level Panel on Illicit Financial Flows from Africa, Addis Ababa.
ESCAP (Economic and Social Commission for Asia and the Pacific) (2016), “Asymmetries in international merchandise trade statistics: a case study of selected countries in Asia-Pacific”, Working Paper, No. SD/WP/02 [online] http://www.unescap.org/sites/default/files/SD_Working_Paper_April2016_Asymmetries_in_International_Trade_Statistics.pdf.
Fuest, C. and N. Riedel (2012), “Tax evasion and tax avoidance: the role of international profit shifting”, Draining Development? Controlling Flows of Illicit Funds from Developing Countries, P. Reuter (ed.), Washington, D.C., World Bank.
Gaulier, G. and S. Zignago (2010), “BACI: International Trade Database at the Product-Level. The 1994-2007 Version”, CEPII Working Papers, No. 2010-23.
GFI (Global Financial Integrity) (2015), Illicit Financial Flows from Developing Countries: 2004-2013, Washington, D.C., December.
Gómez Sabaíni, J.C. and D. Morán (2016), “Evasión tributaria en América Latina: nuevos y antiguos desafíos de la cuantificación del fenómeno en los países de la región”, Macroeconomía del Desarrollo series, No. 172 (LC/L.4155), Santiago, Economic Commission for Latin America and the Caribbean (ECLAC).
(2014), “Tax policy in Latin America: assessment and guidelines for a second generation of reforms, Macroeconomía del Desarrollo series, No. 133 (LC/L.3632), Santiago, Economic Commission for Latin America and the Caribbean (ECLAC).
Keejae, H., H. Pak and J. Pak (2014), “Measuring abnormal pricing – an alternative approach”, Journal of Money Laundering Control, vol. 17, No. 2.
OECD (Organization for Economic Cooperation and Development) (2015), Measuring and Monitoring BEPS. ACTION 11: 2015 Final Report. OECD/G20 Base Erosion and Profit Shifting Project (BEPS), Paris, OECD Publishing.(2014a), Part 1 of a Report to G20 Development Working Group on the Impact of BEPS in Low Income Countries, Paris, OECD Publishing.(2014b), Part 2 of a Report to G20 Development Working Group on the Impact of BEPS in Low Income Countries, Paris, OECD Publishing.(2013a), Addressing Base Erosion and Profit Shifting, Paris, OECD Publishing.(2013b), Action Plan on Base Erosion and Profit Shifting, Paris, OECD Publishing.(2010), Transfer Pricing Guidelines for Multinational Enterprises and Tax Administrations, Paris, OECD Publishing.(2005), Enabling Effective Exchange of Information: Availability and Reliability Standard. Joint Ad Hoc Group on Accounts (JAHGA), Paris, OECD Publishing.(1998), Harmful Tax Competition an Emerging Global Issue, Paris.
Tax Justice Network (2012), The Price of Offshore Revisted [online] http://www.taxjustice.net/cms/upload/pdf/Price_of_Offshore_Revisited_120722.pdf.
UNCTAD (United Nations Conference on Trade and Development) (2015), “An FDI-driven approach to measuring the scale and economic impact of BEPS. Annex II”, World Investment Report, 2015. Reforming International Investment Governance (UNCTAD/WIR/2015), Geneva.
United Nations (2016), Addis Ababa Action Agenda Monitoring commitments and actions. Inaugural Report 2016. Inter-agency Task Force on Financing for Development, New York.(2015), “Addis Ababa Action Agenda of the Third International Conference on Financing for Development” (A/RES/69/313), New York.
Zucman, G. (2015), The Hidden Wealth of Nations. The Scourge of Tax Havens, Chicago, University of Chicago Press.

136 Chapter III Economic Commission for Latin America and the Caribbean (ECLAC)
Annex III.A1
Methods of estimating tax losses resulting from aggressive fiscal planning.2
In any attempt to estimate the amount of fiscal resources foregone because of aggressive fiscal planning manoeuvres, it must be assumed that tax administrations normally require multinationals to submit periodic, detailed reports on their operations and transactions, both with related firms and with outside companies. Accordingly, it is generally accepted that these agencies have the most accurate information for detecting abusive price manipulation and exploitation of differences between countries in respect of rates, the types of income taxed, the tax treatment of alternative financing sources and other aspects of current tax systems.
Consequently, the first methodological option (the auditing approach) consists in conducting selective audits that compare the fiscal information declared by firms and the specific information revealed by their accounting reports in order to detect specific instances, for example, of deliberate transfer price manipulation between related firms.
When it comes to conducting these tasks effectively, of course, not all tax administrations have the same capabilities and financial, human and physical resources, and unfortunately the results of these audits, and particularly the amounts of fiscal revenue recovered, are rarely released. One exception to the rule in Latin America has been the National Tax and Customs Administration (SUNAT) of Peru, which has disclosed that audits of 187 reviewed cases were conducted in 2013, with undeclared income being calculated at US$ 350 million, equating to a total loss of corporate income tax revenues of some US$ 105 million.
A second methodological approach is one where the tax authority commissions an outside agent (a consultant or organization specializing in international taxation) to estimate the fiscal impact (tax loss) entailed by these manoeuvres in different sectors of a country’s economy and in the aggregate (sectoral approach). For this, the authorities need to provide specific fiscal information at the individual firm level that can be used to calculate the gap between the tax that firms, previously sorted by sector of economic activity, theoretically ought to have paid (assuming different propensities to manipulate transfer prices) and the amount actually paid.
However, the general perception of an overall intensification in the use of a variety of aggressive tax planning mechanisms by multinational firms, usually following costly audits and protracted legal disputes, has resulted in a growing need to quantify the scale of these phenomena internationally. A number of empirical studies of the issue have been carried out over the past 15 years. From different perspectives, and with an awareness of the difficulties entailed, these have set out to measure the distortions generated by these types of behaviour in the “normal” operations of multinational firms and, much more importantly, the losses of tax resources they imply. Studies of this kind, originating outside tax administrations, differ in their methodology in light of the scope of the results of the estimations carried out (see table III.A1.1).
Academic studies have also focused on the concept of profit shifting, seeking to identify a hypothetical distribution of revenues generated by a multinational firm across its different subsidiaries in the absence of manoeuvres to transfer income to low-tax countries (profitability approach). These studies have concentrated specifically on the factors that might induce this behaviour by multinationals and sought to explore whether they affect the distribution of the revenues reported across the different locations from which their subsidiaries operate and, if so, to determine the scale of these effects.
2 See Gómez Sabaíni and Morán (2016) for further information.
137Chapter IIIEconomic Survey of Latin America and the Caribbean • 2016
Empirical studies based on this approach have provided estimates of the (marginal) impact of differences in taxation levels on corporate profit-shifting behaviour. Many of these studies have used sophisticated econometric methods and data in which foreign investment flows or some profitability-based measure act as an independent variable, yielding valuable knowledge of these phenomena in particular cases. Unfortunately, few of these studies have included developing countries, the main reason being that they have considerably less systematized firm-level information available.
Origin of estimates
Tax administration Outside studies
Scop
e
Micro
Audit approachSelective application of transfer price methods (arm’s length principle) to transactions by large firms with global scope.
Profitability approachEconometric analyses seeking to use specific firm-level data to identify signs of income shifting between countries with different tax levels.
Macro
Sectoral approachCalculation of gaps between observed data and theoretical values by applying benchmark indicators for each economic sector.
Price manipulation approachConstruction of a price filtering matrix to detect prices that fall outside a “normal” range in international trade operations.
Source: J.C. Gómez Sabaíni and D. Morán, “Evasión tributaria en América Latina: nuevos y antiguos desafíos de la cuantificación del fenómeno en los países de la región”, Macroeconomía del Desarrollo series, No. 172 (LC/L.4155), Santiago, Economic Commission for Latin America and the Caribbean (ECLAC), 2016.
Also originating in academic studies, but quickly adopted and disseminated by some non-governmental organizations, the other main methodological approach for approximating the scale of base erosion and profit shifting is one that relies on the analysis of large international trade price and transaction databases (price manipulation approach).
The aim of this research is to calculate price manipulation in trade operations, i.e., under- or overdeclaration of imported and exported goods for the clear purpose of shifting profits between different jurisdictions in light of differences in rates of corporate income tax, international trade taxes, currency restrictions and other factors. According to these studies, distortions can arise in trade operations both between related firms forming part of the same multinational (through transfer prices) and between independent firms (where there is collusion between exporters and importers).
This methodology based on comparing international prices has advantages and drawbacks. On the one hand, it is acknowledged to be an effective and low-cost procedure for detecting import and export operations involving prices outside the normal ranges and a high likelihood of manipulation. Because they use data in the public domain, the results of these studies are easy to replicate.
However, this methodology has been subject to a number of criticisms that generally undermine confidence in its results. Besides the large amounts of information required, it has been found to have a number of technical weaknesses, most of them associated with the assumptions used, the difficulty of interpreting the results and a lack of precision when it comes to policy recommendations. It has often been found that the shifts detected could very well be due to reasonable differences in comparability or variations in the quality of the products traded, or could simply reflect transfers of assets, functions and risks between subsidiaries of the same firm. Indeed, these studies do not even distinguish between transactions involving related and outside firms. What is more, most of them seem to overestimate the tax revenue forfeited, as they take legal tax rates as their benchmark, without considering tax incentives and other legal mechanisms that reduce effective tax rates.
Table III.A1.1 Methodological approaches used to quantify international revenue shifting
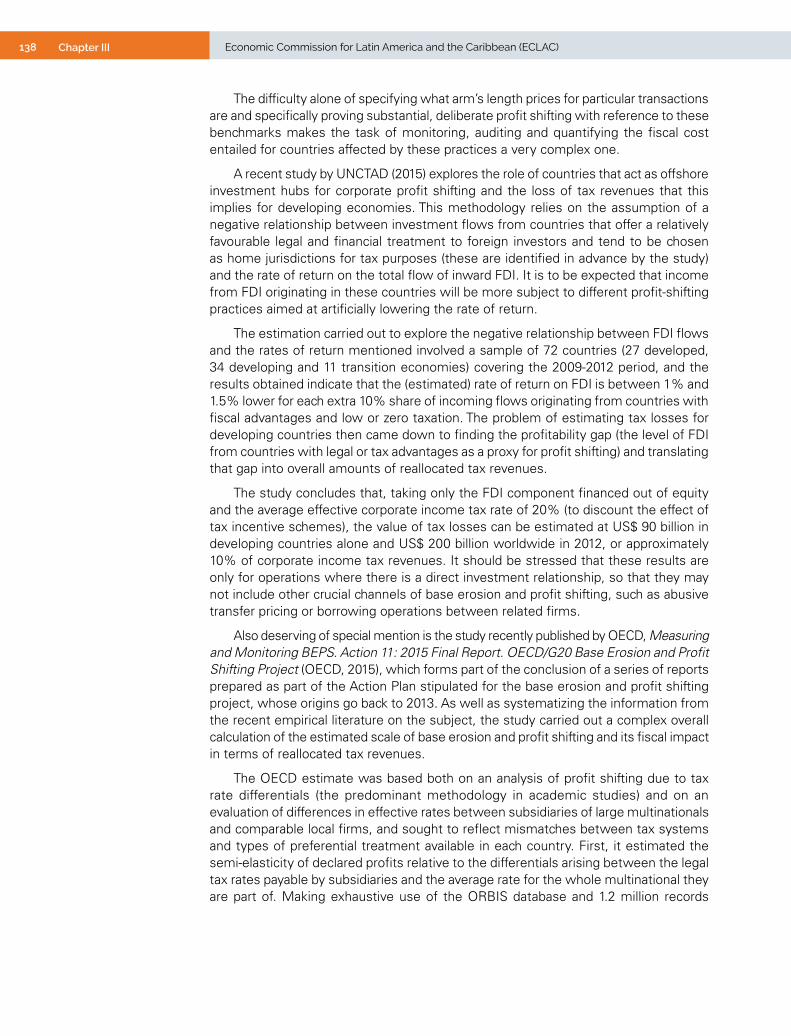
138 Chapter III Economic Commission for Latin America and the Caribbean (ECLAC)
The difficulty alone of specifying what arm’s length prices for particular transactions are and specifically proving substantial, deliberate profit shifting with reference to these benchmarks makes the task of monitoring, auditing and quantifying the fiscal cost entailed for countries affected by these practices a very complex one.
A recent study by UNCTAD (2015) explores the role of countries that act as offshore investment hubs for corporate profit shifting and the loss of tax revenues that this implies for developing economies. This methodology relies on the assumption of a negative relationship between investment flows from countries that offer a relatively favourable legal and financial treatment to foreign investors and tend to be chosen as home jurisdictions for tax purposes (these are identified in advance by the study) and the rate of return on the total flow of inward FDI. It is to be expected that income from FDI originating in these countries will be more subject to different profit-shifting practices aimed at artificially lowering the rate of return.
The estimation carried out to explore the negative relationship between FDI flows and the rates of return mentioned involved a sample of 72 countries (27 developed, 34 developing and 11 transition economies) covering the 2009-2012 period, and the results obtained indicate that the (estimated) rate of return on FDI is between 1% and 1.5% lower for each extra 10% share of incoming flows originating from countries with fiscal advantages and low or zero taxation. The problem of estimating tax losses for developing countries then came down to finding the profitability gap (the level of FDI from countries with legal or tax advantages as a proxy for profit shifting) and translating that gap into overall amounts of reallocated tax revenues.
The study concludes that, taking only the FDI component financed out of equity and the average effective corporate income tax rate of 20% (to discount the effect of tax incentive schemes), the value of tax losses can be estimated at US$ 90 billion in developing countries alone and US$ 200 billion worldwide in 2012, or approximately 10% of corporate income tax revenues. It should be stressed that these results are only for operations where there is a direct investment relationship, so that they may not include other crucial channels of base erosion and profit shifting, such as abusive transfer pricing or borrowing operations between related firms.
Also deserving of special mention is the study recently published by OECD, Measuring and Monitoring BEPS. Action 11: 2015 Final Report. OECD/G20 Base Erosion and Profit Shifting Project (OECD, 2015), which forms part of the conclusion of a series of reports prepared as part of the Action Plan stipulated for the base erosion and profit shifting project, whose origins go back to 2013. As well as systematizing the information from the recent empirical literature on the subject, the study carried out a complex overall calculation of the estimated scale of base erosion and profit shifting and its fiscal impact in terms of reallocated tax revenues.
The OECD estimate was based both on an analysis of profit shifting due to tax rate differentials (the predominant methodology in academic studies) and on an evaluation of differences in effective rates between subsidiaries of large multinationals and comparable local firms, and sought to reflect mismatches between tax systems and types of preferential treatment available in each country. First, it estimated the semi-elasticity of declared profits relative to the differentials arising between the legal tax rates payable by subsidiaries and the average rate for the whole multinational they are part of. Making exhaustive use of the ORBIS database and 1.2 million records

139Chapter IIIEconomic Survey of Latin America and the Caribbean • 2016
between 2000 and 2010, this indicator was approximated to a value of -1.0.3 As a result of profit shifting, mismatches between tax systems and greater relative use of preferential treatment, average effective rates for large multinationals (those with over 250 employees) were found to be between 4.0 and 8.5 percentage points lower than those for comparable local firms.
Estimating the loss of revenue associated with base erosion and profit shifting mechanisms requires a great many parameters and assumptions to extrapolate an overall result from a database. For this, use was made not only of the ORBIS database but also of information generated by OECD (such as projections of tax revenues). Nonetheless, some factors that could cause revenue loss to be underestimated were identified, such as a lack of representativeness in the data available and uneven coverage in a number of the countries analysed, while other factors could lead to the results being overestimated.
Given these uncertainties and limitations, the total loss of net resources was estimated as being currently between 4% and 10% of annual corporate income tax revenues. Overall, this loss of revenue from base erosion and profit shifting equates to a cumulative amount of resources of between about US$ 900 billion and US$ 2.1 trillion over the last 10 years (2005-2014) and at least US$ 100 billion to US$ 240 billion in 2014, two thirds of it attributed to profit shifting and the rest to the exploitation of particular advantages for multinationals under preferential regimes.
Although this is a global, aggregate estimate, the study cited indicates that the impact of base erosion and profit shifting on the total tax take is probably greater in relative terms in developing countries than in developed ones, given the former’s greater reliance on tax revenues from corporate income tax (OECD, 2015).4
3 ORBIS is a global database of business information produced by Bureau Van Dijk and based on a standardized format that makes it comparable for over 175 million firms worldwide (including banks and insurance companies).
4 According to data published in the report by Gómez Sabaíni and Morán (2014), corporation tax revenues have historically averaged a higher proportion of the total tax burden for the countries of Latin America than for OECD members. Their average share in the region rose from 16.2% in 1990 to 17.4% in 2012, while for the developed countries it rose from 7.3% in 1990 to 8.9% in 2012.

140 Chapter III Economic Commission for Latin America and the Caribbean (ECLAC)
Annex III.A2
Indicators for identifying and monitoring tax avoidance practices
In the interests of generating fresh, up-to-date and ongoing information, a recent report focusing on the monitoring of base erosion and profit shifting (OECD, 2015) presented six indicators that draw on multiple data sources, use different measurement parameters and analyse the different avoidance practices involved in base erosion and profit shifting (see box III.A2.1). Specifically, these six indicators are meant to show the disconnection between real economic activities and financial ones, profitability differentials between leading multinationals, differentials in tax rates between these firms and comparable ones that only operate at the national level, and profit shifting involving intangible assets and interest payments.
Box III.A2.1 Six indicators for tracing and detecting base erosion and profit shifting manoeuvres (OECD project)
Subject to all the relevant caveats regarding the limited availability of data and the care required in interpreting them, the Organization for Economic Cooperation and Development (OECD) has recently presented six indicators designed to identify the incidence of base erosion and profit shifting in the different countries:
1. High levels of foreign direct investment (FDI) relative to GDP (as an indication of the disconnection between financial activities and the real economy)
2. Differential in rates of return relative to effective tax rates
3. Differential in rates of return between the global operations of multinationals and those situated in low-tax jurisdictions
4. Effective tax rates for large subsidiaries of multinationals relative to local firms that are comparable or have similar characteristics
5. High levels of revenue from royalties relative to research and development spending (profit shifting using intangible assets)
6. Ratios between interest payments and revenues at subsidiaries of multinationals in high-tax jurisdictions (also to detect profit shifting)
Source: Organization for Economic Cooperation and Development (OECD), Measuring and Monitoring BEPS. Action 11: 2015 Final Report. OECD/G20 Base Erosion and Profit Shifting Project, Paris, OECD Publishing, 2015.
The report makes it clear, though, that the use of these indicators to identify the scale and economic impact of base erosion and profit shifting can only provide general indications on this in the countries analysed. The data used to estimate these indicators are affected by a number of limitations in the information sources available, which means that they should be regarded as illustrative and not definitive or strictly accurate.
Taking these reservations into account, the calculations for indicator 1 were obtained from data on 217 countries included in the Foreign Direct Investment (FDI) Statistics - OECD Data, Analysis and Forecasts database, and they show that stocks of FDI relative to GDP for a group of countries with high ratios (over 50% in net terms and over 200% in gross terms) have been growing over recent years in comparison with the average for all other countries: net FDI relative to GDP in these countries increased from a multiple of 38 times other countries’ in 2005 to 99 times in 2012.
Indicators 2 and 3 show a correlation between low effective tax rates and subsidiaries’ rates of profit. Going by financial information from the 250 largest multinationals, it was shown in the first case that 45% of these business groups’ earnings was declared
141Chapter IIIEconomic Survey of Latin America and the Caribbean • 2016
for tax purposes through subsidiaries with below-average effective tax rates and above-average rates of profit, with a rising trend in this indicator over recent years. The other indicator connected with firms’ profitability shows that the rate of return of subsidiaries based in low-tax countries is at least twice as high on average as that for the multinational of which they are part.
Indicator 4 uses unconsolidated financial information from firms in the ORBIS database to show that the effective rates paid by the subsidiaries of large multinationals were between 2.7 and 4.5 percentage points lower than those estimated for similar local firms between 2000 and 2010. Indicator 5 uses balance-of-payments and research and development spending information from the World Bank World Development Indicators to show that royalty receipts relative to research and development spending are six times as high in a group of countries with ratios in excess of 50% as the average for all other countries (in 2009 they were only three times as high). Lastly, the financial data collected to estimate indicator 6 suggest that when the subsidiaries of large multinationals are located in relatively high-tax countries, their ratio of interest over earnings before interest, tax, depreciation and amortization is almost three times as great as that of other subsidiaries in different jurisdictions.
Although very recent, this contribution is important if is accepted that a combination of these indicators would provide solid evidence for illegal conduct and the (approximate) incidence of profit shifting worldwide and in several countries in particular.
Furthermore, as a first step towards obtaining data that are comparable across countries and over variable periods of time, the indicators have great potential for the study of these phenomena on a firmer statistical basis than at present. However, when it comes to quantifying the scale of the problem and the associated fiscal losses, they will need to be supplemented by more rigorous analyses, like those described in annex III.A1, that are able to exploit the new information produced.
The usefulness of this series of indicators can be expected to increase progressively over the coming years, when the agreements signed between the OECD countries and the G20 come into force. For example, the requirements proposed by OECD for reporting on operations with transfer prices between countries (Action 13) should begin to materialize from January 2016.

IVCHAPTER
External private sector financial flows
Introduction
A. Changes in external financial flows and the growing importance of private sector sources and actors
B. The Latin American and Caribbean countries’ access to private sector financial markets
C. Private sector flows at the service of development
Bibliography


Chapter IVEconomic Survey of Latin America and the Caribbean • 2016 IVIntroduction
The external development finance scene has changed considerably over recent decades in terms of the array of agents providing financing, the funding mechanisms used and the composition of financial flows. Analysis of the evolution of development finance flows reveals a clear fall-off in traditional flows such as official development assistance (ODA) in middle-income countries, including those of Latin America, with average ODA flows dropping from over 1% of regional GDP to 0.2% in the period from 1961 to 2014. This decline has been due to the logic driving the allocation of official assistance, which relies on per capita GDP as the sole indicator of a country’s economic and social development, with the result that low-income countries are favoured over middle-income ones such as those of Latin America and the Caribbean.
As flows of official assistance have diminished, private flows have become the main source of financing for these economies, led by foreign direct investment (FDI), which in 2014 amounted to US$ 158.803 billion, or 2.6% of regional GDP, equivalent to over 60% of total flows into the region. Remittances and portfolio investment flows, for their part, were over US$ 60 billion and US$ 93 billion, respectively, in 2014.
More recently, and especially since the international financial crisis of 2008-2009, the international bond market has become a major source of financing for the region’s private and public sectors alike in different areas of economic activity, including natural resources, infrastructure and the financial sector. This can be accounted for, among other factors, by the substantial shift that quantitative easing in the United States has brought about in the composition of financial flows to emerging markets, including Latin America and the Caribbean, giving greater primacy to the bond market over bank lending. From US$ 20 billion in 2009, bond issues in the region rose to over US$ 150 billion in 2014 (2.6% of regional GDP) before stabilizing at about US$ 80 billion in 2014-2015.
This reliance on private funds raises very significant issues for development finance. First, there is the matter of differentiated access to markets for private flows. Not all countries have the same access to external financing sources. The degree to which a country or set of countries can access external private sector financing depends on a number of factors, including the size of the economy, perceived risk (in some cases reflecting the country’s macroeconomic record), the production structure, the state of infrastructure and the education and specialization level of the workforce.
Second, private sector flows, including FDI, are procyclical and sometimes highly volatile, which can amplify business cycle fluctuations. This limits the scope for securing the continuity of financing that is vital for long-run growth.
Third, the behaviour of private capital flows, including FDI, reflects the fact that they are mainly profit-driven, which can mean that investment is inadequate in areas crucial to sustainable development, such as poverty reduction or infrastructure improvements, if the expected risk-adjusted return is unsatisfactory relative to alternative investment opportunities.
Channelling and matching private capital to sustainable development needs means creating incentives that can attract private investment into areas where it meets the production and development requirements of the economies of Latin America and the Caribbean. This must involve government action to design appropriate incentives, which means, for example, including social returns in cost-benefit analyses, supplying public financing to sectors that generate significant social benefits but do not attract enough private sector funds, maintaining risk-return profiles attractive to private capital and directing this capital towards development objectives, and creating appropriate legal frameworks.

146 Chapter IV Economic Commission for Latin America and the Caribbean (ECLAC)
This chapter contains three sections. The first analyses changes in the composition of external flows, highlighting the diminishing role of ODA and the predominance of private funds. The second section examines issues surrounding the access of Latin America and the Caribbean to financial markets, identifying possible determinants of access to private sector finance. It also describes recent changes in the composition of international liquidity. The third section suggests measures for channelling private capital into economic development and describes two illustrative mechanisms for directing private funds towards different areas of developmental importance: public-private partnerships and social impact bonds.
A. Changes in external financial flows and the growing importance of private sector sources and actors
Analysis of the evolution and composition of financing flows in recent decades reveals a clear decline in ODA going to middle-income countries, including those of Latin America and the Caribbean. Meanwhile, private sector flows have become the leading source of external funding for this group of countries.
1. Trends in ODA and official flows
Since the 1970s, Latin America and the Caribbean, like other middle-income regions, has seen its share of ODA diminish. More specifically, the proportion of ODA received by the region has been in clear decline, both as compared with other developing regions and relative to its average gross national income (GNI). ODA flows currently represent 0.17% of regional GNI, a sharp drop from the 0.4% that was the average for the 1970s, 1980s and 1990s (see figure IV.1).1 At the same time, the region’s share of total ODA dropped from 15% in the 1980s and 1990s to some 8% in the 2000s.
1 Aggregate ODA figures mask large disparities between countries, as relative levels vary widely, from 0% of GNI (Trinidad and Tobago) to roughly 17% (Haiti) in 2000-2014. Between these extremes, ODA is over 10% of GNI in 2 countries (Guyana and Nicaragua), between 1% and 6% in 10 and below 1% in another 18.
Figure IV.1 Latin America and the Caribbean: official development assistance (ODA), 1961-2014(Percentages of gross national income)
0
0.2
0.4
0.6
0.8
1.0
1.2
1.4
1961
1963
1965
1967
1969
1971
1973
1975
1977
1979
1981
1983
1985
1987
1989
1991
1993
1995
1997
1999
2001
2003
2005
2007
2009
2011
2013
Source: Organization for Economic Cooperation and Development (OECD), “Development Finance Statistics”, 2016 [online] http://www.oecd.org/development/stats/.
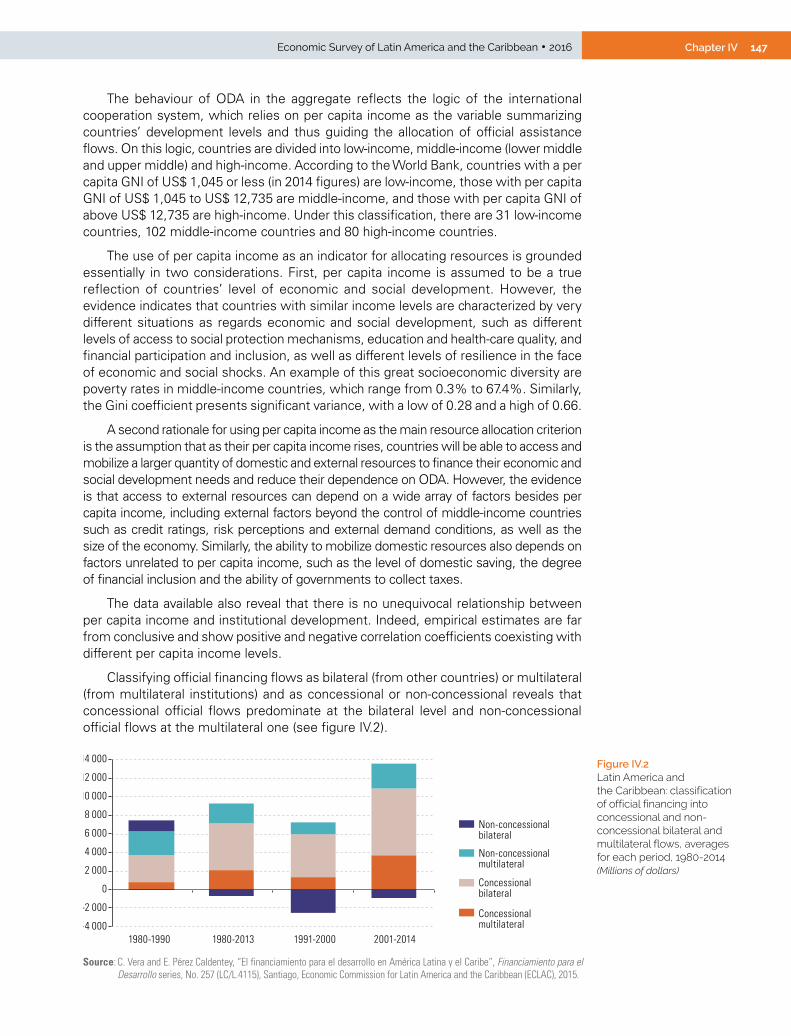
147Chapter IVEconomic Survey of Latin America and the Caribbean • 2016
The behaviour of ODA in the aggregate reflects the logic of the international cooperation system, which relies on per capita income as the variable summarizing countries’ development levels and thus guiding the allocation of official assistance flows. On this logic, countries are divided into low-income, middle-income (lower middle and upper middle) and high-income. According to the World Bank, countries with a per capita GNI of US$ 1,045 or less (in 2014 figures) are low-income, those with per capita GNI of US$ 1,045 to US$ 12,735 are middle-income, and those with per capita GNI of above US$ 12,735 are high-income. Under this classification, there are 31 low-income countries, 102 middle-income countries and 80 high-income countries.
The use of per capita income as an indicator for allocating resources is grounded essentially in two considerations. First, per capita income is assumed to be a true reflection of countries’ level of economic and social development. However, the evidence indicates that countries with similar income levels are characterized by very different situations as regards economic and social development, such as different levels of access to social protection mechanisms, education and health-care quality, and financial participation and inclusion, as well as different levels of resilience in the face of economic and social shocks. An example of this great socioeconomic diversity are poverty rates in middle-income countries, which range from 0.3% to 67.4%. Similarly, the Gini coefficient presents significant variance, with a low of 0.28 and a high of 0.66.
A second rationale for using per capita income as the main resource allocation criterion is the assumption that as their per capita income rises, countries will be able to access and mobilize a larger quantity of domestic and external resources to finance their economic and social development needs and reduce their dependence on ODA. However, the evidence is that access to external resources can depend on a wide array of factors besides per capita income, including external factors beyond the control of middle-income countries such as credit ratings, risk perceptions and external demand conditions, as well as the size of the economy. Similarly, the ability to mobilize domestic resources also depends on factors unrelated to per capita income, such as the level of domestic saving, the degree of financial inclusion and the ability of governments to collect taxes.
The data available also reveal that there is no unequivocal relationship between per capita income and institutional development. Indeed, empirical estimates are far from conclusive and show positive and negative correlation coefficients coexisting with different per capita income levels.
Classifying official financing flows as bilateral (from other countries) or multilateral (from multilateral institutions) and as concessional or non-concessional reveals that concessional official flows predominate at the bilateral level and non-concessional official flows at the multilateral one (see figure IV.2).
Figure IV.2 Latin America and the Caribbean: classification of official financing into concessional and non-concessional bilateral and multilateral flows, averages for each period, 1980-2014(Millions of dollars)
-4 000
-2 000
0
2 000
4 000
6 000
8 000
10 000
12 000
14 000
1980-1990 1980-2013 1991-2000 2001-2014
Concessionalmultilateral
Concessionalbilateral
Non-concessionalmultilateral
Non-concessionalbilateral
Source: C. Vera and E. Pérez Caldentey, “El financiamiento para el desarrollo en América Latina y el Caribe”, Financiamiento para el Desarrollo series, No. 257 (LC/L.4115), Santiago, Economic Commission for Latin America and the Caribbean (ECLAC), 2015.
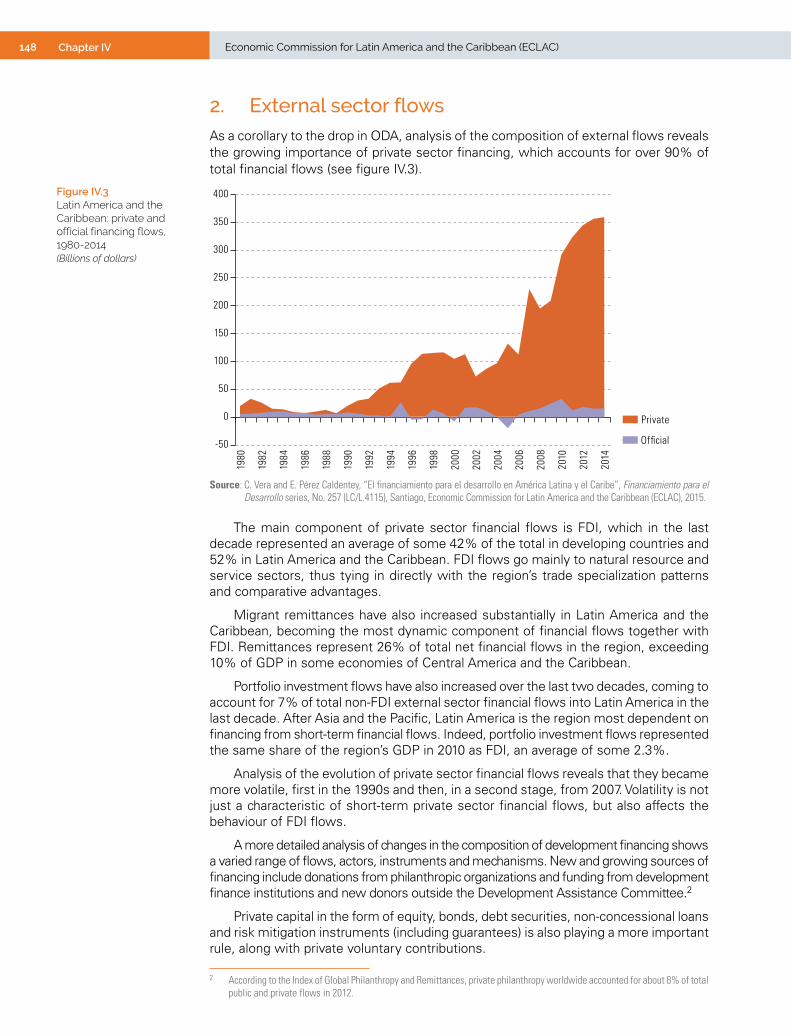
148 Chapter IV Economic Commission for Latin America and the Caribbean (ECLAC)
2. External sector flowsAs a corollary to the drop in ODA, analysis of the composition of external flows reveals the growing importance of private sector financing, which accounts for over 90% of total financial flows (see figure IV.3).
Figure IV.3 Latin America and the Caribbean: private and official financing flows, 1980-2014(Billions of dollars)
Private
Official-50
0
50
100
150
200
250
300
350
400
1980
1982
1984
1986
1988
1990
1992
1994
1996
1998
2000
2002
2004
2006
2008
2010
2012
2014
Source: C. Vera and E. Pérez Caldentey, “El financiamiento para el desarrollo en América Latina y el Caribe”, Financiamiento para el Desarrollo series, No. 257 (LC/L.4115), Santiago, Economic Commission for Latin America and the Caribbean (ECLAC), 2015.
The main component of private sector financial flows is FDI, which in the last decade represented an average of some 42% of the total in developing countries and 52% in Latin America and the Caribbean. FDI flows go mainly to natural resource and service sectors, thus tying in directly with the region’s trade specialization patterns and comparative advantages.
Migrant remittances have also increased substantially in Latin America and the Caribbean, becoming the most dynamic component of financial flows together with FDI. Remittances represent 26% of total net financial flows in the region, exceeding 10% of GDP in some economies of Central America and the Caribbean.
Portfolio investment flows have also increased over the last two decades, coming to account for 7% of total non-FDI external sector financial flows into Latin America in the last decade. After Asia and the Pacific, Latin America is the region most dependent on financing from short-term financial flows. Indeed, portfolio investment flows represented the same share of the region’s GDP in 2010 as FDI, an average of some 2.3%.
Analysis of the evolution of private sector financial flows reveals that they became more volatile, first in the 1990s and then, in a second stage, from 2007. Volatility is not just a characteristic of short-term private sector financial flows, but also affects the behaviour of FDI flows.
A more detailed analysis of changes in the composition of development financing shows a varied range of flows, actors, instruments and mechanisms. New and growing sources of financing include donations from philanthropic organizations and funding from development finance institutions and new donors outside the Development Assistance Committee.2
Private capital in the form of equity, bonds, debt securities, non-concessional loans and risk mitigation instruments (including guarantees) is also playing a more important rule, along with private voluntary contributions.
2 According to the Index of Global Philanthropy and Remittances, private philanthropy worldwide accounted for about 8% of total public and private flows in 2012.

149Chapter IVEconomic Survey of Latin America and the Caribbean • 2016
Among the changes to the composition of development financing, particular mention should be made of innovative financing mechanisms that may be important for the future shape of the developing financial architecture. These innovative mechanisms, some of them already implemented, fall into four broad categories: (i) those that generate new public revenue streams, (ii) debt-based instruments and front-loading (such as debt swaps and international finance facilities), (iii) public-private incentives, guarantees and insurance (such as advance market commitments and sovereign insurance pools) and (iv) voluntary contributions using public or public-private channels (such as person-to-person giving).
3. The heterogeneous composition of the external flows relied on by the different countries
For the different countries, the relative scale of the different financial flows analysed is highly heterogeneous. There are countries such as Haiti in which ODA and remittances together account for practically the whole of the external financing flows received. Conversely, flows of this type play a lesser role in upper middle-income countries such as Brazil, where most financing comes from FDI and, depending on the period, portfolio investment flows (see figure IV.4).
Figure IV.4 Latin America and the Caribbean: relative scale of selected external financing sources, 2010-2012 average(Percentages of total flows)
-20
0
20
40
60
80
100
Arge
ntin
a Bo
livia
(Plu
r. St
ate
of)
Braz
il Ch
ile
Colo
mbi
a
Cost
a Ri
ca Ec
uado
r
El S
alva
dor
Guat
emal
a Ha
iti
Hond
uras
Mex
ico
Nic
arag
ua Pa
nam
a
Para
guay
Peru
Dom
inic
an R
ep.
Urug
uay
Vene
zuel
a(B
ol. R
ep. o
f)
A. Latin America
Foreign direct investmentOfficial development assistance Remittances Portfolio investment flows
-40
-20
0
20
40
60
80
100
An
tigua
and
Bar
buda
Beliz
e
Dom
inic
a Gr
enad
a Gu
yana
Jam
aica
Sain
t Kitt
s an
d N
evis
Sa
int V
ince
nt a
ndth
e Gr
enad
ines
Sain
t Luc
ia
Surin
ame
B. The Caribbean
Source: Economic Commission for Latin America and the Caribbean (ECLAC), on the basis of World Bank, World Development Indicators.Note: Countries without full information available were not included in the chart.
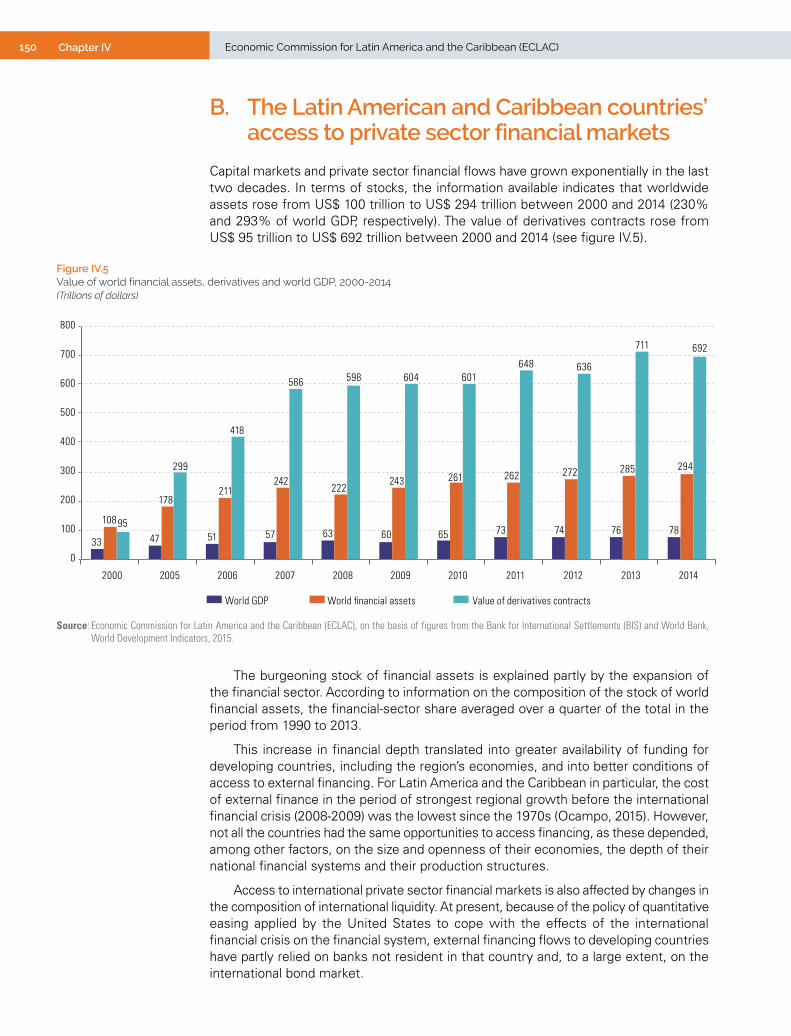
150 Chapter IV Economic Commission for Latin America and the Caribbean (ECLAC)
B. The Latin American and Caribbean countries’ access to private sector financial markets
Capital markets and private sector financial flows have grown exponentially in the last two decades. In terms of stocks, the information available indicates that worldwide assets rose from US$ 100 trillion to US$ 294 trillion between 2000 and 2014 (230% and 293% of world GDP, respectively). The value of derivatives contracts rose from US$ 95 trillion to US$ 692 trillion between 2000 and 2014 (see figure IV.5).
Figure IV.5 Value of world financial assets, derivatives and world GDP, 2000-2014(Trillions of dollars)
33 47 51 57 63 60 65 73 74 76 78 108
178 211
242 222
243 261 262 272 285 294
95
299
418
586 598 604 601 648 636
711 692
0
100
200
300
400
500
600
700
800
2000 2005 2006 2007 2008 2009 2010 2011 2012 2013 2014
World GDP World financial assets Value of derivatives contracts
Source: Economic Commission for Latin America and the Caribbean (ECLAC), on the basis of figures from the Bank for International Settlements (BIS) and World Bank, World Development Indicators, 2015.
The burgeoning stock of financial assets is explained partly by the expansion of the financial sector. According to information on the composition of the stock of world financial assets, the financial-sector share averaged over a quarter of the total in the period from 1990 to 2013.
This increase in financial depth translated into greater availability of funding for developing countries, including the region’s economies, and into better conditions of access to external financing. For Latin America and the Caribbean in particular, the cost of external finance in the period of strongest regional growth before the international financial crisis (2008-2009) was the lowest since the 1970s (Ocampo, 2015). However, not all the countries had the same opportunities to access financing, as these depended, among other factors, on the size and openness of their economies, the depth of their national financial systems and their production structures.
Access to international private sector financial markets is also affected by changes in the composition of international liquidity. At present, because of the policy of quantitative easing applied by the United States to cope with the effects of the international financial crisis on the financial system, external financing flows to developing countries have partly relied on banks not resident in that country and, to a large extent, on the international bond market.

151Chapter IVEconomic Survey of Latin America and the Caribbean • 2016
According to the Bank for International Settlements (BIS, 2015), the information available for 2013 shows total lending that year to be US$ 8.7 trillion, 46% of it generated in the international bond market and 54% in the international banking market (see figure IV.6). The information also indicates that banking institutions based in the United States do not dominate lending outside that country, accounting for just 11% of it in 2013.
Figure IV.6 Lending to borrowers outside the United States, late 2013(Trillions of dollars)
United States banking market
(1.0)
Non-United Statesbanking market
(3.7)United Statesbond market
(1.3)
Non-United Statesbond market
(2.7)
Source: R. McCauley and others (2015), “Global dollar credit. Links to US monetary policy and leverage”, BIS Working Paper, No. 483, Bank for International Settlements, 2015.
In the case of Latin America and the Caribbean, international bond issues became a major financing source from early 2009, and their volume increased steadily up to late 2014. Bond issuance rose from US$ 20 billion to US$ 140 billion between June 2009 and December 2014. It has fallen off since then, with the latest figures available putting issuance at about US$ 80 billion (see figure IV.7).
Figure IV.7 Latin America and the Caribbean: international bond issuance, December 2006 to May 2016(Billions of dollars)
0
20
40
60
80
100
120
140
160
Dec
2006
Jul 2
007
Feb
2008
Sep
2008
Apr 2
009
Nov
200
9
Jun
2010
Jan
2011
Aug
2011
Mar
201
2
Oct 2
012
May
201
3
Dec
2013
Jul 2
014
Feb
2015
Sep
2015
Apr 2
016
Banks Non-financial corporate sector
Quasi-sovereign
Sovereign
Supranational Total
Source: Economic Commission for Latin America and the Caribbean (ECLAC), on the basis of figures from the Latin Finance Bonds Database, 2016.
Note: The different sectors shown are those issuing the bonds, and are classified into five major categories: banks, non-financial corporate sector, sovereign, quasi-sovereign and supranational. The quasi-sovereign sector includes public sector development banks and State enterprises, among others. The supranational sector includes regional development banks such as the Development Bank of Latin America (CAF) and the Central American Bank for Economic Integration (CABEI).

152 Chapter IV Economic Commission for Latin America and the Caribbean (ECLAC)
Breaking down total issuance between January 2006 and May 2016 by economic agent shows that the bulk was corporate (34.4% of the total), sovereign (26.5%) and quasi-sovereign (26.6%). The bank sector represents a minor share of the total and supranational issuers an even smaller one (10.2% and 2.0%, respectively) (see figure IV.8).
Figure IV.8 Bank, corporate, sovereign, quasi-sovereign and supranational shares of international bond issuance, January 2006 to May 2016(Percentages of the total)
Banks(10.2)
Corporate(34.4)
Quasi-sovereign(26.6)
Sovereign(26.5)
Supranational(2.3)
Source: Economic Commission for Latin America and the Caribbean (ECLAC), on the basis of figures from the Latin Finance Bonds Database, 2016.
The information by country for 2006-2013 reveals that almost all the countries of Latin America have had recourse to the international bond market and that access to this market is not restricted to the region’s larger economies (see table IV.1). Indeed, the countries issuing the most bonds by value as a share of GDP in 2006-2013 were small economies, namely Uruguay, Panama and El Salvador, whose issuance was equivalent to 4.8%, 4.6% and 2.3% of GDP, respectively. They were followed by Colombia, Peru, Mexico, Chile, Brazil and the Bolivarian Republic of Venezuela, with total issuance of between 1.3% and 1.7% of GDP.
Table IV.1 Latin America (17 countries): bond issuance, 2006-2013(Percentages of GDP)
Country 2006-2007 2008-2009 2010-2013 Average
Uruguay 11,5 0,8 2,0 4,8
Panama 7.6 3.9 2.2 4.6
El Salvador 2.5 1.9 2.4 2.3
Colombia 1.8 1.4 1.8 1.7
Peru 1.3 0.9 2.8 1.7
Mexico 1.0 1.1 2.5 1.5
Chile 0.4 0.8 3.3 1.5
Brazil 1.2 1.0 1.8 1.4
Venezuela (Bolivarian Republic of) 1.7 1.5 0.8 1.3
Costa Rica 0.0 0.0 2.4 0.8
Dominican Republic 0.0 0.0 1.9 0.6
Honduras 0.0 0.0 1.4 0.5
Guatemala 0.0 0.0 1.3 0.4
Argentina 0.9 0.1 0.3 0.4
Paraguay 0.0 0.0 1.0 0.3
Bolivia (Plurinational State of) 0.0 0.0 0.9 0.3
Ecuador 0.0 0.0 0.0 0.0
Source: Economic Commission for Latin America and the Caribbean (ECLAC), on the basis of figures from the Latin Finance Bonds Database, 2016.
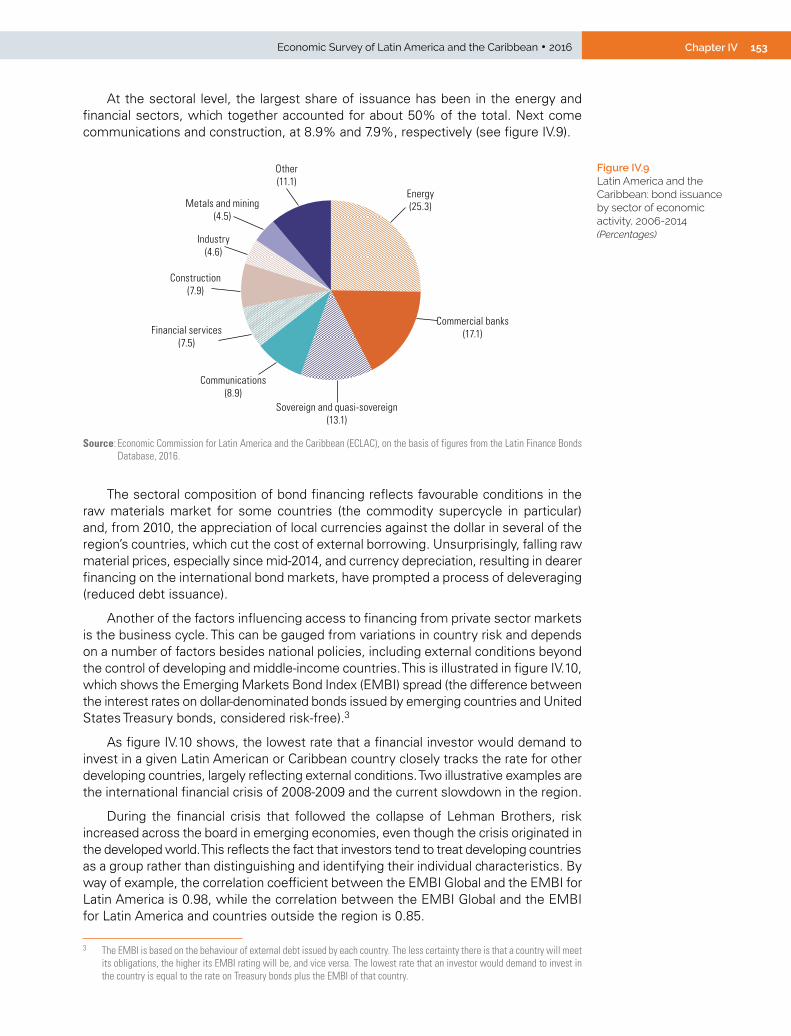
153Chapter IVEconomic Survey of Latin America and the Caribbean • 2016
At the sectoral level, the largest share of issuance has been in the energy and financial sectors, which together accounted for about 50% of the total. Next come communications and construction, at 8.9% and 7.9%, respectively (see figure IV.9).
Figure IV.9 Latin America and the Caribbean: bond issuance by sector of economic activity, 2006-2014(Percentages)
Energy(25.3)
Commercial banks(17.1)
Sovereign and quasi-sovereign(13.1)
Communications(8.9)
Financial services(7.5)
Construction(7.9)
Industry(4.6)
Metals and mining(4.5)
Other(11.1)
Source: Economic Commission for Latin America and the Caribbean (ECLAC), on the basis of figures from the Latin Finance Bonds Database, 2016.
The sectoral composition of bond financing reflects favourable conditions in the raw materials market for some countries (the commodity supercycle in particular) and, from 2010, the appreciation of local currencies against the dollar in several of the region’s countries, which cut the cost of external borrowing. Unsurprisingly, falling raw material prices, especially since mid-2014, and currency depreciation, resulting in dearer financing on the international bond markets, have prompted a process of deleveraging (reduced debt issuance).
Another of the factors influencing access to financing from private sector markets is the business cycle. This can be gauged from variations in country risk and depends on a number of factors besides national policies, including external conditions beyond the control of developing and middle-income countries. This is illustrated in figure IV.10, which shows the Emerging Markets Bond Index (EMBI) spread (the difference between the interest rates on dollar-denominated bonds issued by emerging countries and United States Treasury bonds, considered risk-free).3
As figure IV.10 shows, the lowest rate that a financial investor would demand to invest in a given Latin American or Caribbean country closely tracks the rate for other developing countries, largely reflecting external conditions. Two illustrative examples are the international financial crisis of 2008-2009 and the current slowdown in the region.
During the financial crisis that followed the collapse of Lehman Brothers, risk increased across the board in emerging economies, even though the crisis originated in the developed world. This reflects the fact that investors tend to treat developing countries as a group rather than distinguishing and identifying their individual characteristics. By way of example, the correlation coefficient between the EMBI Global and the EMBI for Latin America is 0.98, while the correlation between the EMBI Global and the EMBI for Latin America and countries outside the region is 0.85.
3 The EMBI is based on the behaviour of external debt issued by each country. The less certainty there is that a country will meet its obligations, the higher its EMBI rating will be, and vice versa. The lowest rate that an investor would demand to invest in the country is equal to the rate on Treasury bonds plus the EMBI of that country.
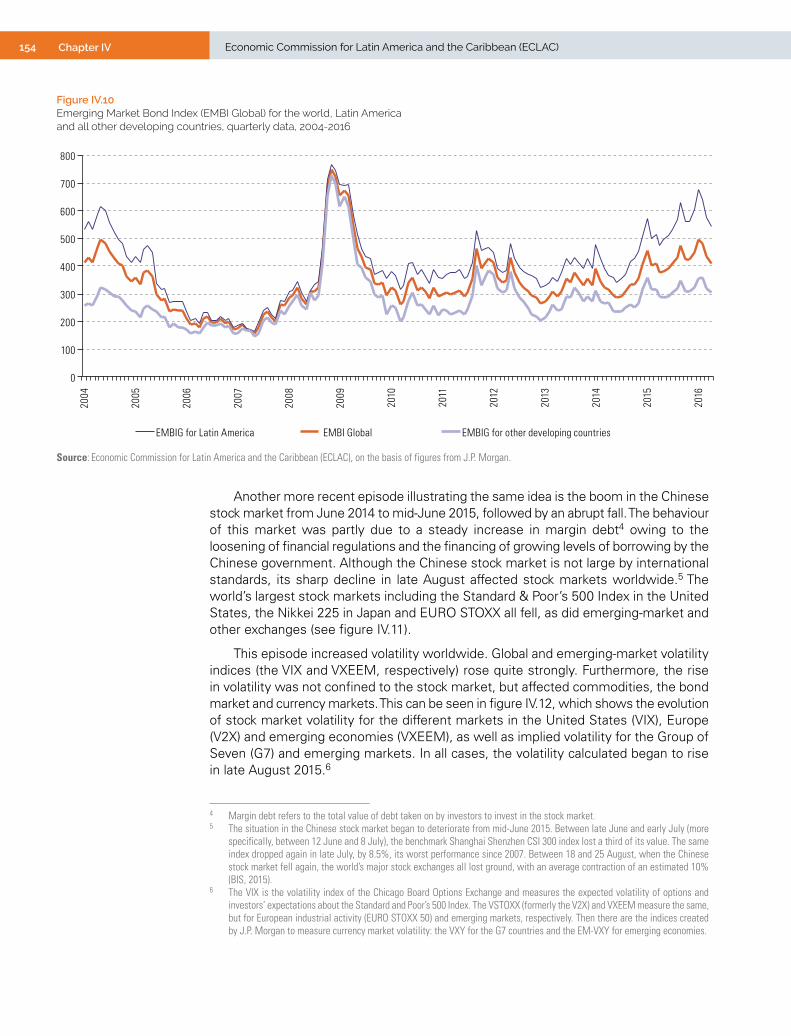
154 Chapter IV Economic Commission for Latin America and the Caribbean (ECLAC)
Figure IV.10 Emerging Market Bond Index (EMBI Global) for the world, Latin America and all other developing countries, quarterly data, 2004-2016
0
100
200
300
400
500
600
700
800
2004
2005
2006
2007
2008
2009
2010
2011
2012
2013
2014
2015
2016
EMBI GlobalEMBIG for Latin America EMBIG for other developing countries
Source: Economic Commission for Latin America and the Caribbean (ECLAC), on the basis of figures from J.P. Morgan.
Another more recent episode illustrating the same idea is the boom in the Chinese stock market from June 2014 to mid-June 2015, followed by an abrupt fall. The behaviour of this market was partly due to a steady increase in margin debt4 owing to the loosening of financial regulations and the financing of growing levels of borrowing by the Chinese government. Although the Chinese stock market is not large by international standards, its sharp decline in late August affected stock markets worldwide.5 The world’s largest stock markets including the Standard & Poor’s 500 Index in the United States, the Nikkei 225 in Japan and EURO STOXX all fell, as did emerging-market and other exchanges (see figure IV.11).
This episode increased volatility worldwide. Global and emerging-market volatility indices (the VIX and VXEEM, respectively) rose quite strongly. Furthermore, the rise in volatility was not confined to the stock market, but affected commodities, the bond market and currency markets. This can be seen in figure IV.12, which shows the evolution of stock market volatility for the different markets in the United States (VIX), Europe (V2X) and emerging economies (VXEEM), as well as implied volatility for the Group of Seven (G7) and emerging markets. In all cases, the volatility calculated began to rise in late August 2015.6
4 Margin debt refers to the total value of debt taken on by investors to invest in the stock market. 5 The situation in the Chinese stock market began to deteriorate from mid-June 2015. Between late June and early July (more
specifically, between 12 June and 8 July), the benchmark Shanghai Shenzhen CSI 300 index lost a third of its value. The same index dropped again in late July, by 8.5%, its worst performance since 2007. Between 18 and 25 August, when the Chinese stock market fell again, the world’s major stock exchanges all lost ground, with an average contraction of an estimated 10% (BIS, 2015).
6 The VIX is the volatility index of the Chicago Board Options Exchange and measures the expected volatility of options and investors’ expectations about the Standard and Poor’s 500 Index. The VSTOXX (formerly the V2X) and VXEEM measure the same, but for European industrial activity (EURO STOXX 50) and emerging markets, respectively. Then there are the indices created by J.P. Morgan to measure currency market volatility: the VXY for the G7 countries and the EM-VXY for emerging economies.

155Chapter IVEconomic Survey of Latin America and the Caribbean • 2016
Figure IV.11 Stock market indices in China, the United States, Japan, Europe and emerging markets, monthly data, 16 July to 17 September 2015
70
80
90
100
110
120
130
140
16 ju
l 201
5
23 ju
l 201
5
30 ju
l 201
5
06 a
ug 2
015
13 a
ug 2
015
20 a
ug 2
015
27 a
ug 2
015
03 s
ep 2
015
10 s
ep 2
015
S&P 500 (United States)
EURO STOXX (Europe)
Nikkei 225 (Japan)
Emerging markets
SHSZ300 (China)
Source: Economic Commission for Latin America and the Caribbean (ECLAC), on the basis of figures from Bloomberg.
Figure IV.12 Global stock market volatility (the VIX, V2X and VXEEM) and implied volatility, monthly data, 16 July to 17 September 2015
0
10
20
30
40
50
60
16 ju
l 201
5
16 a
ug 2
015
16 s
ep 2
015
16 ju
l 201
5
16 a
ug 2
015
16 s
ep 2
015
VIX (volatility for the United States)”
V2X (volatility for Europe)
VXEEM (volatility for emerging markets)
Volatility for the Group of Seven
Volatility for emerging markets
7
8
9
10
11
12
13
A. Global stock market volatility B. Implied volatility
Source: Economic Commission for Latin America and the Caribbean (ECLAC), on the basis of figures from Bloomberg.

156 Chapter IV Economic Commission for Latin America and the Caribbean (ECLAC)
C. Private sector flows at the service of development
An abundance of external financing does not guarantee that this financing can be used to enhance the region’s productive development.
The evolution and allocation of private capital, including FDI, are driven mainly by criteria of profitability rather than countries’ development needs. This can mean that investment is inadequate in areas crucial to sustainable development, such as poverty reduction or action on climate change, if the expected risk-adjusted return does not match up to that of other investment options.
Markets and capital flows operate in a short-term framework because of the characteristics of their incentives, such as the fact of sustainability considerations not being included in the cost of capital. This can result in long-term capital investment opportunities being foregone, sustainability being undervalued and resources not going where they are most needed. The tendency to prioritize the short term and the neglect of externalities reduce incentives to invest in sustainable businesses (Aviva, 2014).
If the goal is to channel private capital in a way that furthers sustainable development, incentives need to be created for all major actors in capital markets to take sustainability aspects into account. At the same time, policymakers need to incorporate sustainable development criteria into capital market policies, and corporate externalities should be internalized in company accounts through fiscal measures, regulations and market mechanisms (Aviva, 2014, p. 46).
Efficient and selective government interventions will be required to design appropriate incentives so that private capital can contribute to the attainment of the Sustainable Development Goals. The public sector must build on its increasingly important role in including social returns in the cost-benefit analysis. It can provide public financing for sectors that generate significant social gains but do not attract sufficient private flows. It can also establish an enabling environment and proper incentives, thereby supporting a risk-return profile capable of attracting private capital and directing it towards development objectives.
Such incentives for private financing need to go hand in hand with proper regulatory frameworks. A balance needs to be struck between business strategies and development objectives in host countries in order to: (i) allocate a larger share of FDI flows to the funding of production development (innovation, small and medium-sized technology firms and new sectors, among others), (ii) promote the incorporation of local small and medium-sized enterprises into global value chains headed by transnational corporations, (iii) prioritize FDI projects which help to close gaps in environmentally-friendly technologies and develop modern infrastructure (including broadband Internet) and (iv) develop a better institutional structure for attracting high-quality FDI. The region needs to address the challenge of attracting capital for production development if it wishes to foster greater diversification into sectors that are more intensive in specialized knowledge, develop local capabilities and maintain long-term competitiveness, while at the same time promoting sustainable development.
Two mechanisms serve to illustrate the way financial flows can be channelled towards development financing: public-private partnerships and social impact bonds. Public-private partnerships are long-term contractual agreements between the public sector and one or more private partners for the purpose of building, operating or

157Chapter IVEconomic Survey of Latin America and the Caribbean • 2016
administering infrastructure that provides citizens with a good or service.7 Social impact bonds are another of the mechanisms whereby private capital can support the financing of development areas, in this case social ones.
The two mechanisms will now be briefly described and their progress in the region analysed, together with the challenges that have arisen and the lessons learned from their implementation.
1. Public-private partnerships in Latin America and the Caribbean
The first public-private partnerships in Latin America and the Caribbean, most of them concessions, were implemented in the late 1980s and early 1990s. Investment in such partnerships has increased in the region since then, albeit with some cyclical fluctuations (see figure IV.13).
7 While there are different definitions and positions regarding what constitutes a public-private partnership, this definition is a synthesis based on the literature cited in Alborta, Stevenson and Triania (2011) and Engel, Fischer and Galetovic (2008) that aims to capture the key aspects. Public-private partnerships encompass a variety of contractual formats.
Figure IV.13 Latin America and the Caribbean: investment in public-private partnerships, 1990-2013 (Billions of dollars)
0
10
20
30
40
50
60
70
80
90
100
1990
1991
1992
1993
1994
1995
1996
1997
1998
1999
2000
2001
2002
2003
2004
2005
2006
2007
2008
2009
2010
2011
2012
2013
Source: Economic Commission for Latin America and the Caribbean (ECLAC), on the basis of World Bank, Private Participation in Infrastructure Projects Database.
Although almost all the countries have had some experience with public-private partnerships, Brazil accounts for the bulk of such investment. In the period from 2010 to 2013, that country alone accounted for over 60% of the total investment in public-private partnerships in the region, with Mexico a distant second at 11% (see figure IV.14).
The main areas in which the public-private partnership mechanism has been applied have historically been transport (airports, ports, highways, trains, metropolitan railways and buses), telecommunications, energy (mainly electricity generation and investments in natural gas) and sanitary services (mainly drinking water distribution, water sanitation and drainage) (see figure IV.15).

158 Chapter IV Economic Commission for Latin America and the Caribbean (ECLAC)
Figure IV.14 Latin America and the Caribbean: distribution of cumulative investment in public-private partnerships, 2010-2013(Percentages)
Brazil(63)
Mexico(11)
Chile(5)
Colombia(5)
Peru(5)
Argentina(4)
Uruguay(1)
Honduras (1)
Panama(1)
Venezuela(Bol. Rep. of)
(1) Guatemala(1)
Ecuador(0)
Rest of Latin Americaand the Caribbean
(2)
Source: Economic Commission for Latin America and the Caribbean (ECLAC), on the basis of World Bank, Private Participation in Infrastructure Projects Database.
Figure IV.15 Latin America and the Caribbean: number of public-private partnerships and amount of investment by sector of activity, cumulative values, 1990-2013
Energy(282 177)
(33%)
Telecommunications(351 857)
(42%)
Transport(176 399)
(21%)
Water and drainage(34 724)
(4%)
Water and drainage(269)(15%)
Transport(555)(30%)
Telecommunications(152)(8%)
Energy(865)(47%)
A. Public-private partnershipsand distribution by sector
B. Investment in public-private partnershipsand distribution by sector
(numbers and percentages) (millions of dollars and percentages)
Source: Economic Commission for Latin America and the Caribbean (ECLAC), on the basis of World Bank, Private Participation in Infrastructure Projects Database.
In the last decade, the governments of some of the region’s countries have also begun to use public-private partnerships to meet some social infrastructure needs, such as investments in physical infrastructure or the operation of prison and health services. This has happened in Chile, Peru and Mexico, where public-private partnerships have now been tried out in the health-care sector, and Colombia and Honduras, which have

159Chapter IVEconomic Survey of Latin America and the Caribbean • 2016
announced plans to tender out projects for public-private partnerships in the sector over the coming years (PWC, 2014). Furthermore, in the most traditional sectors such as energy, public-private partnerships have begun to play a role in new segments too, examples being investment in clean technologies that reduce carbon emissions.
While public-private partnerships have been well received around the world since they appeared as an alternative to public provision, they have not been trouble-free. In Latin America and the Caribbean in particular, a number of lessons have had to be learned from certain difficulties arising in the so-called first generation of public-private partnerships, suggesting specific ways forward if these arrangements are to be made more successful.
One major problem that has come up time and again in the region is the renegotiation of contracts once an investment has been made, entailing great costs for the countries’ treasuries, as well as considerable delays in projects due to be implemented.
Regulatory shortcomings and incomplete contracts that have left scope for the private firms involved to alter factors and so increase their revenues have been a leading cause of such renegotiations. A second cause for renegotiation lies in the countries’ public sectors themselves. Governments in office may have incentives to set up public-private partnerships hastily (usually with flawed and incomplete contracts) in order to increase their immediate political capital. The usual outcome is that elements of the contracts have to be corrected afterwards through renegotiations that prove costly, but usually for future administrations and users, rather than the current government.
Governments may also have incentives to invest and increase their political capital by the short cut of renegotiations that create add-ons to currently active public-private partnership projects rather than going through slow public tendering and procurement processes and submitting to parliamentary oversight of spending. Because the project is already operational, the private sector party is strongly placed in these renegotiations and can hold out for the best conditions at considerable future budgetary cost, possibly also with future conditions that are unfavourable to users.
Successful implementation of a public-private partnership requires a clear regulatory framework, rigorous evaluation, planning and design, real competition in the tendering process8 and well-equipped independent institutions, unaffected by political bias, to manage and supervise the process.
There is a need to formulate contracts that ensure appropriate and properly priced risk transfer to the private sector party. For example, State guarantees, if they exist, should be well designed and of limited scope and duration. Otherwise, the use of guarantees to secure financing for the private party may expose the public sector to very high (concealed) contingent costs (Akitoby, Hemming and Schwartz, 2007).
It is vital that public-private partnerships should be implemented as a way of increasing spending efficiency and not as a way of shifting spending off the government budget. For this, public sector accounting needs to find ways of properly capturing public-private partnerships in the fiscal accounts and in debt sustainability analyses, rather than creating scope for them to be kept off public sector balance sheets. Furthermore, there need to be rules to ensure transparency, i.e., proper disclosure by the State of the fiscal contingencies that may arise from public-private partnerships, including those resulting from any State guarantees provided (Akitoby, Hemming and Schwartz, 2007).
8 If the incentives to compete are diluted, the cost of infrastructure rises and quality may be poorer (Engel, Fischer and Galetovic, 2008). This consideration arises from the fact that in some countries foreign firms cannot compete, for example. Genuine competition is not enough, however, if there is a high risk of renegotiation once the investment has been made.
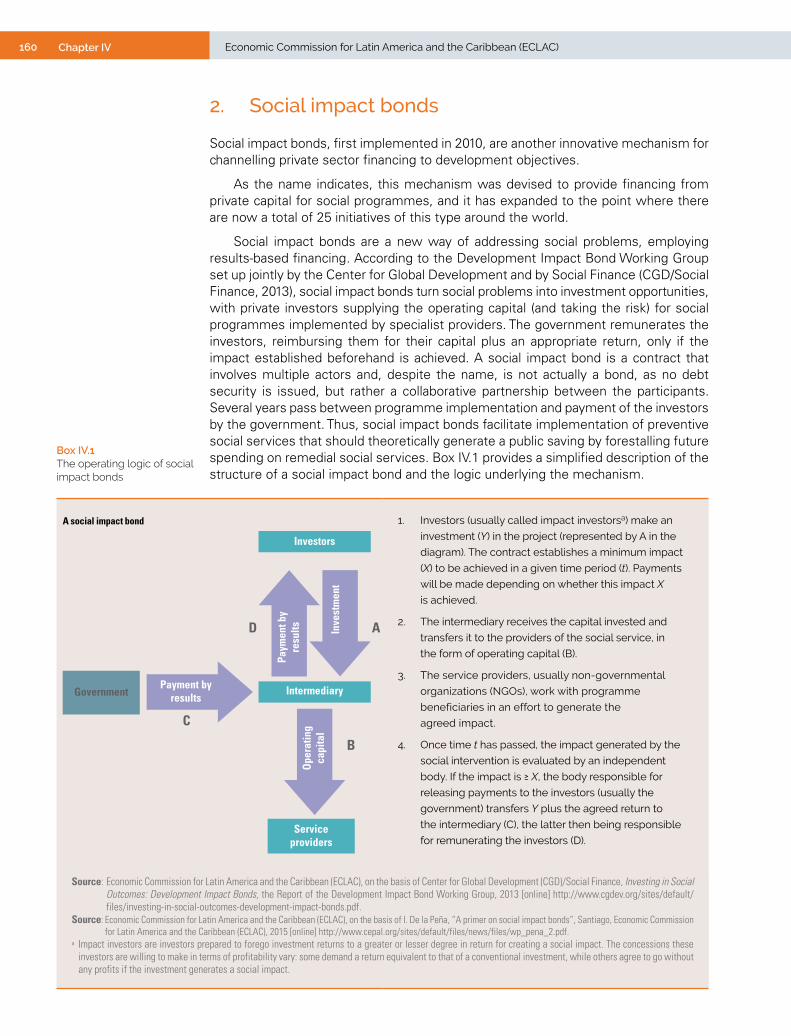
160 Chapter IV Economic Commission for Latin America and the Caribbean (ECLAC)
2. Social impact bonds
Social impact bonds, first implemented in 2010, are another innovative mechanism for channelling private sector financing to development objectives.
As the name indicates, this mechanism was devised to provide financing from private capital for social programmes, and it has expanded to the point where there are now a total of 25 initiatives of this type around the world.
Social impact bonds are a new way of addressing social problems, employing results-based financing. According to the Development Impact Bond Working Group set up jointly by the Center for Global Development and by Social Finance (CGD/Social Finance, 2013), social impact bonds turn social problems into investment opportunities, with private investors supplying the operating capital (and taking the risk) for social programmes implemented by specialist providers. The government remunerates the investors, reimbursing them for their capital plus an appropriate return, only if the impact established beforehand is achieved. A social impact bond is a contract that involves multiple actors and, despite the name, is not actually a bond, as no debt security is issued, but rather a collaborative partnership between the participants. Several years pass between programme implementation and payment of the investors by the government. Thus, social impact bonds facilitate implementation of preventive social services that should theoretically generate a public saving by forestalling future spending on remedial social services. Box IV.1 provides a simplified description of the structure of a social impact bond and the logic underlying the mechanism.
Investors
Intermediary
Service providers
GovernmentPayment by
results
Paym
ent b
y re
sults In
vest
men
t
Ope
ratin
gca
pita
l
D A
B
C
A social impact bond 1. Investors (usually called impact investorsa) make an
investment (Y) in the project (represented by A in the
diagram). The contract establishes a minimum impact
(X) to be achieved in a given time period (t). Payments
will be made depending on whether this impact X
is achieved.
2. The intermediary receives the capital invested and
transfers it to the providers of the social service, in
the form of operating capital (B).
3. The service providers, usually non-governmental
organizations (NGOs), work with programme
beneficiaries in an effort to generate the
agreed impact.
4. Once time t has passed, the impact generated by the
social intervention is evaluated by an independent
body. If the impact is ≥ X, the body responsible for
releasing payments to the investors (usually the
government) transfers Y plus the agreed return to
the intermediary (C), the latter then being responsible
for remunerating the investors (D).
Source: Economic Commission for Latin America and the Caribbean (ECLAC), on the basis of Center for Global Development (CGD)/Social Finance, Investing in Social Outcomes: Development Impact Bonds, the Report of the Development Impact Bond Working Group, 2013 [online] http://www.cgdev.org/sites/default/files/investing-in-social-outcomes-development-impact-bonds.pdf.
Source: Economic Commission for Latin America and the Caribbean (ECLAC), on the basis of I. De la Peña, “A primer on social impact bonds”, Santiago, Economic Commission for Latin America and the Caribbean (ECLAC), 2015 [online] http://www.cepal.org/sites/default/files/news/files/wp_pena_2.pdf.
a Impact investors are investors prepared to forego investment returns to a greater or lesser degree in return for creating a social impact. The concessions these investors are willing to make in terms of profitability vary: some demand a return equivalent to that of a conventional investment, while others agree to go without any profits if the investment generates a social impact.
Box IV.1 The operating logic of social impact bonds
161Chapter IVEconomic Survey of Latin America and the Caribbean • 2016
Social impact bonds have proliferated in recent years: the first was in Peterborough in the United Kingdom in 2010, and it was followed by another 14 projects during 2012, in the United Kingdom and the United States. A total of 25 social impact bonds were in place worldwide in 2014, raising over US$ 100 million. Moreover, in March 2014 the Multilateral Investment Fund of the Inter-American Development Bank (IDB) launched a US$ 5.3 million programme to develop social impact bonds in Latin America (Levey, 2014).
The potential advantages of social impact bonds for project participants, and for society at large, explain the interest they have aroused in recent years. For example, governments have a limited financing capacity and often face budget restrictions; in this situation, social impact bonds provide a new financing mechanism where the risk is taken on by the investors so that governments do not need to mobilize capital immediately, but can plan out their budget years in advance to anticipate payments to investors.
Social impact bonds rely on complementarity between the different agents’ comparative advantages, and on the creation of incentives for each of them. Governments select the social problems and ultimately finance the projects, investors take on the risk and provide the operating capital, and social service providers work with the beneficiaries. The financing of social services by private investors has a number of positive aspects. For example, it creates an incentive for investors to pick the most effective programmes, creating a “market” selection and thus increasing the quality of social interventions. It is also in investors’ interest to promote dialogue between the different agents, gather and process data and set up performance management systems, with positive effects for the whole programme.
Despite the advantages that adopting social impact bonds in Latin America could bring, it has to be asked whether this model can be transferred to the region. Currently, virtually all social impact bonds are in developed countries, which are very different from those of Latin America socially, economically, politically and institutionally. This means that there are specific challenges for the implementation of this mechanism in a developing region such as Latin America and the Caribbean. A second challenge is the institutional context, which varies between the region’s different countries, particularly by comparison with that in the developed countries where social impact bonds have already been implemented. Furthermore, it is possible that a section of public opinion might perceive social impact bonds as a mechanism for privatizing public services, potentially resulting in major opposition to such projects. Lastly, because the impact investment market is still incipient in Latin America and the Caribbean, there is the question of how social impact bonds are to be financed and how much demand there will be for them among the region’s investors.
The support of multilateral organizations at the early stages of the implementation of social impact bonds, like that now being provided by IDB in Latin America, could be an important factor in overcoming these challenges. In particular, these bodies can play a role, for example, in educating public opinion and giving legitimacy to proposed social impact bonds in the face of any distrust they might arouse. They could also support case studies dealing with changes to current institutional arrangements that would be needed before social impact bonds were implemented in the different countries of the region.

162 Chapter IV Economic Commission for Latin America and the Caribbean (ECLAC)
BibliographyAkitoby, B., R. Hemming and G. Schwartz (2007), Public Investment and Public-Private Partnerships,
Economic Issues, No. 40, International Monetary Fund (IMF) [online] https://www.imf.org/External/Pubs/FT/issues/issues40/ei40.pdf.
Alborta, G., C. Stevenson and S. Triania (2011), “Asociaciones público-privadas para la prestación de servicios: una visión hacia el futuro”, Documento de Debate, No. IDB-DP-195 Washington, D.C., Inter-American Development Bank (IDB).
Aviva (2014), A Roadmap for Sustainable Capital Markets: How can the UN Sustainable Development Goals harness the global capital markets? [online] https://sustainabledevelopment.un.org/content/documents/10574avivabooklet.pdf.
BIS (Bank for International Settlements) (2015), “Derivative Statistics” [online] http://www.bis.org/statistics/about_derivatives_stats.htm.
CGD/Social Finance (Center for Global Development/Social Finance) (2013), Investing in Social Outcomes: Development Impact Bonds, the Report of the Development Impact Bond Working Group [online] http://www.cgdev.org/sites/default/files/investing-in-social-outcomes-development-impact-bonds.pdf.
De la Peña, I. (2015), “A primer on social impact bonds”, Santiago, Economic Commission for Latin America and the Caribbean (ECLAC) [online] http://www.cepal.org/sites/default/files/news/files/wp_pena_2.pdf.
Deutsche Bank (2014), “The Random Walk Mapping of the World’s Financial Markets 2014” [online] https://etf.deutscheam.com/DEU/DEU/Download/Research-Global/47e36b78-d254-4b16-a82f-d5c5f1b1e09a/Mapping-the-World-s-Financial-Markets.pdf.
Engel, E. R. Fischer and A. Galetovic (2008), “Public-private partnerships: when and how”, Documento de Trabajo, No. 257, Santiago [online] http://www.econ.uchile.cl/uploads/publicacion/c9b9ea69d84d4c93714c2d3b2d5982a5ca0a67d7.pdf.
FSB (Financial Stability Board) (2014), “Who are the Standard-Setting Bodies?”.Helleiner, E. (2010), “The Financial Stability Board and International Standards”, CIGI G20 Paper,
No.1 [online] https://www.cigionline.org/sites/default/files/g20_no_1_2.pdf.IMF (International Monetary Fund) (2014), “Reports on the Observance of Standards and Codes
(ROSCs)” [online] https://www.imf.org/external/NP/rosc/rosc.aspx.Kar, D. and B. LeBlanc (2013), Illicit Financial Flows from Developing Countries: 2002-2011,
Global Financial Integrity [online] http://iff.gfintegrity.org/iff2013/Illicit_Financial_Flows_from_Developing_Countries_2002-2011-HighRes.pdf.
Levey, Z. (2014), “FAQ – Social Impact Bonds in Latin America and New MIF Pilot Program”, Multilateral Investment Fund (MIF) [online] http://www.fomin.org/en-us/Home/FOMINblog/Blogs/DetailsBlog/ArtMID/13858/ArticleID/2265/FAQ-%E2%80%93-Social-Impact-Bonds-in-Latin-America-and-New-MIF-Pilot-Program.aspx.
McCauley, R. and others (2015), “Global dollar credit. Links to US monetary policy and leverage”, BIS Working Paper, No. 483, Bank for International Settlements.
Ocampo, J.A. (2015), “América Latina frente a la turbulencia económica mundial”, Neoestructuralismo y corrientes heterodoxas a inicios del siglo XXI, A. Bárcena and A. Prado (eds.), Libros de la CEPAL, No. 132 (LC/G.2633-P/Rev.1), Santiago, Economic Commission for Latin America and the Caribbean (ECLAC).
OECD (Organization for Economic Cooperation and Development) (2016), “Development Finance Statistics” [online] http://www.oecd.org/development/stats/.(2014), Better Policies for Development 2014. Policy Coherence and Illicit Financial Flows, Paris.
Payne, R. and others (2014), “Policy Options for Addressing Illicit Financial Flows: Results from a Delphi Study” [online] http://academicsstand.org/wp-content/uploads/2014/09/Policy-Options-for-addressing-Illicit-Financial-Flows-Results-from-a-Delphi-Study.pdf.
PwC (2014), “Lecciones de América Latina: primeras experiencias con Asociaciones Público-Privadas en el Sector Salud”, San Francisco [online] http://www.pwc.com/mx/es/industrias/archivo/2014-06-lecciones-aprendidas.pdf.
Rojas-Suárez, L. (2002), “International Standards for Strengthening Financial Systems: Can Regional Development Banks Address Developing Countries’ Concerns?” [online] http://www.new-rules.org/storage/documents/ffd/rojas-suarez-2.pdf.
VCHAPTER
Financial inclusion and innovation
Introduction
A. Financial inclusion should be conceived as part of a policy on production development
B. Financial inclusion: unfinished business for Latin America and the Caribbean
C. Causes of the financial inclusion gap in Latin America
D. Rethinking financial innovation: a requirement for closing the financial inclusion gap
E. Conclusions
Bibliography
Annex V.A1


165Chapter VEconomic Survey of Latin America and the Caribbean • 2016 VIntroduction
Over the past three decades, the financial sector has boomed in advanced and developing countries alike, resulting in higher employment, faster wage growth in the financial sector compared with the rest of the economy, and an increased volume of financial assets. The sector also boosted its share of overall GDP and made a stronger contribution to economic growth.
Yet the financial sector’s growing importance and greater financial “deepening” do not necessarily translate into progress in financial development, which requires the design and construction of an inclusive financial system aimed at productive financing.
Inclusiveness is a prerequisite for financial systems to work in favour of sustainable economic and social development. In non-inclusive systems, small businesses and low-income individuals are unable to access financial services; these systems also exhibit wide gender gaps in terms of their access and use.
By contrast, inclusive financial systems provide services to those without recourse to formal financial sector, and therefore help to reduce poverty and inequality and to close gender gaps in access.
In addition to raising the present low levels of financial access and banking penetration in the region, inclusiveness also refers to enhancing and optimizing the use of the financial system by existing participants in formal financial channels.
Financial innovation may serve as a catalyst for the financial inclusion of households and businesses through the greater densification of the financial system. In the policy sphere, this means fostering innovation by introducing new skills, capacities and procedures to increase efficiency, including technological and methodological improvements and changes in forms of intermediation. There is also a need to develop new financial products to meet demand from households and companies.
Strengthening financial inclusion through innovation requires an effort to coordinate public and private agendas in respect of development goals and priorities. Spaces and mechanisms should therefore be created so that public policies can attract and channel private sector endeavours, with the right context and incentives, towards achieving inclusive development goals.
In that regard development banks are a key instrument whose presence should be reinforced, given their capacity as second-tier banks to mobilize resources for long-term financing covering various income groups, and because they complement the commercial activities of private banks. Development banks also increase the availability of and access to financing sources and mechanisms for business, and are capable of deploying them according to the requirements, characteristics and risks inherent to different production activities.
This chapter comprises four sections. Section A defines financial inclusion conceived as an economic participation and development policy, and explains its importance.
Section B examines the stylized facts of financial inclusion in Latin America and the Caribbean, noting in particular that 45.8% of the region’s population currently has access to formal financial institutions, below the 71.6% posted by Asia and the Pacific and the average of 96.3% for advanced countries, respectively. Moreover, the differential in access between low-income and high-income groups is higher in Latin America and the Caribbean than in other world regions. In the production sector, 45.7% of small businesses had access to financing from the formal financial system; the figure for large businesses was over 65%.

166 Chapter V Economic Commission for Latin America and the Caribbean (ECLAC)
Section C explains the gaps in financial inclusion based on the difficulties encountered by small- and medium-sized enterprises (SMEs) in accessing external financing, given the high risk entailed by their small size and limited resources. It also underscores the need to consider the characteristics of the financial system in Latin America, which is shallow and underdeveloped, short-termist and lacking in financial instruments; features reflected in the low level of intermediation geared to the production sector.
Section D argues that closing the financial inclusion gap requires the rethinking of innovation. Financial innovation is defined as the creation of new financial markets, institutions, processes and products, and is subsequently compared with innovation in other economic sectors, illustrating differences and similarities. Lastly, the section sets out a vision of financial innovation as a public good, and gives examples of how it may be operationalized as such.
A. Financial inclusion should be conceived as part of a policy on production development
Financial inclusion encompasses all public and private, supply- and demand-side initiatives to provide products and services appropriate to the needs of households and SMEs that are traditionally excluded from the formal financial sector. In addition to boosting levels of financial access and banking penetration, financial inclusion also relates to policies to enhance the use of the financial system by the SMEs and households that already participate in formal financial channels.
Accordingly, financial inclusion is by no means a social welfare mechanism for reducing poverty and improving living conditions, but rather should be conceived as a policy of integration into the economy.
This means using the financial system as an instrument for expanding the potential for savings and consumption, while at the same time taking fuller advantage of business talent and investment opportunities. Financial inclusiveness thus allows the financial system to respond to the disparate financing needs of households at different stages of the human life cycle, and of businesses at different stages of productive and technological advancement.
Inclusiveness is a prerequisite if financial systems are to work in favour of sustainable economic and social development. In non-inclusive systems, small businesses and low-income individuals are unable to access financial services and are forced to rely solely on their own resources, which contributes to the entrenchment of inequalities.
When firms’ access to external financing is limited, their production capacity and ability to grow and prosper are also constrained, since they must draw on their own resources to finance operations. Moreover, the evidence suggests that SMEs chiefly use the financial system for deposits and as a payment method, while their use of credit products is much more limited, potentially restricting the enterprises’ capacity for future expansion and growth.
This context gives rise to a vicious circle that keeps smaller production units in a constant state of vulnerability and low growth, with serious economic and social consequences. Small firms represent the bulk of businesses and account for most of the jobs created in the private sector. For both Latin America and Europe, they make up 99% of the production structure and absorb between 19% and 50% of the total workforce (see table V.1). For this reason the lack of financial inclusion, by significantly hampering the performance of small businesses, has a severe impact on the income and working conditions of a large segment of the population.

167Chapter VEconomic Survey of Latin America and the Caribbean • 2016
Table V.1 Latin America (selected countries) and the European Union: enterprises and employment by size, 2011a
(Percentages)
CountryEnterprises Employment
Microenterprises SMEs Large enterprises Microenterprises SMEs Large enterprises
Argentina 69.7 28.4 1.9 11.5 39.6 48.9
Brazil 90.1 9.3 0.6 13.7 28.3 58.0
Chile 78.3 20.3 1.4 44.1 30.9 25.0
Colombia 96.4 3.5 0.1 50.6 30.3 19.1
Ecuador 95.4 4.4 0.2 47.3 29.8 22.9
El Salvador 91.2 8.4 0.4 37.8 27.7 34.6
Mexico 95.5 4.3 0.2 45.7 23.6 30.8
Peru 94.5 4.9 0.6 48.5 19.2 32.4
Uruguay 83.4 16.1 0.5 24.1 43.1 32.8
EU (25)b 92.0 7.8 0.2 31.5 38.3 30.2
Belgium 93.7 6.2 0.1 34.8 38.4 26.8
Czech Republic 96.0 3.8 0.1 32.8 37.6 29.6
France 94.7 5.1 0.1 31.8 35.1 33.1
Germany 82.0 17.5 0.4 19.5 44.0 36.5
Italy 95.0 4.9 0.1 48.5 33.4 18.1
Spain 94.0 5.9 0.1 41.5 35.1 23.4
United Kingdom 89.7 10.0 0.3 19.8 37.0 43.2
Source: Economic Commission for Latin America and the Caribbean (ECLAC) (2016). a 2011 or latest available year. For Argentina, 2012 data based on information from the Employment and Business Dynamics
Observatory (OEDE) (2013). For Brazil, 2010 data based on information from the Brazilian Geographical and Statistical Institute (IBGE) (2012). For Chile, data for companies based on information from the International Labour Organization (ILO) and the Technical Cooperation Service (SERCOTEC) (2010) for 2008, and employment data based on the National Socioeconomic Survey (CASEN) for 2009. For Colombia, 2005 data based on information from the National Administrative Department of Statistics (DANE) (2008). For Ecuador, 2009 data based on information from the Chamber of Industries and Production (2011). For El Salvador, 2005 data based on information from the Ministry of Economic Affairs (MINEC) and the Directorate-General of Statistics and Censuses (DIGESTYC) (2006). For Mexico, 2009 data based on information from the National Institute of Statistics and Geography (INEGI) (2011). For Peru, 2007 data based on information from the National Institute of Statistics and Informatics (INEI) (2011). For Uruguay, 2012 data based on information from the National Institute of Statistics (INE) (2013).
b EU (25) comprises Austria, Belgium, Bulgaria, Czech Republic, Denmark, Estonia, Finland, France, Germany, Greece (information from 2009), Hungary, Ireland, Italy, Latvia, Lithuania, Luxembourg, Netherlands, Poland, Portugal, Romania, Slovakia, Slovenia, Spain, Sweden and United Kingdom.
B. Financial inclusion: unfinished business for Latin America and the Caribbean
An analysis of financial inclusion in Latin America and the Caribbean reveals that the region’s households have narrow and uneven access to the formal financial system, and that only a limited number of instruments and mechanisms exist for improving the financial integration of production agents already participating in the system.
The available data show that Latin America and the Caribbean is one of the regions of the world with the lowest levels of household financial inclusion (see figure V.I). On average, fewer than half (45.8%) of the region’s adults over the age of 15 have at least one account at a financial institution, meaning that about 185 million people remain without access to formal financial services (CAF, 2011). This figure is below the global average (61%) and well below the average posted in developed regions such as North America and the Western Europe (approximately 93.3% in both cases) and in most developing regions, including East Asia and the Pacific (71.6%), Western Europe and Central Asia (58.2%) and the Middle East and North Africa (52.8%).
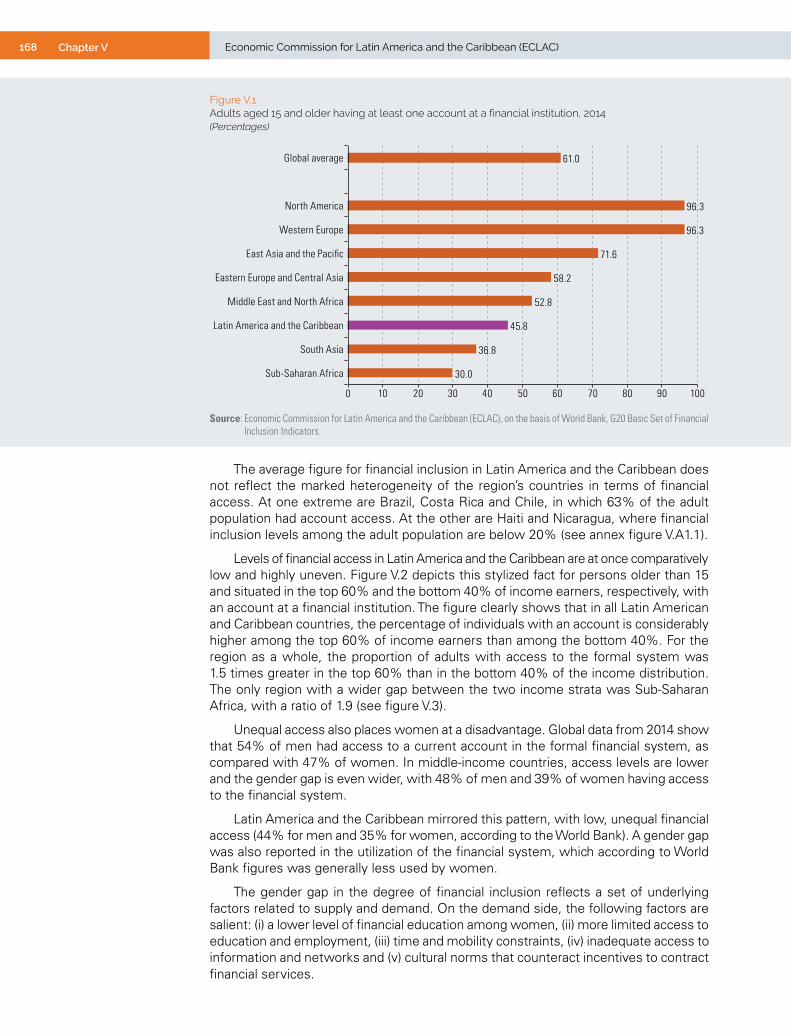
168 Chapter V Economic Commission for Latin America and the Caribbean (ECLAC)
Figure V.1 Adults aged 15 and older having at least one account at a financial institution, 2014(Percentages)
30.0
36.8
45.8
52.8
58.2
71.6
96.3
96.3
61.0
0 10 20 30 40 50 60 70 80 90 100
Sub-Saharan Africa
South Asia
Latin America and the Caribbean
Middle East and North Africa
Eastern Europe and Central Asia
East Asia and the Pacific
Western Europe
North America
Global average
Source: Economic Commission for Latin America and the Caribbean (ECLAC), on the basis of World Bank, G20 Basic Set of Financial Inclusion Indicators.
The average figure for financial inclusion in Latin America and the Caribbean does not reflect the marked heterogeneity of the region’s countries in terms of financial access. At one extreme are Brazil, Costa Rica and Chile, in which 63% of the adult population had account access. At the other are Haiti and Nicaragua, where financial inclusion levels among the adult population are below 20% (see annex figure V.A1.1).
Levels of financial access in Latin America and the Caribbean are at once comparatively low and highly uneven. Figure V.2 depicts this stylized fact for persons older than 15 and situated in the top 60% and the bottom 40% of income earners, respectively, with an account at a financial institution. The figure clearly shows that in all Latin American and Caribbean countries, the percentage of individuals with an account is considerably higher among the top 60% of income earners than among the bottom 40%. For the region as a whole, the proportion of adults with access to the formal system was 1.5 times greater in the top 60% than in the bottom 40% of the income distribution. The only region with a wider gap between the two income strata was Sub-Saharan Africa, with a ratio of 1.9 (see figure V.3).
Unequal access also places women at a disadvantage. Global data from 2014 show that 54% of men had access to a current account in the formal financial system, as compared with 47% of women. In middle-income countries, access levels are lower and the gender gap is even wider, with 48% of men and 39% of women having access to the financial system.
Latin America and the Caribbean mirrored this pattern, with low, unequal financial access (44% for men and 35% for women, according to the World Bank). A gender gap was also reported in the utilization of the financial system, which according to World Bank figures was generally less used by women.
The gender gap in the degree of financial inclusion reflects a set of underlying factors related to supply and demand. On the demand side, the following factors are salient: (i) a lower level of financial education among women, (ii) more limited access to education and employment, (iii) time and mobility constraints, (iv) inadequate access to information and networks and (v) cultural norms that counteract incentives to contract financial services.
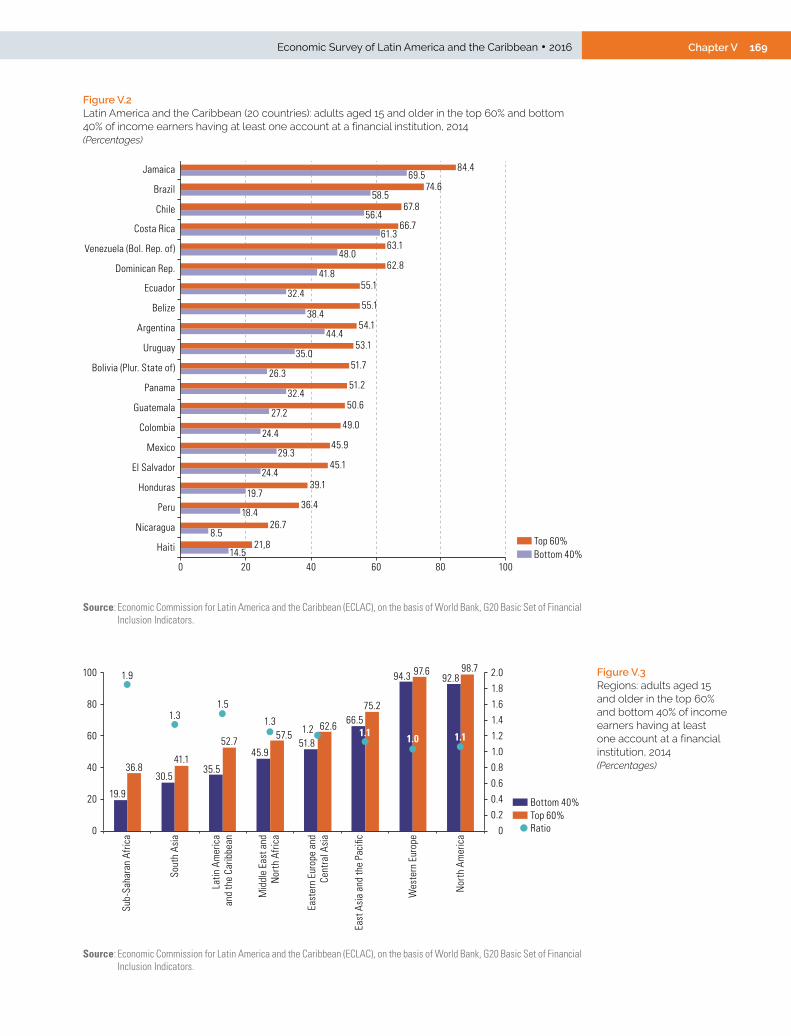
169Chapter VEconomic Survey of Latin America and the Caribbean • 2016
Figure V.2 Latin America and the Caribbean (20 countries): adults aged 15 and older in the top 60% and bottom 40% of income earners having at least one account at a financial institution, 2014 (Percentages)
14.5
8.5
18.4
19.7
24.4
29.3
24.4
27.2
32.4
26.3
35.0
44.4
38.4
32.4
41.8
48.0
61.3
56.4
58.5
69.5
21,8
26.7
36.4
39.1
45.1
45.9
49.0
50.6
51.2
51.7
53.1
54.1
55.1
55.1
62.8
63.1
66.7
67.8
74.6
84.4
0 20 40 60 80 100
Haiti
Nicaragua
Peru
Honduras
El Salvador
Mexico
Colombia
Guatemala
Panama
Bolivia (Plur. State of)
Uruguay
Argentina
Belize
Ecuador
Dominican Rep.
Venezuela (Bol. Rep. of)
Costa Rica
Chile
Brazil
Jamaica
Top 60%Bottom 40%
Source: Economic Commission for Latin America and the Caribbean (ECLAC), on the basis of World Bank, G20 Basic Set of Financial Inclusion Indicators.
Figure V.3 Regions: adults aged 15 and older in the top 60% and bottom 40% of income earners having at least one account at a financial institution, 2014(Percentages)
19.9
30.535.5
45.951.8
66.5
94.3 92.8
36.841.1
52.7 57.562.6
75.2
97.6 98.71.9
1.31.5
1.31.2 1.1 1.0 1.1
0
0.2
0.4
0.6
0.8
1.0
1.2
1.4
1.6
1.8
2.0
0
20
40
60
80
100
Sub-
Saha
ran
Afric
a
Sout
h As
ia
Latin
Am
eric
aan
d th
e Ca
ribbe
an
Mid
dle
East
and
Nor
th A
frica
East
ern
Euro
pe a
nd C
entr
al A
sia
East
Asi
a an
d th
e Pa
cific
Wes
tern
Eur
ope
Nor
th A
mer
ica
Bottom 40%Top 60%Ratio
Source: Economic Commission for Latin America and the Caribbean (ECLAC), on the basis of World Bank, G20 Basic Set of Financial Inclusion Indicators.

170 Chapter V Economic Commission for Latin America and the Caribbean (ECLAC)
Supply-side factors include: (i) regulatory and legal barriers that inhibit the creation of gender-differentiated financial mechanisms and products; (ii) financial infrastructure limitations, such as the lack of information for potential women borrowers, or strict collateral frameworks that prevent women from accessing the formal financial system; (iii) gender biases in the practices of formal institutions, and (iv) financial products, market strategies and services that are not adapted to the needs of potential female clients.
In the production sector, SMEs have low levels of access to the formal financial system, while a gulf exists between small and large enterprises. The available data show that on average in Latin America and the Caribbean, just over 45% of small businesses are able to access credit provided by formal financial institutions (see figure V.4).
Figure V.4 Regions: enterprises with a bank loan or line of credit, 2014(Percentages)
5.6
21.2
36.3
28.2
41.645.7
50.3
20.7
45.3
56.058.0
63.167.8 66.9
0
10
20
30
40
50
60
70
80
Mid
dle
East
and
Nor
th A
frica
Sub-
Saha
ran
Afric
a
East
Asi
a an
d th
e Pa
cific
Sou
th A
sia
East
ern
Euro
pe a
nd C
entr
al A
sia
Latin
Am
eric
a an
dth
e Ca
ribbe
an
High
-inco
me
regi
ons
Small enterprisesLarge enterprises
Source: Economic Commission for Latin America and the Caribbean (ECLAC), on the basis of World Bank, G20 Basic Set of Financial Inclusion Indicators.
SMEs also had low levels of access in other regions of the developing world. In fact, in most of these regions, including the Middle East and North Africa, Sub-Saharan Africa, East Asia and the Pacific and South Asia, the percentage of small businesses with access to bank loans or lines of credit was below 40%.
Low access levels among small businesses contrast with those of large firms. Figure V.4 shows that in Latin America and the Caribbean, 67.8% of large companies had access to the formal financial system, equivalent to 1.5 times the level of access reported by small firms.
Moreover, SMEs mainly use the financial system to make deposits and as a payment method, rather than to obtain credit products. As table V.2 shows, on average in Latin America 93.57% of SMEs used current accounts, while only 36.88% used lines of credit and 23.42% term loans. This unbalanced use of the financial system restricts SMEs’ capacity for expansion and future growth (see table V.2).

171Chapter VEconomic Survey of Latin America and the Caribbean • 2016
Table V.2 Latin America (selected countries): banking products used by SMEs, 2010(Percentages of SMEs)
Banking products used Argentina Chile Colombia Mexico Peru Venezuela (Bolivarian Republic of) Latin America
Savings products
Current accounts 100.0 100.0 86.90 95.80 89.70 84.60 93.57
Savings accounts ... ... 71.10 ... 52.50 34.30 55.20
Term deposits 12.50 22.80 11.00 11.90 6.00 1.40 12.09
Mutual funds 2.00 27.90 4.10 6.70 0.90 0.50 6.33
Investment products 1.40 4.40 2.90 5.40 0.40 0.50 3.71
None of the above 0.00 0.00 0.00 0.00 0.00 0.00 0.00
Financial products
Lines of credit 25.70 75.10 29.40 29.80 18.00 ... 36.88
None 30.80 13.20 29.80 64.00 29.10 51.30 34.27
Term loans N/A 23.40 40.50 ... 6.50 7.50 23.42
Short-term loans 38.70 ... ... ... ... 2.80 20.75
Overdrafts 28.80 ... ... 4.30 20.60 0.70 18.88
Credit cards ... ... 13.90 ... 11.20 ... 12.55
Cheque discounting 35.40 5.10 2.70 1.40 10.10 3.40 11.11
Asset-based term loans 4.40 18.80 ... 2.70 ... 0.30 6.55
Leases 4.30 12.60 8.90 1.20 5.90 0.30 6.50
Letters of credit 2.10 14.60 1.00 1.50 7.80 0.30 5.87
Trade finance 2.90 13.20 5.60 2.00 5.20 3.00 5.19
Loans with public programmes or guarantees 2.70 8.10 ... ... ... 0.30 3.55
Factoring 1.60 7.50 1.80 1.10 1.70 0.30 2.33
Other products
Tax payments 57.20 60.10 59.70 48.70 90.90 0.70 52.88
Insurance 63.10 45.00 48.30 23.50 62.30 0.00 43.84
Other in-branch payments 49.20 26.20 36.30 ... 45.80 ... 38.32
Payments to suppliers and third parties 22.50 23.60 36.90 49.70 56.00 0.00 32.41
Wage payments 52.70 23.80 45.20 37.50 12.40 8.20 31.06
Other services
Internet banking 53.90 73.00 61.70 50.90 38.00 98.10 62.26
Transfers 49.80 35.60 53.20 36.10 92.00 0.60 43.40
Direct debits 40.60 35.00 18.50 19.00 27.30 2.10 23.51
Debit cards 28.60 29.20 20.30 ... 32.20 1.10 22.27
Executive credit cards 14.00 14.60 13.50 9.60 ... 0.10 13.00
Foreign exchange 16.40 17.10 10.00 12.70 22.00 1.60 11.70
Accounts receivable collection 13.30 4.90 ... ... 5.80 ... 7.18
None of the above 2.00 4.40 5.50 5.90 0.10 0.00 2.99
Source: Development Bank of Latin America (CAF), Servicios financieros para el desarrollo: promoviendo el acceso en América Latina, 2011 [online] https://www.caf.com/media/3895/RED2011.pdf.

172 Chapter V Economic Commission for Latin America and the Caribbean (ECLAC)
C. Causes of the financial inclusion gap in Latin America
The financial inclusion gap may be explained by two sets of factors that limit the access of households and SMEs to financing. This section places special emphasis on the difficulties that directly concern SMEs and the characteristics of the financial system in Latin America and the Caribbean, including the lack of incentives for turning sources of financing towards SMEs.
1. Difficulties of SMEs
The difficulties that directly concern SMEs stem from their small size, limited resources and narrow production base, factors which restrict access to external credit. Owing to these characteristics, their production costs, risk levels and financing costs are higher than those of larger enterprises, as reflected in the steep collateral or guarantee requirements demanded of SMEs to access external sources of financing.
Collateral, which mostly consists in real estate and other fixed assets held by the company, is transferred to the banks in the event on non-compliance with the terms of the loan repayment. Such guarantees are demanded owing to insufficient financial information about SMEs, their lack of a credit history and the informal components that generally characterize them, presenting a major barrier for these enterprises when applying to access credit.
Figure V.5 shows the value of the guarantee required to secure a loan, according to the size of the applicant company in different regions. Latin America and the Caribbean is one of the regions with the highest collateral requirements for small businesses seeking loans, with guarantees on average amounting to 234.6% of the requested loan amount. This figure exceeds the global average of 209.8%.
Figure V.5 Selected regions: value of collateral required to obtain a loan, by size of applicant company, 2010-2015a
(Percentages of loan amount)
0
50
100
150
200
250
300
Sub-
Saha
ran
Afric
a
Latin
Am
eric
a an
d th
e Ca
ribbe
an
Sout
h-Ea
st A
sia
Mid
dle
East
and
Nor
th A
frica
East
Asi
a an
d th
e Pa
cific
East
ern
Euro
pe a
nd C
entr
al A
sia
Wor
ld
Ecua
dor
Mex
ico
SmallenterprisesMedium-sizedenterprisesLargeenterprises
136.67172.81
134.53159.08
134.80
209.80
234.20 243.20234.60
Source: Economic Commission for Latin America and the Caribbean (ECLAC), on the basis of World Bank, “Enterprise Surveys Data”, 2015; Organization for Economic Cooperation and Development (OECD); and ECLAC, Economic Survey of Latin America and the Caribbean, 2015, (LC/G.2645-P), Santiago.
a Regional averages according to the latest available figures.

173Chapter VEconomic Survey of Latin America and the Caribbean • 2016
Far from being static, collateral requirements may vary over time and according to the circumstances, becoming an even greater obstacle during economic slowdowns and crises. This may be illustrated using a density function of the value of collateral furnished by enterprises as a percentage of total debt issued in 2006 and 2010. 2006 occurred during one of the periods of fastest economic growth that Latin America and the Caribbean has experienced in the last three decades (2003-2007), while in 2010 the region was feeling the after-effects of the global financial crisis.
Figure V.6 shows the long tail of the collateral distribution, owing to the existence of a set of large values outside the sample.1 It also shows that the collateral distribution shifted dramatically between 2006 and 2010, with the average value increasing from 150% to 295%. The figure also indicates greater dispersion in 2010, with a standard deviation of 646% (as against 168% in 2006). The doubling of the average value of guarantees, and the spectacular increase in their dispersion, were characteristic of the effects of the global financial crisis in Latin America and the Caribbean, illustrating how the average value of collateral may change according to the business cycle and therefore affect SMEs as the most vulnerable production units.
1 In 95% of observations the value of collateral was less than 500% of debt issued, while in the remaining 5% of observations values ranged from 501% to 13,300%.
Figure V.6 Latin America (13 countries):a density function of the value of guarantees as a percentage of debt issued, 2006 and 2010(Percentages)
0
5
10
15
20
25
30
0 6 12 18 24 30 36 42 48 54 60 66 72 78 84 90 96 102 108 114 120 126 132
Value of guarantee as a percentage of debt
Perc
enta
ge o
f obs
erva
tions
20062010
Source: E. Pérez Caldentey and A. González, “Inversión, financiamiento y la paradoja de la deuda en Minsky. Un análisis microeconométrico aplicado a América Latina”, Ensayos Económicos, vol. 1, No. 73, Buenos Aires, Central Bank of Argentina, December 2015.
a Argentina, Bolivarian Republic of Venezuela, Chile, Colombia, Ecuador, El Salvador, Guatemala, Mexico, Panama, Paraguay, Peru, Plurinational State of Bolivia, Uruguay.
2. Characteristics and functioning of the financial system in Latin America
A second explanation of the financial inclusion gap in Latin America and the Caribbean may be found in the characteristics of the region’s financial system. As ECLAC (2015) has pointed out, this system is shallow and underdeveloped, highly concentrated, short-termist and lacking in financial instruments. In Latin America and the Caribbean, on average commercial banking accounts for more than 90% of the financial system’s assets, with the bulk of the portfolio held by the main commercial banks.

174 Chapter V Economic Commission for Latin America and the Caribbean (ECLAC)
Figure V.7 shows the proportion of total financial system assets held by the region’s five main banks in a number of Latin American countries: a share that in most cases amounted to about 70% or higher.
Figure V.7 Latin America (selected countries): proportion of total financial system assets held by the five main banks, 2006-2015(Percentages)
68.79 72.89 73.22 72.81 70.63
86.48
73.4268.85
0
10
20
30
40
50
60
70
80
90
100
Colombia2014
Uruguay2006
Chile2015
Ecuador2015
Bolivia(Plur. State of)
2008
Peru2015
Mexico2010
Paraguay2015
Source: Economic Commission for Latin America and the Caribbean (ECLAC), on the basis of official figures.
Partly owing to these characteristics, commercial banks in Latin America and the Caribbean are highly profitable and have no incentive to invest in financially risky areas such as lending to SMEs. In fact, commercial banks tend to prioritize lending to sectors with links to distribution and finance, rather than productive sectors such as manufacturing, in which SMEs have an important presence (see table V.3).
Table V.3 Brazil, Chile, Ecuador, Mexico and Peru: average credit portfolio, by economic sector, 2015
Chile Brazil Ecuador Mexico Peru
Agriculture, hunting, fisheries and forestry 7.6 1.7 7.1 3.6 6.3
Mining 2.9 3.0 1.5 0.0 4.9
Manufacturing 8.5 32.7 20.0 22.0 21.3
Construction 11.4 8.2 7.3 17.5 3.7
Services 27.7 13.6 14.3 30.5 26.5
Commerce and financial services 15.3 21.3 45.1 19.8 29.4
Transport and communications 26.6 11.6 4.4 6.6 7.6
Government 0.0 7.9 0.2 0.1 0.3
Total 100.0 100.0 100.0 100.0 100.0
Source: Economic Commission for Latin America and the Caribbean (ECLAC), on the basis of official information from the respective countries. For Peru: Superintendency of Banking, Insurance and Private Pension Funds Administrators, “Carpeta de cuadros estadísticos del sistema financiero entre los meses de enero y diciembre del 2015” [online] http://www.sbs.gob.pe/app/stats/EstadisticaBoletinEstadistico.asp?p=14#; for Mexico: National Banking and Securities Commission and Secretariat of Finance and Public Credit, “Series acerca de información de las características de cartera de crédito -de 2009 a la fecha - de la banca múltiple y la banca de desarrollo” [online] http://portafoliodeinformacion.cnbv.gob.mx/Paginas/default.aspx; for Brazil: Central Bank of Brazil, “Credit operations outstanding by economic activity”, from 2012 to 2016 [online] https://www3.bcb.gov.br/sgspub/localizarseries/localizarSeries.do?method=prepararTelaLocalizarSeries; for Chile: Superintendency of Banking and Financial Institutions, “Colocaciones regionales por actividad económica entre los meses de enero y diciembre del 2015” [online] http://www.sbif.cl/sbifweb/servlet/InfoFinanciera?indice=4.1&idCategoria=564&tipocont=567; for Ecuador: Superintendency of Banks of the Republic of Ecuador, “Serie anual de volumen de crédito, enero a diciembre de 2015” [online] http://www.superbancos.gob.ec/practg/sbs_index?vp_art_id=39&vp_tip=2&vp_buscr=41.
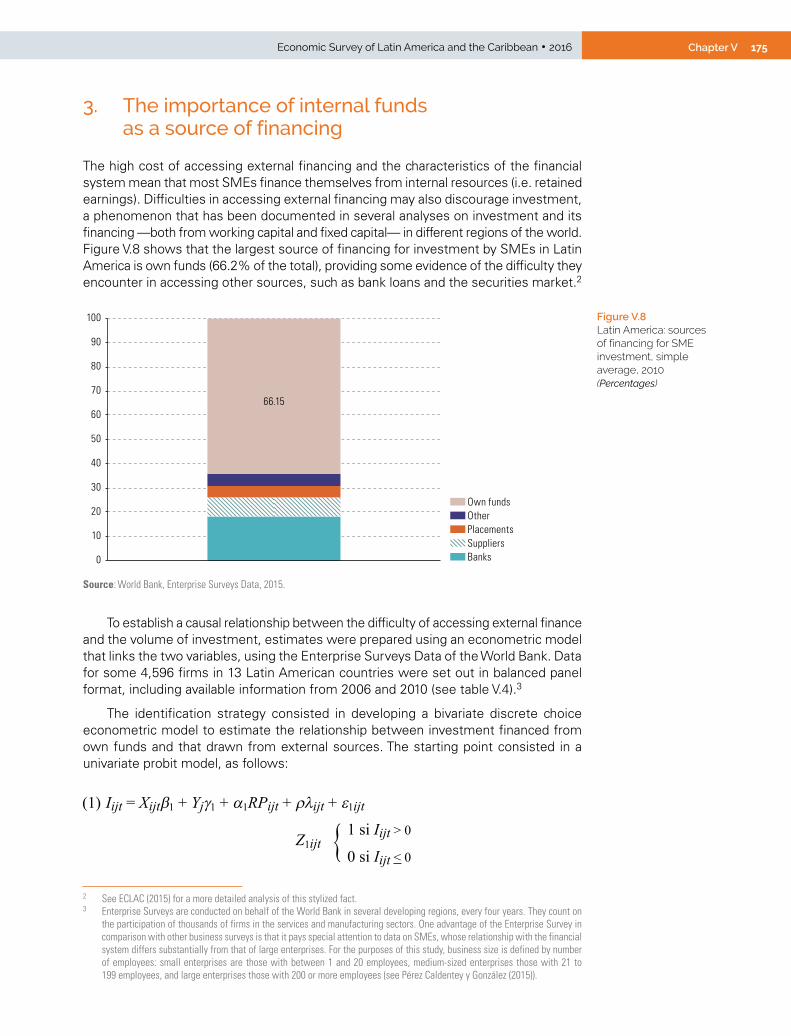
175Chapter VEconomic Survey of Latin America and the Caribbean • 2016
3. The importance of internal funds as a source of financing
The high cost of accessing external financing and the characteristics of the financial system mean that most SMEs finance themselves from internal resources (i.e. retained earnings). Difficulties in accessing external financing may also discourage investment, a phenomenon that has been documented in several analyses on investment and its financing —both from working capital and fixed capital— in different regions of the world. Figure V.8 shows that the largest source of financing for investment by SMEs in Latin America is own funds (66.2% of the total), providing some evidence of the difficulty they encounter in accessing other sources, such as bank loans and the securities market.2
2 See ECLAC (2015) for a more detailed analysis of this stylized fact.
Figure V.8 Latin America: sources of financing for SME investment, simple average, 2010(Percentages)
66.15
0
10
20
30
40
50
60
70
80
90
100
BanksSuppliersPlacementsOtherOwn funds
Source: World Bank, Enterprise Surveys Data, 2015.
To establish a causal relationship between the difficulty of accessing external finance and the volume of investment, estimates were prepared using an econometric model that links the two variables, using the Enterprise Surveys Data of the World Bank. Data for some 4,596 firms in 13 Latin American countries were set out in balanced panel format, including available information from 2006 and 2010 (see table V.4).3
The identification strategy consisted in developing a bivariate discrete choice econometric model to estimate the relationship between investment financed from own funds and that drawn from external sources. The starting point consisted in a univariate probit model, as follows:
3 Enterprise Surveys are conducted on behalf of the World Bank in several developing regions, every four years. They count on the participation of thousands of firms in the services and manufacturing sectors. One advantage of the Enterprise Survey in comparison with other business surveys is that it pays special attention to data on SMEs, whose relationship with the financial system differs substantially from that of large enterprises. For the purposes of this study, business size is defined by number of employees: small enterprises are those with between 1 and 20 employees, medium-sized enterprises those with 21 to 199 employees, and large enterprises those with 200 or more employees (see Pérez Caldentey y González (2015)).
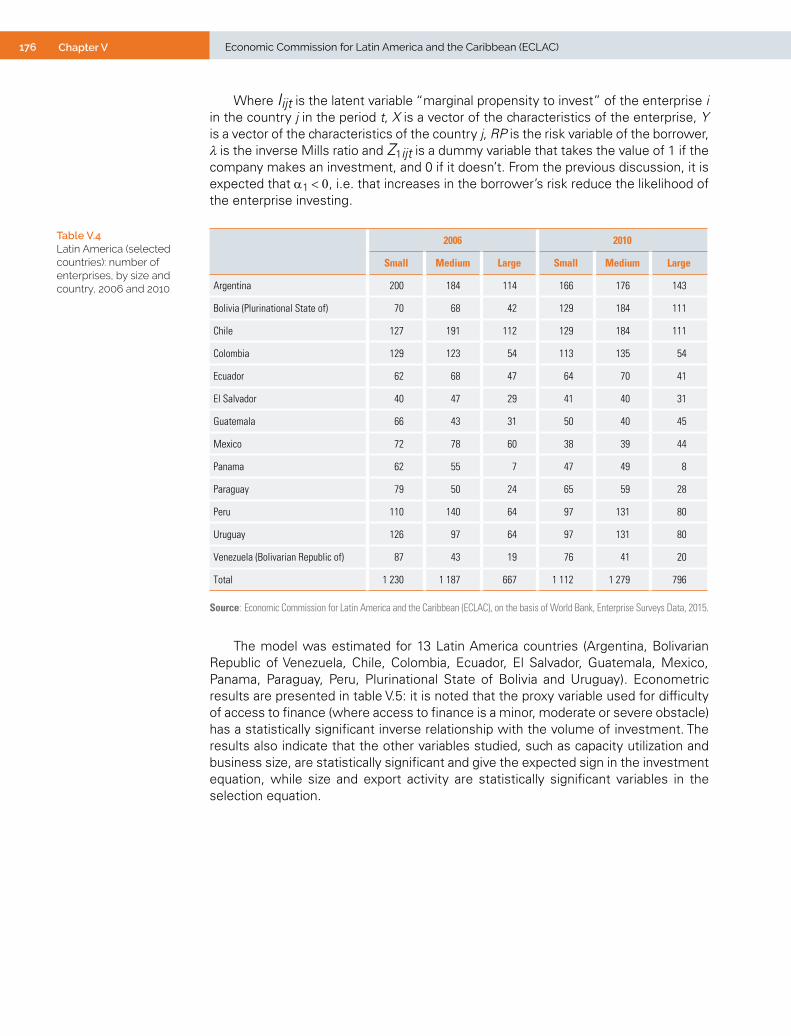
176 Chapter V Economic Commission for Latin America and the Caribbean (ECLAC)
Where Iijt is the latent variable “marginal propensity to invest” of the enterprise i in the country j in the period t, X is a vector of the characteristics of the enterprise, Y is a vector of the characteristics of the country j, RP is the risk variable of the borrower, l is the inverse Mills ratio and Z1ijt is a dummy variable that takes the value of 1 if the company makes an investment, and 0 if it doesn’t. From the previous discussion, it is expected that a1 < 0, i.e. that increases in the borrower’s risk reduce the likelihood of the enterprise investing.
Table V.4 Latin America (selected countries): number of enterprises, by size and country, 2006 and 2010
2006 2010
Small Medium Large Small Medium Large
Argentina 200 184 114 166 176 143
Bolivia (Plurinational State of) 70 68 42 129 184 111
Chile 127 191 112 129 184 111
Colombia 129 123 54 113 135 54
Ecuador 62 68 47 64 70 41
El Salvador 40 47 29 41 40 31
Guatemala 66 43 31 50 40 45
Mexico 72 78 60 38 39 44
Panama 62 55 7 47 49 8
Paraguay 79 50 24 65 59 28
Peru 110 140 64 97 131 80
Uruguay 126 97 64 97 131 80
Venezuela (Bolivarian Republic of) 87 43 19 76 41 20
Total 1 230 1 187 667 1 112 1 279 796
Source: Economic Commission for Latin America and the Caribbean (ECLAC), on the basis of World Bank, Enterprise Surveys Data, 2015.
The model was estimated for 13 Latin America countries (Argentina, Bolivarian Republic of Venezuela, Chile, Colombia, Ecuador, El Salvador, Guatemala, Mexico, Panama, Paraguay, Peru, Plurinational State of Bolivia and Uruguay). Econometric results are presented in table V.5: it is noted that the proxy variable used for difficulty of access to finance (where access to finance is a minor, moderate or severe obstacle) has a statistically significant inverse relationship with the volume of investment. The results also indicate that the other variables studied, such as capacity utilization and business size, are statistically significant and give the expected sign in the investment equation, while size and export activity are statistically significant variables in the selection equation.

177Chapter VEconomic Survey of Latin America and the Caribbean • 2016
Table V.5 Latin America (13 countries):a econometric estimate of investment level in relation to access to finance, 2010
Variables Estimated parameters and standard errorsMedium 0.0870**
(0.0420)
Large 0.220***(0.0507)
Age -0.00355*(0.00185)
Quadratic age 2.99e-05(1.87e-05)
Minor obstacle 0.0185(0.0373)
Moderate obstacle -0.0908**(0.0357)
Severe obstacle -0.0965**(0.0432)
Very severe obstacle -0.184***(0.0653)
Export activity -0.0157(0.0307)
Foreign-owned 0.0343(0.0605)
Capacity utilization 0.00296***(0.000674)
Number of observations 1 637
Source: Economic Commission for Latin America and the Caribbean (ECLAC).Note: Standard errors are given in brackets; *** p<0.01, ** p<0.05, * p<0.a Argentina, Bolivarian Republic of Venezuela, Chile, Colombia, Ecuador, El Salvador, Guatemala,
Mexico, Panama, Paraguay, Peru, Plurinational State of Bolivia and Uruguay.
D. Rethinking financial innovation: a requirement for closing the financial inclusion gap
1. Financial innovation as the creation of institutions, markets, processes and products
In the first instance, financial innovation refers to the creation of financial instruments to improve risk management and meet market demand for certain financial services. The most traditional and best known products and services include factoring, leasing and venture capital.
In Latin America and the Caribbean, these instruments have had limited impact and scope. Factoring, for example, has been shown to account for a little less than 2% of all sources of financing used by SMEs.
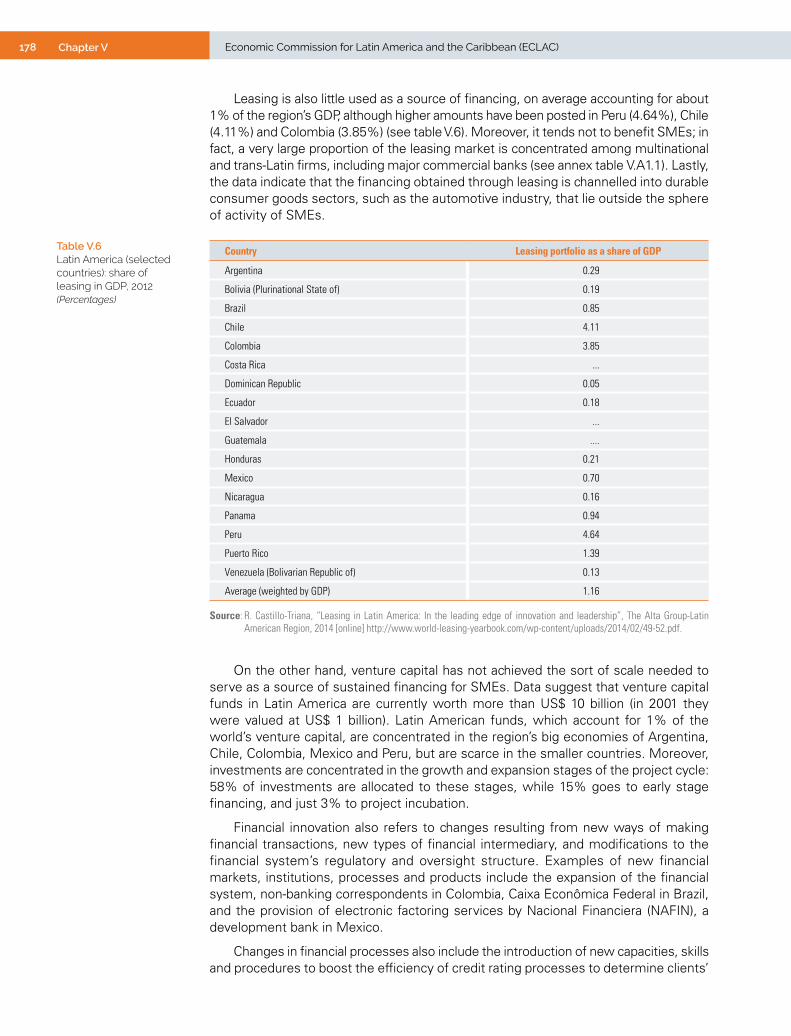
178 Chapter V Economic Commission for Latin America and the Caribbean (ECLAC)
Leasing is also little used as a source of financing, on average accounting for about 1% of the region’s GDP, although higher amounts have been posted in Peru (4.64%), Chile (4.11%) and Colombia (3.85%) (see table V.6). Moreover, it tends not to benefit SMEs; in fact, a very large proportion of the leasing market is concentrated among multinational and trans-Latin firms, including major commercial banks (see annex table V.A1.1). Lastly, the data indicate that the financing obtained through leasing is channelled into durable consumer goods sectors, such as the automotive industry, that lie outside the sphere of activity of SMEs.
Table V.6 Latin America (selected countries): share of leasing in GDP, 2012(Percentages)
Country Leasing portfolio as a share of GDP
Argentina 0.29
Bolivia (Plurinational State of) 0.19
Brazil 0.85
Chile 4.11
Colombia 3.85
Costa Rica ...
Dominican Republic 0.05
Ecuador 0.18
El Salvador ...
Guatemala ....
Honduras 0.21
Mexico 0.70
Nicaragua 0.16
Panama 0.94
Peru 4.64
Puerto Rico 1.39
Venezuela (Bolivarian Republic of) 0.13
Average (weighted by GDP) 1.16
Source: R. Castillo-Triana, “Leasing in Latin America: In the leading edge of innovation and leadership”, The Alta Group-Latin American Region, 2014 [online] http://www.world-leasing-yearbook.com/wp-content/uploads/2014/02/49-52.pdf.
On the other hand, venture capital has not achieved the sort of scale needed to serve as a source of sustained financing for SMEs. Data suggest that venture capital funds in Latin America are currently worth more than US$ 10 billion (in 2001 they were valued at US$ 1 billion). Latin American funds, which account for 1% of the world’s venture capital, are concentrated in the region’s big economies of Argentina, Chile, Colombia, Mexico and Peru, but are scarce in the smaller countries. Moreover, investments are concentrated in the growth and expansion stages of the project cycle: 58% of investments are allocated to these stages, while 15% goes to early stage financing, and just 3% to project incubation.
Financial innovation also refers to changes resulting from new ways of making financial transactions, new types of financial intermediary, and modifications to the financial system’s regulatory and oversight structure. Examples of new financial markets, institutions, processes and products include the expansion of the financial system, non-banking correspondents in Colombia, Caixa Econômica Federal in Brazil, and the provision of electronic factoring services by Nacional Financiera (NAFIN), a development bank in Mexico.
Changes in financial processes also include the introduction of new capacities, skills and procedures to boost the efficiency of credit rating processes to determine clients’
179Chapter VEconomic Survey of Latin America and the Caribbean • 2016
repayment capacity. This includes a new evaluation of repayment capacity based on the concept of relationship banking, whereby repayment capacity is assessed not only on the basis of quantitative information contained in balance sheets and the existence of collateral and mechanisms for the effective fulfilment of contracts (“arm’s length finance”), but relies on direct, personalized and continual interaction between banks and SMEs, which helps reduce information asymmetries and facilitates monitoring. In countries such as Chile, Colombia and Ecuador, this has translated into field visits to evaluate repayment capacity.
2. Similarities and differences between financial innovation and innovation in other sectors
(a) Similarities between financial innovation and innovation in other activity sectors
Financial innovation shares certain characteristics with special types of innovation, such as general purpose technologies (GPTs). These are technologies, such as electricity, the internal combustion engine and information technology, whose general functioning in turn permits the existence of a large segment of products or production systems.
Financial innovation may perform a similar function to that of GPTs. Both types of innovation have high levels of penetration and diffusion, since they may extend across the entire economic system and be used in several activity sectors. GPTs bring together general technical principles which may be applied in types of innovation, while financial innovation may be applied to firms of all sizes (including SMEs) operating in different spheres of production. Both GPTs and financial innovation are highly dynamic, since the effort invested and the learning extracted may bring about increased efficiency and incentivize further innovation in production and finance.
Financial innovation and GPTs also encounter similar disadvantages. High development and dissemination costs entail high fixed costs and create entry barriers for the functioning and continuity of innovation processes. For example, transistors were invented in 1947 and by 1953 were widely used in the production of hearing aids, yet despite their multiple applications they were not introduced in the automotive industry until the late 1970s, partly due to their relatively high price (Helpman and Trajtenberg, 1996).
The development of venture capital followed a similar pattern. The first formal venture capital firm, American Research and Development Corporation, was established in the 1940s by the Federal Reserve Bank of Boston, but information frictions limited the scope of its operations until the late 1970s (Lerner and Tuffano, 2010).
Another disadvantage is that all types of innovation imply a risk to profitability, since they cast uncertainty over future income. Consequently, market conditions tend not to provide sufficient innovation, hence the need to combine private efforts with public initiatives.
(b) Differences between financial innovation and innovation in other activity sectors
Although financial innovation shares similarities with innovation in other economic sectors, it also differs from other types of innovation in a number of specific characteristics.
Over time, the consequences of financial innovations bring about changes in the underlying structure and the way in which each innovation is marketed and employed.
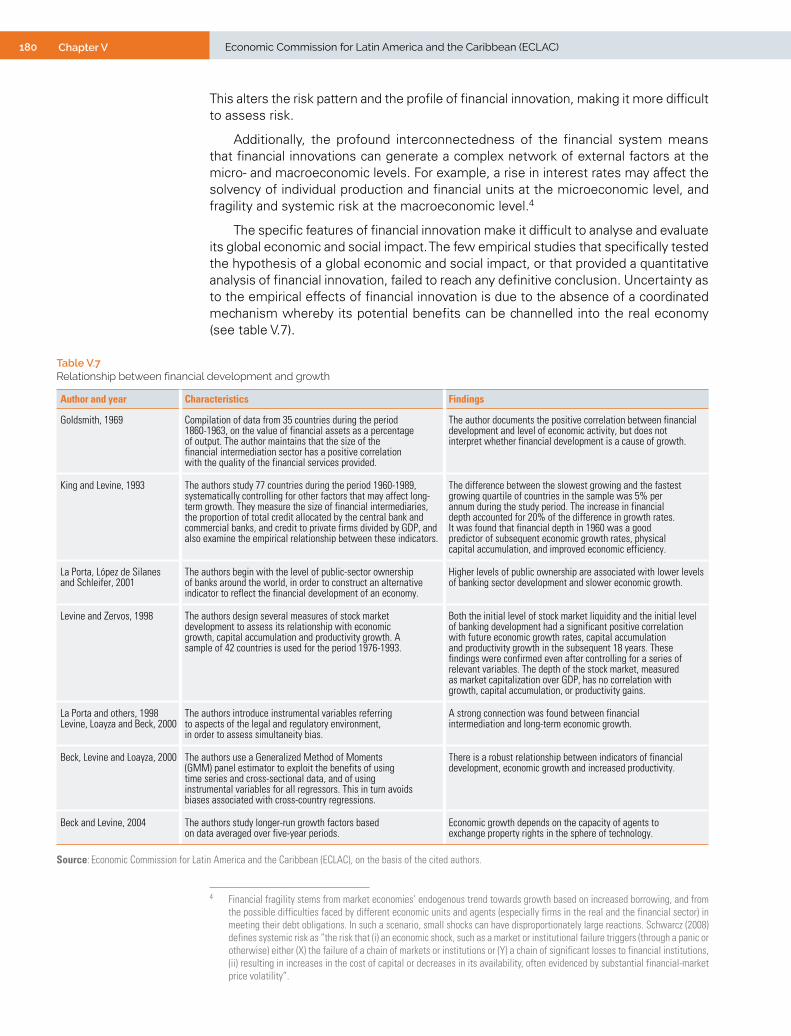
180 Chapter V Economic Commission for Latin America and the Caribbean (ECLAC)
This alters the risk pattern and the profile of financial innovation, making it more difficult to assess risk.
Additionally, the profound interconnectedness of the financial system means that financial innovations can generate a complex network of external factors at the micro- and macroeconomic levels. For example, a rise in interest rates may affect the solvency of individual production and financial units at the microeconomic level, and fragility and systemic risk at the macroeconomic level.4
The specific features of financial innovation make it difficult to analyse and evaluate its global economic and social impact. The few empirical studies that specifically tested the hypothesis of a global economic and social impact, or that provided a quantitative analysis of financial innovation, failed to reach any definitive conclusion. Uncertainty as to the empirical effects of financial innovation is due to the absence of a coordinated mechanism whereby its potential benefits can be channelled into the real economy (see table V.7).
4 Financial fragility stems from market economies’ endogenous trend towards growth based on increased borrowing, and from the possible difficulties faced by different economic units and agents (especially firms in the real and the financial sector) in meeting their debt obligations. In such a scenario, small shocks can have disproportionately large reactions. Schwarcz (2008) defines systemic risk as “the risk that (i) an economic shock, such as a market or institutional failure triggers (through a panic or otherwise) either (X) the failure of a chain of markets or institutions or (Y) a chain of significant losses to financial institutions, (ii) resulting in increases in the cost of capital or decreases in its availability, often evidenced by substantial financial-market price volatility”.
Table V.7 Relationship between financial development and growth
Author and year Characteristics Findings
Goldsmith, 1969 Compilation of data from 35 countries during the period 1860-1963, on the value of financial assets as a percentage of output. The author maintains that the size of the financial intermediation sector has a positive correlation with the quality of the financial services provided.
The author documents the positive correlation between financial development and level of economic activity, but does not interpret whether financial development is a cause of growth.
King and Levine, 1993 The authors study 77 countries during the period 1960-1989, systematically controlling for other factors that may affect long-term growth. They measure the size of financial intermediaries, the proportion of total credit allocated by the central bank and commercial banks, and credit to private firms divided by GDP, and also examine the empirical relationship between these indicators.
The difference between the slowest growing and the fastest growing quartile of countries in the sample was 5% per annum during the study period. The increase in financial depth accounted for 20% of the difference in growth rates. It was found that financial depth in 1960 was a good predictor of subsequent economic growth rates, physical capital accumulation, and improved economic efficiency.
La Porta, López de Silanes and Schleifer, 2001
The authors begin with the level of public-sector ownership of banks around the world, in order to construct an alternative indicator to reflect the financial development of an economy.
Higher levels of public ownership are associated with lower levels of banking sector development and slower economic growth.
Levine and Zervos, 1998 The authors design several measures of stock market development to assess its relationship with economic growth, capital accumulation and productivity growth. A sample of 42 countries is used for the period 1976-1993.
Both the initial level of stock market liquidity and the initial level of banking development had a significant positive correlation with future economic growth rates, capital accumulation and productivity growth in the subsequent 18 years. These findings were confirmed even after controlling for a series of relevant variables. The depth of the stock market, measured as market capitalization over GDP, has no correlation with growth, capital accumulation, or productivity gains.
La Porta and others, 1998Levine, Loayza and Beck, 2000
The authors introduce instrumental variables referring to aspects of the legal and regulatory environment, in order to assess simultaneity bias.
A strong connection was found between financial intermediation and long-term economic growth.
Beck, Levine and Loayza, 2000 The authors use a Generalized Method of Moments (GMM) panel estimator to exploit the benefits of using time series and cross-sectional data, and of using instrumental variables for all regressors. This in turn avoids biases associated with cross-country regressions.
There is a robust relationship between indicators of financial development, economic growth and increased productivity.
Beck and Levine, 2004 The authors study longer-run growth factors based on data averaged over five-year periods.
Economic growth depends on the capacity of agents to exchange property rights in the sphere of technology.
Source: Economic Commission for Latin America and the Caribbean (ECLAC), on the basis of the cited authors.

181Chapter VEconomic Survey of Latin America and the Caribbean • 2016
There is evidence to suggest that finances have an impact on growth by fostering productivity and the allocation of resources. Specifically, the availability of external financing is positively associated with entrepreneurship and higher income for businesses, as well as with dynamism and innovation. Finance also allows companies to take advantage of opportunities for investment and growth.
In fact, previous studies have found a statistically significant connection between the development of financial intermediation, per capita real GDP growth and total factor productivity growth, and have also discovered that financial development may ease liquidity retrictions on firms and facilitate long-term investment, which ultimately reduces investment volatility. For example, it is thought that financial development could be a critical factor in responding to volatility, since exchange-rate volatility weighs on growth in countries that are economically underdeveloped, but has no effect on financially developed countries (Aghion, 2006).
Conversely, information asymmetries and possible instances of the principal-agent problem may turn finance into a source of fragility, especially where banks are encouraged to take on too much risk and market discipline is undermined. In particular, it has been demonstrated that banking crises may have a disproportionate impact on industries that are more dependent on external financing. This impact is even stronger in more developed financial systems.
In recent decades, financial innovation has driven an unprecedented increase in liquidity and financial deepening; financial assets account for more than 10 times global GDP. Yet this growth has not coincided with greater financing for households and businesses, nor have funds become more accessible for developing economies.
3. Financial innovation as a public goodA new perspective on financial innovation is needed, with a view to channelling resources towards the production sector and the achievement of development goals. Financial innovation should be conceptualized as a public good in a broader sense that differs from the traditional definition based on non-rivalry and non-excludability. In other words, once the good in question has been supplied, potential consumption by the individual will not depend on consumption by others, as in the case of private goods, whose nature is defined by the possibility that availability can be reduced and consumption limited.
In that sense, public goods are not something that markets provide, either due to asymmetries, uncertainty or simply a lack of knowledge. Public goods and services thus tend not to be produced in response to demand, even where, considering their significant positive externalities, they should be widely available.
Financial inclusion should therefore be regarded as a public good, like health and education, on the grounds that exclusion is neither desirable nor justified.
Within this framework, financial innovation may also take the form of actions undertaken to channel financing to different actors, investments and production requirements, including innovation in products, processes and institutions. Each type of innovation should promote the inclusion of households and businesses, develop appropriate instruments for risk management by various economic agents in a range of sectors, and provide financing for new development goals and priorities.
Development banks play an important role in fostering innovation for financing, both directly and through coordination with other banks. While there is a complementarity between regional, subregional and national development banks that stems from shared goals and instruments, there is also scope for coordination with the private banking sector, in which potential synergies could lead to mutually beneficial innovations. This is a key aspect on which financial innovation should focus (see box V.1).
182 Chapter V Economic Commission for Latin America and the Caribbean (ECLAC)
Box V.1 Financial innovation for inclusion: projects implemented by development banks in Latin America
Innovation in products
Innovation by development banks in the form of financial products plays a crucial role for financial inclusion and overcoming poverty. This type of innovation must be correctly planned and should include simplified processes for opening accounts, special conditions for small-scale transactions, regulatory policies to prevent the overindebtedness of companies and individuals and the inappropriate use of financial products, contractual clauses that are simpler and easier to understand for the population, and transparent information.
In Latin America, several products have been developed through innovation. One is the international factoring guarantee created in Mexico in 2009 to provide support for Mexican automotive industry by allowing exporters to obtain liquidity against their accounts receivable, the risk of default being assumed by the development bank Bancomext. After meeting with success, the programme was rolled out to other sectors. Another product innovation is Brazil’s Cartão Pronaf, a card launched by Banco do Brasil in association with the National Programme for Strengthening Family Farming (PRONAF), to help Brazilian producers purchase machinery, equipment and inputs.
Innovation in processes
To facilitate financial inclusion, processes and procedures should be directed towards greater efficiency in achieving public policy goals. In general terms, public banks should encourage the automation of their operating systems, modernize their software, assess maintenance and supplier costs, standardize programming languages and infrastructure, digitize manual bureaucratic procedures and eliminate any processes that have high operating costs, where possible.
One process that has emerged as a result of innovation in the region was developed by the Brazilian National Bank for Economic and Social Development (BNDES). In 2008 it implemented a new methodology for evaluating the financial health of companies, which studied the specific features of each firm, not only in terms of their financial situation and tangible capital, but also their intangible capital and potential to prosper in future. These capacities were categorized according to different criteria, including capacity for innovation, environmental sustainability and corporate governance.
Innovation in institutions
Innovation in the sphere of public banking also extends to the institutional dimension. This might entail the appearance of new regulatory frameworks that favour successful intervention or the use of new low-cost channels that have the potential to generate positive externalities in the private sector. One notable innovation was developed in Brazil in 2003: payroll loans in which instalments are deducted directly from the worker’s wages and repaid to the bank. This innovation was backed by regulatory clauses, so that workers dismissed during the repayment period would see part of their financial compensation allocated to the repayment of their debt. Borrowers also enjoyed benefits such as lower interest rates than those available on consumer loans or credit cards. The concept has also been adopted by the private sector and the pensions industry, in light of its positive results.
Source: Economic Commission for Latin America and the Caribbean (ECLAC), on the basis of official figures.
183Chapter VEconomic Survey of Latin America and the Caribbean • 2016
However, in Latin America and the Caribbean the pursuit of financial innovation faces significant challenges, since an array of instruments needs to be developed to address the production heterogeneity that is the region’s hallmark. These new instruments must also respond to existing needs, such as ensuring the inclusion of SMEs, closing the infrastructure gap, devising financial instruments to foster international trade, and strengthening complementarity between public and private financial intermediaries.
E. Conclusions
In Latin America and the Caribbean, household financial inclusion levels are below the average for developed and developing countries alike. Meanwhile the production sector suffers from the same inequalities that characterize the sector in other regions of the developing world.
Financial inclusion does not refer merely to the analysis of financial access. Rather, it should be understood as a policy of economic integration, on the one hand encompassing all efforts and initiatives designed to provide access to formal financial services for those who are excluded, and on the other, seeking to improve the use of the financial system for agents and particularly for production units such as SMEs that already participate in formal financing channels.
Innovation may be favourable to the financial inclusion of households and SMEs through financial densification. This means expanding the range of financial services, increasing interconnectivity, and continuing to innovate in respect of institutional frameworks and instruments for improving risk management and potentially responding to the heterogeneous needs of households and SMEs. Yet the chief aspect of innovation is that its processes and strategies generate micro- and macroeconomic externalities, and it may thus be conceived as a public good.
Conceptualizing financial inclusion as a public good implies assigning development banks a central role as drivers of productive financing. Development banks may also complement commercial banks, which at present do not have enough incentives to extend their services to SME financing. Indeed, development banks have proven to be capable of expanding their financing instruments and mechanisms in view of the requirements, characteristics and risks inherent to different production activities.
184 Chapter V Economic Commission for Latin America and the Caribbean (ECLAC)
Bibliography
Aghion, P. and others (2006), “Exchange rate volatility and productivity growth: The role of financial development”, NBER Working Paper, No. 12117 [online] http://www.nber.org/papers/w12117.pdf.
BCRA (Central Bank of Argentina) (2016), “Serie trimestral para préstamos por actividades económicas” [online] http://www.bcra.gov.ar/Estadisticas/estind020303.asp.
CAF (Development Bank of Latin America) (2011), Servicios financieros para el desarrollo: promoviendo el acceso en América Latina [online] https://www.caf.com/media/3895/RED2011.pdf.
Castillo-Triana, R. (2014), “Leasing in Latin America: In the leading edge of innovation and leadership”, The Alta Group–Latin American Region (LAR) [online] http://www.world-leasing-yearbook.com/wp-content/uploads/2014/02/49-52.pdf.
Central Bank of Brazil (2016), “Credit operations outstanding by economic activity”, Time Series Management System [online] http://www.bcb.gov.br/.
CNBV (National Banking and Securities Commission of Mexico) (2016), “Datos sobre características de cartera de crédito de la banca múltiple y banca de desarrollo” [online] http://portafoliodeinformacion.cnbv.gob.mx/Paginas/default.aspx.
ECLAC (Economic Commission for Latin America and the Caribbean) (2016), Horizons 2030: Equality at the Centre of Sustainable Development (LC/G.2660 (SES.36/3)), Santiago.(2015), Economic Survey of Latin America and the Caribbean, 2015 (LC/G.2645-P), Santiago.
Goldsmith, R. (1969), Financial Structure and Development, New Haven, Yale University Press.Helpman, E. and M. Trajtenberg, (1996), “Diffusion of general purpose technologies”, NBER
Working Paper Series, No. 5773 [online] http://www.nber.org/papers/w5773.pdf.King, R. and R. Levine (1993), “Finance and growth: Schumpeter might be right”, The Quarterly
Journal of Economics, vol. 108, No. 3.La Porta, R., F. Lopez de Silanes and A. Shleifer (2001), “Government Ownership of Banks”,
Harvard Institute of Economic Research Paper, No. 1890, KSG Working Paper No. 01-016.La Porta, R. and others (1998), “Law and finance”, Journal of Political Economy, vol. 106, No. 6.Lerner, J. and P. Tuffano, (2010), “The consequences of financial innovation: A counterfactual
research agenda”, The Rate and Direction of Inventive Activity Revisited, J. Lerner and S. Stern (eds.), Chicago, University of Chicago Press.
Levine, R. and T. Beck (2004), “Stock markets, banks, and growth: Panel evidence”, Journal of Banking & Finance, vol. 28, No. 3.
Levine, R. and S. Zervos (1998), “Stock markets, banks, and economic growth”, The American Economic Review, vol. 88, No. 3.
Levine, R., N. Loayza and T. Beck (2000), “Financial intermediation and growth: causality and causes”, Journal of Monetary Economics, vol. 46, No. 1.
Pérez Caldentey, E. and A. González (2015), “Inversión, financiamiento y la paradoja de la deuda en Minsky. Un análisis microeconométrico aplicado a América Latina”, Ensayos Económicos, vol. 1, No. 73, Central Bank of Argentina.
Schwarcz, Steven (2008), “Systemic risk”, Duke Law School Legal Studies Paper, No. 163 [online] https://www.iiiglobal.org/sites/default/files/systemicrisk.pdf.
Secretariat of Finance and Public Credit of Mexico (2016), “Datos sobre cartera de crédito de México” [online] http://www.gob.mx/hacienda.
Superintendency of Banks and Financial Institutions of Chile (2016), “Colocaciones regionales por actividad económica” [online] http://www.sbif.cl/sbifweb/servlet/InfoFinanciera?indice=4.0.
Superintendency of Banks, Insurance and Pension Fund Administrators of Peru (2016), “Carpeta de cuadros estadísticos del sistema financiero entre enero y diciembre de 2015” [online] http://www.sbs.gob.pe/app/stats/EstadisticaBoletinEstadistico.asp?p=14#.
Superintendency of Banks of Ecuador (2016), “Serie annual de volumen de crédito” [online] http://www.superbancos.gob.ec/practg/p_index.
World Bank (2016), “G20 Financial Inclusion Indicators” [online databae] http://databank.worldbank.org/data/reports.aspx?source=g20-basic-set-of-financial-inclusion-indicators.(2015), “Enterprise Surveys Data” [online database] http://www.enterprisesurveys.org/data.

185Chapter VEconomic Survey of Latin America and the Caribbean • 2016
Annex V.A1
Table V.A1.1 Latin America: main financial entities with leasing portfolios, 2012 (Thousands of dollars)
Controlling entity Total assets, 2012
Itau 8 223 703,81
Bancolombia 5 271 737,09
Santander 4 951 844,28
Grupo Aval 4 026 070,07
Bradesco 3 932 778,98
BBVA 3 881 011,63
Citibank 2 586 318,19
Scotiabank 2 264 327,96
Corpbanca 2 193 200,08
Grupo Bolívar 1 773 581,20
Caterpillar 1 310 596,94
Hewlett Packard 1 229 291,10
IBM 760 466,37
Safra 546 879,72
Volkswagen 345 107,88
CIT Group 217 746,69
CSI 197 800,51
Source: R. Castillo-Triana, “Leasing in Latin America: In the leading edge of innovation and leadership”, The Alta Group–Latin American Region, 2014 [online] http://www.world-leasing-yearbook.com/wp-content/uploads/2014/02/49-52.pdf.
Figure V.A1.1 Latin America and the Caribbean (20 countries): adults aged 15 and older with at least one account at a financial institution, 2014 (Percentages)
18.919.4
29.031.5
36.739.039.1
41.341.8
43.745.646.2
48.250.2
54.157.0
63.364.6
68.178.5
45.8
0 10 20 30 40 50 60 70 80 90 100
HaitiNicaragua
PeruHonduras
El SalvadorColombia
MexicoGuatemala
Bolivia (Plur. State of)PanamaUruguayEcuador
BelizeArgentina
Dominican Rep.Venezuela (Bol. Rep. of)
ChileCosta Rica
BrazilJamaica
Average of Latin America and the Caribbean
Source: Economic Commission for Latin America and the Caribbean (ECLAC), on the basis of World Bank, G20 Basic Set of Financial Inclusion Indicators.

Statistical annex

189Statistical annexEconomic Survey of Latin America and the Caribbean • 2016
STATISTICALANNEX
Table A.1 Latin America and the Caribbean: main economic indicators
2007 2008 2009 2010 2011 2012 2013 2014 2015a
Annual growth rates
Gross domestic productb 5.9 4.1 -1.7 6.2 4.5 2.8 2.9 0.9 -0.5
Gross domestic product per capitab 4.5 2.7 -2.9 4.9 3.2 1.7 1.7 -0.2 -1.6
Consumer pricesc 6.5 8.1 4.6 6.5 6.8 5.7 7.5 9.4 16.5
Percentages
Urban open unemployment 8.6 8.0 9.2 8.6 7.8 7.4 7.2 7.0 7.4
Total gross external debt/GDPd e 31.3 28.4 29.5 28.3 27.0 28.7 30.4 32.2 34.6
Total gross external debt/exports of goods and services 80.4 73.9 101.3 97.1 88.8 96.3 101.1 113.4 134.4
Millions of dollars
Balance of paymentse
Current account balance 4 627 -40 248 -31 618 -96 090 -115 170 -139 540 -163 703 -187 954 -177 933
Exports of goods f.o.b. 791 140 905 587 703 691 891 889 1 104 819 1 121 119 1 116 508 1 082 901 922 611
Imports of goods f.o.b. 720 829 863 314 650 875 845 113 1 039 182 1 085 088 1 114 965 1 102 853 980 868
Services trade balance -16 442 -31 119 -34 293 -49 719 -65 264 -71 450 -72 846 -73 361 -50 783
Income balance -106 352 -114 644 -104 639 -151 492 -175 505 -161 997 -150 562 -155 999 -132 103
Net current transfers 66 166 67 134 57 659 61 759 63 548 62 314 62 551 65 588 67 273
Capital and financial balancef 120 299 78 262 76 481 187 928 216 434 196 069 177 095 223 838 147 636
Net foreign direct investment 96 920 104 134 72 064 111 528 146 323 150 272 144 421 141 488 131 275
Other capital movements 23 379 -25 872 4 417 76 400 70 111 45 797 32 674 82 350 16 361
Overall balance 124 438 38 014 44 863 91 838 101 264 57 410 13 392 35 884 -30 296
Variation in reserve assetsg -126 412 -41 745 -50 253 -87 467 -106 775 -57 930 -16 111 -38 001 26 823
Other financing 2 253 4 064 5 597 -4 668 5 097 407 2 206 1 319 2 496
Net transfer of resources 16 200 -32 318 -22 561 31 768 46 026 34 479 28 739 69 158 18 030
International reserves 459 581 512 727 567 444 655 389 773 632 835 735 830 018 857 438 811 762
Percentages of GDP
Fiscal sectorh
Overall balance 0.3 -0.4 -2.8 -1.9 -1.6 -1.9 -2.3 -2.8 -3.0
Primary balance 2.2 1.2 -1.0 -0.3 0.1 -0.2 -0.6 -1.0 -1.0
Total revenue 18.9 19.0 17.8 18.2 18.6 18.9 19.2 19.3 18.8
Tax revenue 14.3 14.2 13.6 13.8 14.4 14.8 14.9 15.2 15.5
Total expenditure 18.6 19.4 20.6 20.1 20.3 20.9 21.6 22.1 21.8
Capital expenditure 3.7 4.0 4.2 4.2 4.4 4.5 4.7 4.7 4.2
Central-government public debt 30.3 28.8 30.6 29.2 29.1 30.5 32.1 33.4 35.9
Public debt of the non-financial public-sector 32.3 30.8 32.8 31.8 31.1 32.7 34.4 36.0 38.7
Source: Economic Commission for Latin America and the Caribbean (ECLAC), on the basis of official figures.a Preliminary figures.b Based on official figures expressed in 2010 dollars. c December-December variation. d Estimates based on figures denominated in dollars at current prices. e Simple averages for 19 countries. Does not include Cuba.f Includes errors and omissions. g A minus sign (-) indicates an increase in reserve assets. h Central government. Simple averages for 19 countries.
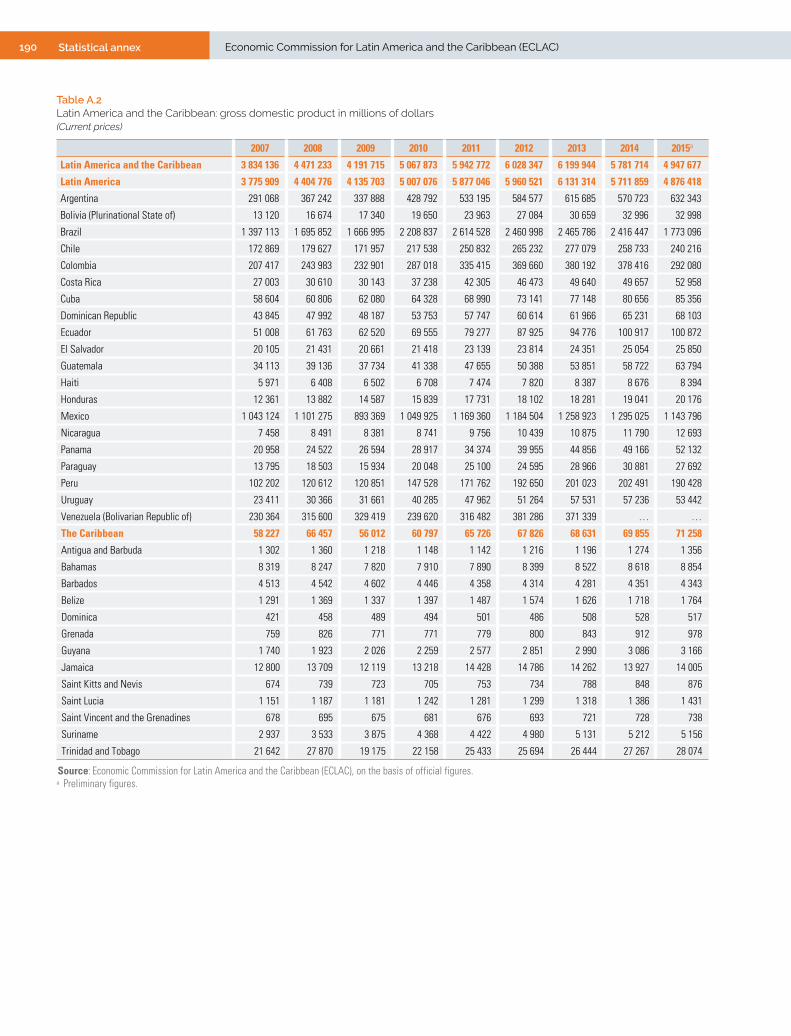
190 Statistical annex Economic Commission for Latin America and the Caribbean (ECLAC)
Table A.2 Latin America and the Caribbean: gross domestic product in millions of dollars (Current prices)
2007 2008 2009 2010 2011 2012 2013 2014 2015a
Latin America and the Caribbean 3 834 136 4 471 233 4 191 715 5 067 873 5 942 772 6 028 347 6 199 944 5 781 714 4 947 677
Latin America 3 775 909 4 404 776 4 135 703 5 007 076 5 877 046 5 960 521 6 131 314 5 711 859 4 876 418
Argentina 291 068 367 242 337 888 428 792 533 195 584 577 615 685 570 723 632 343
Bolivia (Plurinational State of) 13 120 16 674 17 340 19 650 23 963 27 084 30 659 32 996 32 998
Brazil 1 397 113 1 695 852 1 666 995 2 208 837 2 614 528 2 460 998 2 465 786 2 416 447 1 773 096
Chile 172 869 179 627 171 957 217 538 250 832 265 232 277 079 258 733 240 216
Colombia 207 417 243 983 232 901 287 018 335 415 369 660 380 192 378 416 292 080
Costa Rica 27 003 30 610 30 143 37 238 42 305 46 473 49 640 49 657 52 958
Cuba 58 604 60 806 62 080 64 328 68 990 73 141 77 148 80 656 85 356
Dominican Republic 43 845 47 992 48 187 53 753 57 747 60 614 61 966 65 231 68 103
Ecuador 51 008 61 763 62 520 69 555 79 277 87 925 94 776 100 917 100 872
El Salvador 20 105 21 431 20 661 21 418 23 139 23 814 24 351 25 054 25 850
Guatemala 34 113 39 136 37 734 41 338 47 655 50 388 53 851 58 722 63 794
Haiti 5 971 6 408 6 502 6 708 7 474 7 820 8 387 8 676 8 394
Honduras 12 361 13 882 14 587 15 839 17 731 18 102 18 281 19 041 20 176
Mexico 1 043 124 1 101 275 893 369 1 049 925 1 169 360 1 184 504 1 258 923 1 295 025 1 143 796
Nicaragua 7 458 8 491 8 381 8 741 9 756 10 439 10 875 11 790 12 693
Panama 20 958 24 522 26 594 28 917 34 374 39 955 44 856 49 166 52 132
Paraguay 13 795 18 503 15 934 20 048 25 100 24 595 28 966 30 881 27 692
Peru 102 202 120 612 120 851 147 528 171 762 192 650 201 023 202 491 190 428
Uruguay 23 411 30 366 31 661 40 285 47 962 51 264 57 531 57 236 53 442
Venezuela (Bolivarian Republic of) 230 364 315 600 329 419 239 620 316 482 381 286 371 339 … …
The Caribbean 58 227 66 457 56 012 60 797 65 726 67 826 68 631 69 855 71 258
Antigua and Barbuda 1 302 1 360 1 218 1 148 1 142 1 216 1 196 1 274 1 356
Bahamas 8 319 8 247 7 820 7 910 7 890 8 399 8 522 8 618 8 854
Barbados 4 513 4 542 4 602 4 446 4 358 4 314 4 281 4 351 4 343
Belize 1 291 1 369 1 337 1 397 1 487 1 574 1 626 1 718 1 764
Dominica 421 458 489 494 501 486 508 528 517
Grenada 759 826 771 771 779 800 843 912 978
Guyana 1 740 1 923 2 026 2 259 2 577 2 851 2 990 3 086 3 166
Jamaica 12 800 13 709 12 119 13 218 14 428 14 786 14 262 13 927 14 005
Saint Kitts and Nevis 674 739 723 705 753 734 788 848 876
Saint Lucia 1 151 1 187 1 181 1 242 1 281 1 299 1 318 1 386 1 431
Saint Vincent and the Grenadines 678 695 675 681 676 693 721 728 738
Suriname 2 937 3 533 3 875 4 368 4 422 4 980 5 131 5 212 5 156
Trinidad and Tobago 21 642 27 870 19 175 22 158 25 433 25 694 26 444 27 267 28 074
Source: Economic Commission for Latin America and the Caribbean (ECLAC), on the basis of official figures.a Preliminary figures.
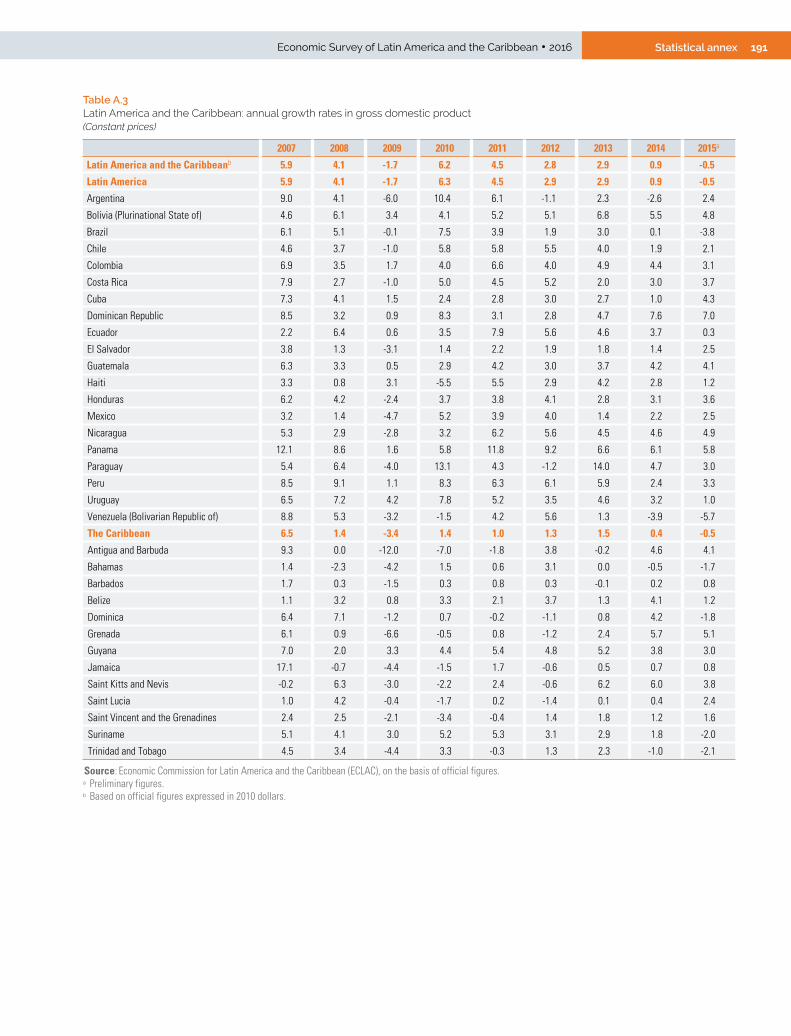
191Statistical annexEconomic Survey of Latin America and the Caribbean • 2016
Table A.3 Latin America and the Caribbean: annual growth rates in gross domestic product (Constant prices)
2007 2008 2009 2010 2011 2012 2013 2014 2015a
Latin America and the Caribbeanb 5.9 4.1 -1.7 6.2 4.5 2.8 2.9 0.9 -0.5
Latin America 5.9 4.1 -1.7 6.3 4.5 2.9 2.9 0.9 -0.5
Argentina 9.0 4.1 -6.0 10.4 6.1 -1.1 2.3 -2.6 2.4
Bolivia (Plurinational State of) 4.6 6.1 3.4 4.1 5.2 5.1 6.8 5.5 4.8
Brazil 6.1 5.1 -0.1 7.5 3.9 1.9 3.0 0.1 -3.8
Chile 4.6 3.7 -1.0 5.8 5.8 5.5 4.0 1.9 2.1
Colombia 6.9 3.5 1.7 4.0 6.6 4.0 4.9 4.4 3.1
Costa Rica 7.9 2.7 -1.0 5.0 4.5 5.2 2.0 3.0 3.7
Cuba 7.3 4.1 1.5 2.4 2.8 3.0 2.7 1.0 4.3
Dominican Republic 8.5 3.2 0.9 8.3 3.1 2.8 4.7 7.6 7.0
Ecuador 2.2 6.4 0.6 3.5 7.9 5.6 4.6 3.7 0.3
El Salvador 3.8 1.3 -3.1 1.4 2.2 1.9 1.8 1.4 2.5
Guatemala 6.3 3.3 0.5 2.9 4.2 3.0 3.7 4.2 4.1
Haiti 3.3 0.8 3.1 -5.5 5.5 2.9 4.2 2.8 1.2
Honduras 6.2 4.2 -2.4 3.7 3.8 4.1 2.8 3.1 3.6
Mexico 3.2 1.4 -4.7 5.2 3.9 4.0 1.4 2.2 2.5
Nicaragua 5.3 2.9 -2.8 3.2 6.2 5.6 4.5 4.6 4.9
Panama 12.1 8.6 1.6 5.8 11.8 9.2 6.6 6.1 5.8
Paraguay 5.4 6.4 -4.0 13.1 4.3 -1.2 14.0 4.7 3.0
Peru 8.5 9.1 1.1 8.3 6.3 6.1 5.9 2.4 3.3
Uruguay 6.5 7.2 4.2 7.8 5.2 3.5 4.6 3.2 1.0
Venezuela (Bolivarian Republic of) 8.8 5.3 -3.2 -1.5 4.2 5.6 1.3 -3.9 -5.7
The Caribbean 6.5 1.4 -3.4 1.4 1.0 1.3 1.5 0.4 -0.5
Antigua and Barbuda 9.3 0.0 -12.0 -7.0 -1.8 3.8 -0.2 4.6 4.1
Bahamas 1.4 -2.3 -4.2 1.5 0.6 3.1 0.0 -0.5 -1.7
Barbados 1.7 0.3 -1.5 0.3 0.8 0.3 -0.1 0.2 0.8
Belize 1.1 3.2 0.8 3.3 2.1 3.7 1.3 4.1 1.2
Dominica 6.4 7.1 -1.2 0.7 -0.2 -1.1 0.8 4.2 -1.8
Grenada 6.1 0.9 -6.6 -0.5 0.8 -1.2 2.4 5.7 5.1
Guyana 7.0 2.0 3.3 4.4 5.4 4.8 5.2 3.8 3.0
Jamaica 17.1 -0.7 -4.4 -1.5 1.7 -0.6 0.5 0.7 0.8
Saint Kitts and Nevis -0.2 6.3 -3.0 -2.2 2.4 -0.6 6.2 6.0 3.8
Saint Lucia 1.0 4.2 -0.4 -1.7 0.2 -1.4 0.1 0.4 2.4
Saint Vincent and the Grenadines 2.4 2.5 -2.1 -3.4 -0.4 1.4 1.8 1.2 1.6
Suriname 5.1 4.1 3.0 5.2 5.3 3.1 2.9 1.8 -2.0
Trinidad and Tobago 4.5 3.4 -4.4 3.3 -0.3 1.3 2.3 -1.0 -2.1
Source: Economic Commission for Latin America and the Caribbean (ECLAC), on the basis of official figures.a Preliminary figures.b Based on official figures expressed in 2010 dollars.
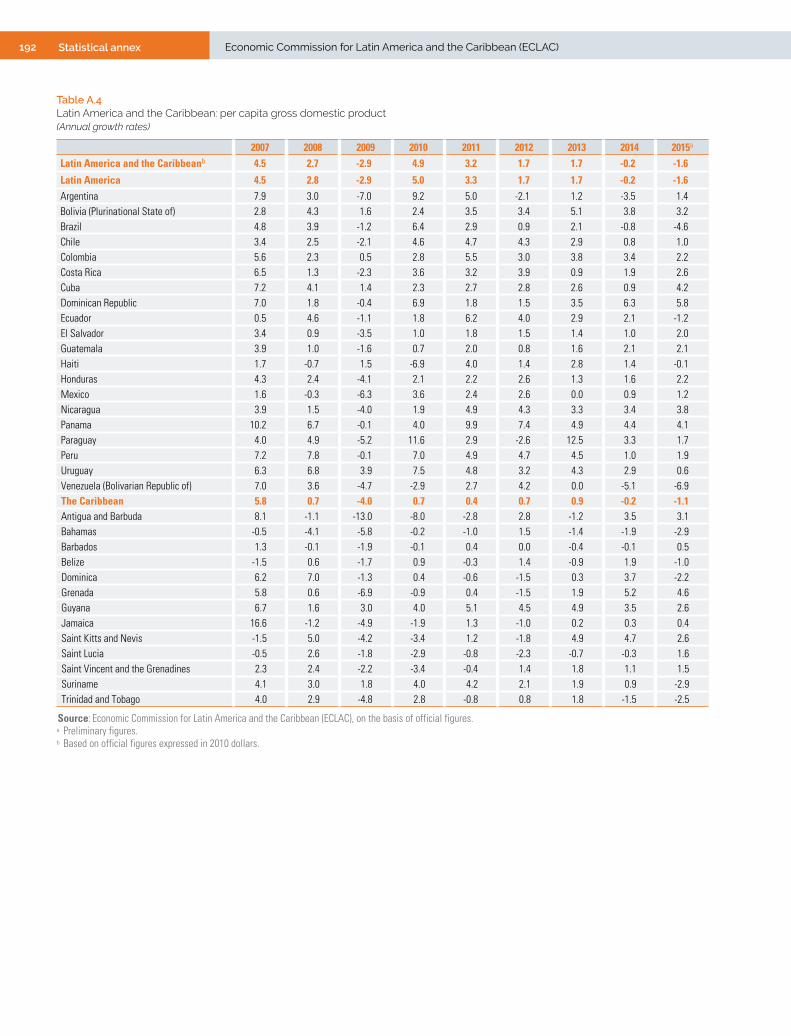
192 Statistical annex Economic Commission for Latin America and the Caribbean (ECLAC)
Table A.4 Latin America and the Caribbean: per capita gross domestic product (Annual growth rates)
2007 2008 2009 2010 2011 2012 2013 2014 2015a
Latin America and the Caribbeanb 4.5 2.7 -2.9 4.9 3.2 1.7 1.7 -0.2 -1.6
Latin America 4.5 2.8 -2.9 5.0 3.3 1.7 1.7 -0.2 -1.6Argentina 7.9 3.0 -7.0 9.2 5.0 -2.1 1.2 -3.5 1.4Bolivia (Plurinational State of) 2.8 4.3 1.6 2.4 3.5 3.4 5.1 3.8 3.2Brazil 4.8 3.9 -1.2 6.4 2.9 0.9 2.1 -0.8 -4.6Chile 3.4 2.5 -2.1 4.6 4.7 4.3 2.9 0.8 1.0Colombia 5.6 2.3 0.5 2.8 5.5 3.0 3.8 3.4 2.2Costa Rica 6.5 1.3 -2.3 3.6 3.2 3.9 0.9 1.9 2.6Cuba 7.2 4.1 1.4 2.3 2.7 2.8 2.6 0.9 4.2Dominican Republic 7.0 1.8 -0.4 6.9 1.8 1.5 3.5 6.3 5.8Ecuador 0.5 4.6 -1.1 1.8 6.2 4.0 2.9 2.1 -1.2El Salvador 3.4 0.9 -3.5 1.0 1.8 1.5 1.4 1.0 2.0Guatemala 3.9 1.0 -1.6 0.7 2.0 0.8 1.6 2.1 2.1Haiti 1.7 -0.7 1.5 -6.9 4.0 1.4 2.8 1.4 -0.1Honduras 4.3 2.4 -4.1 2.1 2.2 2.6 1.3 1.6 2.2Mexico 1.6 -0.3 -6.3 3.6 2.4 2.6 0.0 0.9 1.2Nicaragua 3.9 1.5 -4.0 1.9 4.9 4.3 3.3 3.4 3.8Panama 10.2 6.7 -0.1 4.0 9.9 7.4 4.9 4.4 4.1Paraguay 4.0 4.9 -5.2 11.6 2.9 -2.6 12.5 3.3 1.7Peru 7.2 7.8 -0.1 7.0 4.9 4.7 4.5 1.0 1.9Uruguay 6.3 6.8 3.9 7.5 4.8 3.2 4.3 2.9 0.6Venezuela (Bolivarian Republic of) 7.0 3.6 -4.7 -2.9 2.7 4.2 0.0 -5.1 -6.9The Caribbean 5.8 0.7 -4.0 0.7 0.4 0.7 0.9 -0.2 -1.1Antigua and Barbuda 8.1 -1.1 -13.0 -8.0 -2.8 2.8 -1.2 3.5 3.1Bahamas -0.5 -4.1 -5.8 -0.2 -1.0 1.5 -1.4 -1.9 -2.9Barbados 1.3 -0.1 -1.9 -0.1 0.4 0.0 -0.4 -0.1 0.5Belize -1.5 0.6 -1.7 0.9 -0.3 1.4 -0.9 1.9 -1.0Dominica 6.2 7.0 -1.3 0.4 -0.6 -1.5 0.3 3.7 -2.2Grenada 5.8 0.6 -6.9 -0.9 0.4 -1.5 1.9 5.2 4.6Guyana 6.7 1.6 3.0 4.0 5.1 4.5 4.9 3.5 2.6Jamaica 16.6 -1.2 -4.9 -1.9 1.3 -1.0 0.2 0.3 0.4Saint Kitts and Nevis -1.5 5.0 -4.2 -3.4 1.2 -1.8 4.9 4.7 2.6Saint Lucia -0.5 2.6 -1.8 -2.9 -0.8 -2.3 -0.7 -0.3 1.6Saint Vincent and the Grenadines 2.3 2.4 -2.2 -3.4 -0.4 1.4 1.8 1.1 1.5Suriname 4.1 3.0 1.8 4.0 4.2 2.1 1.9 0.9 -2.9Trinidad and Tobago 4.0 2.9 -4.8 2.8 -0.8 0.8 1.8 -1.5 -2.5
Source: Economic Commission for Latin America and the Caribbean (ECLAC), on the basis of official figures.a Preliminary figures.b Based on official figures expressed in 2010 dollars.
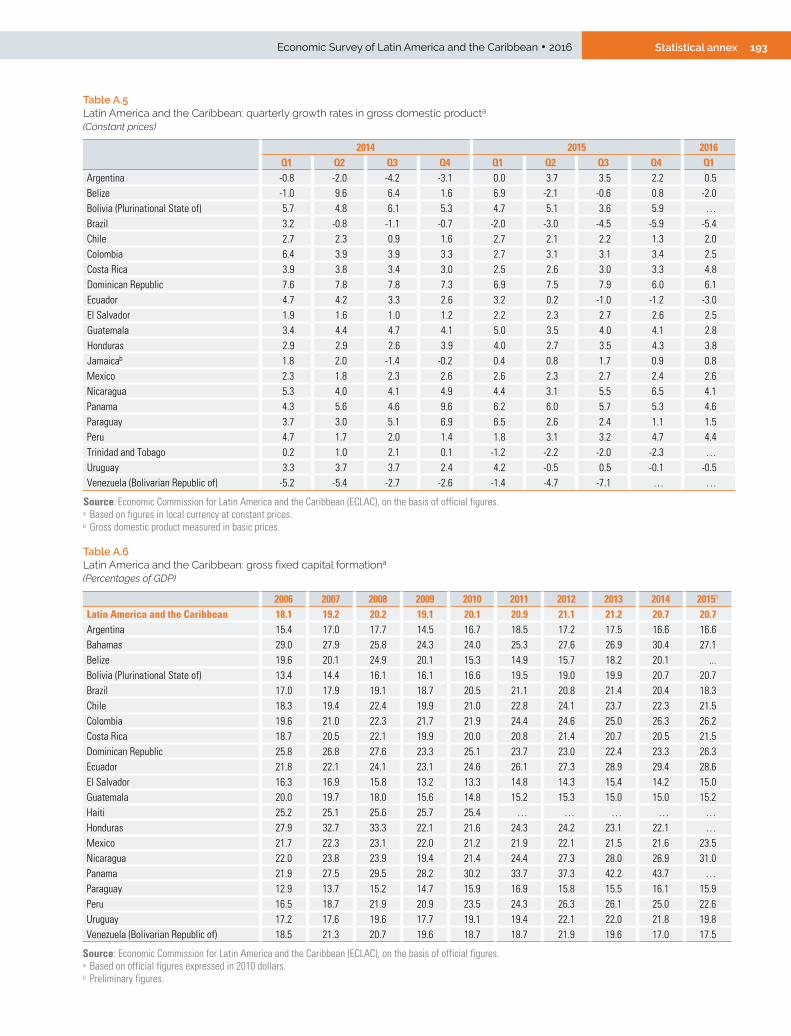
193Statistical annexEconomic Survey of Latin America and the Caribbean • 2016
Table A.5 Latin America and the Caribbean: quarterly growth rates in gross domestic producta
(Constant prices)
2014 2015 2016Q1 Q2 Q3 Q4 Q1 Q2 Q3 Q4 Q1
Argentina -0.8 -2.0 -4.2 -3.1 0.0 3.7 3.5 2.2 0.5Belize -1.0 9.6 6.4 1.6 6.9 -2.1 -0.6 0.8 -2.0Bolivia (Plurinational State of) 5.7 4.8 6.1 5.3 4.7 5.1 3.6 5.9 …Brazil 3.2 -0.8 -1.1 -0.7 -2.0 -3.0 -4.5 -5.9 -5.4Chile 2.7 2.3 0.9 1.6 2.7 2.1 2.2 1.3 2.0Colombia 6.4 3.9 3.9 3.3 2.7 3.1 3.1 3.4 2.5Costa Rica 3.9 3.8 3.4 3.0 2.5 2.6 3.0 3.3 4.8Dominican Republic 7.6 7.8 7.8 7.3 6.9 7.5 7.9 6.0 6.1Ecuador 4.7 4.2 3.3 2.6 3.2 0.2 -1.0 -1.2 -3.0El Salvador 1.9 1.6 1.0 1.2 2.2 2.3 2.7 2.6 2.5Guatemala 3.4 4.4 4.7 4.1 5.0 3.5 4.0 4.1 2.8Honduras 2.9 2.9 2.6 3.9 4.0 2.7 3.5 4.3 3.8Jamaicab 1.8 2.0 -1.4 -0.2 0.4 0.8 1.7 0.9 0.8Mexico 2.3 1.8 2.3 2.6 2.6 2.3 2.7 2.4 2.6Nicaragua 5.3 4.0 4.1 4.9 4.4 3.1 5.5 6.5 4.1Panama 4.3 5.6 4.6 9.6 6.2 6.0 5.7 5.3 4.6Paraguay 3.7 3.0 5.1 6.9 6.5 2.6 2.4 1.1 1.5Peru 4.7 1.7 2.0 1.4 1.8 3.1 3.2 4.7 4.4Trinidad and Tobago 0.2 1.0 2.1 0.1 -1.2 -2.2 -2.0 -2.3 …Uruguay 3.3 3.7 3.7 2.4 4.2 -0.5 0.5 -0.1 -0.5Venezuela (Bolivarian Republic of) -5.2 -5.4 -2.7 -2.6 -1.4 -4.7 -7.1 … …
Source: Economic Commission for Latin America and the Caribbean (ECLAC), on the basis of official figures.a Based on figures in local currency at constant prices.b Gross domestic product measured in basic prices.
Table A.6 Latin America and the Caribbean: gross fixed capital formationa
(Percentages of GDP)
2006 2007 2008 2009 2010 2011 2012 2013 2014 2015b
Latin America and the Caribbean 18.1 19.2 20.2 19.1 20.1 20.9 21.1 21.2 20.7 20.7Argentina 15.4 17.0 17.7 14.5 16.7 18.5 17.2 17.5 16.6 16.6Bahamas 29.0 27.9 25.8 24.3 24.0 25.3 27.6 26.9 30.4 27.1Belize 19.6 20.1 24.9 20.1 15.3 14.9 15.7 18.2 20.1 ...Bolivia (Plurinational State of) 13.4 14.4 16.1 16.1 16.6 19.5 19.0 19.9 20.7 20.7Brazil 17.0 17.9 19.1 18.7 20.5 21.1 20.8 21.4 20.4 18.3Chile 18.3 19.4 22.4 19.9 21.0 22.8 24.1 23.7 22.3 21.5Colombia 19.6 21.0 22.3 21.7 21.9 24.4 24.6 25.0 26.3 26.2Costa Rica 18.7 20.5 22.1 19.9 20.0 20.8 21.4 20.7 20.5 21.5Dominican Republic 25.8 26.8 27.6 23.3 25.1 23.7 23.0 22.4 23.3 26.3Ecuador 21.8 22.1 24.1 23.1 24.6 26.1 27.3 28.9 29.4 28.6 El Salvador 16.3 16.9 15.8 13.2 13.3 14.8 14.3 15.4 14.2 15.0 Guatemala 20.0 19.7 18.0 15.6 14.8 15.2 15.3 15.0 15.0 15.2 Haiti 25.2 25.1 25.6 25.7 25.4 … … … … … Honduras 27.9 32.7 33.3 22.1 21.6 24.3 24.2 23.1 22.1 … Mexico 21.7 22.3 23.1 22.0 21.2 21.9 22.1 21.5 21.6 23.5 Nicaragua 22.0 23.8 23.9 19.4 21.4 24.4 27.3 28.0 26.9 31.0 Panama 21.9 27.5 29.5 28.2 30.2 33.7 37.3 42.2 43.7 … Paraguay 12.9 13.7 15.2 14.7 15.9 16.9 15.8 15.5 16.1 15.9 Peru 16.5 18.7 21.9 20.9 23.5 24.3 26.3 26.1 25.0 22.6 Uruguay 17.2 17.6 19.6 17.7 19.1 19.4 22.1 22.0 21.8 19.8Venezuela (Bolivarian Republic of) 18.5 21.3 20.7 19.6 18.7 18.7 21.9 19.6 17.0 17.5
Source: Economic Commission for Latin America and the Caribbean (ECLAC), on the basis of official figures.a Based on official figures expressed in 2010 dollars. b Preliminary figures.
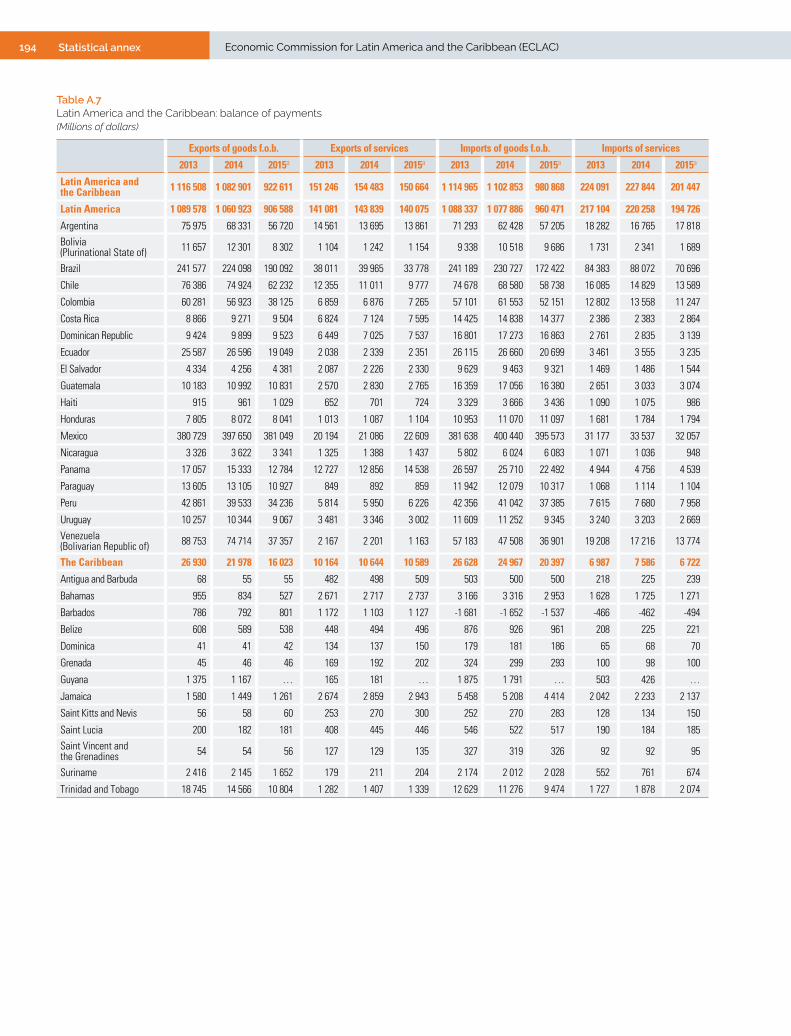
194 Statistical annex Economic Commission for Latin America and the Caribbean (ECLAC)
Table A.7 Latin America and the Caribbean: balance of payments(Millions of dollars)
Exports of goods f.o.b. Exports of services Imports of goods f.o.b. Imports of services
2013 2014 2015a 2013 2014 2015a 2013 2014 2015a 2013 2014 2015a
Latin America and the Caribbean 1 116 508 1 082 901 922 611 151 246 154 483 150 664 1 114 965 1 102 853 980 868 224 091 227 844 201 447
Latin America 1 089 578 1 060 923 906 588 141 081 143 839 140 075 1 088 337 1 077 886 960 471 217 104 220 258 194 726
Argentina 75 975 68 331 56 720 14 561 13 695 13 861 71 293 62 428 57 205 18 282 16 765 17 818
Bolivia (Plurinational State of) 11 657 12 301 8 302 1 104 1 242 1 154 9 338 10 518 9 686 1 731 2 341 1 689
Brazil 241 577 224 098 190 092 38 011 39 965 33 778 241 189 230 727 172 422 84 383 88 072 70 696
Chile 76 386 74 924 62 232 12 355 11 011 9 777 74 678 68 580 58 738 16 085 14 829 13 589
Colombia 60 281 56 923 38 125 6 859 6 876 7 265 57 101 61 553 52 151 12 802 13 558 11 247
Costa Rica 8 866 9 271 9 504 6 824 7 124 7 595 14 425 14 838 14 377 2 386 2 383 2 864
Dominican Republic 9 424 9 899 9 523 6 449 7 025 7 537 16 801 17 273 16 863 2 761 2 835 3 139
Ecuador 25 587 26 596 19 049 2 038 2 339 2 351 26 115 26 660 20 699 3 461 3 555 3 235
El Salvador 4 334 4 256 4 381 2 087 2 226 2 330 9 629 9 463 9 321 1 469 1 486 1 544
Guatemala 10 183 10 992 10 831 2 570 2 830 2 765 16 359 17 056 16 380 2 651 3 033 3 074
Haiti 915 961 1 029 652 701 724 3 329 3 666 3 436 1 090 1 075 986
Honduras 7 805 8 072 8 041 1 013 1 087 1 104 10 953 11 070 11 097 1 681 1 784 1 794
Mexico 380 729 397 650 381 049 20 194 21 086 22 609 381 638 400 440 395 573 31 177 33 537 32 057
Nicaragua 3 326 3 622 3 341 1 325 1 388 1 437 5 802 6 024 6 083 1 071 1 036 948
Panama 17 057 15 333 12 784 12 727 12 856 14 538 26 597 25 710 22 492 4 944 4 756 4 539
Paraguay 13 605 13 105 10 927 849 892 859 11 942 12 079 10 317 1 068 1 114 1 104
Peru 42 861 39 533 34 236 5 814 5 950 6 226 42 356 41 042 37 385 7 615 7 680 7 958
Uruguay 10 257 10 344 9 067 3 481 3 346 3 002 11 609 11 252 9 345 3 240 3 203 2 669
Venezuela (Bolivarian Republic of) 88 753 74 714 37 357 2 167 2 201 1 163 57 183 47 508 36 901 19 208 17 216 13 774
The Caribbean 26 930 21 978 16 023 10 164 10 644 10 589 26 628 24 967 20 397 6 987 7 586 6 722
Antigua and Barbuda 68 55 55 482 498 509 503 500 500 218 225 239
Bahamas 955 834 527 2 671 2 717 2 737 3 166 3 316 2 953 1 628 1 725 1 271
Barbados 786 792 801 1 172 1 103 1 127 -1 681 -1 652 -1 537 -466 -462 -494
Belize 608 589 538 448 494 496 876 926 961 208 225 221
Dominica 41 41 42 134 137 150 179 181 186 65 68 70
Grenada 45 46 46 169 192 202 324 299 293 100 98 100
Guyana 1 375 1 167 … 165 181 … 1 875 1 791 … 503 426 …
Jamaica 1 580 1 449 1 261 2 674 2 859 2 943 5 458 5 208 4 414 2 042 2 233 2 137
Saint Kitts and Nevis 56 58 60 253 270 300 252 270 283 128 134 150
Saint Lucia 200 182 181 408 445 446 546 522 517 190 184 185
Saint Vincent and the Grenadines 54 54 56 127 129 135 327 319 326 92 92 95
Suriname 2 416 2 145 1 652 179 211 204 2 174 2 012 2 028 552 761 674
Trinidad and Tobago 18 745 14 566 10 804 1 282 1 407 1 339 12 629 11 276 9 474 1 727 1 878 2 074

195Statistical annexEconomic Survey of Latin America and the Caribbean • 2016
Table A.7 (continued)
Goods and services balance Income balance Current transfers balance Current account balance
2013 2014 2015a 2013 2014 2015a 2013 2014 2015a 2013 2014 2015a
Latin America and the Caribbean -75 596 -97 543 -113 103 -150 562 -155 999 -132 103 62 551 65 588 67 273 -163 703 -187 954 -177 933
Latin America -74 781 -93 383 -108 533 -147 158 -152 330 -130 260 59 598 62 587 64 761 -162 341 -183 126 -174 032
Argentina 962 2 832 -4 443 -12 279 -10 732 -11 079 -826 -175 -412 -12 143 -8 075 -15 934
Bolivia (Plurinational State of) 1 692 684 -1 919 -1 908 -1 707 -1 173 1 270 1 084 1 169 1 054 61 -1 923
Brazil -45 984 -54 736 -19 249 -32 538 -52 170 -42 357 3 683 2 725 2 724 -74 839 -104 181 -58 882
Chile -2 022 2 526 -317 -10 405 -7 692 -6 194 2 115 1 849 1 750 -10 311 -3 316 -4 761
Colombia -2 762 -11 313 -18 007 -14 157 -12 638 -5 989 4 594 4 358 5 071 -12 326 -19 593 -18 925
Costa Rica -1 120 -826 -143 -1 868 -2 008 -2 312 269 254 252 -2 719 -2 580 -2 203
Dominican Republic -3 689 -3 185 -2 942 -2 994 -3 265 -3 045 4 147 4 309 4 680 -2 537 -2 141 -1 307
Ecuador -1 951 -1 280 -2 534 -1 380 -1 558 -1 745 2 399 2 264 2 078 -932 -574 -2 201
El Salvador -4 677 -4 467 -4 155 -992 -1 074 -1 137 4 083 4 234 4 372 -1 586 -1 307 -920
Guatemala -6 257 -6 267 -5 859 -1 207 -1 408 -1 423 6 113 6 445 7 079 -1 351 -1 230 -203
Haiti -2 852 -3 080 -2 669 32 12 10 2 283 2 291 2 436 -537 -776 -224
Honduras -3 815 -3 695 -3 746 -1 353 -1 322 -1 380 3 405 3 572 3 835 -1 763 -1 444 -1 291
Mexico -11 893 -15 241 -23 972 -40 170 -32 556 -32 209 21 653 22 915 24 307 -30 409 -24 882 -31 874
Nicaragua -2 222 -2 049 -2 252 -328 -314 -342 1 369 1 450 1 548 -1 180 -913 -1 045
Panama -1 757 -2 277 290 -2 707 -2 638 -3 599 63 120 -68 -4 401 -4 794 -3 377
Paraguay 1 443 804 365 -1 685 -1 537 -1 541 720 606 682 477 -127 -493
Peru -1 296 -3 240 -4 882 -10 631 -9 328 -6 823 3 346 4 372 3 331 -8 582 -8 196 -8 373
Uruguay -1 111 -764 54 -1 881 -2 022 -2 124 130 131 124 -2 861 -2 655 -1 947
Venezuela (Bolivarian Republic of) 14 529 12 191 -12 155 -8 707 -8 375 -5 798 -1 218 -218 -197 4 604 3 598 -18 150
The Caribbean -815 -4 160 -4 570 -3 404 -3 669 -1 843 2 953 3 001 2 512 -1 362 -4 828 -3 900
Antigua and Barbuda -171 -172 -175 -31 -37 -42 26 29 29 -176 -181 -189
Bahamas -1 168 -1 490 -960 -329 -438 -402 3 0 -46 -1 494 -1 928 -1 409
Barbados -189 -219 -104 -195 -197 -213 83 -14 2 -397 -431 -315
Belize -28 -67 -149 -118 -143 -95 73 74 70 -73 -136 -175
Dominica -68 -70 -63 -20 -19 -19 20 21 21 -68 -68 -61
Grenada -210 -159 -144 -30 -35 -30 18 26 21 -221 -168 -154
Guyana -838 -869 … 29 27 … 353 458 … -456 -385 …
Jamaica -3 246 -3 133 -2 347 -256 -286 -312 2 221 2 291 2 333 -1 281 -1 128 -326
Saint Kitts and Nevis -71 -75 -73 -23 -23 -27 45 45 42 -49 -54 -58
Saint Lucia -128 -78 -75 -26 -26 -21 5 10 10 -150 -94 -86
Saint Vincent and the Grenadines -236 -229 -229 0 0 -2 14 13 13 -223 -216 -218
Suriname -131 -417 -846 -131 -69 -27 67 71 65 -196 -415 -808
Trinidad and Tobago 5 670 2 820 595 -2 275 -2 421 -650 25 -21 -47 3 420 378 -101

196 Statistical annex Economic Commission for Latin America and the Caribbean (ECLAC)
Table A.7 (concluded)
Capital and financial balanceb Overall balance Reserve assets variationc Other financing
2013 2014 2015a 2013 2014 2015a 2013 2014 2015a 2013 2014 2015a
Latin America and the Caribbean 177 095 223 838 147 636 13 392 35 884 -30 296 -16 111 -38 001 26 823 2 206 1 319 2 496
Latin America 175 240 216 671 145 301 12 899 33 545 -28 732 -15 587 -35 780 25 327 2 175 1 409 2 496
Argentina -1 593 7 225 8 379 -13 736 -850 -7 555 11 830 -1 383 4 742 1 906 2 232 2 813
Bolivia (Plurinational State of) 67 909 280 1 122 971 -1 643 -1 122 -971 1 643 0 0 0
Brazil 68 912 115 014 60 451 -5 926 10 833 1 569 5 926 -10 833 -1 569 0 0 0
Chile 10 623 4 373 4 973 311 1 057 211 -311 -1 057 -211 0 0 0
Colombia 19 272 24 030 19 340 6 946 4 437 415 -6 946 -4 437 -415 0 0 0
Costa Rica 3 180 2 467 2 848 461 -113 645 -461 113 -645 0 0 0
Dominican Republic 3 877 2 789 2 077 1 341 648 770 -1 146 -195 -407 -197 -455 -365
Ecuador 2 778 149 712 1 846 -424 -1 489 -1 878 411 1 453 32 13 36
El Salvador 1 259 1 274 1 033 -327 -33 113 327 33 -113 0 0 0
Guatemala 2 053 1 302 678 702 73 475 -702 -73 -475 0 0 0
Haiti 178 681 66 -359 -94 -157 -58 479 155 418 -385 2
Honduras 2 235 1 904 1 584 473 459 293 -485 -459 -303 12 -1 10
Mexico 48 198 41 211 16 207 17 789 16 329 -15 667 -17 789 -16 329 15 667 0 0 0
Nicaragua 1 276 1 195 1 242 96 282 197 -96 -282 -197 0 0 0
Panama 4 292 5 175 2 260 -109 380 -1 117 -402 -1 205 210 0 0 0
Paraguay 558 1 265 -66 1 036 1 138 -560 -1 036 -1 131 560 0 -7 0
Peru 11 484 6 008 8 446 2 902 -2 188 73 -2 907 2 178 -73 5 10 0
Uruguay 5 784 4 015 159 2 923 1 360 -1 788 -2 923 -1 360 1 788 0 0 0
Venezuela (Bolivarian Republic of) -9 194 -4 316 14 632 -4 590 -718 -3 518 4 590 718 3 518 0 0 0
The Caribbean 1 855 7 167 2 336 493 2 339 -1 564 -524 -2 220 1 496 31 -90 0
Antigua and Barbuda 218 275 189 42 94 0 -42 -94 0 0 0 0
Bahamas 1 425 1 974 1 433 -69 46 24 69 -46 -24 0 2 0
Barbados 240 386 252 -157 -46 -63 157 46 63 0 0 0
Belize 190 221 71 117 85 -104 -114 -84 104 -4 -1 0
Dominica 61 86 61 -6 18 0 6 -18 0 0 0 0
Grenada 253 191 154 31 23 0 -31 -23 0 0 0 0
Guyana 505 408 … 49 22 … -84 -59 … 34 37 …
Jamaica 1 102 1 929 698 -179 800 372 179 -673 -440 0 -128 0
Saint Kitts and Nevis 89 81 58 40 27 0 -40 0 0 0 0 0
Saint Lucia 110 161 86 -40 67 0 40 -67 0 0 0 0
Saint Vincent and the Grenadines 249 239 218 26 23 0 -26 -23 0 0 0 0
Suriname 47 265 542 -149 -150 -266 149 150 266 0 0 0
Trinidad and Tobago -2 634 952 -1 427 786 1 330 -1 529 -786 -1 330 1 529 0 0 0
Source: Economic Commission for Latin America and the Caribbean (ECLAC), on the basis of official figures.a Preliminary figures.b Includes errors and omissions. c A minus sign (-) indicates an increase in reserve assets.
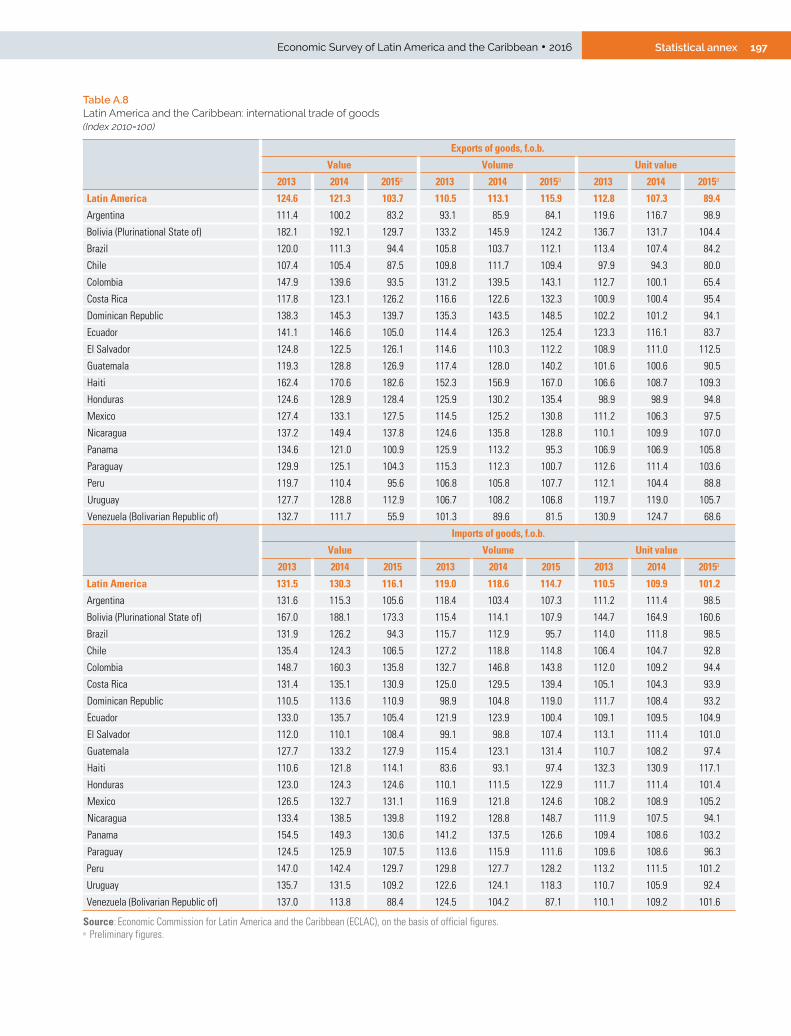
197Statistical annexEconomic Survey of Latin America and the Caribbean • 2016
Table A.8 Latin America and the Caribbean: international trade of goods(Index 2010=100)
Exports of goods, f.o.b.
Value Volume Unit value
2013 2014 2015a 2013 2014 2015a 2013 2014 2015a
Latin America 124.6 121.3 103.7 110.5 113.1 115.9 112.8 107.3 89.4
Argentina 111.4 100.2 83.2 93.1 85.9 84.1 119.6 116.7 98.9
Bolivia (Plurinational State of) 182.1 192.1 129.7 133.2 145.9 124.2 136.7 131.7 104.4
Brazil 120.0 111.3 94.4 105.8 103.7 112.1 113.4 107.4 84.2
Chile 107.4 105.4 87.5 109.8 111.7 109.4 97.9 94.3 80.0
Colombia 147.9 139.6 93.5 131.2 139.5 143.1 112.7 100.1 65.4
Costa Rica 117.8 123.1 126.2 116.6 122.6 132.3 100.9 100.4 95.4
Dominican Republic 138.3 145.3 139.7 135.3 143.5 148.5 102.2 101.2 94.1
Ecuador 141.1 146.6 105.0 114.4 126.3 125.4 123.3 116.1 83.7
El Salvador 124.8 122.5 126.1 114.6 110.3 112.2 108.9 111.0 112.5
Guatemala 119.3 128.8 126.9 117.4 128.0 140.2 101.6 100.6 90.5
Haiti 162.4 170.6 182.6 152.3 156.9 167.0 106.6 108.7 109.3
Honduras 124.6 128.9 128.4 125.9 130.2 135.4 98.9 98.9 94.8
Mexico 127.4 133.1 127.5 114.5 125.2 130.8 111.2 106.3 97.5
Nicaragua 137.2 149.4 137.8 124.6 135.8 128.8 110.1 109.9 107.0
Panama 134.6 121.0 100.9 125.9 113.2 95.3 106.9 106.9 105.8
Paraguay 129.9 125.1 104.3 115.3 112.3 100.7 112.6 111.4 103.6
Peru 119.7 110.4 95.6 106.8 105.8 107.7 112.1 104.4 88.8
Uruguay 127.7 128.8 112.9 106.7 108.2 106.8 119.7 119.0 105.7
Venezuela (Bolivarian Republic of) 132.7 111.7 55.9 101.3 89.6 81.5 130.9 124.7 68.6
Imports of goods, f.o.b.
Value Volume Unit value
2013 2014 2015 2013 2014 2015 2013 2014 2015a
Latin America 131.5 130.3 116.1 119.0 118.6 114.7 110.5 109.9 101.2
Argentina 131.6 115.3 105.6 118.4 103.4 107.3 111.2 111.4 98.5
Bolivia (Plurinational State of) 167.0 188.1 173.3 115.4 114.1 107.9 144.7 164.9 160.6
Brazil 131.9 126.2 94.3 115.7 112.9 95.7 114.0 111.8 98.5
Chile 135.4 124.3 106.5 127.2 118.8 114.8 106.4 104.7 92.8
Colombia 148.7 160.3 135.8 132.7 146.8 143.8 112.0 109.2 94.4
Costa Rica 131.4 135.1 130.9 125.0 129.5 139.4 105.1 104.3 93.9
Dominican Republic 110.5 113.6 110.9 98.9 104.8 119.0 111.7 108.4 93.2
Ecuador 133.0 135.7 105.4 121.9 123.9 100.4 109.1 109.5 104.9
El Salvador 112.0 110.1 108.4 99.1 98.8 107.4 113.1 111.4 101.0
Guatemala 127.7 133.2 127.9 115.4 123.1 131.4 110.7 108.2 97.4
Haiti 110.6 121.8 114.1 83.6 93.1 97.4 132.3 130.9 117.1
Honduras 123.0 124.3 124.6 110.1 111.5 122.9 111.7 111.4 101.4
Mexico 126.5 132.7 131.1 116.9 121.8 124.6 108.2 108.9 105.2
Nicaragua 133.4 138.5 139.8 119.2 128.8 148.7 111.9 107.5 94.1
Panama 154.5 149.3 130.6 141.2 137.5 126.6 109.4 108.6 103.2
Paraguay 124.5 125.9 107.5 113.6 115.9 111.6 109.6 108.6 96.3
Peru 147.0 142.4 129.7 129.8 127.7 128.2 113.2 111.5 101.2
Uruguay 135.7 131.5 109.2 122.6 124.1 118.3 110.7 105.9 92.4
Venezuela (Bolivarian Republic of) 137.0 113.8 88.4 124.5 104.2 87.1 110.1 109.2 101.6
Source: Economic Commission for Latin America and the Caribbean (ECLAC), on the basis of official figures.a Preliminary figures.

198 Statistical annex Economic Commission for Latin America and the Caribbean (ECLAC)
Table A.9 Latin America and the Caribbean: exports of goods, f.o.b.(Millions of dollars)
2014 2015 2016
Q1 Q2 Q3 Q4 Q1 Q2 Q3 Q4 Q1 Q2
Latin America and the Caribbean 250 584 285 193 281 299 256 186 218 529 242 332 228 373 219 235 185 426 120 127
Latin America 246 341 280 855 275 943 251 854 215 001 239 053 227 226 218 373 185 426 120 127
Argentina 13 836 20 860 18 520 15 191 12 058 16 405 15 866 12 459 12 404 4 756a
Bolivia (Plurinational State of) 3 183 3 420 3 443 2 847 2 290 2 323 2 171 1 942 1 604 530a
Brazil 49 358 60 678 62 858 51 203 42 539 51 338 49 860 46 356 40 375 32 800b
Chile 18 942 19 678 17 849 18 455 16 929 15 957 14 457 14 890 15 064 10 118b
Colombia 13 488 14 511 14 931 11 865 9 493 9 781 8 691 7 725 6 481 2 418a
Costa Rica 2 862 3 018 2 807 2 575 2 389 2 540 2 279 2 371 2 493 904a
Dominican Republic 2 380 2 538 2 546 2 435 2 266 2 512 2 457 2 288 … …
Ecuador 6 655 6 785 6 526 5 759 4 870 4 934 4 438 4 088 3 627 1 263a
El Salvador 1 289 1 379 1 354 1 251 1 428 1 399 1 397 1 260 1 280 507a
Guatemala 2 677 2 777 2 706 2 643 2 769 2 823 2 658 2 427 2 639 939a
Haiti 224 201 249 277 253 215 277 284 103 41a
Honduras 1 985 2 163 1 978 1 947 2 143 2 199 1 882 1 818 … …
Mexico 90 759 101 870 101 121 103 162 90 461 97 976 95 891 96 295 85 148 61 741b
Nicaragua 687 685 644 617 672 669 567 515 554 226a
Panama 3 218 4 095 4 312 3 708 3 240 3 181 3 216 3 147 2 407 …
Paraguay 2 524 2 998 2 325 1 789 2 447 2 091 2 008 1 810 2 175 759a
Peru 9 780 9 491 10 364 9 898 8 164 8 275 8 590 9 207 7 751 2 713a
Uruguay 1 782 2 907 2 573 1 870 1 654 2 328 2 037 1 661 1 425 454a
Venezuela (Bolivarian Republic of) 20 713 20 801 18 838 14 362 8 936 12 108 8 483 7 830 … …
The Caribbean 4 243 4 338 5 356 4 332 3 529 3 279 1 147 863 … …
Antigua and Barbuda 5 9 5 5 5 13 5 4 … …
Bahamas 123 127 140 134 … … … … … …
Barbados 122 108 108 136 113 104 119 147 … …
Belize 82 111 92 70 87 97 … … … …
Dominica 10 8 9 10 10 8 6 6 … …
Grenada 10 12 8 7 8 10 8 6 … …
Guyana 251 278 298 328 227 298 268 … … …
Jamaica 384 356 375 334 338 344 287 298 … …
Saint Kitts and Nevis 14 15 13 15 15 13 15 16 … …
Saint Lucia 32 47 46 36 62 48 36 35 … …
Saint Vincent and the Grenadines 11 11 13 12 10 12 11 12 … …
Suriname 540 541 541 523 481 438 394 340 … …
Trinidad and Tobago 2 659 2 714 3 709 2 724 2 173 1 894 … … … …
Source: Economic Commission for Latin America and the Caribbean (ECLAC), on the basis of official figures.a Figures as of April.b Figures as of May.

199Statistical annexEconomic Survey of Latin America and the Caribbean • 2016
Table A.10 Latin America and the Caribbean: imports of goods, c.i.f.(Millions of dollars)
2014 2015 2016
Q1 Q2 Q3 Q4 Q1 Q2 Q3 Q4 Q1 Q2
Latin America and the Caribbean 261 919 278 085 286 941 281 416 246 165 247 401 250 631 237 071 191 107 113 061
Latin America 255 242 272 031 281 521 274 239 239 857 242 511 247 556 234 311 191 107 113 061
Argentina CIF 16 282 17 154 17 032 14 761 13 242 15 704 16 625 14 185 12 793 4 423ª
Bolivia (Plurinational State of) FOB 2 241 2 219 2 697 2 704 2 232 2 137 2 252 2 498 1 869 584a
Brazil FOB 55 739 57 789 61 783 55 416 48 347 44 265 42 193 37 617 32 579 21 902b
Chile FOB 17 126 16 951 17 164 17 338 14 690 13 774 15 449 14 825 12 955 8 817b
Colombia FOB 14 079 15 054 16 037 15 918 13 463 12 514 13 289 12 332 10 079 3 536a
Costa Rica CIF 4 520 4 404 4 240 4 022 3 691 3 823 3 963 4 028 3 666 1 369a
Dominican Republic CIF 3 976 4 475 4 428 4 394 3 941 4 296 4 373 4 254 … …
Ecuador CIF 6 470 6 881 7 003 7 372 6 103 5 519 5 169 4 727 3 880 1 209a
El Salvador CIF 2 615 2 756 2 534 2 608 2 534 2 676 2 647 2 558 2 328 866a
Guatemala CIF 4 380 4 632 4 625 4 645 4 185 4 424 4 632 4 400 3 931 1 438a
Haiti CIF 934 921 934 956 968 950 945 820 742 315a
Honduras FOB 2 556 2 867 2 883 2 764 2 837 2 861 2 719 2 680 … …
Mexico FOB 92 064 100 864 102 840 104 209 92 605 99 985 102 562 100 080 89 133 64 348b
Nicaragua FOB 1 236 1 334 1 348 1 535 1 279 1 348 1 331 1 476 1 333 459a
Panama FOB 5 612 6 662 7 001 6 434 5 665 5 417 6 146 5 264 4 561 …
Paraguay FOB 2 587 2 698 3 044 2 970 2 445 2 381 2 452 2 251 1 940 633a
Peru FOB 10 185 10 364 10 583 9 910 9 256 9 344 9 445 9 340 8 380 2 700a
Uruguay FOB 2 854 2 711 2 598 2 600 2 438 2 315 2 098 2 053 1 680 776a
Venezuela (Bolivarian Republic of) FOB 9 786 11 296 12 744 13 682 9 935 8 778 9 265 8 923 … …
The Caribbean 6 677 6 054 5 421 7 177 6 308 4 890 3 076 2 760 … …
Antigua and Barbuda CIF 158 124 136 134 126 119 115 129 … …
Bahamas CIF 654 692 0 756 819 … … … … …
Barbados CIF 423 444 428 445 373 414 386 446 … …
Belize CIF 221 257 254 273 245 254 … … … …
Dominica CIF 50 56 61 63 53 52 56 57 … …
Grenada CIF 83 87 88 82 81 86 89 93 … …
Guyana CIF 406 441 466 478 375 395 355 … … …
Jamaica CIF 1 439 1 473 1 503 1 499 1 260 1 325 1 237 1 210 … …
Saint Kitts and Nevis CIF 59 63 62 84 71 74 93 136 … …
Saint Lucia CIF 157 155 150 166 151 130 140 149 … …
Saint Vincent and the Grenadines CIF 80 95 89 97 75 81 81 97 … …
Suriname CIF 474 505 505 528 534 527 523 443 … …
Trinidad and Tobago CIF 2 473 1 662 1 679 2 572 2 146 1 434 … … … …
Source: Economic Commission for Latin America and the Caribbean (ECLAC), on the basis of official figures.a Figures as of April.b Figures as of May.
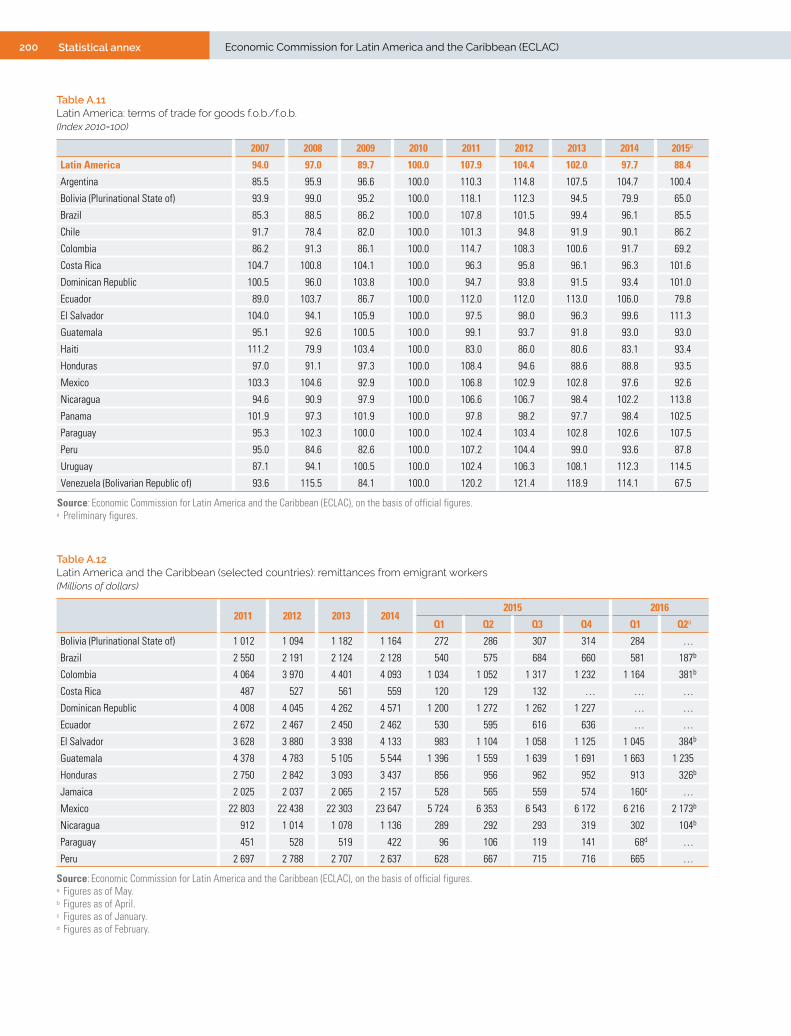
200 Statistical annex Economic Commission for Latin America and the Caribbean (ECLAC)
Table A.11 Latin America: terms of trade for goods f.o.b./f.o.b.(Index 2010=100)
2007 2008 2009 2010 2011 2012 2013 2014 2015a
Latin America 94.0 97.0 89.7 100.0 107.9 104.4 102.0 97.7 88.4
Argentina 85.5 95.9 96.6 100.0 110.3 114.8 107.5 104.7 100.4
Bolivia (Plurinational State of) 93.9 99.0 95.2 100.0 118.1 112.3 94.5 79.9 65.0
Brazil 85.3 88.5 86.2 100.0 107.8 101.5 99.4 96.1 85.5
Chile 91.7 78.4 82.0 100.0 101.3 94.8 91.9 90.1 86.2
Colombia 86.2 91.3 86.1 100.0 114.7 108.3 100.6 91.7 69.2
Costa Rica 104.7 100.8 104.1 100.0 96.3 95.8 96.1 96.3 101.6
Dominican Republic 100.5 96.0 103.8 100.0 94.7 93.8 91.5 93.4 101.0
Ecuador 89.0 103.7 86.7 100.0 112.0 112.0 113.0 106.0 79.8
El Salvador 104.0 94.1 105.9 100.0 97.5 98.0 96.3 99.6 111.3
Guatemala 95.1 92.6 100.5 100.0 99.1 93.7 91.8 93.0 93.0
Haiti 111.2 79.9 103.4 100.0 83.0 86.0 80.6 83.1 93.4
Honduras 97.0 91.1 97.3 100.0 108.4 94.6 88.6 88.8 93.5
Mexico 103.3 104.6 92.9 100.0 106.8 102.9 102.8 97.6 92.6
Nicaragua 94.6 90.9 97.9 100.0 106.6 106.7 98.4 102.2 113.8
Panama 101.9 97.3 101.9 100.0 97.8 98.2 97.7 98.4 102.5
Paraguay 95.3 102.3 100.0 100.0 102.4 103.4 102.8 102.6 107.5
Peru 95.0 84.6 82.6 100.0 107.2 104.4 99.0 93.6 87.8
Uruguay 87.1 94.1 100.5 100.0 102.4 106.3 108.1 112.3 114.5
Venezuela (Bolivarian Republic of) 93.6 115.5 84.1 100.0 120.2 121.4 118.9 114.1 67.5
Source: Economic Commission for Latin America and the Caribbean (ECLAC), on the basis of official figures.a Preliminary figures.
Table A.12 Latin America and the Caribbean (selected countries): remittances from emigrant workers(Millions of dollars)
2011 2012 2013 20142015 2016
Q1 Q2 Q3 Q4 Q1 Q2a
Bolivia (Plurinational State of) 1 012 1 094 1 182 1 164 272 286 307 314 284 …
Brazil 2 550 2 191 2 124 2 128 540 575 684 660 581 187b
Colombia 4 064 3 970 4 401 4 093 1 034 1 052 1 317 1 232 1 164 381b
Costa Rica 487 527 561 559 120 129 132 … … …
Dominican Republic 4 008 4 045 4 262 4 571 1 200 1 272 1 262 1 227 … …
Ecuador 2 672 2 467 2 450 2 462 530 595 616 636 … …
El Salvador 3 628 3 880 3 938 4 133 983 1 104 1 058 1 125 1 045 384b
Guatemala 4 378 4 783 5 105 5 544 1 396 1 559 1 639 1 691 1 663 1 235
Honduras 2 750 2 842 3 093 3 437 856 956 962 952 913 326b
Jamaica 2 025 2 037 2 065 2 157 528 565 559 574 160c …
Mexico 22 803 22 438 22 303 23 647 5 724 6 353 6 543 6 172 6 216 2 173b
Nicaragua 912 1 014 1 078 1 136 289 292 293 319 302 104b
Paraguay 451 528 519 422 96 106 119 141 68d …
Peru 2 697 2 788 2 707 2 637 628 667 715 716 665 …
Source: Economic Commission for Latin America and the Caribbean (ECLAC), on the basis of official figures.a Figures as of May.b Figures as of April.c Figures as of January.d Figures as of February.

201Statistical annexEconomic Survey of Latin America and the Caribbean • 2016
Table A.13 Latin America and the Caribbean: net resource transfera
(Millions of dollars)
2007 2008 2009 2010 2011 2012 2013 2014 2015b
Latin America and the Caribbean 16 200 -32 318 -22 561 31 768 46 026 34 479 28 739 69 158 18 030
Latin America 17 867 -29 931 -21 533 34 766 48 045 32 991 30 258 65 749 17 537
Argentina -198 -14 284 -15 962 -8 161 -15 507 -14 722 -11 966 -1 275 113
Bolivia (Plurinational State of) -43 -154 -1 094 -707 923 -1 888 -1 840 -797 -893
Brazil 56 642 -9 401 37 269 57 870 65 194 38 810 36 374 62 844 18 094
Chile -29 153 -1 352 -13 265 -15 432 3 358 -2 016 218 -3 318 -1 222
Colombia 2 776 -669 -2 857 576 -2 047 1 687 5 115 11 391 13 352
Costa Rica 1 929 2 022 -22 762 1 049 3 151 1 312 459 536
Cuba -960 … … … … … … … …
Dominican Republic 665 2 462 1 248 3 167 2 522 1 079 686 -931 -1 333
Ecuador -2 357 -2 246 -2 264 -625 -522 -1 614 1 431 -1 396 -997
El Salvador 1 039 1 477 -36 -303 79 1 039 267 200 -104
Guatemala 1 159 809 -902 29 154 511 846 -105 -745
Haiti 688 374 373 969 573 788 627 309 79
Honduras 612 1 530 -429 546 521 32 894 581 214
Mexico 2 423 8 201 -1 921 12 579 21 204 8 679 8 028 8 655 -16 002
Nicaragua 1 124 1 316 895 761 993 777 948 881 901
Panama 712 1 732 -664 1 223 2 854 673 1 585 2 537 -1 339
Paraguay -1 046 -915 -767 -1 036 -603 -1 184 -1 127 -279 -1 607
Peru -165 -288 -6 728 3 531 -5 495 7 527 857 -3 310 1 623
Uruguay 710 3 045 929 -1 131 2 248 4 343 3 903 1 993 -1 966
Venezuela (Bolivarian Republic of) -18 691 -23 589 -15 337 -19 853 -29 453 -14 681 -17 901 -12 691 8 834
The Caribbean -1 667 -2 387 -1 027 -2 998 -2 019 1 487 -1 518 3 409 493
Antigua and Barbuda 333 292 108 146 88 136 187 238 147
Bahamas 723 903 909 627 992 1 162 1 096 1 538 1 031
Barbados 233 136 182 116 254 251 45 188 39
Belize -84 38 22 -107 -60 -32 68 77 -24
Dominica 66 108 118 72 64 79 42 67 42
Grenada 211 201 160 154 177 157 223 156 124
Guyana 137 262 -51 101 341 311 568 471 …
Jamaica 937 2 120 430 871 1 326 439 846 1 514 386
Saint Kitts and Nevis 89 183 172 142 143 66 66 58 31
Saint Lucia 295 257 125 195 231 158 84 135 65
Saint Vincent and the Grenadines 168 204 189 221 163 208 249 239 216
Suriname -181 -96 -68 -720 -569 -175 -84 196 514
Trinidad and Tobago -4 594 -6 995 -3 324 -4 816 -5 170 -1 273 -4 909 -1 469 -2 077
Source: Economic Commission for Latin America and the Caribbean (ECLAC), on the basis of official figures.a The net resource transfer is calculated as total net capital income minus the income balance (net payments of profits and interest). Total net capital income is the balance
on the capital and financial accounts plus errors and omissions, plus loans and the use of IMF credit plus exceptional financing. Negative figures indicate resources transferred outside the country.
b Preliminary figures.
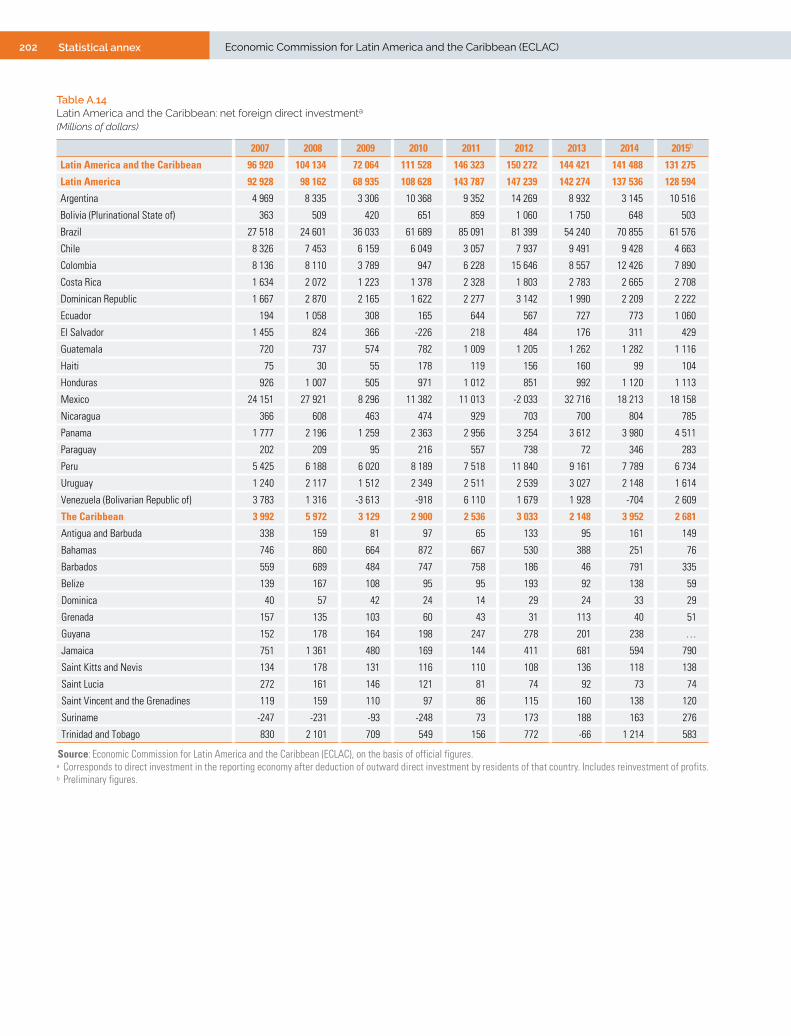
202 Statistical annex Economic Commission for Latin America and the Caribbean (ECLAC)
Table A.14 Latin America and the Caribbean: net foreign direct investmenta
(Millions of dollars)
2007 2008 2009 2010 2011 2012 2013 2014 2015b
Latin America and the Caribbean 96 920 104 134 72 064 111 528 146 323 150 272 144 421 141 488 131 275
Latin America 92 928 98 162 68 935 108 628 143 787 147 239 142 274 137 536 128 594
Argentina 4 969 8 335 3 306 10 368 9 352 14 269 8 932 3 145 10 516
Bolivia (Plurinational State of) 363 509 420 651 859 1 060 1 750 648 503
Brazil 27 518 24 601 36 033 61 689 85 091 81 399 54 240 70 855 61 576
Chile 8 326 7 453 6 159 6 049 3 057 7 937 9 491 9 428 4 663
Colombia 8 136 8 110 3 789 947 6 228 15 646 8 557 12 426 7 890
Costa Rica 1 634 2 072 1 223 1 378 2 328 1 803 2 783 2 665 2 708
Dominican Republic 1 667 2 870 2 165 1 622 2 277 3 142 1 990 2 209 2 222
Ecuador 194 1 058 308 165 644 567 727 773 1 060
El Salvador 1 455 824 366 -226 218 484 176 311 429
Guatemala 720 737 574 782 1 009 1 205 1 262 1 282 1 116
Haiti 75 30 55 178 119 156 160 99 104
Honduras 926 1 007 505 971 1 012 851 992 1 120 1 113
Mexico 24 151 27 921 8 296 11 382 11 013 -2 033 32 716 18 213 18 158
Nicaragua 366 608 463 474 929 703 700 804 785
Panama 1 777 2 196 1 259 2 363 2 956 3 254 3 612 3 980 4 511
Paraguay 202 209 95 216 557 738 72 346 283
Peru 5 425 6 188 6 020 8 189 7 518 11 840 9 161 7 789 6 734
Uruguay 1 240 2 117 1 512 2 349 2 511 2 539 3 027 2 148 1 614
Venezuela (Bolivarian Republic of) 3 783 1 316 -3 613 -918 6 110 1 679 1 928 -704 2 609
The Caribbean 3 992 5 972 3 129 2 900 2 536 3 033 2 148 3 952 2 681
Antigua and Barbuda 338 159 81 97 65 133 95 161 149
Bahamas 746 860 664 872 667 530 388 251 76
Barbados 559 689 484 747 758 186 46 791 335
Belize 139 167 108 95 95 193 92 138 59
Dominica 40 57 42 24 14 29 24 33 29
Grenada 157 135 103 60 43 31 113 40 51
Guyana 152 178 164 198 247 278 201 238 …
Jamaica 751 1 361 480 169 144 411 681 594 790
Saint Kitts and Nevis 134 178 131 116 110 108 136 118 138
Saint Lucia 272 161 146 121 81 74 92 73 74
Saint Vincent and the Grenadines 119 159 110 97 86 115 160 138 120
Suriname -247 -231 -93 -248 73 173 188 163 276
Trinidad and Tobago 830 2 101 709 549 156 772 -66 1 214 583
Source: Economic Commission for Latin America and the Caribbean (ECLAC), on the basis of official figures.a Corresponds to direct investment in the reporting economy after deduction of outward direct investment by residents of that country. Includes reinvestment of profits.b Preliminary figures.
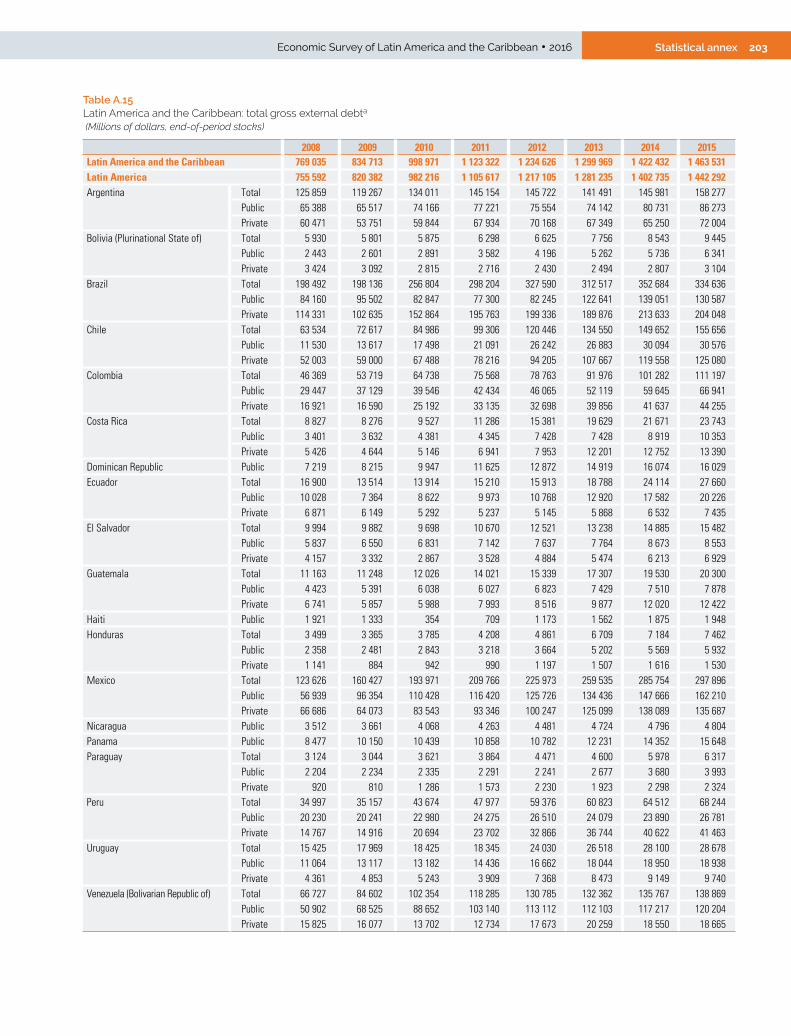
203Statistical annexEconomic Survey of Latin America and the Caribbean • 2016
Table A.15 Latin America and the Caribbean: total gross external debta
(Millions of dollars, end-of-period stocks)
2008 2009 2010 2011 2012 2013 2014 2015Latin America and the Caribbean 769 035 834 713 998 971 1 123 322 1 234 626 1 299 969 1 422 432 1 463 531 Latin America 755 592 820 382 982 216 1 105 617 1 217 105 1 281 235 1 402 735 1 442 292 Argentina Total 125 859 119 267 134 011 145 154 145 722 141 491 145 981 158 277
Public 65 388 65 517 74 166 77 221 75 554 74 142 80 731 86 273Private 60 471 53 751 59 844 67 934 70 168 67 349 65 250 72 004
Bolivia (Plurinational State of) Total 5 930 5 801 5 875 6 298 6 625 7 756 8 543 9 445Public 2 443 2 601 2 891 3 582 4 196 5 262 5 736 6 341Private 3 424 3 092 2 815 2 716 2 430 2 494 2 807 3 104
Brazil Total 198 492 198 136 256 804 298 204 327 590 312 517 352 684 334 636Public 84 160 95 502 82 847 77 300 82 245 122 641 139 051 130 587Private 114 331 102 635 152 864 195 763 199 336 189 876 213 633 204 048
Chile Total 63 534 72 617 84 986 99 306 120 446 134 550 149 652 155 656Public 11 530 13 617 17 498 21 091 26 242 26 883 30 094 30 576Private 52 003 59 000 67 488 78 216 94 205 107 667 119 558 125 080
Colombia Total 46 369 53 719 64 738 75 568 78 763 91 976 101 282 111 197Public 29 447 37 129 39 546 42 434 46 065 52 119 59 645 66 941Private 16 921 16 590 25 192 33 135 32 698 39 856 41 637 44 255
Costa Rica Total 8 827 8 276 9 527 11 286 15 381 19 629 21 671 23 743Public 3 401 3 632 4 381 4 345 7 428 7 428 8 919 10 353Private 5 426 4 644 5 146 6 941 7 953 12 201 12 752 13 390
Dominican Republic Public 7 219 8 215 9 947 11 625 12 872 14 919 16 074 16 029Ecuador Total 16 900 13 514 13 914 15 210 15 913 18 788 24 114 27 660
Public 10 028 7 364 8 622 9 973 10 768 12 920 17 582 20 226Private 6 871 6 149 5 292 5 237 5 145 5 868 6 532 7 435
El Salvador Total 9 994 9 882 9 698 10 670 12 521 13 238 14 885 15 482Public 5 837 6 550 6 831 7 142 7 637 7 764 8 673 8 553Private 4 157 3 332 2 867 3 528 4 884 5 474 6 213 6 929
Guatemala Total 11 163 11 248 12 026 14 021 15 339 17 307 19 530 20 300Public 4 423 5 391 6 038 6 027 6 823 7 429 7 510 7 878Private 6 741 5 857 5 988 7 993 8 516 9 877 12 020 12 422
Haiti Public 1 921 1 333 354 709 1 173 1 562 1 875 1 948Honduras Total 3 499 3 365 3 785 4 208 4 861 6 709 7 184 7 462
Public 2 358 2 481 2 843 3 218 3 664 5 202 5 569 5 932Private 1 141 884 942 990 1 197 1 507 1 616 1 530
Mexico Total 123 626 160 427 193 971 209 766 225 973 259 535 285 754 297 896Public 56 939 96 354 110 428 116 420 125 726 134 436 147 666 162 210Private 66 686 64 073 83 543 93 346 100 247 125 099 138 089 135 687
Nicaragua Public 3 512 3 661 4 068 4 263 4 481 4 724 4 796 4 804Panama Public 8 477 10 150 10 439 10 858 10 782 12 231 14 352 15 648Paraguay Total 3 124 3 044 3 621 3 864 4 471 4 600 5 978 6 317
Public 2 204 2 234 2 335 2 291 2 241 2 677 3 680 3 993Private 920 810 1 286 1 573 2 230 1 923 2 298 2 324
Peru Total 34 997 35 157 43 674 47 977 59 376 60 823 64 512 68 244Public 20 230 20 241 22 980 24 275 26 510 24 079 23 890 26 781Private 14 767 14 916 20 694 23 702 32 866 36 744 40 622 41 463
Uruguay Total 15 425 17 969 18 425 18 345 24 030 26 518 28 100 28 678Public 11 064 13 117 13 182 14 436 16 662 18 044 18 950 18 938Private 4 361 4 853 5 243 3 909 7 368 8 473 9 149 9 740
Venezuela (Bolivarian Republic of) Total 66 727 84 602 102 354 118 285 130 785 132 362 135 767 138 869Public 50 902 68 525 88 652 103 140 113 112 112 103 117 217 120 204Private 15 825 16 077 13 702 12 734 17 673 20 259 18 550 18 665

204 Statistical annex Economic Commission for Latin America and the Caribbean (ECLAC)
2008 2009 2010 2011 2012 2013 2014 2015The Caribbean 13 442 14 331 16 755 17 705 17 521 18 734 19 697 21 240 Antigua and Barbuda Public 436 416 432 467 445 577 560 570Bahamas Public 384 703 728 799 1 038 1 188 1 593 1 671Barbados Public 989 1 198 1 359 1 385 1 322 1 434 1 507 1 430Belize Public 958 1 017 1 021 1 032 1 029 1 083 1 127 1 177Dominica Public 234 222 232 238 263 273 278 281Grenada Public 481 512 528 535 535 562 578 593Guyana Public 834 933 1 043 1 206 1 358 1 246 1 216 1 143Jamaica Public 6 344 6 594 8 390 8 626 8 256 8 310 8 659 10 314Saint Kitts and Nevis Public 312 325 296 320 317 320 280 210Saint Lucia Public 364 373 393 417 435 488 526 457Saint Vincent and the Grenadines Public 229 262 313 328 329 354 385 378Suriname Public 319 269 334 463 567 739 810 876Trinidad and Tobago Public 1 557 1 507 1 686 1 891 1 627 2 160 2 181 2 139
Source: Economic Commission for Latin America and the Caribbean (ECLAC), on the basis of official figures.a Includes debt owed to the International Monetary Fund.
Table A.15 (concluded)
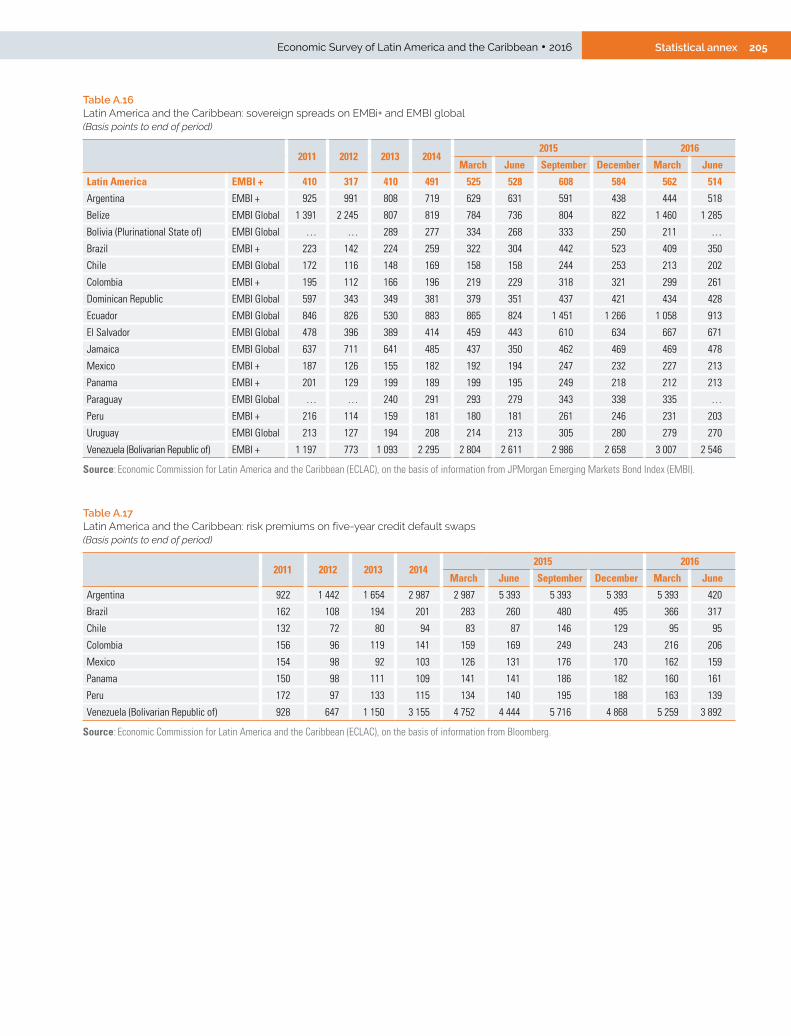
205Statistical annexEconomic Survey of Latin America and the Caribbean • 2016
Table A.16 Latin America and the Caribbean: sovereign spreads on EMBi+ and EMBI global(Basis points to end of period)
2011 2012 2013 20142015 2016
March June September December March June
Latin America EMBI + 410 317 410 491 525 528 608 584 562 514
Argentina EMBI + 925 991 808 719 629 631 591 438 444 518
Belize EMBI Global 1 391 2 245 807 819 784 736 804 822 1 460 1 285
Bolivia (Plurinational State of) EMBI Global … … 289 277 334 268 333 250 211 …
Brazil EMBI + 223 142 224 259 322 304 442 523 409 350
Chile EMBI Global 172 116 148 169 158 158 244 253 213 202
Colombia EMBI + 195 112 166 196 219 229 318 321 299 261
Dominican Republic EMBI Global 597 343 349 381 379 351 437 421 434 428
Ecuador EMBI Global 846 826 530 883 865 824 1 451 1 266 1 058 913
El Salvador EMBI Global 478 396 389 414 459 443 610 634 667 671
Jamaica EMBI Global 637 711 641 485 437 350 462 469 469 478
Mexico EMBI + 187 126 155 182 192 194 247 232 227 213
Panama EMBI + 201 129 199 189 199 195 249 218 212 213
Paraguay EMBI Global … … 240 291 293 279 343 338 335 …
Peru EMBI + 216 114 159 181 180 181 261 246 231 203
Uruguay EMBI Global 213 127 194 208 214 213 305 280 279 270
Venezuela (Bolivarian Republic of) EMBI + 1 197 773 1 093 2 295 2 804 2 611 2 986 2 658 3 007 2 546
Source: Economic Commission for Latin America and the Caribbean (ECLAC), on the basis of information from JPMorgan Emerging Markets Bond Index (EMBI).
Table A.17 Latin America and the Caribbean: risk premiums on five-year credit default swaps(Basis points to end of period)
2011 2012 2013 20142015 2016
March June September December March June
Argentina 922 1 442 1 654 2 987 2 987 5 393 5 393 5 393 5 393 420
Brazil 162 108 194 201 283 260 480 495 366 317
Chile 132 72 80 94 83 87 146 129 95 95
Colombia 156 96 119 141 159 169 249 243 216 206
Mexico 154 98 92 103 126 131 176 170 162 159
Panama 150 98 111 109 141 141 186 182 160 161
Peru 172 97 133 115 134 140 195 188 163 139
Venezuela (Bolivarian Republic of) 928 647 1 150 3 155 4 752 4 444 5 716 4 868 5 259 3 892
Source: Economic Commission for Latin America and the Caribbean (ECLAC), on the basis of information from Bloomberg.

206 Statistical annex Economic Commission for Latin America and the Caribbean (ECLAC)
Table A.18 Latin America and the Caribbean: international bond issuesa
(Millions of dollars)
2011 2012 2013 20142015 2016
Q1 Q2 Q3 Q4 Q1 Q2Total 91 687 114 241 123 332 133 056 30 537 31 147 9 375 7 974 29 764 45 676Latin America and the Caribbean 90 272 111 757 121 518 129 743 29 120 30 696 9 120 6 927 28 521 43 468Argentina 2 449 663 1 025 1 941 1 286 2 000 … 300 2 610 24 065Bahamas … … … 300 … … … … … …Barbados … … … 2 500 … … 320 … … …Bolivia (Plurinational State of) … 500 500 … … … … … … …Brazil 38 369 50 255 37 262 45 364 … 7 188 … … 1 500 10 047Chile 6 049 9 443 11 540 13 768 1 263 3 884 2 425 79 2 650 94Colombia 6 411 7 459 10 012 9 200 3 000 1 900 1 500 … 1 760 1 801Costa Rica 250 1 250 3 000 1 000 1 000 … … 127 … 500Dominican Republic 750 750 1 800 1 500 2 500 1 000 … … 1 000 870Ecuador … … … 2 000 750 750 … … … …El Salvador 654 800 310 800 … 300 … … … …Guatemala 150 1 400 1 300 1 100 … … … … … 700Honduras … … 1 000 … … … … … … …Jamaica 694 1 750 1 800 1 800 925 … 2 000 … … …Mexico 22 276 28 147 41 729 37 592 13 945 11 589 825 4 016 16 291 4 180Panama 897 1 100 1 350 1 935 1 250 450 … … 1 000 575Paraguay 100 500 500 1 000 … 280 … … 600 …Peru 2 155 7 240 5 840 5 944 2 002 1 155 2 050 1 200 1 110 550Suriname … … … … … … … … … 86Trinidad and Tobago 175 … 550 … … … … … … …Uruguay 1 693 500 2 000 2 000 1 200 200 … 1 205 … …Venezuela (Bolivarian Republic of) 7 200 … … … … … … … … …Supranational issues 1 415 2 484 1 814 3 313 1 417 451 255 1 048 1 243 2 208Central American Bank for Economic Integration (CABEI) … 250 520 505 128 207 50 136 196 306
Caribbean Development Bank (CDB) 175 … … … … … … … … …Foreign Trade Bank of Latin America (BLADEX) … 400 … … … … … … … 73Development Bank of Latin America (CAF) 1 240 1 834 1 294 2 808 1 289 244 205 912 1 047 1 330Inter-American Investment Corporation (IIC) … … … … … … … … … 500
Source: Economic Commission for Latin America and the Caribbean (ECLAC), on the basis of official figures from LatinFinance Bonds Database and Bloomberg.a Includes sovereign, bank and corporate bonds.
Table A.19 Latin America and the Caribbean: stock exchange indices (National indices to end of period, 31 December 2005=100)
2011 2012 2013 20142015 2016
March June September December March JuneArgentina 160 185 349 556 702 755 636 757 842 951 Brazil 170 182 154 149 153 159 135 130 150 154 Chile 213 219 188 196 199 198 188 187 200 203 Colombia 133 155 137 122 105 108 98 90 104 103 Costa Rica 121 129 190 211 203 200 196 191 207 212 Ecuador 128 135 148 168 169 173 164 161 158 154 Jamaica 91 88 77 73 80 93 92 144 147 153 Mexico 208 246 240 242 246 253 239 241 258 258 Peru 406 430 328 308 259 273 209 205 251 289 Trinidad and Tobago 95 100 111 108 108 109 108 109 106 106 Venezuela (Bolivarian Republic of) 574 2 312 13 421 18 925 24 977 63 057 58 229 71 546 71 480 63 028
Source: Economic Commission for Latin America and the Caribbean (ECLAC), on the basis of information from Bloomberg.

207Statistical annexEconomic Survey of Latin America and the Caribbean • 2016
Table A.20 Latin America and the Caribbean: gross international reserves (Millions of dollars, end-of-period stocks)
2011 2012 2013 20142015 2016
March June September December March May
Latin America and the Caribbean 773 632 835 735 830 018 857 438 856 879 856 168 831 789 811 762 815 306 818 424
Latin America 756 688 820 026 813 984 839 356 839 074 838 585 814 490 795 043 800 271 803 430
Argentina 46 376 43 290 30 599 31 443 31 490 33 851 33 257 25 563 29 572 30 171
Bolivia (Plurinational State of) 12 019 13 927 14 430 15 123 14 968 14 708 14 229 13 056 12 483 11 725
Brazil 352 012 373 147 358 808 363 551 362 744 368 668 361 370 356 464 357 698 363 447
Chile 41 979 41 650 41 094 40 447 38 427 38 179 38 245 38 643 39 553 39 848
Colombia 32 303 37 474 43 639 47 328 46 920 46 982 46 733 46 740 47 229 47 539
Costa Rica 4 756 6 857 7 331 7 211 8 342 8 271 8 052 7 834 7 812 7 760
Dominican Republic 4 098 3 559 4 701 4 862 4 963 5 053 4 822 5 266 5 183 5 035
Ecuadora 2 958 2 483 4 361 3 949 3 668 4 739 3 512 2 496 2 573 2 159
El Salvador 2 503 3 175 2 745 2 693 2 661 2 824 2 827 2 787 3 172 3 133
Guatemala 6 188 6 694 7 273 7 333 7 770 7 718 7 536 7 751 7 586 8 549
Haiti 1 344 1 337 1 690 1 163 1 141 1 095 1 016 977 998 …
Honduras 2 880 2 629 3 113 3 570 3 636 3 928 3 728 3 874 4 047 4 123b
Mexico 149 209 167 050 180 200 195 682 197 765 194 306 181 929 177 597 179 708 179 351
Nicaragua 1 793 1 778 1 874 2 147 2 201 2 212 2 283 2 353 2 338 2 377
Panama 2 234 2 441 2 775 3 994 4 763 4 362 4 082 3 911 4 711 4 502b
Paraguay 4 984 4 994 5 871 6 891 6 672 7 100 6 508 6 200 6 633 6 867
Peru 48 859 64 049 65 710 62 353 61 384 60 072 61 487 61 537 61 429 60 673
Uruguay 10 302 13 605 16 290 17 555 18 584 18 324 16 424 15 634 14 291 14 055
Venezuela (Bolivarian Republic of) 29 892 29 890 21 481 22 061 20 977 16 193 16 450 16 361 13 257 12 118
The Caribbean 16 944 15 709 16 034 18 081 17 805 17 583 17 299 16 718 15 035 14 993
Antigua and Barbudaa 147 161 202 297 278 331 365 356 … …
Bahamas 892 812 740 787 839 957 827 808 980 1 009
Barbados 587 630 516 467 510 465 460 434 452 460
Belize 242 289 402 483 490 535 433 432 436 441
Dominicaa 75 92 85 100 106 118 115 125 … …
Grenadaa 106 104 135 158 158 164 166 189 … …
Guyana 798 862 777 666 616 627 611 599 619 612
Jamaica 2 820 1 981 1 818 2 473 2 690 2 537 2 890 2 914 2 894 2 782
Saint Kitts and Nevisa 233 252 291 318 317 289 265 280 … …
Saint Luciaa 192 208 168 235 309 320 302 298 … …
Saint Vincent and the Grenadinesa 88 109 133 156 148 143 152 165 … …
Suriname 941 1 008 779 625 494 504 398 330 276 213
Trinidad and Tobago 9 823 9 201 9 987 11 317 10 851 10 592 10 312 9 788 9 376 9 478
Source: Economic Commission for Latin America and the Caribbean (ECLAC), on the basis of official figures.a Net international reserves.b Figures as of April.
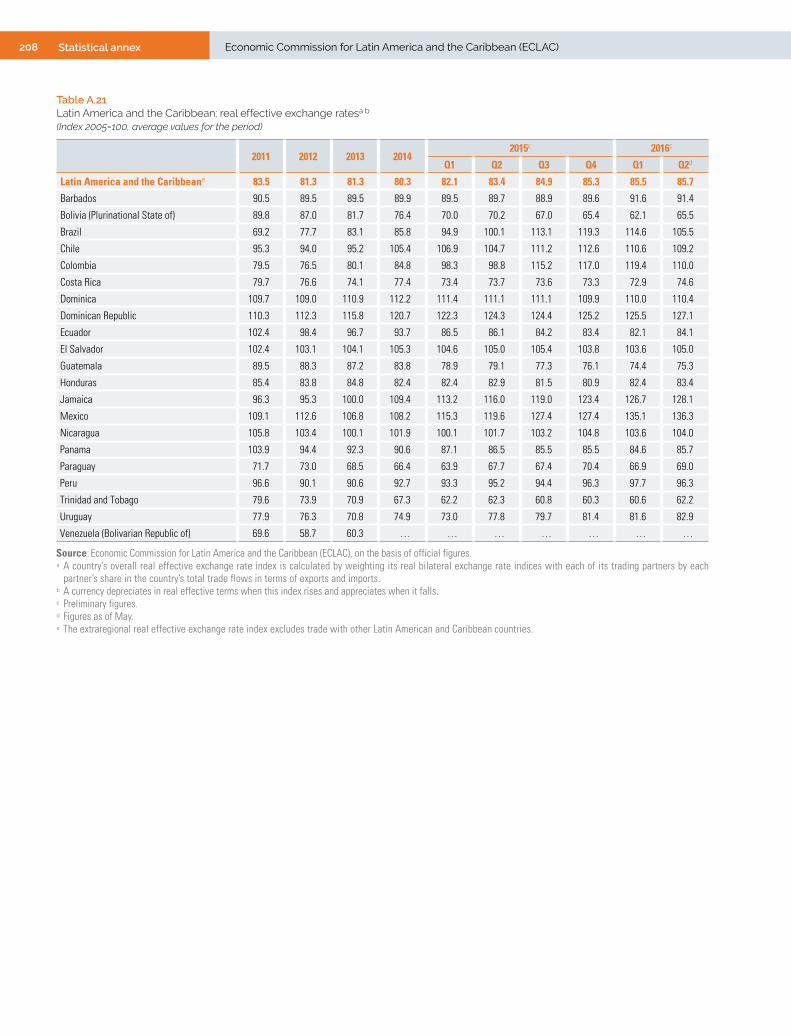
208 Statistical annex Economic Commission for Latin America and the Caribbean (ECLAC)
Table A.21 Latin America and the Caribbean: real effective exchange ratesa b
(Index 2005=100, average values for the period)
2011 2012 2013 20142015c 2016c
Q1 Q2 Q3 Q4 Q1 Q2d
Latin America and the Caribbeane 83.5 81.3 81.3 80.3 82.1 83.4 84.9 85.3 85.5 85.7
Barbados 90.5 89.5 89.5 89.9 89.5 89.7 88.9 89.6 91.6 91.4
Bolivia (Plurinational State of) 89.8 87.0 81.7 76.4 70.0 70.2 67.0 65.4 62.1 65.5
Brazil 69.2 77.7 83.1 85.8 94.9 100.1 113.1 119.3 114.6 105.5
Chile 95.3 94.0 95.2 105.4 106.9 104.7 111.2 112.6 110.6 109.2
Colombia 79.5 76.5 80.1 84.8 98.3 98.8 115.2 117.0 119.4 110.0
Costa Rica 79.7 76.6 74.1 77.4 73.4 73.7 73.6 73.3 72.9 74.6
Dominica 109.7 109.0 110.9 112.2 111.4 111.1 111.1 109.9 110.0 110.4
Dominican Republic 110.3 112.3 115.8 120.7 122.3 124.3 124.4 125.2 125.5 127.1
Ecuador 102.4 98.4 96.7 93.7 86.5 86.1 84.2 83.4 82.1 84.1
El Salvador 102.4 103.1 104.1 105.3 104.6 105.0 105.4 103.8 103.6 105.0
Guatemala 89.5 88.3 87.2 83.8 78.9 79.1 77.3 76.1 74.4 75.3
Honduras 85.4 83.8 84.8 82.4 82.4 82.9 81.5 80.9 82.4 83.4
Jamaica 96.3 95.3 100.0 109.4 113.2 116.0 119.0 123.4 126.7 128.1
Mexico 109.1 112.6 106.8 108.2 115.3 119.6 127.4 127.4 135.1 136.3
Nicaragua 105.8 103.4 100.1 101.9 100.1 101.7 103.2 104.8 103.6 104.0
Panama 103.9 94.4 92.3 90.6 87.1 86.5 85.5 85.5 84.6 85.7
Paraguay 71.7 73.0 68.5 66.4 63.9 67.7 67.4 70.4 66.9 69.0
Peru 96.6 90.1 90.6 92.7 93.3 95.2 94.4 96.3 97.7 96.3
Trinidad and Tobago 79.6 73.9 70.9 67.3 62.2 62.3 60.8 60.3 60.6 62.2
Uruguay 77.9 76.3 70.8 74.9 73.0 77.8 79.7 81.4 81.6 82.9
Venezuela (Bolivarian Republic of) 69.6 58.7 60.3 … … … … … … …
Source: Economic Commission for Latin America and the Caribbean (ECLAC), on the basis of official figures.a A country’s overall real effective exchange rate index is calculated by weighting its real bilateral exchange rate indices with each of its trading partners by each
partner’s share in the country’s total trade flows in terms of exports and imports. b A currency depreciates in real effective terms when this index rises and appreciates when it falls.c Preliminary figures.d Figures as of May.e The extraregional real effective exchange rate index excludes trade with other Latin American and Caribbean countries.

209Statistical annexEconomic Survey of Latin America and the Caribbean • 2016
Table A.22 Latin America and the Caribbean: participation rate(Average annual rates)
2009 2010 2011 2012 2013 2014 2015a2015 2016a
First quarter
Latin America and the Caribbeanb Global 62.1 61.8 61.7 61.7 61.6 61.5 61.6 … …
Argentina Urban areas Total 59.3 58.9 59.5 59.3 58.9 58.3 57.7c … …
Female 48.0 47.0 47.4 47.6 47.1 46.9 46.4c … …
Male 72.1 72.3 72.9 72.2 72.0 70.9 70.1c … …
Bahamas Nationwide total Total 73.4 … 72.1 72.5 73.2 73.7 73.0d … …
Female … … … 69.5 70.1 70.1 71.5d … …
Male … … … 75.8 76.9 77.8 78.5d … …
Barbados Nationwide total Total 67.0 66.6 67.6 66.2 66.7 63.8 65.1 65.2 65.3
Female 62.2 62.0 63.0 61.1 61.8 60.4 61.7 61.3 61.4
Male 72.3 71.7 72.7 72.0 72.3 67.7 68.7 69.5 69.6
Belize Nationwide total Total … … … 65.8 64.0 63.6 63.2 … …
Female … … … 52.6 49.8 49.2 48.7 … …
Male … … … 79.2 78.3 78.2 77.8 … …
Bolivia(Plurinational State of)
Nationwide total Total 65.1 … 65.8 61.2 63.4 65.9 … … …
Female 57.4 … 57.4 52.6 54.8 57.2 … … …
Male 73.3 … 74.7 70.4 72.7 75.1 … … …
Brazile Nationwide total Total 62.1 … 60.0 | 61.4 61.3 61.0 61.3 61.0 61.4
Female 52.7 … 50.1 | 50.8 50.7 50.6 51.2 50.8 51.2
Male 72.3 … 70.8 | 73.1 72.9 72.5 72.4 72.2 72.7
Chilef Nationwide total Total 55.9 | 58.5 59.8 59.5 59.6 59.8 59.7 59.6 59.4
Female 41.3 | 45.3 47.3 47.6 47.7 48.4 48.2 47.7 47.6
Male 71.0 | 72.1 72.7 71.9 71.8 71.6 71.5 71.9 71.6
Colombia Nationwide total Total 61.3 62.7 63.7 64.5 64.2 64.2 64.7 63.8 64.1
Female 49.8 51.8 52.8 54.1 53.9 54.0 54.8 53.3 54.0
Male 73.3 74.2 75.1 75.4 74.9 74.9 75.2 74.7 74.6
Costa Ricae Nationwide total Total 60.4 59.1 60.7 | 62.5 62.2 62.6 61.2 61.8 58.7
Female 44.5 43.5 45.7 | 48.4 48.6 49.2 48.1 48.6 44.5
Male 77.2 75.9 76.8 | 76.2 75.5 75.9 74.3 74.9 72.6
Cuba Nationwide total Total 75.4 74.9 76.1 74.2 72.9 71.9 … … …
Female 61.0 60.5 60.5 57.4 57.3 56.3 … … …
Male 88.4 87.7 90.0 89.5 87.1 86.2 … … …
Dominican Republic Nationwide total Total 55.2 56.5 57.8 59.0 58.7 59.1 59.3 58.9 59.8g
Female 38.3 40.8 42.6 44.0 43.7 44.0 44.5 44.1 45.6g
Male 72.5 72.4 73.4 74.4 74.1 74.6 74.5 74.1 74.2g
Ecuadorh Nationwide total Total 65.3 62.5 62.5 61.68 62.1 63.2 66.2 65.8 68.56
Female 51.3 48.0 47.8 47.4 47.7 48.5 52.7 52.2 56.6
Male 80.2 77.9 78.3 76.9 77.2 78.8 80.5 80.4 81.4
El Salvador Nationwide total Total 62.8 62.5 62.7 63.2 63.6 63.6 62.8 … …
Female 47.6 47.3 47.0 47.9 49.3 49.3 47.8 … …
Male 81.0 80.9 81.2 81.4 80.7 80.7 80.7 … …
Guatemala Nationwide total Total … 62.5 61.8 65.4 60.6 60.9 60.4i … …
Female … 84.7 40.4 45.7 40.6 40.6 … … …
Male … 42.9 84.6 87.6 83.4 83.8 … … …
Honduras Nationwide total Total 53.1 53.6 51.9 50.8 53.7 56.0 58.3 … …
Female 35.9 37.4 34.9 33.8 37.2 40.6 44.1 … …
Male 72.3 71.0 70.4 69.2 72.1 73.6 74.4 … …
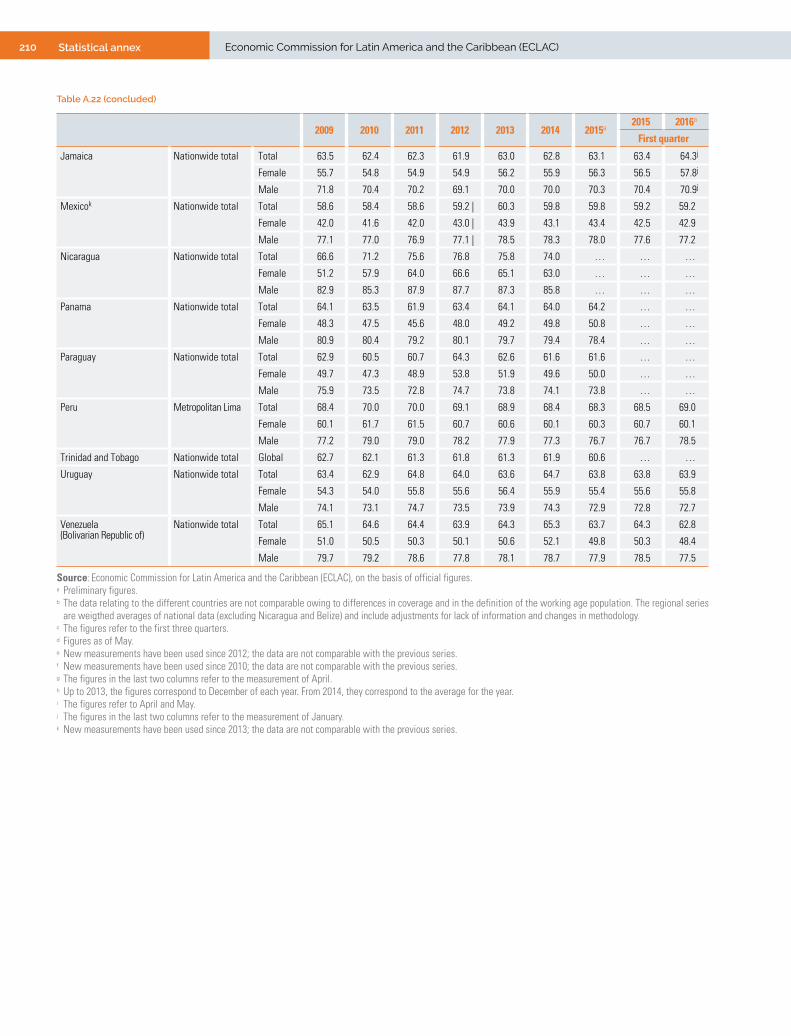
210 Statistical annex Economic Commission for Latin America and the Caribbean (ECLAC)
2009 2010 2011 2012 2013 2014 2015a2015 2016a
First quarter
Jamaica Nationwide total Total 63.5 62.4 62.3 61.9 63.0 62.8 63.1 63.4 64.3j
Female 55.7 54.8 54.9 54.9 56.2 55.9 56.3 56.5 57.8j
Male 71.8 70.4 70.2 69.1 70.0 70.0 70.3 70.4 70.9j
Mexicok Nationwide total Total 58.6 58.4 58.6 59.2 | 60.3 59.8 59.8 59.2 59.2
Female 42.0 41.6 42.0 43.0 | 43.9 43.1 43.4 42.5 42.9
Male 77.1 77.0 76.9 77.1 | 78.5 78.3 78.0 77.6 77.2
Nicaragua Nationwide total Total 66.6 71.2 75.6 76.8 75.8 74.0 … … …
Female 51.2 57.9 64.0 66.6 65.1 63.0 … … …
Male 82.9 85.3 87.9 87.7 87.3 85.8 … … …
Panama Nationwide total Total 64.1 63.5 61.9 63.4 64.1 64.0 64.2 … …
Female 48.3 47.5 45.6 48.0 49.2 49.8 50.8 … …
Male 80.9 80.4 79.2 80.1 79.7 79.4 78.4 … …
Paraguay Nationwide total Total 62.9 60.5 60.7 64.3 62.6 61.6 61.6 … …
Female 49.7 47.3 48.9 53.8 51.9 49.6 50.0 … …
Male 75.9 73.5 72.8 74.7 73.8 74.1 73.8 … …
Peru Metropolitan Lima Total 68.4 70.0 70.0 69.1 68.9 68.4 68.3 68.5 69.0
Female 60.1 61.7 61.5 60.7 60.6 60.1 60.3 60.7 60.1
Male 77.2 79.0 79.0 78.2 77.9 77.3 76.7 76.7 78.5
Trinidad and Tobago Nationwide total Global 62.7 62.1 61.3 61.8 61.3 61.9 60.6 … …
Uruguay Nationwide total Total 63.4 62.9 64.8 64.0 63.6 64.7 63.8 63.8 63.9
Female 54.3 54.0 55.8 55.6 56.4 55.9 55.4 55.6 55.8
Male 74.1 73.1 74.7 73.5 73.9 74.3 72.9 72.8 72.7
Venezuela(Bolivarian Republic of)
Nationwide total Total 65.1 64.6 64.4 63.9 64.3 65.3 63.7 64.3 62.8
Female 51.0 50.5 50.3 50.1 50.6 52.1 49.8 50.3 48.4
Male 79.7 79.2 78.6 77.8 78.1 78.7 77.9 78.5 77.5
Source: Economic Commission for Latin America and the Caribbean (ECLAC), on the basis of official figures.a Preliminary figures.b The data relating to the different countries are not comparable owing to differences in coverage and in the definition of the working age population. The regional series
are weigthed averages of national data (excluding Nicaragua and Belize) and include adjustments for lack of information and changes in methodology.c The figures refer to the first three quarters.d Figures as of May.e New measurements have been used since 2012; the data are not comparable with the previous series. f New measurements have been used since 2010; the data are not comparable with the previous series. g The figures in the last two columns refer to the measurement of April.h Up to 2013, the figures correspond to December of each year. From 2014, they correspond to the average for the year. i The figures refer to April and May.j The figures in the last two columns refer to the measurement of January.k New measurements have been used since 2013; the data are not comparable with the previous series.
Table A.22 (concluded)
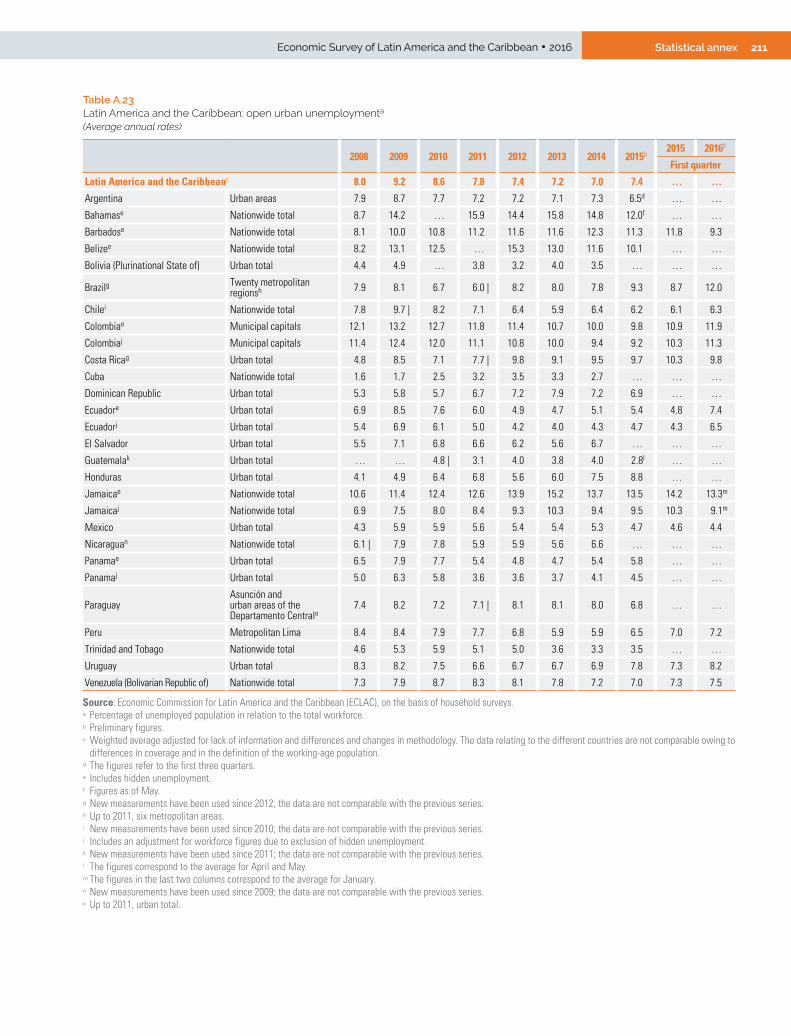
211Statistical annexEconomic Survey of Latin America and the Caribbean • 2016
Table A.23 Latin America and the Caribbean: open urban unemploymenta
(Average annual rates)
2008 2009 2010 2011 2012 2013 2014 2015b2015 2016b
First quarter
Latin America and the Caribbeanc 8.0 9.2 8.6 7.8 7.4 7.2 7.0 7.4 … …
Argentina Urban areas 7.9 8.7 7.7 7.2 7.2 7.1 7.3 6.5d … …
Bahamase Nationwide total 8.7 14.2 … 15.9 14.4 15.8 14.8 12.0f … …
Barbadose Nationwide total 8.1 10.0 10.8 11.2 11.6 11.6 12.3 11.3 11.8 9.3
Belizee Nationwide total 8.2 13.1 12.5 … 15.3 13.0 11.6 10.1 … …
Bolivia (Plurinational State of) Urban total 4.4 4.9 … 3.8 3.2 4.0 3.5 … … …
Brazilg Twenty metropolitan regionsh 7.9 8.1 6.7 6.0 | 8.2 8.0 7.8 9.3 8.7 12.0
Chilei Nationwide total 7.8 9.7 | 8.2 7.1 6.4 5.9 6.4 6.2 6.1 6.3
Colombiae Municipal capitals 12.1 13.2 12.7 11.8 11.4 10.7 10.0 9.8 10.9 11.9
Colombiaj Municipal capitals 11.4 12.4 12.0 11.1 10.8 10.0 9.4 9.2 10.3 11.3
Costa Ricag Urban total 4.8 8.5 7.1 7.7 | 9.8 9.1 9.5 9.7 10.3 9.8
Cuba Nationwide total 1.6 1.7 2.5 3.2 3.5 3.3 2.7 … … …
Dominican Republic Urban total 5.3 5.8 5.7 6.7 7.2 7.9 7.2 6.9 … …
Ecuadore Urban total 6.9 8.5 7.6 6.0 4.9 4.7 5.1 5.4 4.8 7.4
Ecuadorj Urban total 5.4 6.9 6.1 5.0 4.2 4.0 4.3 4.7 4.3 6.5
El Salvador Urban total 5.5 7.1 6.8 6.6 6.2 5.6 6.7 … … …
Guatemalak Urban total … … 4.8 | 3.1 4.0 3.8 4.0 2.8l … …
Honduras Urban total 4.1 4.9 6.4 6.8 5.6 6.0 7.5 8.8 … …
Jamaicae Nationwide total 10.6 11.4 12.4 12.6 13.9 15.2 13.7 13.5 14.2 13.3m
Jamaicaj Nationwide total 6.9 7.5 8.0 8.4 9.3 10.3 9.4 9.5 10.3 9.1m
Mexico Urban total 4.3 5.9 5.9 5.6 5.4 5.4 5.3 4.7 4.6 4.4
Nicaraguan Nationwide total 6.1 | 7.9 7.8 5.9 5.9 5.6 6.6 … … …
Panamae Urban total 6.5 7.9 7.7 5.4 4.8 4.7 5.4 5.8 … …
Panamaj Urban total 5.0 6.3 5.8 3.6 3.6 3.7 4.1 4.5 … …
ParaguayAsunción and urban areas of the Departamento Centralo
7.4 8.2 7.2 7.1 | 8.1 8.1 8.0 6.8 … …
Peru Metropolitan Lima 8.4 8.4 7.9 7.7 6.8 5.9 5.9 6.5 7.0 7.2
Trinidad and Tobago Nationwide total 4.6 5.3 5.9 5.1 5.0 3.6 3.3 3.5 … …
Uruguay Urban total 8.3 8.2 7.5 6.6 6.7 6.7 6.9 7.8 7.3 8.2
Venezuela (Bolivarian Republic of) Nationwide total 7.3 7.9 8.7 8.3 8.1 7.8 7.2 7.0 7.3 7.5
Source: Economic Commission for Latin America and the Caribbean (ECLAC), on the basis of household surveys.a Percentage of unemployed population in relation to the total workforce. b Preliminary figures.c Weighted average adjusted for lack of information and differences and changes in methodology. The data relating to the different countries are not comparable owing to
differences in coverage and in the definition of the working-age population. d The figures refer to the first three quarters.e Includes hidden unemployment.f Figures as of May.g New measurements have been used since 2012; the data are not comparable with the previous series. h Up to 2011, six metropolitan areas.i New measurements have been used since 2010; the data are not comparable with the previous series. j Includes an adjustment for workforce figures due to exclusion of hidden unemployment. k New measurements have been used since 2011; the data are not comparable with the previous series. l The figures correspond to the average for April and May.m The figures in the last two columns correspond to the average for January.n New measurements have been used since 2009; the data are not comparable with the previous series. o Up to 2011, urban total.

212 Statistical annex Economic Commission for Latin America and the Caribbean (ECLAC)
Table A.24 Latin America and the Caribbean: employment ratea
(Average annual rates)
2008 2009 2010 2011 2012 2013 2014 2015b2015 2016b
First quarter
Latin America and the Caribbeanc 57.5 57.2 57.2 57.4 57.6 57.6 57.6 57.4 … …
Argentina Urban areas 54.2 54.2 54.4 55.2 55.0 54.7 54.0 53.9d … …
Bahamas Nationwide total 69.7 63.0 … 60.6 62.1 61.6 62.8 64.2e … …
Barbados Nationwide total 62.1 60.3 59.4 60.0 58.5 58.9 56.0 57.7 57.5 59.2
Belize Nationwide total … … … … 55.7 55.7 56.3 56.8 … …
Bolivia (Plurinational State of) Nationwide total 63.1 63.0 … 64.1 59.8 61.6 64.4 … … …
Brazilf Nationwide total 57.5 56.9 … 56.0 | 56.9 56.9 56.8 53.3 56.2 54.7
Chileg Nationwide total 51.7 50.5 | 53.7 55.5 55.7 56.0 56.0 56.0 55.9 55.7
Colombia Nationwide total 51.9 53.9 55.4 56.8 57.9 58.0 58.4 59.0 57.5 57.2
Costa Ricaf Nationwide total 53.9 55.4 54.8 56.0 | 56.2 56.4 56.6 55.4 55.6 53.1
Cuba Nationwide total 73.6 74.2 73.0 73.6 71.6 70.5 70.0 … … …
Dominican Republic Nationwide total 54.7 52.3 53.6 54.5 55.2 54.6 55.4 55.8 55.4 56.4h
Ecuadori Urban total 62.2 61.1 59.4 59.9 59.1 59.5 60.4 63.3 63.3 64.6
El Salvador Nationwide total 59.0 59.2 58.1 58.6 59.4 59.9 58.4 … … …
Guatemala Nationwide total … … 60.2 59.2 63.5 58.7 59.2 58.9j … …
Honduras Nationwide total 49.4 51.5 51.5 49.7 48.9 51.6 53.1 54.0 … …
Jamaica Nationwide total 58.5 56.3 54.6 54.4 53.3 53.4 54.2 54.6 54.3 55.7k
Mexicol Nationwide total 56.3 55.4 55.3 55.6 56.3 | 57.3 56.9 57.2 56.7 56.8
Nicaraguam Nationwide total 50.1 | 61.3 65.8 71.2 72.3 71.5 69.1 … … …
Panama Nationwide total 60.3 59.9 59.4 59.1 60.8 61.5 60.9 60.9 … …
Paraguay Nationwide total 57.0 57.1 57.1 57.3 61.2 59.4 57.9 58.3 … …
Peru Metropolitan Lima 62.4 62.7 64.5 64.5 64.4 64.8 64.3 63.8 63.7 64.0
Trinidad and Tobago Nationwide total 60.6 59.4 58.4 58.2 58.8 59.1 59.9 58.5 … …
Uruguay Nationwide total 57.7 58.5 58.4 60.7 59.9 59.5 60.4 59 59.3 58.9
Venezuela (Bolivarian Republic of) Nationwide total 60.2 60.0 59.0 59.0 58.7 59.3 60.4 59.2 59.6 58.3
Source: Economic Commission for Latin America and the Caribbean (ECLAC), on the basis of official figures.a Employed population as a percentage of the working-age population.b Preliminary figures.c Weighted average adjusted for lack of information and differences and changes in methodology. The data relating to the different countries are not comparable owing to
differences in coverage and in the definition of the working-age population. d The figure refers to the average for the first three quarters.e Figure as of May.f New measurements have been used since 2012; the data are not comparable with the previous series. g New measurements have been used since 2010; the data are not comparable with the previous series. h The figures in the last two columns correspond to the average for April.i Up to 2013, the figures correspond to December of each year. From 2014, they correspond to the average for the year. j The figures correspond to the average for April and May.k The figures in the last two columns correspond to the average for January.l New measurements have been used since 2013; the data are not comparable with the previous series. m New measurements have been used since 2009; the data are not comparable with the previous series.
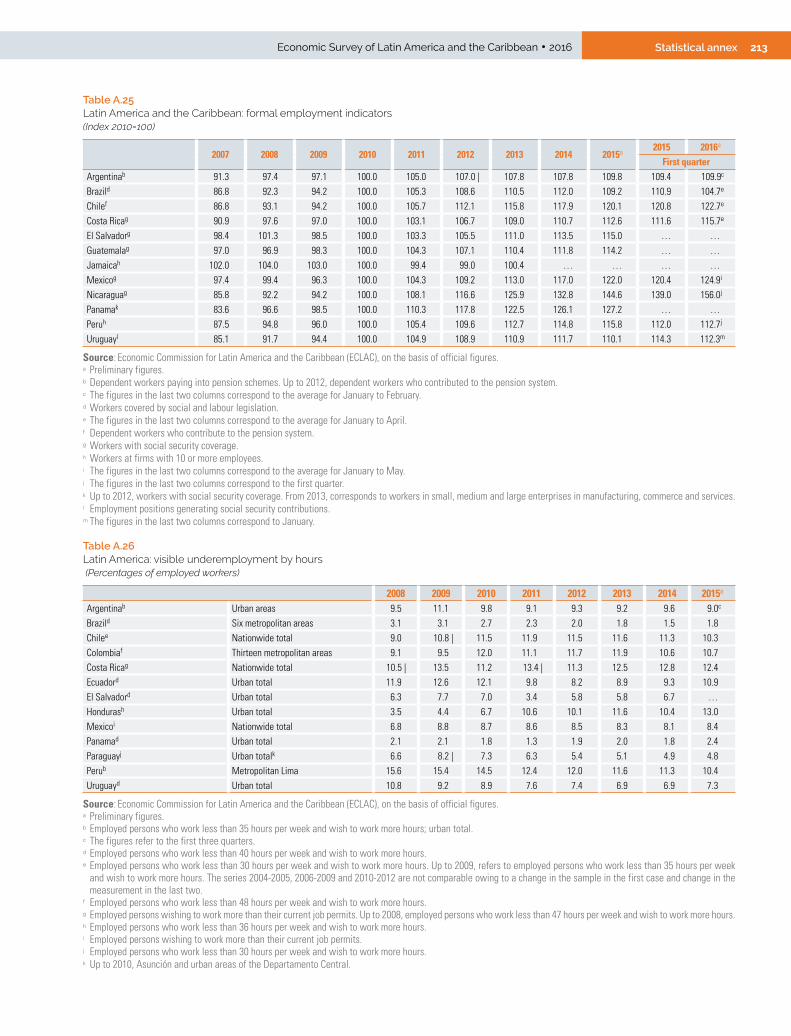
213Statistical annexEconomic Survey of Latin America and the Caribbean • 2016
Table A.25 Latin America and the Caribbean: formal employment indicators (Index 2010=100)
2007 2008 2009 2010 2011 2012 2013 2014 2015a 2015 2016a
First quarterArgentinab 91.3 97.4 97.1 100.0 105.0 107.0 | 107.8 107.8 109.8 109.4 109.9c
Brazild 86.8 92.3 94.2 100.0 105.3 108.6 110.5 112.0 109.2 110.9 104.7e
Chilef 86.8 93.1 94.2 100.0 105.7 112.1 115.8 117.9 120.1 120.8 122.7e
Costa Ricag 90.9 97.6 97.0 100.0 103.1 106.7 109.0 110.7 112.6 111.6 115.7e
El Salvadorg 98.4 101.3 98.5 100.0 103.3 105.5 111.0 113.5 115.0 … …Guatemalag 97.0 96.9 98.3 100.0 104.3 107.1 110.4 111.8 114.2 … …Jamaicah 102.0 104.0 103.0 100.0 99.4 99.0 100.4 … … … …Mexicog 97.4 99.4 96.3 100.0 104.3 109.2 113.0 117.0 122.0 120.4 124.9i
Nicaraguag 85.8 92.2 94.2 100.0 108.1 116.6 125.9 132.8 144.6 139.0 156.0j
Panamak 83.6 96.6 98.5 100.0 110.3 117.8 122.5 126.1 127.2 … …Peruh 87.5 94.8 96.0 100.0 105.4 109.6 112.7 114.8 115.8 112.0 112.7j
Uruguayl 85.1 91.7 94.4 100.0 104.9 108.9 110.9 111.7 110.1 114.3 112.3m
Source: Economic Commission for Latin America and the Caribbean (ECLAC), on the basis of official figures.a Preliminary figures.b Dependent workers paying into pension schemes. Up to 2012, dependent workers who contributed to the pension system.c The figures in the last two columns correspond to the average for January to February. d Workers covered by social and labour legislation. e The figures in the last two columns correspond to the average for January to April. f Dependent workers who contribute to the pension system.g Workers with social security coverage. h Workers at firms with 10 or more employees.i The figures in the last two columns correspond to the average for January to May. j The figures in the last two columns correspond to the first quarter.k Up to 2012, workers with social security coverage. From 2013, corresponds to workers in small, medium and large enterprises in manufacturing, commerce and services. l Employment positions generating social security contributions.m The figures in the last two columns correspond to January.
Table A.26 Latin America: visible underemployment by hours (Percentages of employed workers)
2008 2009 2010 2011 2012 2013 2014 2015a
Argentinab Urban areas 9.5 11.1 9.8 9.1 9.3 9.2 9.6 9.0c
Brazild Six metropolitan areas 3.1 3.1 2.7 2.3 2.0 1.8 1.5 1.8Chilee Nationwide total 9.0 10.8 | 11.5 11.9 11.5 11.6 11.3 10.3Colombiaf Thirteen metropolitan areas 9.1 9.5 12.0 11.1 11.7 11.9 10.6 10.7Costa Ricag Nationwide total 10.5 | 13.5 11.2 13.4 | 11.3 12.5 12.8 12.4Ecuadord Urban total 11.9 12.6 12.1 9.8 8.2 8.9 9.3 10.9El Salvadord Urban total 6.3 7.7 7.0 3.4 5.8 5.8 6.7 …Hondurash Urban total 3.5 4.4 6.7 10.6 10.1 11.6 10.4 13.0Mexicoi Nationwide total 6.8 8.8 8.7 8.6 8.5 8.3 8.1 8.4Panamad Urban total 2.1 2.1 1.8 1.3 1.9 2.0 1.8 2.4Paraguayj Urban totalk 6.6 8.2 | 7.3 6.3 5.4 5.1 4.9 4.8Perub Metropolitan Lima 15.6 15.4 14.5 12.4 12.0 11.6 11.3 10.4Uruguayd Urban total 10.8 9.2 8.9 7.6 7.4 6.9 6.9 7.3
Source: Economic Commission for Latin America and the Caribbean (ECLAC), on the basis of official figures.a Preliminary figures.b Employed persons who work less than 35 hours per week and wish to work more hours; urban total. c The figures refer to the first three quarters.d Employed persons who work less than 40 hours per week and wish to work more hours. e Employed persons who work less than 30 hours per week and wish to work more hours. Up to 2009, refers to employed persons who work less than 35 hours per week
and wish to work more hours. The series 2004-2005, 2006-2009 and 2010-2012 are not comparable owing to a change in the sample in the first case and change in the measurement in the last two.
f Employed persons who work less than 48 hours per week and wish to work more hours. g Employed persons wishing to work more than their current job permits. Up to 2008, employed persons who work less than 47 hours per week and wish to work more hours. h Employed persons who work less than 36 hours per week and wish to work more hours. i Employed persons wishing to work more than their current job permits.j Employed persons who work less than 30 hours per week and wish to work more hours.k Up to 2010, Asunción and urban areas of the Departamento Central.
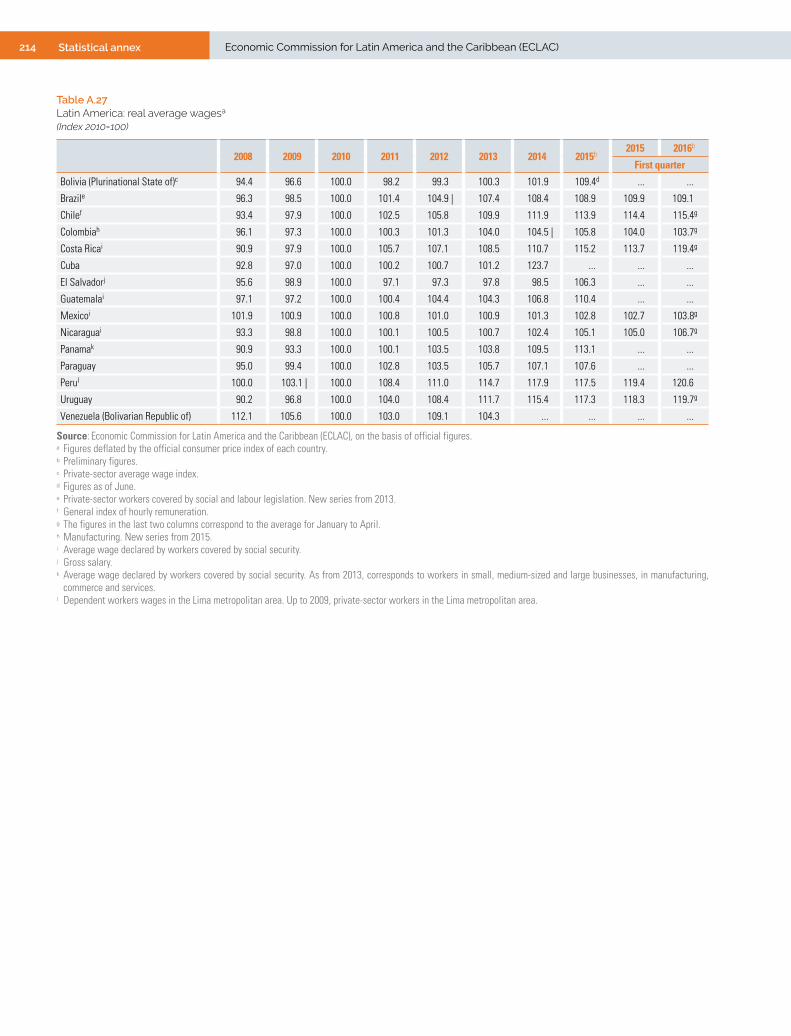
214 Statistical annex Economic Commission for Latin America and the Caribbean (ECLAC)
Table A.27 Latin America: real average wagesa
(Index 2010=100)
2008 2009 2010 2011 2012 2013 2014 2015b2015 2016b
First quarter
Bolivia (Plurinational State of)c 94.4 96.6 100.0 98.2 99.3 100.3 101.9 109.4d ... ...
Brazile 96.3 98.5 100.0 101.4 104.9 | 107.4 108.4 108.9 109.9 109.1
Chilef 93.4 97.9 100.0 102.5 105.8 109.9 111.9 113.9 114.4 115.4g
Colombiah 96.1 97.3 100.0 100.3 101.3 104.0 104.5 | 105.8 104.0 103.7g
Costa Ricai 90.9 97.9 100.0 105.7 107.1 108.5 110.7 115.2 113.7 119.4g
Cuba 92.8 97.0 100.0 100.2 100.7 101.2 123.7 ... ... ...
El Salvadorj 95.6 98.9 100.0 97.1 97.3 97.8 98.5 106.3 ... ...
Guatemalai 97.1 97.2 100.0 100.4 104.4 104.3 106.8 110.4 ... ...
Mexicoi 101.9 100.9 100.0 100.8 101.0 100.9 101.3 102.8 102.7 103.8g
Nicaraguai 93.3 98.8 100.0 100.1 100.5 100.7 102.4 105.1 105.0 106.7g
Panamak 90.9 93.3 100.0 100.1 103.5 103.8 109.5 113.1 ... ...
Paraguay 95.0 99.4 100.0 102.8 103.5 105.7 107.1 107.6 ... ...
Perul 100.0 103.1 | 100.0 108.4 111.0 114.7 117.9 117.5 119.4 120.6
Uruguay 90.2 96.8 100.0 104.0 108.4 111.7 115.4 117.3 118.3 119.7g
Venezuela (Bolivarian Republic of) 112.1 105.6 100.0 103.0 109.1 104.3 ... ... ... ...
Source: Economic Commission for Latin America and the Caribbean (ECLAC), on the basis of official figures.a Figures deflated by the official consumer price index of each country.b Preliminary figures.c Private-sector average wage index.d Figures as of June.e Private-sector workers covered by social and labour legislation. New series from 2013.f General index of hourly remuneration.g The figures in the last two columns correspond to the average for January to April. h Manufacturing. New series from 2015.i Average wage declared by workers covered by social security. j Gross salary.k Average wage declared by workers covered by social security. As from 2013, corresponds to workers in small, medium-sized and large businesses, in manufacturing,
commerce and services.l Dependent workers wages in the Lima metropolitan area. Up to 2009, private-sector workers in the Lima metropolitan area.

215Statistical annexEconomic Survey of Latin America and the Caribbean • 2016
Table A.28 Latin America and the Caribbean: monetary indicators(Percentage variation with respect to the year-earlier period)
2011 2012 2013 20142015 2016
Q1 Q2 Q3 Q4 Q1 Q2
Latin America
Argentina Monetary base 37.1 34.9 30.2 19.7 27.2 31.7 34.8 37.9 29.1 26.2
Money (M1) 32.4 33.3 29.5 26.1 26.4 34.1 34.6 31.3 30.6 21.1a
M2 36.9 32.4 30.9 23.1 29.6 32.6 35.2 34.8 29.3 24.6a
Foreign-currency deposits 8.7 -22.6 -6.1 51.7 19.2 33.1 38.9 61.3 141.9 129.5a
Bolivia(Plurinational State of)
Monetary base 11.6 18.2 10.8 9.5 24.9 18.6 18.3 16.5 13.1 9.9b
Money (M1) 27.2 18.3 13.5 15.4 13.2 11.2 7.5 6.1 8.9 …
M2 34.0 31.3 22.6 18.8 18.3 18.6 19.2 17.7 16.1 …
Foreign-currency deposits -12.8 -5.0 -4.1 -3.4 0.7 2.8 6.7 4.6 3.3 …
Brazil Monetary base 11.0 9.4 5.5 7.2 6.3 7.0 -1.2 0.2 2.4 1.6b
Money (M1) 6.1 5.9 10.7 4.7 1.8 0.0 -3.3 -4.6 -4.4 -2.5a
M2 21.0 13.4 9.3 11.7 8.7 7.2 5.5 5.9 5.6 4.8a
Chile Monetary base 14.8 13.7 16.3 5.3 10.3 12.1 7.3 8.7 9.5 7.2b
Money (M1) 10.9 9.1 10.1 12.1 13.7 14.1 14.8 14.4 12.1 9.7b
M2 14.7 14.7 9.7 8.7 7.8 11.7 12.4 12.3 13.1 11.6b
Foreign-currency deposits 11.8 8.9 18.7 29.0 28.1 14.4 17.5 16.1 9.4 15.0b
Colombia Monetary base 15.1 9.5 12.5 16.7 11.7 12.5 14.5 20.7 19.0 14.4b
Money (M1) 16.2 6.7 14.3 14.8 9.9 8.8 11.1 11.5 9.7 7.7b
M2 14.8 16.9 17.5 12.9 8.1 8.9 11.1 12.4 12.6 12.8b
Costa Rica Monetary base 11.7 12.1 14.1 11.7 11.4 9.3 12.1 11.5 9.3 11.6b
Money (M1) 19.2 9.4 11.9 13.0 4.2 8.0 10.8 14.1 22.2 22.0b
M2 11.1 13.8 13.0 14.4 10.5 9.6 8.9 8.6 5.7 6.5b
Foreign-currency deposits -7.1 -1.2 0.1 13.0 5.8 1.7 -2.9 2.9 -0.4 2.1b
Dominican Republic Monetary base 5.8 9.0 3.9 3.3 20.9 24.5 22.4 20.8 10.2 10.4b
Money (M1) 4.9 7.3 12.1 13.6 12.0 13.3 13.1 13.1 11.9 14.2a
M2 8.8 12.1 8.0 11.2 10.5 10.3 10.8 11.1 12.1 13.1a
Foreign-currency deposits 17.8 18.4 16.1 11.5 6.6 7.9 16.1 16.9 11.9 12.4a
Ecuador Monetary base 9.9 16.1 23.3 17.5 14.0 20.1 -8.9 15.4 24.5 22.6a
Money (M1) 15.5 14.0 14.8 14.4 15.2 13.9 10.1 4.1 6.3 7.9a
M2 20.0 17.8 13.4 14.5 12.3 9.9 5.5 -0.3 1.3 2.4a
El Salvador Monetary base -1.3 1.8 4.8 2.8 -1.4 2.5 2.3 1.4 3.6 -1.5b
Money (M1) 10.4 4.4 2.9 4.0 1.5 3.8 3.6 11.0 9.5 3.9a
M2 -2.1 0.5 1.8 0.8 0.9 3.8 4.3 5.7 6.7 5.1a
Guatemala Monetary base 10.1 5.8 9.2 5.8 11.2 12.7 12.6 11.7 8.9 9.8b
Money (M1) 9.1 5.8 7.0 5.2 11.1 13.2 12.2 11.2 7.9 7.1a
M2 10.6 9.4 9.7 8.1 11.2 12.1 11.4 11.2 9.0 8.4a
Foreign-currency deposits 4.9 3.2 11.2 9.4 5.3 8.9 5.6 4.0 7.1 4.3a
Haiti Monetary base 18.1 9.2 0.4 -1.0 6.8 14.4 19.1 20.8 28.7 …
Money (M1) 14.4 8.7 11.1 8.7 14.7 21.6 11.5 4.7 3.4 …
M2 11.5 5.7 9.4 8.4 12.2 14.0 12.0 9.6 8.4 …
Foreign-currency deposits 18.4 6.9 8.2 8.5 11.6 10.9 21.6 29.6 32.3 …
Honduras Monetary base 10.7 11.3 4.0 9.7 22.6 14.8 18.7 11.2 9.4 17.2a
Money (M1) 17.7 2.1 -5.0 8.4 18.7 17.8 20.6 18.9 10.8 8.8a
M2 17.2 8.7 3.6 8.9 12.9 12.7 13.6 11.9 9.7 10.4a
Foreign-currency deposits 7.8 15.3 12.6 7.3 13.8 15.8 11.1 4.8 5.9 3.2a
Mexico Monetary base 9.5 13.9 6.3 13.5 20.2 20.4 21.4 18.5 15.9 15.2b
Money (M1) 16.2 13.7 7.5 13.9 16.8 16.9 16.9 13.9 11.0 11.0a
M2 12.4 10.7 7.1 11.0 13.6 13.5 14.8 12.1 8.9 10.1a
Foreign-currency deposits 3.0 16.8 13.3 26.6 32.9 35.6 45.3 45.9 34.2 20.8a
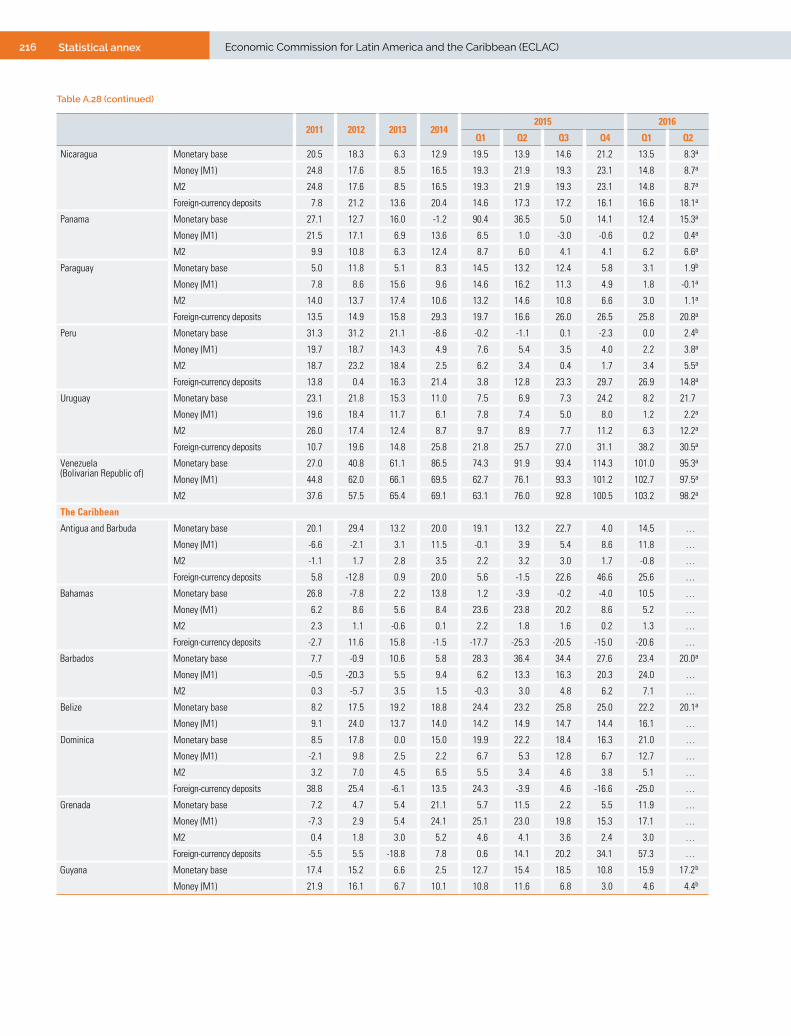
216 Statistical annex Economic Commission for Latin America and the Caribbean (ECLAC)
2011 2012 2013 20142015 2016
Q1 Q2 Q3 Q4 Q1 Q2
Nicaragua Monetary base 20.5 18.3 6.3 12.9 19.5 13.9 14.6 21.2 13.5 8.3a
Money (M1) 24.8 17.6 8.5 16.5 19.3 21.9 19.3 23.1 14.8 8.7a
M2 24.8 17.6 8.5 16.5 19.3 21.9 19.3 23.1 14.8 8.7a
Foreign-currency deposits 7.8 21.2 13.6 20.4 14.6 17.3 17.2 16.1 16.6 18.1a
Panama Monetary base 27.1 12.7 16.0 -1.2 90.4 36.5 5.0 14.1 12.4 15.3a
Money (M1) 21.5 17.1 6.9 13.6 6.5 1.0 -3.0 -0.6 0.2 0.4a
M2 9.9 10.8 6.3 12.4 8.7 6.0 4.1 4.1 6.2 6.6a
Paraguay Monetary base 5.0 11.8 5.1 8.3 14.5 13.2 12.4 5.8 3.1 1.9b
Money (M1) 7.8 8.6 15.6 9.6 14.6 16.2 11.3 4.9 1.8 -0.1a
M2 14.0 13.7 17.4 10.6 13.2 14.6 10.8 6.6 3.0 1.1a
Foreign-currency deposits 13.5 14.9 15.8 29.3 19.7 16.6 26.0 26.5 25.8 20.8a
Peru Monetary base 31.3 31.2 21.1 -8.6 -0.2 -1.1 0.1 -2.3 0.0 2.4b
Money (M1) 19.7 18.7 14.3 4.9 7.6 5.4 3.5 4.0 2.2 3.8a
M2 18.7 23.2 18.4 2.5 6.2 3.4 0.4 1.7 3.4 5.5a
Foreign-currency deposits 13.8 0.4 16.3 21.4 3.8 12.8 23.3 29.7 26.9 14.8a
Uruguay Monetary base 23.1 21.8 15.3 11.0 7.5 6.9 7.3 24.2 8.2 21.7
Money (M1) 19.6 18.4 11.7 6.1 7.8 7.4 5.0 8.0 1.2 2.2a
M2 26.0 17.4 12.4 8.7 9.7 8.9 7.7 11.2 6.3 12.2a
Foreign-currency deposits 10.7 19.6 14.8 25.8 21.8 25.7 27.0 31.1 38.2 30.5a
Venezuela (Bolivarian Republic of)
Monetary base 27.0 40.8 61.1 86.5 74.3 91.9 93.4 114.3 101.0 95.3a
Money (M1) 44.8 62.0 66.1 69.5 62.7 76.1 93.3 101.2 102.7 97.5a
M2 37.6 57.5 65.4 69.1 63.1 76.0 92.8 100.5 103.2 98.2a
The Caribbean
Antigua and Barbuda Monetary base 20.1 29.4 13.2 20.0 19.1 13.2 22.7 4.0 14.5 …
Money (M1) -6.6 -2.1 3.1 11.5 -0.1 3.9 5.4 8.6 11.8 …
M2 -1.1 1.7 2.8 3.5 2.2 3.2 3.0 1.7 -0.8 …
Foreign-currency deposits 5.8 -12.8 0.9 20.0 5.6 -1.5 22.6 46.6 25.6 …
Bahamas Monetary base 26.8 -7.8 2.2 13.8 1.2 -3.9 -0.2 -4.0 10.5 …
Money (M1) 6.2 8.6 5.6 8.4 23.6 23.8 20.2 8.6 5.2 …
M2 2.3 1.1 -0.6 0.1 2.2 1.8 1.6 0.2 1.3 …
Foreign-currency deposits -2.7 11.6 15.8 -1.5 -17.7 -25.3 -20.5 -15.0 -20.6 …
Barbados Monetary base 7.7 -0.9 10.6 5.8 28.3 36.4 34.4 27.6 23.4 20.0a
Money (M1) -0.5 -20.3 5.5 9.4 6.2 13.3 16.3 20.3 24.0 …
M2 0.3 -5.7 3.5 1.5 -0.3 3.0 4.8 6.2 7.1 …
Belize Monetary base 8.2 17.5 19.2 18.8 24.4 23.2 25.8 25.0 22.2 20.1a
Money (M1) 9.1 24.0 13.7 14.0 14.2 14.9 14.7 14.4 16.1 …
Dominica Monetary base 8.5 17.8 0.0 15.0 19.9 22.2 18.4 16.3 21.0 …
Money (M1) -2.1 9.8 2.5 2.2 6.7 5.3 12.8 6.7 12.7 …
M2 3.2 7.0 4.5 6.5 5.5 3.4 4.6 3.8 5.1 …
Foreign-currency deposits 38.8 25.4 -6.1 13.5 24.3 -3.9 4.6 -16.6 -25.0 …
Grenada Monetary base 7.2 4.7 5.4 21.1 5.7 11.5 2.2 5.5 11.9 …
Money (M1) -7.3 2.9 5.4 24.1 25.1 23.0 19.8 15.3 17.1 …
M2 0.4 1.8 3.0 5.2 4.6 4.1 3.6 2.4 3.0 …
Foreign-currency deposits -5.5 5.5 -18.8 7.8 0.6 14.1 20.2 34.1 57.3 …
Guyana Monetary base 17.4 15.2 6.6 2.5 12.7 15.4 18.5 10.8 15.9 17.2b
Money (M1) 21.9 16.1 6.7 10.1 10.8 11.6 6.8 3.0 4.6 4.4b
Table A.28 (continued)
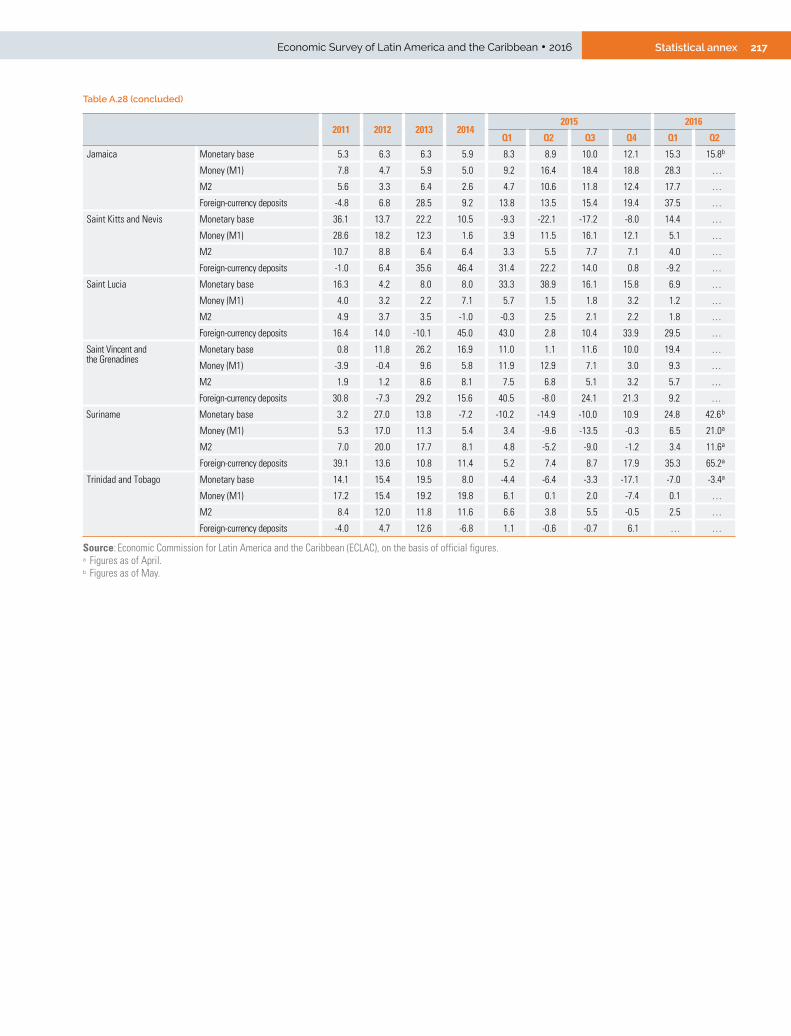
217Statistical annexEconomic Survey of Latin America and the Caribbean • 2016
2011 2012 2013 20142015 2016
Q1 Q2 Q3 Q4 Q1 Q2
Jamaica Monetary base 5.3 6.3 6.3 5.9 8.3 8.9 10.0 12.1 15.3 15.8b
Money (M1) 7.8 4.7 5.9 5.0 9.2 16.4 18.4 18.8 28.3 …
M2 5.6 3.3 6.4 2.6 4.7 10.6 11.8 12.4 17.7 …
Foreign-currency deposits -4.8 6.8 28.5 9.2 13.8 13.5 15.4 19.4 37.5 …
Saint Kitts and Nevis Monetary base 36.1 13.7 22.2 10.5 -9.3 -22.1 -17.2 -8.0 14.4 …
Money (M1) 28.6 18.2 12.3 1.6 3.9 11.5 16.1 12.1 5.1 …
M2 10.7 8.8 6.4 6.4 3.3 5.5 7.7 7.1 4.0 …
Foreign-currency deposits -1.0 6.4 35.6 46.4 31.4 22.2 14.0 0.8 -9.2 …
Saint Lucia Monetary base 16.3 4.2 8.0 8.0 33.3 38.9 16.1 15.8 6.9 …
Money (M1) 4.0 3.2 2.2 7.1 5.7 1.5 1.8 3.2 1.2 …
M2 4.9 3.7 3.5 -1.0 -0.3 2.5 2.1 2.2 1.8 …
Foreign-currency deposits 16.4 14.0 -10.1 45.0 43.0 2.8 10.4 33.9 29.5 …
Saint Vincent and the Grenadines
Monetary base 0.8 11.8 26.2 16.9 11.0 1.1 11.6 10.0 19.4 …
Money (M1) -3.9 -0.4 9.6 5.8 11.9 12.9 7.1 3.0 9.3 …
M2 1.9 1.2 8.6 8.1 7.5 6.8 5.1 3.2 5.7 …
Foreign-currency deposits 30.8 -7.3 29.2 15.6 40.5 -8.0 24.1 21.3 9.2 …
Suriname Monetary base 3.2 27.0 13.8 -7.2 -10.2 -14.9 -10.0 10.9 24.8 42.6b
Money (M1) 5.3 17.0 11.3 5.4 3.4 -9.6 -13.5 -0.3 6.5 21.0a
M2 7.0 20.0 17.7 8.1 4.8 -5.2 -9.0 -1.2 3.4 11.6a
Foreign-currency deposits 39.1 13.6 10.8 11.4 5.2 7.4 8.7 17.9 35.3 65.2a
Trinidad and Tobago Monetary base 14.1 15.4 19.5 8.0 -4.4 -6.4 -3.3 -17.1 -7.0 -3.4a
Money (M1) 17.2 15.4 19.2 19.8 6.1 0.1 2.0 -7.4 0.1 …
M2 8.4 12.0 11.8 11.6 6.6 3.8 5.5 -0.5 2.5 …
Foreign-currency deposits -4.0 4.7 12.6 -6.8 1.1 -0.6 -0.7 6.1 … …
Source: Economic Commission for Latin America and the Caribbean (ECLAC), on the basis of official figures.a Figures as of April.b Figures as of May.
Table A.28 (concluded)

218 Statistical annex Economic Commission for Latin America and the Caribbean (ECLAC)
Table A.29 Latin America and the Caribbean: domestic credit (Percentage variation with respect to the year-earlier period)
2011 2012 2013 20142015 2016
Q1 Q2 Q3 Q4 Q1 Q2a
Latin America
Argentina 59.5 33.0 40.8 24.7 31.0 33.7 38.5 40.3 27.9 29.0b
Bolivia (Plurinational State of) 18.8 22.7 21.6 17.6 15.5 15.9 17.2 18.1 … …
Brazil 17.6 16.8 11.9 9.5 11.8 9.6 7.0 7.8 9.0 10.2
Chile 12.1 15.1 9.3 7.6 6.3 8.6 8.8 10.0 11.6 …
Colombia 15.1 14.6 14.1 13.5 24.7 25.8 26.7 24.1 8.8c …
Costa Rica 12.4 11.7 9.2 19.9 13.0 14.5 13.3 14.3 16.0 18.6
Dominican Republic 9.5 12.1 12.4 11.6 10.2 15.3 16.5 17.6 15.4 17.2
Ecuador 31.5 21.5 16.7 16.2 14.5 10.9 11.8 3.4 -1.3 1.5
El Salvador 3.5 9.6 5.5 9.5 6.8 5.6 6.7 9.9 8.9 8.5
Guatemala 15.2 11.3 12.6 12.0 12.0 13.0 11.8 11.2 10.4 7.8
Haiti -17.1 11.4 70.0 30.4 24.9 19.4 18.4 11.5 10.0 …
Honduras 10.8 18.0 9.6 6.8 9.1 8.1 7.0 7.4 4.5 3.9b
Mexico 11.3 10.7 9.4 9.9 11.5 11.4 12.8 13.7 15.4 13.1b
Nicaragua -6.2 21.6 21.4 11.3 11.5 11.5 12.1 18.3 13.7 12.1b
Panama 18.8 18.1 12.9 15.4 5.7 5.2 4.9 9.9 12.1 10.7b
Paraguayd 25.5 28.4 20.8 12.0 21.6 22.0 31.0 29.0 18.6 9.3
Peru 12.0 9.5 6.2 17.1 17.7 18.1 16.8 12.8 11.7 13.3
Uruguay 24.7 19.4 16.5 18.6 4.3 4.4 20.7 22.0 41.4 51.9
Venezuela (Bolivarian Republic of)e 36.0 56.1 61.9 63.8 61.7 64.6 82.3 84.3 94.4 93.2b
The Caribbean
Antigua and Barbuda -3.8 -3.0 -4.9 -0.4 -4.2 -5.5 -5.7 -8.5 -17.5 …
Bahamas 0.8 4.0 1.9 0.0 2.4 0.4 -0.2 0.3 0.9 …
Barbados -0.9 6.6 8.0 2.3 -0.6 0.1 4.2 9.0 8.9 9.7b
Belize -1.6 0.4 -2.6 -0.6 4.0 4.9 9.0 17.5 19.4 19.9b
Dominica 13.7 7.6 7.7 1.7 3.0 1.5 0.1 -11.5 -17.5 …
Grenada 2.6 5.0 -2.1 -9.0 -10.6 -10.7 -8.0 -11.5 -13.9 …
Guyana 34.5 40.1 26.3 16.0 12.0 6.9 11.0 15.1 14.0 17.8
Jamaica -4.1 11.7 16.0 14.2 6.2 -7.5 -4.2 -3.0 -0.9 6.5
Saint Kitts and Nevis 0.2 -9.0 -20.9 -18.7 -8.8 -4.6 1.5 3.0 2.8 …
Saint Lucia 2.9 6.6 5.4 -3.1 -10.5 -14.2 -14.4 -9.4 -7.3 …
Saint Vincent and the Grenadines -7.2 -1.0 6.4 3.5 4.7 7.9 4.9 4.3 2.7 …
Suriname 20.8 10.3 23.5 21.5 19.9 21.1 23.0 29.4 36.2 50.2
Trinidad and Tobago 9.3 7.9 -20.4 -23.8 -32.4 1.9 20.6 37.6 42.4 108.7b
Source: Economic Commission for Latin America and the Caribbean (ECLAC), on the basis of official figures.a Figures as of May.b Figures as of April.c Figures as of February.d Credit granted to the private sector by the banking sector.e Credit granted by the commercial and universal banks.
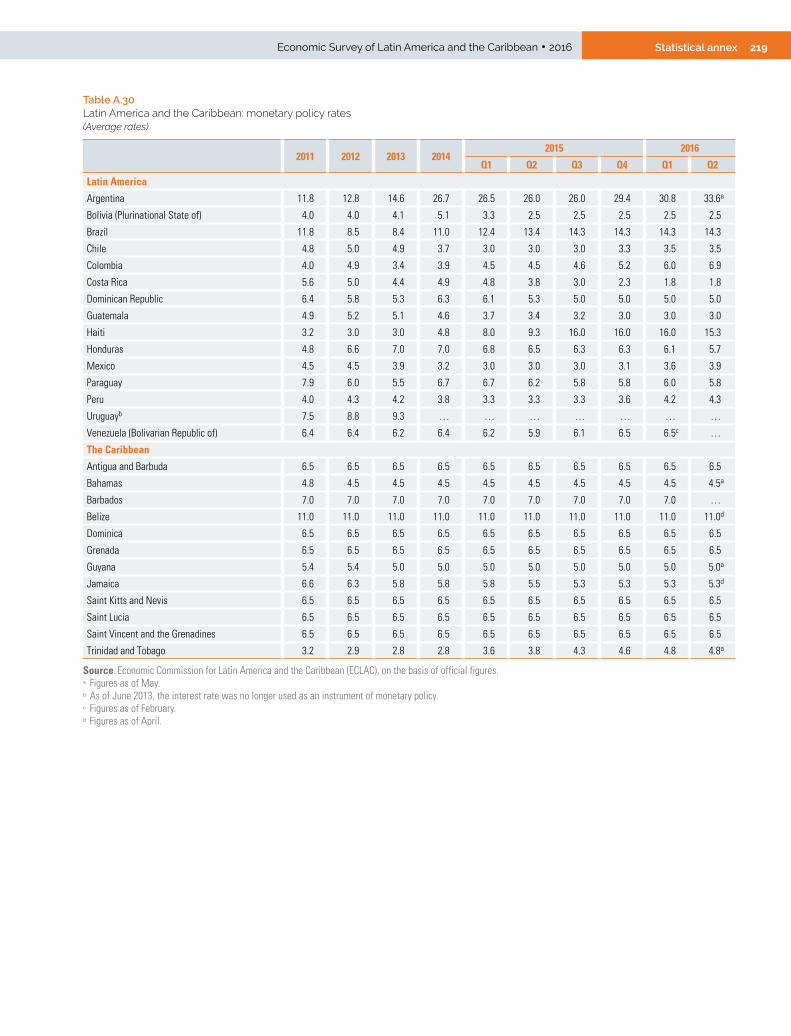
219Statistical annexEconomic Survey of Latin America and the Caribbean • 2016
Table A.30 Latin America and the Caribbean: monetary policy rates(Average rates)
2011 2012 2013 20142015 2016
Q1 Q2 Q3 Q4 Q1 Q2
Latin America
Argentina 11.8 12.8 14.6 26.7 26.5 26.0 26.0 29.4 30.8 33.6a
Bolivia (Plurinational State of) 4.0 4.0 4.1 5.1 3.3 2.5 2.5 2.5 2.5 2.5
Brazil 11.8 8.5 8.4 11.0 12.4 13.4 14.3 14.3 14.3 14.3
Chile 4.8 5.0 4.9 3.7 3.0 3.0 3.0 3.3 3.5 3.5
Colombia 4.0 4.9 3.4 3.9 4.5 4.5 4.6 5.2 6.0 6.9
Costa Rica 5.6 5.0 4.4 4.9 4.8 3.8 3.0 2.3 1.8 1.8
Dominican Republic 6.4 5.8 5.3 6.3 6.1 5.3 5.0 5.0 5.0 5.0
Guatemala 4.9 5.2 5.1 4.6 3.7 3.4 3.2 3.0 3.0 3.0
Haiti 3.2 3.0 3.0 4.8 8.0 9.3 16.0 16.0 16.0 15.3
Honduras 4.8 6.6 7.0 7.0 6.8 6.5 6.3 6.3 6.1 5.7
Mexico 4.5 4.5 3.9 3.2 3.0 3.0 3.0 3.1 3.6 3.9
Paraguay 7.9 6.0 5.5 6.7 6.7 6.2 5.8 5.8 6.0 5.8
Peru 4.0 4.3 4.2 3.8 3.3 3.3 3.3 3.6 4.2 4.3
Uruguayb 7.5 8.8 9.3 … … … … … … …
Venezuela (Bolivarian Republic of) 6.4 6.4 6.2 6.4 6.2 5.9 6.1 6.5 6.5c …
The Caribbean
Antigua and Barbuda 6.5 6.5 6.5 6.5 6.5 6.5 6.5 6.5 6.5 6.5
Bahamas 4.8 4.5 4.5 4.5 4.5 4.5 4.5 4.5 4.5 4.5a
Barbados 7.0 7.0 7.0 7.0 7.0 7.0 7.0 7.0 7.0 …
Belize 11.0 11.0 11.0 11.0 11.0 11.0 11.0 11.0 11.0 11.0d
Dominica 6.5 6.5 6.5 6.5 6.5 6.5 6.5 6.5 6.5 6.5
Grenada 6.5 6.5 6.5 6.5 6.5 6.5 6.5 6.5 6.5 6.5
Guyana 5.4 5.4 5.0 5.0 5.0 5.0 5.0 5.0 5.0 5.0a
Jamaica 6.6 6.3 5.8 5.8 5.8 5.5 5.3 5.3 5.3 5.3d
Saint Kitts and Nevis 6.5 6.5 6.5 6.5 6.5 6.5 6.5 6.5 6.5 6.5
Saint Lucia 6.5 6.5 6.5 6.5 6.5 6.5 6.5 6.5 6.5 6.5
Saint Vincent and the Grenadines 6.5 6.5 6.5 6.5 6.5 6.5 6.5 6.5 6.5 6.5
Trinidad and Tobago 3.2 2.9 2.8 2.8 3.6 3.8 4.3 4.6 4.8 4.8a
Source: Economic Commission for Latin America and the Caribbean (ECLAC), on the basis of official figures.a Figures as of May.b As of June 2013, the interest rate was no longer used as an instrument of monetary policy.c Figures as of February.d Figures as of April.

220 Statistical annex Economic Commission for Latin America and the Caribbean (ECLAC)
Table A.31 Latin America and the Caribbean: representative lending rates(Average rates)
2011 2012 2013 20142015 2016
Q1 Q2 Q3 Q4 Q1 Q2Latin AmericaArgentinaa 17.7 19.3 21.6 29.3 27.4 26.9 27.2 31.3 35.4 37.7b
Bolivia (Plurinational State of)c 6.3 6.7 7.0 6.5 6.5 6.4 6.4 6.2 6.2 6.0b
Brazild 44.7 39.6 38.8 44.6 46.6 48.5 49.9 51.4 51.9 53.9b
Chilee 12.4 13.5 13.2 10.8 9.7 10.0 8.8 8.6 9.9 10.0Colombiaf 12.8 13.7 12.2 12.1 12.3 11.8 11.9 12.5 13.7 14.8b
Costa Ricag 18.1 19.7 17.4 16.6 16.7 16.0 15.3 15.6 15.4 14.7Dominican Republicg … 15.5 13.6 13.9 15.1 14.6 14.3 15.6 15.5 15.0Ecuadorh 8.3 8.2 8.2 8.1 7.5 8.4 8.2 9.2 9.0 9.0b
El Salvadori 6.0 5.6 5.7 6.0 6.0 6.1 6.3 6.3 6.2 6.3b
Guatemalag 13.4 13.5 13.6 13.8 13.5 13.2 13.1 13.1 13.1 13.1b
Haitij 19.8 19.4 18.9 18.6 18.8 18.8 17.9 19.8 18.9 19.9b
Hondurasg 18.6 18.4 20.1 20.6 20.8 20.9 20.8 20.1 19.8 19.6k
Mexicol 29.9 28.6 27.9 28.6 28.6 28.6 28.5 28.3 28.3 …Nicaraguam 10.8 12.0 15.0 13.5 11.5 12.0 12.9 11.7 11.8 12.0b
Panaman 7.3 7.0 7.4 7.6 7.7 7.5 7.7 7.6 7.5 7.6k
Paraguayo 16.9 16.6 16.6 15.7 14.3 14.6 13.6 15.0 16.4 16.2b
Perup 18.7 19.2 18.1 15.7 16.1 16.0 16.2 16.1 16.1 16.0b
Uruguayq 11.0 12.0 13.3 17.2 17.3 16.6 16.6 17.3 18.0 18.8b
Venezuela (Bolivarian Republic of)r 17.4 16.2 15.6 17.2 18.8 19.6 20.4 21.2 20.4 21.2b
The Caribbean Antigua and Barbudas 10.1 9.4 9.4 9.6 8.0 8.0 9.4 9.3 … …Bahamast 11.0 10.9 11.2 11.8 11.9 12.4 12.6 12.3 11.8 12.4b
Barbadoss 9.3 8.7 8.5 8.6 7.0 7.0 6.9 6.8 6.8 …Belizeu 13.3 12.3 11.5 10.9 10.5 10.4 10.3 10.1 10.0 9.9k
Dominicas 8.7 8.9 9.0 8.8 8.7 8.7 8.5 8.4 … …Grenadas 10.4 9.5 9.1 9.1 8.9 8.9 8.7 8.7 … …Guyanaq 14.7 14.0 12.1 11.1 10.9 10.9 10.7 10.6 10.8 10.8b
Jamaicau 18.3 17.8 16.3 15.1 15.0 15.0 15.0v … … …Saint Kitts and Neviss 9.2 8.5 8.4 8.8 8.7 8.5 8.5 8.5 … …Saint Lucias 9.2 8.6 8.4 8.4 8.5 8.5 8.5 8.4 … …Saint Vincent and the Grenadiness 9.0 9.3 9.2 9.3 9.3 9.3 9.2 9.2 … …Surinamew 11.8 11.7 12.0 12.3 12.3 12.5 12.6 13.1 12.9 13.1b
Trinidad and Tobagoq 8.2 8.0 7.8 7.7 7.8 8.1 8.4 8.8 9.0 9.1b
Source: Economic Commission for Latin America and the Caribbean (ECLAC), on the basis of official figures.a Local-currency loans to the non-financial private sector, at fixed or renegotiable rates, signature loans of up to 89 days.b Figures as of May.c Nominal local-currency rate for 60-91-day operations. d Interest rate on total consumer credit.e Non-adjustable 90-360 day operations.f Weighted average of consumer, prime, ordinary and treasury lending rates for the working days of the month.g Weighted average of the system lending rates in local currency.h Effective benchmark lending rate for the corporate commercial segment.i Basic lending rate for up to one year. j Average of minimum and maximum lending rates. k Figures as of April.l Average interest rate for credit cards from commercial banks and average interest rate for mortgage loans.m Weighted average of short-term lending rates in local currency.n Interest rate on one-year trade credit. o Commercial lending rate, local currency.p Market lending rate, average for transactions conducted in the last 30 business days.q Business credit, 30-367 days. r Average rate for loan operations for the six major commercial banks. s Weighted average of lending rates.t Weighted average of lending and overdraft rates.u Rate for personal and business loans, residential and other construction loans; weighted average. v Figures as of August.w Average of lending rates.
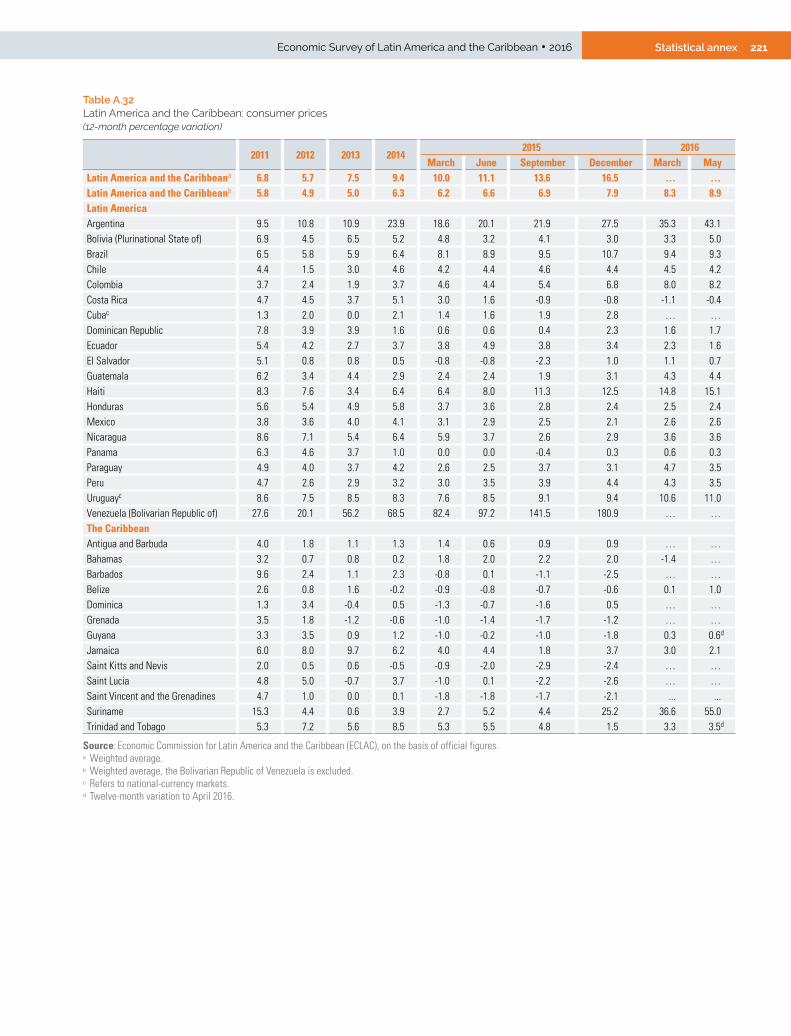
221Statistical annexEconomic Survey of Latin America and the Caribbean • 2016
Table A.32 Latin America and the Caribbean: consumer prices (12-month percentage variation)
2011 2012 2013 20142015 2016
March June September December March MayLatin America and the Caribbeana 6.8 5.7 7.5 9.4 10.0 11.1 13.6 16.5 … …Latin America and the Caribbeanb 5.8 4.9 5.0 6.3 6.2 6.6 6.9 7.9 8.3 8.9Latin AmericaArgentina 9.5 10.8 10.9 23.9 18.6 20.1 21.9 27.5 35.3 43.1Bolivia (Plurinational State of) 6.9 4.5 6.5 5.2 4.8 3.2 4.1 3.0 3.3 5.0Brazil 6.5 5.8 5.9 6.4 8.1 8.9 9.5 10.7 9.4 9.3Chile 4.4 1.5 3.0 4.6 4.2 4.4 4.6 4.4 4.5 4.2Colombia 3.7 2.4 1.9 3.7 4.6 4.4 5.4 6.8 8.0 8.2Costa Rica 4.7 4.5 3.7 5.1 3.0 1.6 -0.9 -0.8 -1.1 -0.4Cubac 1.3 2.0 0.0 2.1 1.4 1.6 1.9 2.8 … …Dominican Republic 7.8 3.9 3.9 1.6 0.6 0.6 0.4 2.3 1.6 1.7Ecuador 5.4 4.2 2.7 3.7 3.8 4.9 3.8 3.4 2.3 1.6El Salvador 5.1 0.8 0.8 0.5 -0.8 -0.8 -2.3 1.0 1.1 0.7Guatemala 6.2 3.4 4.4 2.9 2.4 2.4 1.9 3.1 4.3 4.4Haiti 8.3 7.6 3.4 6.4 6.4 8.0 11.3 12.5 14.8 15.1Honduras 5.6 5.4 4.9 5.8 3.7 3.6 2.8 2.4 2.5 2.4Mexico 3.8 3.6 4.0 4.1 3.1 2.9 2.5 2.1 2.6 2.6Nicaragua 8.6 7.1 5.4 6.4 5.9 3.7 2.6 2.9 3.6 3.6Panama 6.3 4.6 3.7 1.0 0.0 0.0 -0.4 0.3 0.6 0.3Paraguay 4.9 4.0 3.7 4.2 2.6 2.5 3.7 3.1 4.7 3.5Peru 4.7 2.6 2.9 3.2 3.0 3.5 3.9 4.4 4.3 3.5Uruguayc 8.6 7.5 8.5 8.3 7.6 8.5 9.1 9.4 10.6 11.0Venezuela (Bolivarian Republic of) 27.6 20.1 56.2 68.5 82.4 97.2 141.5 180.9 … …The CaribbeanAntigua and Barbuda 4.0 1.8 1.1 1.3 1.4 0.6 0.9 0.9 … …Bahamas 3.2 0.7 0.8 0.2 1.8 2.0 2.2 2.0 -1.4 …Barbados 9.6 2.4 1.1 2.3 -0.8 0.1 -1.1 -2.5 … …Belize 2.6 0.8 1.6 -0.2 -0.9 -0.8 -0.7 -0.6 0.1 1.0Dominica 1.3 3.4 -0.4 0.5 -1.3 -0.7 -1.6 0.5 … …Grenada 3.5 1.8 -1.2 -0.6 -1.0 -1.4 -1.7 -1.2 … …Guyana 3.3 3.5 0.9 1.2 -1.0 -0.2 -1.0 -1.8 0.3 0.6d
Jamaica 6.0 8.0 9.7 6.2 4.0 4.4 1.8 3.7 3.0 2.1Saint Kitts and Nevis 2.0 0.5 0.6 -0.5 -0.9 -2.0 -2.9 -2.4 … …Saint Lucia 4.8 5.0 -0.7 3.7 -1.0 0.1 -2.2 -2.6 … …Saint Vincent and the Grenadines 4.7 1.0 0.0 0.1 -1.8 -1.8 -1.7 -2.1 ... ...Suriname 15.3 4.4 0.6 3.9 2.7 5.2 4.4 25.2 36.6 55.0Trinidad and Tobago 5.3 7.2 5.6 8.5 5.3 5.5 4.8 1.5 3.3 3.5d
Source: Economic Commission for Latin America and the Caribbean (ECLAC), on the basis of official figures.a Weighted average. b Weighted average, the Bolivarian Republic of Venezuela is excluded.c Refers to national-currency markets. d Twelve-month variation to April 2016.

222 Statistical annex Economic Commission for Latin America and the Caribbean (ECLAC)
Table A.33 Latin America and the Caribbean: fiscal balances(Percentages of GDP)
Primary balance Overall balance2012 2013 2014 2015 2012 2013 2014 2015
Latin America and the Caribbeana -0.1 -0.7 -0.3 -0.3 -2.2 -2.9 -2.6 -2.8Latin Americab -0.2 -0.6 -1.0 -1.0 -1.9 -2.3 -2.8 -3.0Argentina 0.0 -1.3 -2.4 -1.1 -1.8 -2.5 -4.3 -3.1Bolivia (Plurinational State of)c 2.7 2.0 -1.7 -3.3 1.8 1.4 -2.5 -4.1Brazil 1.9 1.5 -0.3 -2.0 -1.8 -2.6 -5.3 -9.3Chile 1.2 0.0 -1.0 -1.5 0.6 -0.6 -1.6 -2.2Colombia 0.1 -0.1 -0.2 -0.5 -2.3 -2.3 -2.4 -3.0Costa Rica -2.3 -2.9 -3.1 -3.1 -4.4 -5.4 -5.7 -5.9Cuba … … … … 6.7 1.9 0.6 -0.5d
Dominican Republic -2.8 -0.4 -0.1 0.5 -5.2 -2.7 -2.6 -2.5Ecuador -1.0 -4.5 -5.0 -1.9 -2.0 -5.8 -6.4 -3.6El Salvador 0.5 0.6 0.8 1.3 -1.7 -1.8 -1.6 -1.1Guatemala -0.9 -0.6 -0.4 0.1 -2.4 -2.1 -1.9 -1.4Haiti 2.0 -1.0 -0.5 0.3 1.7 -1.4 -0.9 0.1Honduras -4.3 -5.8 -2.1 -0.6 -6.0 -7.9 -4.4 -3.1Mexicoe -0.7 -0.5 -1.2 -1.3 -2.6 -2.3 -3.2 -3.5Nicaragua 1.5 1.0 0.6 0.3 0.5 0.1 -0.3 -0.7Panama -0.7 -1.9 -2.3 -2.4 -2.6 -3.8 -4.0 -4.2Paraguay -1.4 -1.4 -0.7 -1.1 -1.7 -1.7 -1.1 -1.7Peru 2.4 1.5 0.5 -1.9 1.3 0.5 -0.5 -2.9Uruguay 0.4 0.9 -0.1 -0.5 -1.9 -1.5 -2.3 -2.8Venezuela (Bolivarian Republic of) -2.2 1.0 0.9 -0.2d -4.9 -1.9 -1.6 -1.8d
The Caribbeanf 0.1 -0.7 0.7 0.6 -3.3 -4.0 -2.6 -2.6Antigua and Barbuda 1.1 -2.4 -0.2 3.1 -1.3 -4.5 -2.8 0.1Bahamasg -4.2 -3.2 -1.7 1.4d -6.6 -5.7 -4.5 -1.6d
Barbadosh i -2.0 -4.1 0.7 0.2d -8.6 -11.2 -6.9 -7.3d
Belizeh 1.5 0.9 0.4 -2.5d -0.4 -1.8 -2.3 -5.2d
Dominica -7.6 -7.4 0.4 0.4 -9.2 -9.5 -1.3 -1.2Grenada -2.1 -3.4 -1.2 2.3 -5.5 -6.5 -4.7 -1.2Guyana -3.6 -3.4 -4.5 -0.4 -4.7 -4.4 -5.5 -1.4Jamaicah 5.5 7.8 7.6 7.5 -4.2 0.1 -0.5 -0.3Saint Kitts and Nevis 17.2 17.1 13.9 6.4 11.2 13.2 10.5 4.5Saint Lucia -3.0 -2.9 0.2 1.4 -6.5 -6.7 -3.6 -2.4Saint Vincent and the Grenadines 0.3 -3.7 -1.8 -0.6 -2.1 -6.2 -4.1 -2.9Surinamej -1.5 -3.1 -3.7 -7.7 -2.7 -5.9 -5.5 -10.0Trinidad and Tobagok -0.4 -1.4 -0.8 -3.5d -2.1 -3.0 -2.5 -5.5d
Source: Economic Commission for Latin America and the Caribbean (ECLAC), on the basis of official figures.a Simple averages of the 33 countries that submitted reports. The coverage corresponds to the central government.b Simple averages. Does not include Cuba.c General government.d Preliminary figures.e Federal public sector.f Simple averages.g Fiscal years, from 1 July to 30 June.h Fiscal years, from 1 April to 31 March.i Non-financial public sector.j Includes statistical discrepancy.k Fiscal years, from 1 October to 30 September.
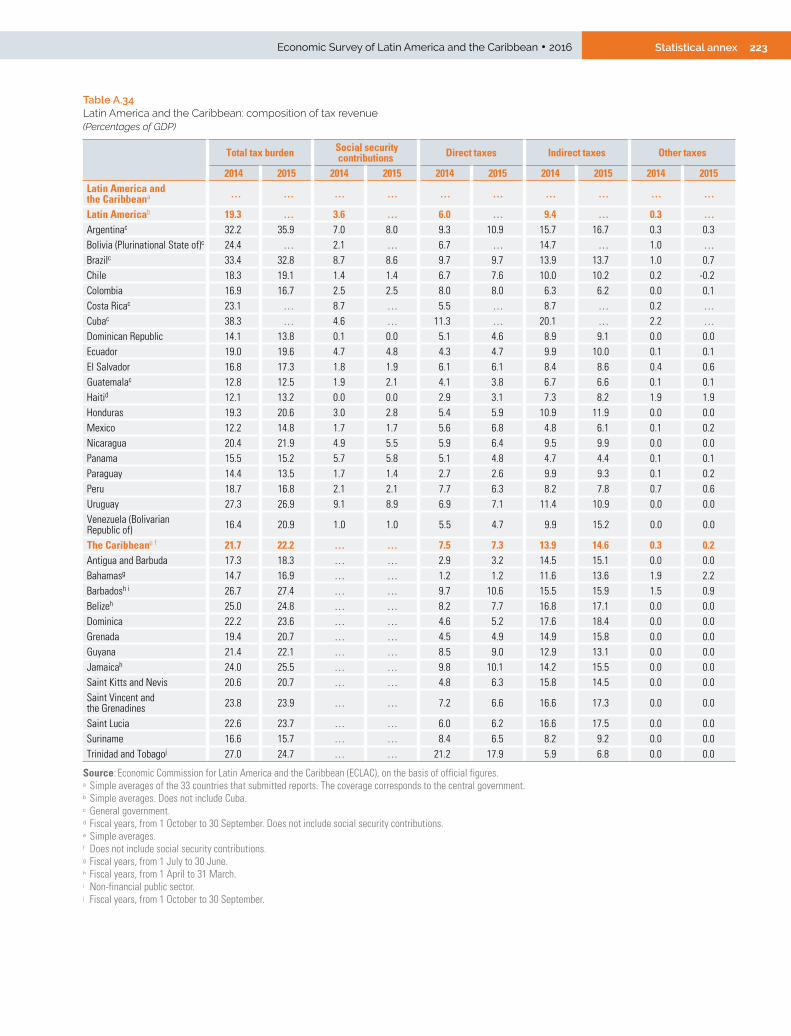
223Statistical annexEconomic Survey of Latin America and the Caribbean • 2016
Table A.34 Latin America and the Caribbean: composition of tax revenue(Percentages of GDP)
Total tax burden Social security contributions Direct taxes Indirect taxes Other taxes
2014 2015 2014 2015 2014 2015 2014 2015 2014 2015Latin America and the Caribbeana … … … … … … … … … …
Latin Americab 19.3 … 3.6 … 6.0 … 9.4 … 0.3 …Argentinac 32.2 35.9 7.0 8.0 9.3 10.9 15.7 16.7 0.3 0.3Bolivia (Plurinational State of)c 24.4 … 2.1 … 6.7 … 14.7 … 1.0 …Brazilc 33.4 32.8 8.7 8.6 9.7 9.7 13.9 13.7 1.0 0.7Chile 18.3 19.1 1.4 1.4 6.7 7.6 10.0 10.2 0.2 -0.2Colombia 16.9 16.7 2.5 2.5 8.0 8.0 6.3 6.2 0.0 0.1Costa Ricac 23.1 … 8.7 … 5.5 … 8.7 … 0.2 …Cubac 38.3 … 4.6 … 11.3 … 20.1 … 2.2 …Dominican Republic 14.1 13.8 0.1 0.0 5.1 4.6 8.9 9.1 0.0 0.0Ecuador 19.0 19.6 4.7 4.8 4.3 4.7 9.9 10.0 0.1 0.1El Salvador 16.8 17.3 1.8 1.9 6.1 6.1 8.4 8.6 0.4 0.6Guatemalac 12.8 12.5 1.9 2.1 4.1 3.8 6.7 6.6 0.1 0.1Haitid 12.1 13.2 0.0 0.0 2.9 3.1 7.3 8.2 1.9 1.9Honduras 19.3 20.6 3.0 2.8 5.4 5.9 10.9 11.9 0.0 0.0Mexico 12.2 14.8 1.7 1.7 5.6 6.8 4.8 6.1 0.1 0.2Nicaragua 20.4 21.9 4.9 5.5 5.9 6.4 9.5 9.9 0.0 0.0Panama 15.5 15.2 5.7 5.8 5.1 4.8 4.7 4.4 0.1 0.1Paraguay 14.4 13.5 1.7 1.4 2.7 2.6 9.9 9.3 0.1 0.2Peru 18.7 16.8 2.1 2.1 7.7 6.3 8.2 7.8 0.7 0.6Uruguay 27.3 26.9 9.1 8.9 6.9 7.1 11.4 10.9 0.0 0.0Venezuela (Bolivarian Republic of) 16.4 20.9 1.0 1.0 5.5 4.7 9.9 15.2 0.0 0.0
The Caribbeane f 21.7 22.2 … … 7.5 7.3 13.9 14.6 0.3 0.2Antigua and Barbuda 17.3 18.3 … … 2.9 3.2 14.5 15.1 0.0 0.0Bahamasg 14.7 16.9 … … 1.2 1.2 11.6 13.6 1.9 2.2Barbadosh i 26.7 27.4 … … 9.7 10.6 15.5 15.9 1.5 0.9Belizeh 25.0 24.8 … … 8.2 7.7 16.8 17.1 0.0 0.0Dominica 22.2 23.6 … … 4.6 5.2 17.6 18.4 0.0 0.0Grenada 19.4 20.7 … … 4.5 4.9 14.9 15.8 0.0 0.0Guyana 21.4 22.1 … … 8.5 9.0 12.9 13.1 0.0 0.0Jamaicah 24.0 25.5 … … 9.8 10.1 14.2 15.5 0.0 0.0Saint Kitts and Nevis 20.6 20.7 … … 4.8 6.3 15.8 14.5 0.0 0.0Saint Vincent and the Grenadines 23.8 23.9 … … 7.2 6.6 16.6 17.3 0.0 0.0
Saint Lucia 22.6 23.7 … … 6.0 6.2 16.6 17.5 0.0 0.0Suriname 16.6 15.7 … … 8.4 6.5 8.2 9.2 0.0 0.0Trinidad and Tobagoj 27.0 24.7 … … 21.2 17.9 5.9 6.8 0.0 0.0
Source: Economic Commission for Latin America and the Caribbean (ECLAC), on the basis of official figures.a Simple averages of the 33 countries that submitted reports. The coverage corresponds to the central government.b Simple averages. Does not include Cuba.c General government.d Fiscal years, from 1 October to 30 September. Does not include social security contributions. e Simple averages.f Does not include social security contributions. g Fiscal years, from 1 July to 30 June.h Fiscal years, from 1 April to 31 March.i Non-financial public sector.j Fiscal years, from 1 October to 30 September.

224 Statistical annex Economic Commission for Latin America and the Caribbean (ECLAC)
Table A.35 Latin America and the Caribbean: public income and expenditure (Percentages of GDP)
Total income Current expenditure Interest paymentson public debt Capital expenditure Primary expenditure
2014 2015 2014 2015 2014 2015 2014 2015 2014 2015Latin America and the Caribbeana 22.9 22.8 25.5 25.6 20.5 21.1 2.4 2.5 4.9 4.4
Latin Americab 19.3 18.8 22.1 21.8 17.3 17.5 1.8 2.0 4.7 4.2Argentina 21.3 22.4 25.6 25.4 21.3 22.8 1.9 2.0 4.3 2.7Bolivia (Plurinational State of)c 37.7 33.2 40.2 37.2 23.6 24.6 0.8 0.8 16.6 12.6Brazil 22.1 21.4 27.4 30.7 25.6 28.7 5.0 7.3 1.7 2.0Chile 20.7 21.4 22.3 23.6 18.5 19.3 0.6 0.7 3.8 4.3Colombia 16.7 16.1 19.1 19.1 16.1 16.1 2.2 2.6 3.0 3.1Costa Rica 14.2 14.8 20.0 20.7 18.2 18.8 2.6 2.8 1.7 1.9Cuba 31.9 34.9 31.4 35.3d 28.1 30.9d … 3.1 4.0d
Dominican Republic 15.1 15.2 17.7 17.7 14.9 15.0 2.5 2.9 2.7 2.6Ecuador 20.2 19.3 26.6 22.9 14.8 13.8 1.4 1.7 11.7 9.2El Salvador 15.8 16.2 17.3 17.3 14.6 14.7 2.4 2.5 2.8 2.7Guatemala 11.5 10.9 13.4 12.4 10.4 10.2 1.4 1.6 2.9 2.2Haiti 13.2 13.5 14.1 13.4 12.2 12.0 0.4 0.2 1.9 1.4Honduras 18.7 20.2 23.1 23.3 17.9 18.4 2.3 2.6 5.2 4.9Mexicoe 23.1 23.6 26.3 27.0 21.1 21.8 1.9 2.2 5.2 5.2Nicaragua 17.5 18.6 17.8 19.2 13.8 14.5 0.9 0.9 4.0 4.7Panama 14.4 13.8 18.4 18.0 11.6 11.7 1.7 1.8 6.8 6.3Paraguay 17.9 17.8 19.0 19.5 15.4 15.6 0.4 0.6 3.6 3.9Peru 19.1 16.7 19.6 19.6 14.8 14.8 1.1 1.0 4.8 4.8Uruguay 19.9 19.6 22.2 22.4 20.8 21.1 2.3 2.2 1.4 1.3Venezuela(Bolivarian Republic of) 28.1 22.4 29.6 24.1d 23.6 18.6d 2.5 1.5d 5.2 5.0d
The Caribbeanf 27.4 27.8 30.0 30.3 24.5 25.5 3.3 3.2 5.4 4.8Antigua and Barbuda 20.6 23.8 23.5 23.7 21.8 22.2 2.7 3.0 1.7 1.5Bahamasg 20.0 23.0d 24.5 24.6d 20.1 21.1d 2.7 3.0d 3.3 2.7d
Barbadosh i 28.8 29.1d 35.7 36.4d 33.5 33.9d 7.6 7.5d 2.2 2.5d
Belizeh 29.3 29.6d 31.6 34.7d 23.5 25.3d 2.7 2.7d 8.1 9.4d
Dominica 32.1 31.0 33.4 32.2 24.8 26.3 1.8 1.6 8.6 5.9Grenada 24.5 25.6 29.2 26.9 20.0 18.2 3.5 3.5 9.2 8.7Guyana 23.6 26.1 29.1 27.6 21.1 22.8 1.0 1.0 8.0 4.7Jamaicah 26.6 28.3 27.1 28.6 25.6 26.5 8.1 7.8 1.5 2.0Saint Kitts and Nevis 43.1 38.4 32.7 33.9 27.0 27.0 3.4 1.9 5.6 6.9Saint Lucia 25.3 26.4 29.0 28.8 23.3 23.1 3.9 3.9 5.7 5.7Saint Vincent and the Grenadines 28.1 27.5 32.2 30.4 25.8 25.4 2.3 2.2 6.4 5.0
Surinamej 21.1 19.4 25.7 28.6 20.7 26.1 0.9 1.5 5.0 2.5Trinidad and Tobagok 33.4 32.6d 36.0 38.1d 31.1 33.7d 1.8 2.1d 4.8 4.5d
Source: Economic Commission for Latin America and the Caribbean (ECLAC), on the basis of official figures.a Simple averages of the 33 countries that submitted reports. The coverage corresponds to the central government.b Simple averages. Does not include Cuba.c General government.d Preliminary figures.e Federal public sector.f Simple averages.g Fiscal years, from 1 July to 30 June.h Fiscal years, from 1 April to 31 March.i Non-financial public sector.j Includes statistical discrepancy.k Fiscal years, from 1 October to 30 September.

225Statistical annexEconomic Survey of Latin America and the Caribbean • 2016
Table A.36 Latin America and the Caribbean: non-financial public sector gross public debt(Percentages of GDP)
2008 2009 2010 2011 2012 2013 2014 2015Latin America and the Caribbeana 46.1 50.4 50.5 50.7 52.3 53.5 53.8 55.5Latin Americaa 30.8 32.8 31.8 31.1 32.7 34.4 36.0 38.7Argentinab 39.2 39.6 36.1 33.3 35.1 38.8 42.8 53.3Bolivia (Plurinational State of)c 37.2 39.5 38.1 33.7 31.3 30.4 30.0 29.0Brazild 57.5 60.9 53.6 50.8 55.3 56.7 58.9 66.5Chile 11.6 12.1 14.7 17.8 18.9 20.5 24.2 28.6Colombia 42.7 45.1 46.2 40.2 40.6 43.1 45.9 51.3Costa Rica 29.7 34.0 35.7 38.1 42.6 44.5 47.9 51.0Dominican Republice 23.2 27.2 27.7 28.7 31.7 37.7 37.1 36.0Ecuador 22.1 16.3 19.6 18.3 21.1 24.0 29.8 33.1El Salvador 36.9 45.2 45.1 44.1 47.9 46.3 46.5 48.0Guatemala 20.1 23.3 24.4 23.9 24.5 24.7 24.4 24.8Haitie f 42.3 34.3 22.8 23.9 28.0 30.5 36.1 35.9g
Hondurase 20.1 23.9 30.4 32.5 35.4 43.8 45.6 46.2Mexicoh 26.5 34.3 31.7 34.4 33.9 36.8 40.3 46.0Nicaragua 29.4 34.2 34.8 32.6 32.2 31.5 30.7 32.0Panama 42.6 45.4 43.0 37.3 35.7 35.5 37.1 38.8Paraguay 15.5 16.8 14.9 11.5 14.2 14.4 17.6 18.7Peru 26.9 23.7 23.5 22.1 20.4 19.6 20.1 20.0Uruguay 48.9 49.4 43.5 43.4 45.7 41.5 44.6 51.1Venezuela (Bolivarian Republic of)e 14.0 18.2 18.4 25.2 27.5 32.9 24.2 …The Caribbeana 68.3 76.0 77.9 79.2 81.0 81.4 79.9 77.7Antigua and Barbuda 81.9 95.7 87.1 93.2 87.3 99.5 102.8 92.1Bahamase 37.4 44.1 45.7 55.3 60.8 66.3 73.7 76.3Barbados 67.2 76.0 87.7 93.0 96.2 106.1 109.4 110.3Belize 79.4 82.2 72.3 70.7 72.8 78.5 75.6 79.1Dominica 72.6 66.4 73.1 67.4 77.8 77.0 76.0 80.1Grenada 82.2 90.0 91.8 98.7 101.4 102.4 95.7 85.8Guyana 62.9 67.0 68.0 66.7 63.6 58.1 51.1 47.9Jamaica 112.3 126.3 131.7 131.4 133.9 135.5 132.7 127.0Saint Kitts and Nevis 125.5 142.0 151.4 144.9 137.9 99.5 76.0 61.6Saint Lucia 58.4 64.0 65.5 68.1 74.2 76.5 76.1 76.8Saint Vincent and the Grenadines 58.0 64.7 66.7 69.8 72.6 75.9 79.7 76.7Surinamee 15.7 15.7 18.6 20.1 21.5 28.9 24.6 37.1Trinidad and Tobago 34.5 54.4 53.8 50.1 53.0 54.5 65.1 59.9
Source: Economic Commission for Latin America and the Caribbean (ECLAC), on the basis of official figures.a Simple averages.b National public sector.c Refers to the external debt of the non-financial public sector and central government domestic debt.d General government.e Central government. f Does not include public sector commitments to commercial banks.g Preliminary figures. h Federal public sector.

226 Statistical annex Economic Commission for Latin America and the Caribbean (ECLAC)
Table A.37 Latin America and the Caribbean: central government gross public debt (Percentages of GDP)
2008 2009 2010 2011 2012 2013 2014 2015Latin America and the Caribbeana 41.6 45.1 45.2 45.7 47.5 48.7 49.5 51.2Latin Americaa 28.8 30.6 29.2 29.1 30.5 32.1 33.4 35.9Argentinab 39.2 39.6 36.1 33.3 35.1 38.8 42.8 53.3Bolivia (Plurinational State of) 34.0 36.3 34.6 34.5 29.1 28.4 27.7 27.1Brazilc 57.5 59.6 52.0 50.8 55.3 56.7 58.9 66.5Chile 5.1 5.8 8.7 11.1 12.0 12.8 15.1 17.5Colombia 36.2 38.0 38.6 36.5 34.6 37.1 40.0 43.9Costa Rica 24.8 27.2 29.1 30.6 35.2 36.3 39.3 42.4Dominican Republic 23.2 27.2 27.7 28.7 31.7 37.7 37.1 36.0Ecuador 20.6 14.9 17.8 17.3 20.1 23.0 27.7 31.0El Salvador 34.4 42.6 42.6 41.7 45.7 44.0 44.2 45.2Guatemala 19.9 22.8 24.0 23.7 24.3 24.6 24.3 24.6Haitid 42.3 34.3 22.8 23.9 28.0 30.5 36.1 35.9e
Honduras 20.1 23.9 30.4 32.5 35.4 43.8 45.6 46.2Mexico 24.0 27.2 27.2 27.5 28.2 29.8 31.8 35.0Nicaragua 28.6 32.3 33.3 31.9 31.5 30.8 30.2 31.4Panama 42.0 40.7 39.6 36.7 35.2 35.0 36.8 38.4Paraguay 13.4 13.9 12.1 9.8 12.6 13.0 15.8 17.3Peru 23.1 22.8 20.7 18.4 18.3 17.3 18.1 19.5Uruguay 44.5 53.3 39.9 38.4 40.2 36.9 39.2 46.2Venezuela (Bolivarian Republic of) 14.0 18.2 18.4 25.2 27.5 32.9 24.2 …The Caribbeana 60.4 66.4 68.6 70.0 72.3 73.0 72.9 71.6Antigua and Barbuda 73.8 80.8 74.3 77.9 72.6 77.4 86.3 77.5Bahamas 37.4 50.2 54.3 55.3 60.8 66.3 73.7 76.3Barbados 55.7 63.2 72.0 77.8 83.9 96.5 99.9 106.8Belize 79.4 82.2 72.3 70.7 72.8 78.5 75.6 78.6Dominica 59.4 53.1 56.7 54.6 64.7 64.4 64.7 67.8Grenada 70.9 80.9 84.2 87.8 91.4 93.5 88.6 80.0Guyanaf 62.9 67.0 68.0 66.7 63.6 58.1 51.1 47.9Jamaicaf 112.3 126.3 131.7 131.4 133.9 135.5 132.7 127.0Saint Kitts and Nevis 97.9 105.5 113.8 118.1 109.0 77.0 63.5 50.9Saint Lucia 50.1 51.2 54.4 60.6 67.9 71.0 71.8 73.0Saint Vincent and the Grenadines 45.8 51.0 55.6 58.4 61.1 63.6 68.1 65.2Suriname 15.7 15.7 18.6 20.1 21.5 28.9 24.6 37.1Trinidad and Tobago 23.8 36.3 36.1 30.9 36.9 37.9 47.2 42.9
Source: Economic Commission for Latin America and the Caribbean (ECLAC), on the basis of official figures.a Simple averages.b National public sector.c General government. d Does not include public sector commitments to commercial banks. e Preliminary figures.f Public sector.

Publicaciones recientes de la CEPAL ECLAC recent publicationswww.cepal.org/publicaciones
Informes periódicos / Annual reportsTambién disponibles para años anteriores / Issues for previous years also available• Estudio Económico de América Latina y el Caribe 2015, 204 p. Economic Survey of Latin America and the Caribbean 2015, 196 p.
• La Inversión Extranjera Directa en América Latina y el Caribe 2015, 150 p. Foreign Direct Investment in Latin America and the Caribbean 2015, 140 p.
• Anuario Estadístico de América Latina y el Caribe 2015 / Statistical Yearbook for Latin America and the Caribbean 2015, 235 p.• Balance Preliminar de las Economías de América Latina y el Caribe 2015, 104 p. Preliminary Overview of the Economies of Latin America and the Caribbean 2015, 98 p.
• Panorama Social de América Latina 2015. Documento informativo, 68 p. Social Panorama of Latin America 2015. Briefing paper, 66 p.
• Panorama de la Inserción Internacional de América Latina y el Caribe 2015, 102 p. Latin America and the Caribbean in the World Economy 2015, 98 p.
Libros y documentos institucionales / Institutional books and documents• Panorama fiscal de América Latina y el Caribe 2016: las finanzas públicas ante el desafío de conciliar austeridad con crecimiento
e igualdad, 2016, 90 p.
• Reflexiones sobre el desarrollo en América Latina y el Caribe: conferencias magistrales 2015, 2016, 74 p.
• Panorama Económico y Social de la Comunidad de Estados Latinoamericanos y Caribeños, 2015, 58 p. Economic and Social Panorama of the Community of Latin American and Caribbean States 2015, 56 p.
• Desarrollo social inclusivo: una nueva generación de políticas para superar la pobreza y reducir la desigualdad en América Latina y el Caribe, 2015, 180 p.
Inclusive social development: The next generation of policies for overcoming poverty and reducing inequality in Latin America and the Caribbean, 2015, 172 p.
• Guía operacional para la implementación y el seguimiento del Consenso de Montevideo sobre Población y Desarrollo, 2015, 146 p. Operational guide for implementation and follow-up of the Montevideo Consensus on Population and Development, 2015, 139 p.
• América Latina y el Caribe: una mirada al futuro desde los Objetivos de Desarrollo del Milenio. Informe regional de monitoreo de los Objetivos de Desarrollo del Milenio (ODM) en América Latina y el Caribe, 2015, 88 p.
Latin America and the Caribbean: Looking ahead after the Millennium Development Goals. Regional monitoring report on the Millennium Development Goals in Latin America and the Caribbean, 2015, 88 p.
• La nueva revolución digital: de la Internet del consumo a la Internet de la producción, 2015, 98 p. The new digital revolution: From the consumer Internet to the industrial Internet, 2015, 98 p. • Globalización, integración y comercio inclusivo en América Latina. Textos seleccionados de la CEPAL (2010-2014), 2015, 326 p.
• El desafío de la sostenibilidad ambiental en América Latina y el Caribe. Textos seleccionados de la CEPAL (2012-2014), 2015, 148 p.
• Pactos para la igualdad: hacia un futuro sostenible, 2014, 340 p. Covenants for Equality: Towards a sustainable future, 2014, 330 p.
• Cambio estructural para la igualdad: una visión integrada del desarrollo, 2012, 330 p. Structural Change for Equality: An integrated approach to development, 2012, 308 p.
• La hora de la igualdad: brechas por cerrar, caminos por abrir, 2010, 290 p. Time for Equality: Closing gaps, opening trails, 2010, 270 p. A Hora da Igualdade: Brechas por fechar, caminhos por abrir, 2010, 268 p.
Libros de la CEPAL / ECLAC books138 Estructura productiva y política macroeconómica: enfoques heterodoxos desde América Latina, Alicia Bárcena Ibarra, Antonio Prado,
Martín Abeles (eds.), 2015, 282 p.
137 Juventud: realidades y retos para un desarrollo con igualdad, Daniela Trucco, Heidi Ullmann (eds.), 2015, 282 p.
136 Instrumentos de protección social: caminos latinoamericanos hacia la universalización, Simone Cecchini, Fernando Filgueira, Rodrigo Martínez, Cecilia Rossel (eds.), 2015, 510 p.
135 Rising concentration in Asia-Latin American value chains: Can small firms turn the tide?, Osvaldo Rosales, Keiji Inoue, Nanno Mulder (eds.), 2015, 282 p.
134 Desigualdad, concentración del ingreso y tributación sobre las altas rentas en América Latina, Juan Pablo Jiménez (ed.), 2015, 172 p.
133 Desigualdad e informalidad: un análisis de cinco experiencias latinoamericanas, Verónica Amarante, Rodrigo Arim (eds.), 2015, 526 p.
132 Neoestructuralismo y corrientes heterodoxas en América Latina y el Caribe a inicios del siglo XXI, Alicia Bárcena, Antonio Prado (eds.), 2014, 452 p.
Copublicaciones / Co-publications• Gobernanza global y desarrollo: nuevos desafíos y prioridades de la cooperación internacional, José Antonio Ocampo (ed.), CEPAL/Siglo Veintiuno,
Argentina, 2015, 286 p.• Decentralization and Reform in Latin America: Improving Intergovernmental Relations, Giorgio Brosio and Juan Pablo Jiménez (eds.),
ECLAC / Edward Elgar Publishing, United Kingdom, 2012, 450 p.• Sentido de pertenencia en sociedades fragmentadas: América Latina desde una perspectiva global, Martín Hopenhayn y Ana Sojo (comps.),
CEPAL / Siglo Veintiuno, Argentina, 2011, 350 p.
Coediciones / Co-editions• Perspectivas económicas de América Latina 2016: hacia una nueva asociación con China, 2015, 240 p. Latin American Economic Outlook 2016: Towards a new Partnership with China, 2015, 220 p.• Perspectivas de la agricultura y del desarrollo rural en las Américas: una mirada hacia América Latina y el Caribe 2015-2016, CEPAL / FAO / IICA,
2015, 212 p.
Documentos de proyecto / Project documents• Complejos productivos y territorio en la Argentina: aportes para el estudio de la geografía económica del país, 2015, 216 p.
• Las juventudes centroamericanas en contextos de inseguridad y violencia: realidades y retos para su inclusión social, Teresita Escotto Quesada, 2015, 168 p.
• La economía del cambio climático en el Perú, 2014, 152 p.
Cuadernos estadísticos de la CEPAL42 Resultados del Programa de Comparación Internacional (PCI) de 2011 para América Latina y el Caribe. Solo disponible en CD, 2015.
41 Los cuadros de oferta y utilización, las matrices de insumo-producto y las matrices de empleo. Solo disponible en CD, 2013.
Series de la CEPAL / ECLAC SeriesAsuntos de Género / Comercio Internacional / Desarrollo Productivo / Desarrollo Territorial / Estudios Estadísticos / Estudios y Perspectivas (Bogotá, Brasilia, Buenos Aires, México, Montevideo) / Studies and Perspectives (The Caribbean, Washington) / Financiamiento del Desarrollo/ Gestión Pública / Informes y Estudios Especiales / Macroeconomía del Desarrollo / Manuales / Medio Ambiente y Desarrollo / Población y Desarrollo/ Política Fiscal / Políticas Sociales / Recursos Naturales e Infraestructura / Seminarios y Conferencias.
Revista CEPAL / CEPAL ReviewLa Revista se inició en 1976, con el propósito de contribuir al examen de los problemas del desarrollo socioeconómico de la región. La Revista CEPAL se publica en español e inglés tres veces por año.
CEPAL Review first appeared in 1976, its aim being to make a contribution to the study of the economic and social development problems of the region. CEPAL Review is published in Spanish and English versions three times a year.
Observatorio demográfico / Demographic Observatory Edición bilingüe (español e inglés) que proporciona información estadística actualizada, referente a estimaciones y proyecciones de población de los países de América Latina y el Caribe. Desde 2013 el Observatorio aparece una vez al año.
Bilingual publication (Spanish and English) proving up-to-date estimates and projections of the populations of the Latin American and Caribbean countries. Since 2013, the Observatory appears once a year.
Notas de poblaciónRevista especializada que publica artículos e informes acerca de las investigaciones más recientes sobre la dinámica demográfica en la región. También incluye información sobre actividades científicas y profesionales en el campo de población. La revista se publica desde 1973 y aparece dos veces al año, en junio y diciembre.
Specialized journal which publishes articles and reports on recent studies of demographic dynamics in the region. Also includes information on scientific and professional activities in the field of population. Published since 1973, the journal appears twice a year in June and December.
Las publicaciones de la CEPAL están disponibles en:ECLAC publications are available at:
www.cepal.org/publicaciones
También se pueden adquirir a través de:They can also be ordered through:
www.un.org/publications
United Nations PublicationsPO Box 960
Herndon, VA 20172USA
Tel. (1-888)254-4286 Fax (1-800)338-4550
Contacto / Contact: [email protected] / Orders: [email protected]

www.eclac.org