Sustainability East - East of England Climate Change Adaptation

Phase 1 Report February
2020
Cambridge Econometrics
Cambridge, UK
www.camecon.com
IFM Investors
Economic Strategy for the East of England

Economic Strategy for the East of England
2 Cambridge Econometrics
Cambridge Econometrics’ mission is to provide clear insights, based on rigorous and independent
economic analysis, to support policy-makers and strategic planners in government, civil society and
business in addressing the complex challenges facing society.
Cambridge Econometrics Limited is owned by a charitable body,
the Cambridge Trust for New Thinking in Economics.
www.neweconomicthinking.org

Economic Strategy for the East of England
3 Cambridge Econometrics
Contents Page
Contents 3
Foreword 5
Executive Summary 6
1 Introduction 21
1.1 Background and context 21
1.2 Objectives 21
1.3 Remaining sections of the report 22
2 The Economy of the East of England 23
2.1 Introduction 23
2.2 Economic history 23
2.3 Governance 27
2.4 Infrastructure 29
3 Ambitions for Growth 36
3.1 Introduction 36
3.2 Forecasting methodology and data sources 36
3.3 Results and comparisons 37
3.4 The spatial dimension 52
4 Challenges and Opportunities 59
4.1 Introduction 59
4.2 The Grand Challenges and Emerging Sectors 59
4.3 Assets and Strengths of the East of England 60
5 Regional Constraints and Interventions 88
5.1 Introduction 88
5.2 Constraints 88
5.3 Interventions 89
5.4 Potential solutions 94
6 References 95
Annex A: Literature overview 96
Annex B: Productivity and Employment Density by Local Authority 102
A.1 Productivity 102

Economic Strategy for the East of England
4 Cambridge Econometrics
A.2 Employment Density 110
Annex C: Detailed Interventions 118

Economic Strategy for the East of England
5 Cambridge Econometrics
Foreword
As business and political leaders in the East of England, we welcome this new
report by Cambridge Econometrics which showcases both the existing
economic strengths of our region and the scale of the opportunity which exists
for the future.
As the report shows, the East of England already makes a substantial
contribution to UK plc, whether through our world-leading universities, cutting-
edge scientific research or the burgeoning agri-food and renewables sectors.
We are also fortunate to benefit from growth ‘clusters’ across different parts of
the region and, through our successful airports, links to growth opportunities
around the world.
Looking ahead, this report sets out the exciting opportunity which exists for the
East of England to be at the forefront of solving a number of social, economic
and environmental challenges over future decades, whether that be the
development and deployment of artificial intelligence or making the UK a
global leader in clean growth.
Across the East, there is significant common ground between LEPs, local
authorities, business, Further and Higher Education, not-for-profit and other
community organisations and other bodies as to what steps are needed to
ensure the region is best-placed to seize the opportunities of the future. As we
enter the 2020s, closer collaboration and partnership between business, local
government and others in the East of England will be crucial in unlocking the
significant potential which exists in the region.
Through outlining the shape of a common agenda for the region in the
decades ahead, this report provides a valuable signpost as to how different
bodies can work together to realise the opportunities of the future. We look
forward to playing our part in realising that shared ambition.
Mark Bretton
Chair, Hertfordshire Local Enterprise Partnership & Chair, LEP Network
Christian Brodie
Chair, South East Local Enterprise Partnership
Doug Field
Chair, New Anglia Local Enterprise Partnership
James Palmer
Mayor, Cambridge and Peterborough Combined Authority

Economic Strategy for the East of England
6 Cambridge Econometrics
Executive Summary
The East of England is one of the most economically successful regions in
England. Despite not containing any of the top 20 largest urban areas in the
UK, the East of England is the 4th most prosperous region in England, with a
Gross Value Added (GVA)1 of over £150bn (2017), 9.8% of England’s total
GVA. Trends in regional GVA over the past four decades are illustrated in
Figure 1.
1 According to the ONS: “Gross value added (GVA) is a measure of the increase in the value of the
economy due to the production of goods and services.” See here for all relevant ONS datasets and
publications.
The East of England has
been an economic
success story…
The East of England has been an economic success story, with the ability and ambition to play a leading role in driving the UK economy forward over the long term, as well as being at the global forefront in solving numerous social and environmental issues. However, there are a number of challenges that need to be overcome to fully realise this ambition. This report recommends a number of potential solutions, among which better regional coordination is key.
Figure 1 GVA in English regions excluding London, 1971-2016

Economic Strategy for the East of England
7 Cambridge Econometrics
The East of England GVA rose by 146% in 1971-2016, the fifth highest rate
among English regions and above the average rates for both the UK (133%)
and England (136%). Employment has also seen significant growth in 1971-
2016, expanding from 1.84m to 3.1m – a 68.8% increase, behind only the
South West (71.6% employment growth) and the South East (70.2%
employment growth) among regions in England over the same time period.
Furthermore, labour productivity2 in the East of England is at a high level at
£48,000 per worker (2017), ranking third in England behind London (£73,000)
and the South East (£53,000). Similarly, London and the South East are the
only regions with a higher GVA per head than the East (£48,300 and £29,400
compared to £24,400).
The explanation behind the region’s impressive performance is that the East
of England has a combination of physical and institutional assets that
compares favourably to any other UK region. These include:
• The presence of a world-leading university and associated globally
significant tech clusters in and around Cambridge, the UK’s leading
hub of innovation and knowledge generation outside of London
• The highest proportion of employment in scientific research and
development (1.1% in 2017)3 of any UK region
• Region-wide specialisations in high-value, knowledge intensive
services, particularly in the professional, technical and scientific
services and information and communication sectors
• A range of complementary specialisms, most notably in agri-food,
offshore renewables, tourism and construction, as well as some niche
high value manufacturing
• Close proximity to and high level of integration with London, resulting in
numerous business links and commuting movements
• Significant international gateways, including high capacity freight and
passenger terminals serving the European mainland, and (in London
Stansted) the fourth busiest airport in the UK4
• A high quality of life, with a mix of smaller “liveable” cities with
significant cultural heritage, and peaceful and affluent rural areas
Figure 2 illustrates several of the region’s key assets. Figure 2a shows the
high employment share in science, research, engineering and technology
professions in Cambridge and the surrounding areas. In Figures 2b and 2c the
concentration of arable land and offshore windfarms in the East of England
area is evident. Finally, Figure 2d includes the largest English ports in terms of
cargo5, with a significant number of them located in the East of England area.
2 Defined as the ratio of GVA (balanced approach; 2016 Chained Volume Measures) to total employment.
3 Compared to national average is 0.4%, 2nd highest region is South East with 0.7%
4 Airport data by the Civil Aviation Authority (CAA) for 2018.
5 Port and domestic waterborne freight statistics by the Department for Transport for 2017.

Economic Strategy for the East of England
8 Cambridge Econometrics
Figure 2d: Location of major ports in the east of England – two of the most significant ports are at Harwich in Essex and Felixstowe in Suffolk
Figure 2c: Location of current and future offshore windfarms around the UK coastline. The East Anglian coast represents the bottom half of the “Eastern Energy Coast”
Figure 2b: Land cover in England and Wales. Arable land (shown in burgundy) is heavily conentrated in the East of England
Figure 2a: Share of employment in scientific research and development by Authority District
Figure 2 Key assets in the East of England

Economic Strategy for the East of England
9 Cambridge Econometrics
The component Local Enterprise Partnerships (LEPs) and other authorities
within the East of England do not individually lack of ambition. Authorities
within the region have identified several ambitious priorities for development
over the next few decades. While several of the targets and objectives of the
different local authorities overlap, there is no unifying overall ambition for the
region, such as the ‘Northern Powerhouse’ for the North of England and the
‘Engine’ for the Midlands.
Critically, all authorities aim to grow as centres of economic activity in their
own right, rather than as satellites of Greater London. There is also an
agreement across all local areas that boosting growth in knowledge-intensive
sectors is essential, but the needs of local populations across all skills levels
must be taken into account as well. Furthermore, it is noted that this must be
combined with measures to protect the valuable environmental and rural
assets that the region has in abundance.
Quantitative measures regarding the ambitions of the local development
bodies within the East of England region are provided in the strategic
documents of the Local Enterprise Partnerships and other local governing
bodies. The combined individual targets for all component geographies within
the East of England is to deliver about £223.8bn GVA by 2036.
Figure 3 illustrates ambitions and forecasts about the East of England
economy as an index, with 2017 as the base year.6 The growth targets for the
next 20 years are to achieve or surpass the forecasts of both the East of
England Forecasting Model (EEFM) and the Local Economy Forecasting
Model (LEFM). More specifically, the combined ambition of regional authorities
implies that by 2036 the East of England economy will grow by 45%
(compared to 2017), while the EEFM and LEFM predict growth of 32.6% and
25.5% respectively.
Apart from the GVA growth figures from the LEFM and EEFM projections and
the combined ambitions, Figure 3 includes a projection based on the Office for
Budget Responsibility (OBR) forecasts. Due to lack of official forecasts at the
regional level, we have used the OBR rates (under the baseline scenario) for
the national economy to estimate future growth for the East of England if it
achieves the forecasted national growth rate. The combined growth targets
imply a cumulative growth rate higher than the one forecasted by the OBR
(45% compared to 41%).
Hence, the combined growth ambition for the next 20 years is feasible yet
ambitious; to surpass the projections of both the East of England Forecasting
Model (EEFM) and the Local Economy Forecasting Model (LEFM), as well as
the national growth rate predicted by the OBR.
6 This implies that the 2017 value is set to 100, and future or past values indicate the percentage difference
with 2017 (e.g. a value of 110 in 2020 would imply a 10% growth since 2017).
…with the ability and ambition to
play a leading role in driving
the UK economy forward over the
long term…

Economic Strategy for the East of England
10 Cambridge Econometrics
Whilst the ambitions of the regional authorities do not seem overly unrealistic,
they do imply an acceleration of the regional economy relative to model
forecasts. Better regional coordination and a wider spatial and strategic plan
would be essential to overcoming the obstacles holding back the East of
England economy and achieving the combined growth target. Even though
incentives may exist to act in (relative) isolation and compete for resources
and funding, the areas constituting the East of England share similar
ambitions, face similar challenges and possess complementary assets,
making collaboration and unity a more beneficial course of action.
Whilst each local area has its own set of circumstances, there are a range of
objectives that are shared by all areas of the region. These include:
• improvements of both inter-city and intra-city infrastructure;
• provision of employment land and premises, as well as place-shaping
for technology-based businesses and skilled workers;
• maintaining the balance between high levels of housebuilding whilst
protecting the natural environment and quality of life of residents;
• the need to provide high-quality employment opportunities for existing
and future residents, of all skill levels.
Shared
objectives
Figure 3 Projected GVA growth in the East of England over the next 20 years

Economic Strategy for the East of England
11 Cambridge Econometrics
Unlike other English regions (such as the West Midlands and the North East),
the East of England isn’t based around a single conurbation.7 This presents
challenges, but also opportunities. An alternative vision of the region as a
network of economic corridors provides a different lens through which to
envision future growth. Greater Cambridge is the UK’s centre of innovation
and its knowledge generation is rivalled only by London in this regard. The
area specialises in ideas and has a leading position in innovation, design and
technology consultancy in Global Value Chains. Whilst the innovation and
knowledge intensive activity in the region isn’t restricted to Cambridge, it is
undoubtedly concentrated around the city.8 Figure 5 depicts the economic
corridors within the East of England, most of which are centred around
7 The Nomis population estimates – small area based by single year of age dataset provides population
estimates of major towns and cities (defined as having at least 75,000 usual resident population or workday
population) in England and Wales. The largest cities in the East of England are Luton (223,000); Norwich
(196,000); Southend-on-Sea (184,000); Peterborough (176,000); and Ipswich (150,000). None of them are
included in the top population quintile, as they are ranked 24th, 26th, 30th, 33rd and 41st respectively among
112 towns and cities.
8 According to the Complete University Guide, the University of Cambridge is the top ranked University in
the UK and is fourth in research quality, while in the Times Higher Education World University Rankings it is
ranked second globally overall and in terms of research. Furthermore, according to the East of England
Science and Innovation Audit (2017), just under half of private R&D total spend for companies registered in
the East of England is in Cambridgeshire (noting that some of the major players in the East of England,
such as BT, are registered elsewhere and are not included in the figure).
A spatial vision
for the East of
England
Figure 4 Objectives shared across the East of England

Economic Strategy for the East of England
12 Cambridge Econometrics
Cambridge. There is a big opportunity to more closely link Greater Cambridge
to the rest of the region and the UK through improved transport infrastructure.
However, the future of the East of England is not restricted solely to these
corridors. The region has many other valuable assets, including both high-
quality farmland and the East Anglian coastline. These assets offer
complementary capabilities, which make up a broad regional offer that is
greater than the sum of its parts.
Our vision of the future of the East of England is therefore a network of
dynamic knowledge corridors, that make the best possible use of their existing
and (improved) future infrastructural assets by linking the key regional clusters
and institutions, connecting with both the significant coastal assets to the East
with specialisations in logistics, offshore renewables and tourism,9 as well as
to the London Commuter belt to the south. These corridors are interspersed
with rural oases, which themselves provide a wide range of growing
employment opportunities in the tourism and agri-food sectors.
The region can, and should, take the lead in tackling the four National
Industrial Strategy Grand Challenges; namely Artificial Intelligence and Data,
9 See Chapter 4 for a detailed analysis on the employment specialisations within the East of England.
… as well as being at the
global forefront in solving
numerous social, economic and environmental
challenges…
Figure 5 Economic Corridors with high growth potential within the East of England

Economic Strategy for the East of England
13 Cambridge Econometrics
Ageing Society, Clean Growth and the Future of Mobility.10 Furthermore, apart
from these Grand Challenges, the East of England is well-placed to play a
major role in the Future of Electronics, Agri-Food, Construction and
Professional Services (Table 1). The above should be part of a wider ambition
to continue to drive the UK’s leading position in global innovation networks
and supply chains, by contributing to the development of new products and
services in a wide range of global value chains.
Due to the rapid rate of technological progress and shifting global trends and
priorities, the products and services we consume will change in both
construction and functionality. Hence, the scope of global value chains will
evolve radically over the next few decades, providing specific opportunities for
the East of England to build on current cutting-edge technological strengths,
many of which have significant environmental, social and economic benefits
associated with their continued development.
10 Department for Business, Energy and Industrial Strategy (2017). Industrial Strategy: building a Britain fit
for the future. London, United Kingdom.

Economic Strategy for the East of England
14 Cambridge Econometrics
Table 1 Future challenges and opportunities, and the East of England offer
Challenge Description East of England Offer Key Clusters/Locations Key Facts and Figures
Grand Challenges
Artificial
Intelligence and
Data
Putting the UK at the forefront of
the artificial intelligence and data
revolution
- The East of England has a rich history and
tradition in computer science and information
technology in both academia and business,
and is currently one of the most dynamic and
innovative technology centres globally spurred
primarily by the ‘Cambridge Phenomenon’
- Cambridge Cluster
- Adastral Park
- Hertfordshire IT
cluster
- Cranfield University
- The East of England is 2nd among
UK regions in digital tech turnover
and 3rd in digital tech business
count and employment11
- Tech concentration in Cambridge is
double the UK average12
Ageing Society Harnessing the power of
innovation to help meet the needs
of an ageing society
- The region is home to world-class universities
and research institutions in the fields of
medicine, pharmaceuticals and biosciences,
as well as to some of the most globally
important companies in these sectors, thus
offering opportunities for collaboration,
commercialisation and knowledge exchange
- Cambridge Cluster
- Norwich Research
Park
- Stevenage
Bioscience Catalyst
- BioPark
- GlaxoSmithKline
R&D
- Institutions and entities from the
East of England accounted for the
following shares in UK Research
Council funding in 2004-16: 24% in
regenerative medicine; 20% in
microbiome; 26% in personalised
medicine; and 21% in the (much
bigger) sphere of drug discovery.
The shares for EU funding are
broadly similar13
- Only region with specialisation in all
four life sciences sectors (core
biopharma, biopharma service and
supply, core medtech, medtech
service and supply) relative to the
national level14
11 Tech Nation report 2019
12 Tech Nation report 2018
13 East of England Science and Innovation Audit (2017)
14 Ibid.

Economic Strategy for the East of England
15 Cambridge Econometrics
Clean Growth Maximising the advantages for
the UK industry from the global
shift to clean growth
- The East of England coastline is a major hub
for offshore wind and nuclear power
generation, while the region’s decades-long
history in the oil and gas sectors has endowed
it with a developed and experience supply
chain
- East of England
Energy Group
- East of England
Energy Zone
- OrbisEnergy
- 60% of offshore wind Energy in the
UK generated in the East of
England15
- There are currently 986 wind
turbines off the region’s coast
generating 3.75GW of renewable
energy, with an additional
investment of £50bn over the next
ten years to deliver more than
1,000 additional turbines16
Future of Mobility Being a world leader in shaping
the future of mobility
- The region has several important knowledge
and infrastructure assets that can help make
significant contributions in shaping the future
of mobility
- Aerospace
Technology Institute
- Millbrook Proving
Ground
- Nissan Technical
Centre Europe
- Lotus Cars
- Multi-User
Environment for
Autonomous Vehicle
Innovation
(MUEAVI), Cranfield
University
- Cranfield is UK site of the Nissan
Centre of Excellence for design
and development of vehicles
manufactured in the European
plants, employing 900 on site17
- Lotus will produce the first all-
electric hypercar by a British
manufacturer18
15 Ibid.
16 New Anglia LEP (2017a)
17 Life at Nissan Cranfield.
18 News announcement by Lotus.

Economic Strategy for the East of England
16 Cambridge Econometrics
Challenge Description East of England Offer Key Clusters/Locations Key Facts and Figures
Other Challenges
and Opportunities
Future of
Electronics
(both consumer
and business
electronics)
Staying at the technological
frontier by focusing on the most
leading-edge fields, such as home
and portable entertainment
platforms, Internet of Things (IoT),
Virtual Reality (VR), Artificial
Intelligence (AI), connected
systems, sensors, and robotics
- Several globally and nationally significant
technology clusters are thriving in the area,
while leading research universities with
specialisations in computer science and
engineering are also located in the area and
are frequently collaborating with the business
sector to produce innovative ideas and
products
- Cambridge Cluster
- Adastral Park
- Hethel Engineering
Centre
- Hertfordshire IT
cluster
- Airbus Defence and
Space Stevenage
- Cranfield University
- Businesses in Cambridge are 4
times more likely to focus on
electronics and components than
the national average19
- The East of England has
employment specialisations in a
number of electronics, materials
and engineering subsectors20
Future of Agri-Food Developing specialisations in
producing high-quality, healthy,
ethical and sustainable food
without being unaffordable
- The East of England has a unique combination
of high-quality farmland and R&D focused on
the agri-tech and bioscience sectors, allowing
for both cutting edge research and
implementation
- National Institute of
Agricultural Botany
(NIAB)
- Rothamsted
Research
- John Innes Centre
- Quadram Institute
- Hertfordshire IQ
- Agri-Tech East
- Eastern Agri-Tech
Growth Initiative
- For the period 2004-16, the East of
England accounted for 35% of UK
Research Council Funding in plant
and crop science; 24% in agri-
environmental science and 16% in
food science and nutrition21
- The East of England has a total
farmed area of 1.4m hectares,
accounting for 15.3% of total
farmed area in England (second to
the South West’s 19.3% share).
79% of the farmed area is arable,
by far the highest share and largest
arable area among English
regions22
19 Tech Nation report 2015.
20 See Chapter 4 of this report.
21 East of England Science and Innovation Audit (2017).
22 https://www.gov.uk/government/statistics/agricultural-facts-england-regional-profiles

Economic Strategy for the East of England
17 Cambridge Econometrics
Future of
Construction
Taking the lead in novel
construction methods and trends,
including offsite construction,
build-integrated technology,
energy efficiency
- The fact that the East of England includes
several of the fastest growing housing markets
in the UK, combined with its proximity to
London, expertise in engineering and
innovation and specialisation in construction,
put the region in an excellent position to take
the future of construction forward
- Hertfordshire IQ
- Hethel Engineering
Centre
- Building Research
Establishment (BRE)
Watford
- According to ONS data23, the East
of England ranks 3rd among
regions in Great Britain in
concentration of construction firms,
and 4th in concentration of
construction-specific employment
- Apart from the Cambridgeshire and
Peterborough CA, all other LEP
areas in the East of England have
an employment specialisation in
construction24
Future of
Professional
Services
Taking advantage of technological
advances that can improve the
productivity of the sector, such as
new analysis tools, virtual offices,
digital platforms, cloud services,
sharing of specialist tacit
knowledge
- The region is well-placed to tackle this
challenge due to its diverse mix of local
specialisations, knowledge assets, dynamic
business environment and technological know-
how
- Cambridge Cluster
- Adastral Park
- Norwich financial
services cluster
- Ipswich insurance
services cluster
- The region has significant
employment specialisation in the
professional, scientific and
technical activities and information
and communication sector25
23 ONS (2018). Construction statistics: Number 19, 2018 edition.
24 See Chapter 4 of this report.
25 See Chapter 4 of this report.

Economic Strategy for the East of England
18 Cambridge Econometrics
The growth potential of the East of England and the corresponding manifold
benefits to the UK economy, society and the environment will not be realised
without intervention. There are significant constraints currently holding back
the development of the region, which, in order to be lifted, require joined-up
local and national government action:
• Future growth prospects in the Greater Cambridge area are currently
severely constrained by its ability to provide realistically affordable
housing26 and commercial space for future firms and employees, and,
not least, its ability to efficiently move daily commuters around and
between its various employment hubs, many of which are on the urban
fringe where they have poor public transport connectivity. Similar
issues are also affecting Hertfordshire.27
• The northern and eastern fringes of the region (Fenland and areas of
Norfolk and Suffolk) suffer from issues associated with rural
peripherality, including patchy infrastructure provision, low levels of
enterprise and innovation28, as well as difficulty in attracting young
graduates and/or accessing suitably skilled (further or higher
education) local workers29. The key here is to better integrate these
peripheral areas into the economic market areas of their local
employment centres, without compromising the high levels of natural
capital that make them unique and attractive areas in their own right.
• A challenge facing Essex, Norfolk and Suffolk is to tackle its
disadvantaged urban communities in coastal areas.30 Making better
use of coastal assets, including in transport and logistics, offshore
renewables and tourism to provide employment opportunities, is key
here.
26 According to the Cambridgeshire and Peterborough Independent Economic Review (2018), both the
house-price-to-earnings ratio and the ratio of private median rents to median income in most
Cambridgeshire district council areas are higher than the England average. Cambridge is the least
affordable: the average house price is 13 times higher than average earnings (for England it is 7.8), while
the median rent is 41% of the median income (the relevant value for England is 27%).
27 Housing delivery in the post-recession period has consistently lagged behind the planned targets, while
the housing affordability ratio has declined for all local authority districts in the county over the period 2013-
15 (Hertfordshire LEP, 2017).
28 48 businesses created per 10,000 residents compared to the UK average of 72, while only 14% of active
enterprises introduced a new or significantly improved process or service between 2010 and 2012, below
the UK average of 19% (New Anglia LEP, 2017b).
29 In 2015, 36.7% of workers in Norfolk and Suffolk had a qualification of the highest level (NQV4 and
above; for higher education this implies at least a bachelor’s degree), while at the national level the relevant
figure was 42.9% (New Anglia LEP, 2017b). Furthermore, over the academic years 2014-15, more students
left Norfolk and Suffolk to study elsewhere than those choosing to study in the area (ibid.).
30 Parts of the Tendring District in north East Essex are the most deprived parts in the country, according to
the Indices of Multiple Deprivation for England, published by the Department for Communities and Local
Governments (South East LEP, 2017). Furthermore, Castle Point in Essex is one of two authority areas in
the country with the smallest proportion of over-16s holding advanced qualifications (ibid.).
… but there are a number of
challenges that need to be
overcome to realise this
ambition,

Economic Strategy for the East of England
19 Cambridge Econometrics
• A pressing issue to the south and west of the region is the availability
of employment land and premises.31 Permitted Development Rights
have led to a lot of commercial office space being repurposed as
apartments – leading to loss of employment premises, and most
notably, of the land they are on for future redevelopment. Therefore,
existing employment sites are being encroached by residential use –
and become impossible to consolidate and regenerate as fit-for-
purpose, campus-style technology parks and business centres.
• Despite the significant knowledge assets, the region as a whole suffers
from low levels of graduate retention.32 This is partly due to the lack of
a single conurbation with the diverse and exciting entertainment offer
available in London or Manchester. The region needs to consider what
its unique offer is to attract and retain young workers.
• Finally, there is acknowledged to be a lack of regional coordination
across all sectors, technologies, challenges and factors of productivity.
The right spatial level for coordination needs to be considered on a
case-by-case basis.
One of the region’s biggest challenges, shared across all local jurisdictions, is
that several areas have a severe shortage of housing and employment space
provision, while other areas struggle to attract and keep residents and
businesses.33 Improvement and expansion of the regional transport network,
especially close to and between employment centres, is crucial in alleviating
the pressure in the high-demand areas around the region, while also helping
boost productivity and enhancing knowledge exchange and strategic
connections both within the region and with neighbouring regions. Transport
infrastructure improvements would also help the more peripheral areas
improve their offer to potential new residents and businesses, as well as
unlock new spaces for commercial and housing development.
The problem of attracting and retaining employees, particularly when it comes
to young graduates, could be further improved through creative place-making
and diversification of the entertainment options available.
Another important, and linked, intervention would be to facilitate the diffusion
of knowledge and employment opportunities within the region, as there are
31 For example, vacancy rates of commercial property in Norfolk and Suffolk have been dropping throughout
2012-16 (with the exception of Great Yarmouth), while incubation space is oversubscribed (New Anglia
LEP, 2017b).
32 CE analysis of Higher Education Statistics Agency (HESA) data shows that the share of graduates from
an East of England institution that are employed in the region stands at 53.3%, one of the lowest retention
rates in England (more specifically, only the East Midlands, South East and South West have lower rates).
When excluding those that did not live in the region prior to their studies, this figure falls to 10.6% (once
again 4th lowest in England).
33 In the New Anglia LEP area, the figure of people per job ranges from 1.56 in Norwich and 1.8 is St.
Edmundsbury to 2.85 in Waveney and 3.17 in North Norfolk (New Anglia LEP, 2017b; New Anglia LEP,
2017a; New Anglia LEP, 2017a). Furthermore, in the Cambridgeshire and Peterborough Combined
Authority area, there is evidence that housing completions in more rural districts have fallen in recent years,
while in the cities of Cambridge and Peterborough housing delivery has accelerated (The Cambridgeshire
and Peterborough Independent Economic Review, 2018).
with a number of potential
solutions, among which
better regional coordination is
key.

Economic Strategy for the East of England
20 Cambridge Econometrics
large disparities between urban and rural areas, and to a lesser degree,
between some of the different urban centres as well. Supporting further and
in-work education provision across the region could be helpful in this regard,
as well as providing incentives for business creation in disadvantaged areas
and collaboration of the commercial, research and public sectors across the
region.
Even though the East of England is at the forefront of technological progress34,
not all firms in the region have taken advantage of this. A programme
designed to encourage and facilitate the adoption of new technology and
procedures across all sectors would see better use made of the region’s
considerable knowledge assets.
Finally, in order to effectively address the problems holding back the region’s
potential, better coordination of the regional authorities is key. Unlike the
‘Powerhouse’ in the North and the ‘Engine’ in the Midlands, the East of
England does not currently have a unified strategy representing the region as
a whole. Nevertheless, it is evident that the areas making up the East of
England face several issues that are of a similar nature or are, in a way,
complementary. Hence, it is important that the local authorities coordinate and
collaborate in planning for the future development of the East of England, so
as to avoid contradictory policies, spot and solve problems faster and more
efficiently, and fully unlock the region’s potential.
34 UK Innovation Survey data for 2014-16 show that the East of England is the 2nd most innovative English
region (narrowly behind the South East), with more than half of the businesses in the survey being
innovation active (Department for Business, Energy and Industrial Strategy, 2018). Business R&D
expenditure paints a similar picture: as of 2017, the East of England is 2nd with 19.7% of total UK business
R&D spend, with the South East being 1st with 20.5% Invalid source specified..

Economic Strategy for the East of England
21 Cambridge Econometrics
1 Introduction
1.1 Background and context
IFM Investors (IFM) are a global institutional investment manager with assets
based across Australia, North America, and Europe. Within the UK in
particular, IFM own a range of infrastructure assets, including the M6 toll,
Manchester Airports Group, and Arqiva Limited (a leading UK communications
infrastructure company). Focussing further on the East of England, IFM own
Anglian Water and, as part of the Manchester Airports Group, London
Stansted Airport.
As an investor with strategic holdings located in the East of England, IFM are
keen to strengthen the performance of their long-term asset holdings.
However, there is a feeling that, unlike the Northern regions with their
‘Powerhouse’ project or the Midlands region with their ‘Engine’, the East of
England lacks a sufficiently coherent and ambitious economic strategy
required to both maximise its economic potential and provide security for key
asset-holders.
There is, consequently, a need for an economic positioning document which
sets out the case for how a joined-up East of England could be more
prosperous and successful, and how improved transport connectivity could be
a part of this. This evidence can then be used as a backdrop for further
discussions with regional and national political entities.
1.2 Objectives
This project investigates the prospect of achieving a more coherent strategic
outlook for the East of England based on two key objectives:
(i) Identifying the areas of common cause, synergy, and strategic
opportunity that all areas within the East of England Region can
agree on.
(ii) Sense checking the combined local economic projections and
quantifying the “size of the prize” through the estimation of “high”
and “low” scenarios based on what is feasible and realistic.
Firstly, a synthesis of documents relating to regional economic strategy for the
East of England is provided, based on the areas of common ground in the
outputs from key local enterprise partnerships (LEPs) and Combined
Authorities (CAs) in the region (New Anglia LEP, Cambridgeshire and
Peterborough CA, Hertfordshire LEP, and parts of South East LEP and South
East Midlands LEP). A wider literature of national and regional growth
strategies, building on a previous study done by Volterra,35 is also undertaken.
Secondly, forward-looking scenarios are developed. This includes a baseline
“business as usual” view which assumes that no major structural or strategic
changes take place in the region, and also a “transformational” scenario which
assumes the opposite. This will be carried out using the same methodology as
was developed to enact the Northern Powerhouse Economic Review, the
Economic Connectivity Review of the South East, and the Economic Analysis
35 Volterra Partners (2017). Growth in the East of England and the role of Stansted: An Economic Review
Project objectives
Synthesis of
strategy,
strengths and
capabilities
Scenario
analysis

Economic Strategy for the East of England
22 Cambridge Econometrics
of the Cambridge-Oxford Corridor. The inputs for this analysis are the
comparison of the latest outputs from the East of England Forecasting Model
(which CE maintains), with the stated sectoral growth ambitions of the different
local and regional stakeholders.
1.3 Remaining sections of the report
The remaining sections of the report are set out as follows. Chapter 2 looks at
the recent economic history, governance structure and infrastructure of the
East of England. Chapter 3 identifies the combined ambitions of the region for
the future. Chapter 4 considers some of the challenges and opportunities for
the UK over the next decades and identifies the East of England’s prime
position in being able to tackle these, based on the region’s assets and
strengths. Finally, Chapter 5 outlines the challenges the region faces, lists the
main interventions that the local authorities have planned for the future and
identifies some broad potential solutions.

Economic Strategy for the East of England
23 Cambridge Econometrics
2 The Economy of the East of England
2.1 Introduction
Chapter 2 looks at the recent economic history of the East of England,
comparing it primarily to other regions in the south of England. Furthermore, it
describes the region’s governance framework and main infrastructure.
2.2 Economic history
As part of the wider South East economy, the region has benefited from its
proximity to Greater London, its high quality of life and its array of knowledge
assets. Despite not containing any of the top 20 largest urban areas in the UK,
the East of England is the 4th most prosperous region in England, with a Gross
Value Added (GVA) 36 of over £150bn (2017), 9.8% of England’s total GVA.
Trends in regional GVA over the past four decades are illustrated in Figure
2.2.1. The East of England GVA rose by 146%, the fifth highest rate among
regions in England and above the average rates for both the UK (133%) and
England (136%).
36 According to the ONS: “Gross value added (GVA) is a measure of the increase in the value of the
economy due to the production of goods and services.” The OECD Glossary of Statistical Terms indicates
that GVA “is a measure of the contribution to Gross Domestic Product (GDP) made by an individual
producer, industry or sector”. See here for all relevant ONS datasets and publications.
Economic trends
over the past 40 years
Figure 2.2.1: GVA in English regions excluding London, 1971-2016

Economic Strategy for the East of England
24 Cambridge Econometrics
Employment has also seen significant growth in 1971-2016, expanding from
1.84m to 3.1m – a 68.8% increase, behind only the South West (71.6%
employment growth) and the South East (70.2% employment growth) among
regions in England over the same time period.
Comparable regions which have also benefited from their proximity to London
are the South East and the South West. As of 2017 the East of England
accounted for 10.5% of total employment in England, which is slightly more
than the share for the South West region but substantially below shares for
London and the South East (Table 2.2.1).
2017 GVA data, also in Table 2.2.1, broadly reflect the employment pattern.
However, both London and the South East outperform the East of England in
that their GVA shares are higher than their corresponding employment shares.
This is further reflected in the productivity data where the East of England lags
below London, the South East and England overall, but performs better than
the South West.
Table 2.2.1 Economic indicator in 2017 (relative to England)
East of
England
London South
East
South West England
GVA, % 9.8 27.7 17.1 8.4 …
Employment, % 10.5 19.5 16.7 9.9 …
Productivity,
£2016m/000s
48.0 73.3 52.8 43.7 51.7
The East of England has experienced demographic and economic changes
over the past 20 years. Out of the four regions in the wider South Eastern
England, the East of England’s population increased by over 16% between
1998 and 2017, the second largest population increase in relative terms after
London which increased by just under a quarter over the same period (see
Figure 2.2.2). Population in the South East increased by slightly less at 15%
while the South West saw its population increase by 14.5% during the same
time.
Comparison with wider South East
area

Economic Strategy for the East of England
25 Cambridge Econometrics
Turning to the working age population share37 in Figure 2.2.3, all region shares
increased until 2007, after which shares fell across the board with London
being the exception. London is unique in that not only did it take until 2011 for
its working age population share to start falling, but also has consistently
maintained a noticeably higher share than other regions.
The post-2007 fall in the working age population share is consistent with the
aging population observed across much of the Western world. For example, in
England the growth rate of the working age population was higher than the
total population growth rate until 2007 but this reversed from 2008 onwards.
37 This is the percentage of total population that is between the ages of 16 and 64.
Figure 2.2.3 Working age population shares across Greater South East
Figure 2.2.2 Population across Greater South East England

Economic Strategy for the East of England
26 Cambridge Econometrics
Notably, the East of England’s employment rate – the ratio of the number of
employed to the working age population, aged 16 to 64 years – has
consistently remained below its comparator regions (Figure 2.2.4) and
averaged 78.7%. This low rate is likely due to the high rate of out-commuting
of workers who reside in the East of England but work outside this region. A
considerable part of the region lies within London’s commuter belt such that
many people reside in the region but work in London.
Fluctuations in the region’s employment rate over the last 20 years are broadly
in line with the pattern in other regions and in England overall, with the pre-
2008 stability giving way to a substantial fall of about five percentage points
during the Great Recession before an upward pick up in the employment rate
after 2011.
Figure 2.2.5 below plots how productivity in the main regions of interest has
evolved over the last two decades, relative to the productivity in England with
London excluded. We see that in the East of England relative productivity fell
over 1998-2012 and although it has been trending upwards since 2012, that
is, performing better than the reference geography, it remains below its 2005
peak.
The South West region performs the worst of all the regions, with its gap with
England less London having continued to widen since the early 2000s. In
contrast, London’s productivity remained above, and improved in relative
terms over the last two decades. The South East region placed second behind
London in terms of productivity performance and its performance relative to
England has changed little since the early 2000s.
Figure 2.2.4 Employment rate across Greater South East England

Economic Strategy for the East of England
27 Cambridge Econometrics
2.3 Governance
The East of England is one of nine official English regions. It was created in
1994 out of the amalgamation of the traditionally rural area of East Anglia
(comprising the ceremonial counties of Cambridgeshire, Norfolk and Suffolk)
and three neighbouring counties to the south and west (Bedfordshire,
Hertfordshire, and Essex) that by that time already formed part of the London
commuter belt. The region comprises 47 local authority districts (LADs), each
controlled by a local council.
Since 2011, the East of England has been represented by four Local
Enterprise Partnerships (LEPs), with a mandate to determine local economic
priorities and lead economic growth and job creation within the local area,
along with a Mayoral Combined Authority (CA) covering Cambridgeshire and
Peterborough since 2017. These include the New Anglia LEP; the
Cambridgeshire and Peterborough CA; the Hertfordshire LEP; the part of the
South East LEP covering Essex; and the part of the South East Midlands LEP
covering Bedfordshire (Figure 2.3.1).
Table 2.3.1 presents some baseline facts about the areas constituting the East
of England.
Figure 2.2.5 Productivity across the Greater South East (relative to England excluding London)

Economic Strategy for the East of England
28 Cambridge Econometrics
Figure 2.3.1 Map of combined authorities, local enterprise partnerships and local authority districts within the East of England

Economic Strategy for the East of England
29 Cambridge Econometrics
Table 2.3.1: Facts and figures, East of England constituent areas
LEP/CA Population
(million)
Employment
(million)
GVA
(billion)
Main urban centres
New Anglia 1.65 0.78 35.9 Norwich, Ipswich
Cambridgeshire and
Peterborough
0.85 0.49 24.1 Cambridge, Peterborough
Hertfordshire 1.19 0.71 36.3 Watford, Hemel Hempstead, Stevenage
Greater Essex (part
of South East LEP)
1.82 0.84 39.2 Colchester, Chelmsford, Basildon,
Southend-on-Sea
Bedfordshire (part
of South East
Midlands LEP)
0.67 0.31 15.4 Bedford, Luton
Note: 2017 data. GVA in £2016 Chained Volume Measures.
Whilst significant progress has been made in developing a coordinated
transport strategy, including the launch of Transport East in 2018, the East of
England does not currently possess a single coherent and ambitious
economic strategy at the regional level. A widely agreed and accepted
strategy document at this wider spatial level would help the region to maximise
its economic potential and provide security for key asset-holders, in the
manner that the Northern Regions and the Midlands have leveraged the
concepts of the ‘Northern Powerhouse’ and the ‘Midlands Engine’ respectively
in order to present a single coherent voice when representing the region to
central government, the wider public and international partners.
These objectives are tackled through the synthesis of existing documents into
a coherent overarching economic strategy and outlook for the East of
England. This is based closely on the areas of common ground in the
Strategic Economic Plans (SEPs) and emerging Local Industrial Strategies
(LIS) of the key LEPs and the CA in the region, as well as other relevant policy
documents. As well as reviewing all recent literature produced directly by
LEPs and the themselves, we also review a wider literature of national and
regional growth strategies, and build on the previous study done by Volterra,
to provide a comprehensive overview as to the identified constraints and
opportunities within the region.
2.4 Infrastructure
The term infrastructure embraces assets, capabilities and functions which
underpin a functioning economy. These include systems for the provision of
transportation, digital services, energy, water, waste removal as well as wider
built and natural assets.
Transport and digital connectivity can deliver an impact on productivity through
a number of mechanisms, for example, reducing traffic congestion in a city
and improving its transport links to other areas can facilitate trade and the
commuting workforce with a potential outcome being productivity gains.
Faster and reliable broadband connectivity speeds would allow remote
working and tele-conferencing with the resulting lower costs to firms having a
boost to productivity. More online-based businesses are also likely to be
started by entrepreneurs.
No single
coherent regional
strategy
Identifying areas
of strategic
alignment

Economic Strategy for the East of England
30 Cambridge Econometrics
The New Anglia LEP area, composed of the counties of Norfolk and Suffolk,
has an advantageous geographical position and diverse transport
infrastructure which contributes to its local economy and to the UK more
broadly.
The area is home to major seaports on the EU-Asia route which facilitate trade
between the UK and the rest of the world. The Port of Felixstowe in Suffolk
stands out, as it is the sixth largest UK port in freight traffic38 and handles over
40% of national container traffic, making it the UK’s busiest container port.
Furthermore, Ipswich Port is the UK’s largest exporter of grain, while King’s
Lynn is a regional centre for agricultural products. The ports at Great
Yarmouth and Lowestoft also play a major role in facilitating the New Anglian
region’s thriving offshore energy sector.
Its air connectivity to other UK cities and international destinations such as the
Netherlands is provided by Norwich International Airport, as well as the nearby
Stansted Airport which, although outside New Anglia, can be accessed
through the rail system and the network of roads, with the major ones being
the A11, M11, A11 and the M25. In addition to these roads, other road
transport infrastructure connecting New Anglia’s major settlements and
surrounding areas includes major roads such as the A140, A14, A10 and the
A47. According to the Integrated Transport Strategy for Norfolk and Suffolk39,
there are congestion issues along the A47, A11 and A14, with ongoing
campaigns to fully dual the A47 (‘Just dual it’) and to significantly improve the
A14 (‘No More A14 Delays in Suffolk’).
The area is also served by a network of a railway routes which facilitate
commuting between major settlements in the area as well as to major cities,
with London being about sixty minutes from Ipswich and ninety from Norwich.
The main rail routes include the Great Eastern Main Line (GEML), the West
Anglia Main Line (WAML), and the Felixstowe to Peterborough route which
connects into the East Coast Main Line.
The Cambridgeshire and Peterborough CA extends across the six local
authorities in Cambridgeshire and Peterborough which include Cambridge City
Council, East Cambridgeshire District Council, Fenland District Council,
Huntingdonshire District Council, Peterborough City Council and South
Cambridgeshire District Council.
The area is served by a network of roads that link its major centres and to
other major roads to the rest of the UK. The M11 and A1 are part of the major
road network linking the area to the north and south of the country while the
A47 (east-west) and the A10 (north-south) form part of a more locally
focussed network connecting the economies of the area’s major towns and
cities. The A14 provides strategic links to the east coast ports and the
Midlands. Traffic congestion and limited capacity along the road network pose
constraints to business and employment growth in the CA.
The main settlements are also linked by a network of railway lines which also
connect the area’s transport infrastructure to the rest of the country. The main
rail lines are the East Coast Main Line (ECML), connecting with London and
the north, and the West Anglia Main Line (WAML), connecting with London
38 Department for Transport, Port and domestic waterborne freight statistics 2017 (latest available).
39 https://newanglia.co.uk/wp-content/uploads/2018/07/ITS-FINAL-280618.pdf
New Anglia LEP
Cambridgeshire and
Peterborough CA

Economic Strategy for the East of England
31 Cambridge Econometrics
and Stansted Airport. However, a major gap in the network is east-west
connectivity, with no direct link to important locations to the west, such as
Oxford, Milton Keynes, Bedford, Luton and Luton Airport. Furthermore, links
and frequency of trains to the more rural parts of the area are more limited.
The Cambridge International Airport provides some degree of air connectivity,
but the more internationally linked London Stansted Airport, located 30 miles
to the south of the City of Cambridge, is reachable in about thirty minutes by
train or road. Nevertheless, even Stansted Airport provides limited access to
direct long-haul flights, thus restricting access to important business
destinations and markets.40
Hertfordshire LEP covers the local authorities of Broxbourne, Dacorum, East
Hertfordshire, Hertsmere, North Hertfordshire, St Albans, Stevenage, Three
Rivers, Watford and Welwyn Hatfield. The Hertfordshire LEP area is in the
north of London’s commuter belt and within the UK’s Golden Triangle of
London, Cambridge and Oxford, and so benefits from its proximity to London
and its geographical location within the UK’s Golden Triangle, an area with
globally competitive businesses in sectors crucial to the UK economy.
Hertfordshire’s main transport infrastructure is in the form of major roads such
as the A1(M), the M1 and the M25 as well as train lines linking its main
settlements to one another and to the surrounding areas and the rest of the
country. The main motorways are the M1, A1(M), M11 (traversing the region
from north to south) and M25 (orbital to the south of the region), while the
main rail routes are the West Coast Main Line and the East Coast Main Line.
According to the Hertfordshire Infrastructure and Funding Prospectus41, both
the rail and the road network generally have good connections along the
north-south axis, but the east-west links infrastructure is weaker. High levels of
congestion along the main motorways and overcrowding in the main rail
routes are areas of concern.42
Air travel is provided for by both Luton and Stansted airports, located just
outside Hertfordshire to the West and East, respectively. Heathrow Airport is
also accessible via the M25.
The Greater Essex area of the South East LEP is located between the north
east of London, the west of Hertfordshire, the south of New Anglia and the
English Channel to the east. It includes the local authorities of Essex,
Thurrock and Southend.
Greater Essex has a high degree of air connectivity, with Stansted Airport as
well as Southend Airport located within the area, linking it and many
surrounding areas to multiple international destinations. Stansted Airport is
one of the largest airports in the UK, being fourth in total number of
40 Sources:
• https://cambridgeshirepeterborough-ca.gov.uk/assets/Uploads/GCGP-Strategic-Economic-Plan-WEB-
1-2014.pdf
• https://www.cambridgeshirepeterborough-ca.gov.uk/assets/Business-Board/Meetings/Business-Board-
190325.pdf (pp. 18-87)
• https://cambridgeshirepeterborough-ca.gov.uk/assets/Combined-Authority/NSSF-Phase-1-final.pdf
41 https://www.hertfordshirelep.com/media/7096/hertfordshire-infrastructure-funding-prospectus-2018-
2031.pdf
42 https://www.hertfordshirelep.com/media/6326/grand-challenges-for-hertfordshire-2018.pdf
Hertfordshire LEP
South East LEP
(Greater Essex)

Economic Strategy for the East of England
32 Cambridge Econometrics
passengers and third in freight tonnage. As for Southend Airport, while it is
only 20th in terms of passengers among UK airports, it is sixth in terms of
freight.
Greater Essex is also home to major sea port facilities, which handle a
substantial amount of the UK’s sea cargo. The Port of Harwich is responsible
for 1% of UK freight traffic and is an important centre for offshore energy,
supporting a large number of wind turbines. Furthermore, the Port of Tilbury
and the London Gateway form part of the wider Port of London (second
largest in the UK), with the former being the third largest container terminal in
the country, while the latter includes the largest logistics park in Europe.43
The M11 motorway facilitates a north-south traffic flow through the western
part of Essex and together with other major roads such as the A12, A130,
A414 and A120, they link this area’s major settlements to the rest of the
country. The train system provides additional connectivity to London (Great
Eastern Main Line, West Anglia Main Line) while Crossrail provides links to
the West.
The Bedfordshire area of the South East Midlands LEP is made up of the
three local authorities of Bedford, Central Bedfordshire and Luton. The South
East Midlands LEP occupies an important strategic position due to its
proximity to major economic centres, namely London, Oxford, Birmingham
and Cambridge. Bedfordshire is located in the south-eastern part of the LEP,
being closer to Cambridge and London.
The M1 and A6 major roads, together with the West Coast Main Line, the East
Coast Main Line, and the Midlands Main Line, all of which pass through
Bedfordshire, form part of the road and rail transport network serving the area.
The road and rail network provide strong north-south links, but east-west links
are limited, resulting in missed opportunities for the area.44
The area’s air connectivity to domestic and international destinations is
provided for by Luton Airport (5th largest in passenger traffic among UK
airports)45, while Stansted is also about one hour away by road.
Only Luton among the three local authorities in Bedfordshire has above
average coverage of superfast (>24Mbps) broadband. However, all three
authorities are significantly above the national average in ultrafast (>100Mbps)
broadband coverage.46
43 Freight statistics from the Department for Transport, Port and domestic waterborne freight statistics 2017
(latest available). Information from the 2017 Essex Economic Report.
44 https://www.semlep.com/modules/downloads/download.php?file_name=742
45 Civil Aviation Authority data.
46 https://www.semlep.com/modules/downloads/download.php?file_name=742
South East
Midlands LEP
(Bedfordshire)

Economic Strategy for the East of England
33 Cambridge Econometrics
East of England as a whole
Overall, the East of England has a functional road network composed of
major and minor roads connecting its main cities and towns, that is largely
in line with its predominantly rural nature. Several major rail routes also
traverse the region, providing additional connectivity. However, both the
road and rail network are primarily developed along the north-south axis,
with east-west links being weak across almost all areas comprising the
region. Furthermore, congestion along the main transport routes is a
common issue across LEP areas. Rail connectivity is in need of
improvement, particularly away from the East Coast and West Anglia
mainlines, but also along the latter, as documented by the West Anglia
Taskforce.
There are multiple airports in Stansted, Luton, Norwich and Southend
which link the region to other parts of the UK and to international
destinations. Of these. Further international linkages are achieved through
the major ports located in Norfolk and Suffolk (primarily Felixstowe) and
Greater Essex (Harwich, Tilbury, London Gateway).
Figure 2.4.1 and Table 2.4.1 summarise the main infrastructure across the
region.
Economic Strategy for the East of England
34 Cambridge Econometrics
Figure 2.4.1: Main infrastructure in the East of England
Figure 2.4.1(b): Location of major ports in the east of England – two of the most significant ports are at Harwich in Essex and Felixstowe in Suffolk
Figure 2.4.1(a): Main roads, rail lines, airports and sea ports in the East of England

Economic Strategy for the East of England
35 Cambridge Econometrics
Table 2.4.1 Summary of major infrastructure in the East of England
Infrastructure New Anglia LEP Cambridge and
Peterborough CA
Hertfordshire LEP South East LEP
(Essex)
South East Midlands
LEP (Bedfordshire)
Airports - Norwich Airport - Cambridge Airport - NA - Stansted Airport
- Southend Airport
- Luton Airport
Sea ports - Felixstowe
- Ipswich
- Lowestoft
- Great Yarmouth
- King’s Lynn
- NA - NA - Port of Tilbury
- London Gateway Port
- Harwich Port
- NA
Major roads and rail - A11, A12, A14, A47, A10, A1307 - A14, M11, A1(M), A47,
A10
- M1, M11, M25, A1(M) - M11, A12, A127, A13,
A120, M25
- M40, M1, A1(M), A14,
Oxford-Cambridge
Expressway
Railway lines - Great Eastern Main Line
- Cross-country corridor
- Great Eastern Main Line
- East Coast Main Line
- West Anglia Main Line
- Cross-country corridor
- Midland Main Line
- East Coast Main Line
- West Anglia Main Line
- West Anglia Main Line
- Great Eastern Main Line
- Essex Thameside line
- East-West Rail
- Midland Main Line
- East Coast Main Line
- West Coast Main Line
Energy assets - Sizewell power station
- Bacton Gas Terminal
- Renewable energy at Great
Yarmouth and Lowestoft
- Offshore wind turbine farms 47
- NA
- Rye House power station
(gas)
- Coryton power plant (gas) - Little Barford power station
(gas)
47 New Anglia LEP, 2017a (p. 12 and p. 27)

Economic Strategy for the East of England
36 Cambridge Econometrics
3 Ambitions for Growth
3.1 Introduction
This chapter looks at the economic forecasts for the East of England and its
LEP/CA areas and identifies to what extent the ambitions set out in their
Strategic Economic Plans (SEPs) can be achieved. The headline indicators
that we will be looking at are:
• Population
• Employment
• Real GVA/GDP
Then, the chapter looks at targeted growth areas of the local authorities and
presents a spatial vision for the East of England.
3.2 Forecasting methodology and data sources
The historical timeseries of GVA and employment used in this chapter are
based on Cambridge Econometrics’ local authority district (LAD) database
(1981-2017), whilst the population data is taken from ONS’s mid-year
population estimates (MYE). Employment is defined as workplace-based
jobs, which includes full-time, part-time and self-employed. The employee
data are based on BRES (and ABI, AES and CoE) while the self-employment
data originate from the APS48. GVA is expressed in constant (£2016) price to
allow for inflation adjustment and it comes from the ONS. LAD level data are
aggregated to form the projections about the different LEPs and CA, as well
as the region as a whole.
Regarding the projections, we will be looking at the forecasts from the ONS
or OBR and compare these to the East of England Forecasting Model
(EEFM)49 and CE’s Local Economy Forecasting Model (LEFM). The
following sections discuss briefly how each of the indicators are forecasted
by CE using different models.
The EEFM (2017) is the latest model version that uses local area data up to
2015, and projects forward to 2045, reflecting the available global, national
and regional forecasts. It is important to note that the EEFM forecasts are
based on observed past trends only and are unconstrained.
The population data is taken from ONS’s MYE to 2015, and the ONS 2014-
based population projections are used thereafter. The total population is
forecast as last year’s population plus natural increase and net migration
(domestic and international).
48 BRES = Business Register and Employment Survey, ABI = Annual Business Inquiry, AES = Annual
Employment Survey, CoE = Census of Employment, APS = Annual Population Survey. The chronology of
these databases is as follows: BRES – 2009 onwards, APS – 2004 onwards, ABI – 1998-2008, AES –
1991-1998, CoE – 1981-1991
49 The EEFM was developed by Oxford Economics and is currently maintained and updated by
Cambridge econometrics.
The EEFM
(2017)

Economic Strategy for the East of England
37 Cambridge Econometrics
The workplace employment (jobs) is forecasted separately in every area by
industries based on the trend of concentration of employment (location
quotient – LQ) relative to the regional average. The model projects the LQs
based on how they have changed over time and estimates employment
based on these projections and other variables in the model.
Real GVA from EEFM (2017) is based on 2013 prices and is projected from
2015 onwards using forecast regional GVA per job (by sectors) from CE’s
UK Regional Model and EEFM’s forecast total workplace employment (by
sectors) for each local authority. The projections are then adjusted subject to
wage differentials and published NUTS 3 level GVA estimate for the relevant
base year (2013).
The baseline LEFM employment projections are based on historical growth
in the local area relative to the wider region or the UK (depending on which
area it has the strongest relationship with), on an industry-by-industry basis.
It is assumed that those relationships continue into the future (up to 2050)
and that the economic growth in the local area is not constrained by supply-
side factors, such as population and the supply of labour. All the historical
data (1981-2017) are consistent with the regional and UK level data from the
ONS.
Projections for GVA at the LAD level are derived from sectoral productivity
data from ONS Regional Accounts at the NUTS 2 level. The productivity of
each local authority within a region is assumed to be equal to regional
productivity and follow the same growth trends. Hence, regional productivity
is projected forward and the LAD level GVA projections are obtained by
applying projected productivity to the projected employment from LEFM.
Finally, population data are projected by applying the growth rates of 2016-
based Subnational Population Projections from the ONS to the historical data
from the latest MYE.
3.3 Results and comparisons
This section presents forecasts of population, employment and GVA growth
for the LEP areas and CA within the East of England and compares them
with the growth targets set by the regional and local authorities. We then
combine these targets to form an overall ambition for the East of England
and assess its feasibility.
Population projections
Figure 3.3.1 shows the population projections in New Anglia LEP from 2017
to 2036. The EEFM forecasts a higher population of over 1.85 million by
2036, whilst both the ONS and the LEFM forecast population to grow at
lower rates which deliver approximately a population of 1.8 million by the end
of the period.
The New Anglia LEP expects 140,000 new homes to be built by 2036, which
is equivalent to a population increase of 322,000 based on the average
household size in the UK, which is 2.3 people per household (Census 2011).
This gives an estimate of almost 2 million people in 2036. This target is
above all the projections, with a gap of between 100,000 to 200,000.
The LEFM
Measuring
growth ambitions
of the LEPs and
CA in the East of
England
New Anglia LEP

Economic Strategy for the East of England
38 Cambridge Econometrics
Figure 3.3.2 shows the population projections in Hertfordshire LEP by 2036.
The housing target for Hertfordshire LEP is taken from ‘Hertfordshire fit for
the future’, where over 100,000 homes are planned by 2031 – equivalent to a
population increase of 230,000, leading to a total of 1.4 million. Based on this
estimate, we extrapolate the target to 2036 assuming that the trend will
continue for another five years, which means a population increase of 35,000
(marked by the orange node). Both targets are well above the three sets of
projections indicating that the strategic plan of the LEP might not be feasible.
Hertfordshire
LEP
Figure 3.3.1 Population projections in New Anglia LEP
Figure 3.3.2 Population projections in Hertfordshire LEP

Economic Strategy for the East of England
39 Cambridge Econometrics
Moving to Cambridgeshire and Peterborough CA, which hopes to deliver
100,000 homes over the next 20 years. This is approximately a population
increase of 230,000 from 2017, as demonstrated in Figure 3.3.3. The
projected population in all cases is below the target and the gaps are much
higher when compared to LEFM and ONS projections (over 150,000).
Figure 3.3.4 shows the population projections for Bedfordshire. Again, the
EEFM projects a faster population growth compared to the ONS and LEFM.
It forecasts Bedfordshire population will reach 800,000 in 2036, which is only
20,000 less than the planned population (820,000).
Cambridgeshire
and
Peterborough CA
Bedfordshire
Figure 3.3.4 Population projections in Bedfordshire
Figure 3.3.3 Population projections in Cambridgeshire and Peterborough CA

Economic Strategy for the East of England
40 Cambridge Econometrics
This gap is doubled for the other two sets of projections implying that the
local plan is more likely to be met if the future population of Bedfordshire
follows closely the underlying assumptions of EEFM population projection
(see Methodology section).
Figure 3.3.5 illustrates how the population of Essex is expected to evolve
over time. Unlike the other areas, the three sets of projections for Essex are
more consistent. However, the gap between the projections and the local
area ambition is quite substantial, at around an average of 150,000. This
target is estimated based on an objectively assessed housing need for about
179,000 new homes by 2036, which requires a completion rate of 9,000
dwellings per annum. Such target is assessed (by AECOM50) to be much
higher than what Greater Essex has been delivering in the past.
After considering all the housing needs for the LEPs and CA, we constructed
a combined target of delivering over half a million new homes by 2036 for
East of England as a whole. This target is calculated by aggregating all the
ambitions that have been reported above which is equivalent to a population
of over 7 million by the end of the projection period. Figure 3.3.6 shows that
this target lies above all the projections meaning that the projected
population growth in East of England is not sufficient to accommodate
additional housing growth. The region is projected to grow at 0.7% by the
EEFM and at around 0.6% every year from 2017 by the ONS and the LEFM
whilst the target would require an annual growth of over 1%.
50 AECOM has been commission by all of the local authorities in Essex to prepare a Growth and
Infrastructure Framework (GIF) for the area (2016-2036).
Greater Essex
East of England
Figure 3.3.5 Population projections in Essex

Economic Strategy for the East of England
41 Cambridge Econometrics
Employment projections
This section looks at the projected employment in the LEP areas and CA by
2036. Of the projection models, we will only be comparing the forecasts from
LEFM and EEFM (2017) because the ONS employment projections are not
available at local levels.
Figure 3.3.7 shows the projections of employment in New Anglia LEP over
the next 20 years. The historical time series is based on the LEFM historical
database which is consistent with the ONS at regional and UK level. Both
projections are smooth and trending upwards. The EEFM forecasts
employment to grow at a slightly higher rate based on the projections of the
relative employment concentration (LQ) of the local areas in New Anglia to
the East of England average. These projections are below the LEP’s
expectation of delivering 88,000 net new jobs by 2036, yet not far from
achieving it.
New Anglia LEP
Figure 3.3.6 Population projections in the East of England

Economic Strategy for the East of England
42 Cambridge Econometrics
Figure 3.3.8 compares the employment projections in Hertfordshire LEP to
two sets of ambitions that are estimated for 2031 and 2036. The blue marker
determines the official employment target of creating over 100,000 new jobs
by 2031. We then assume that the annual growth, in terms of absolute
number of jobs, remain unchanged for another five years from 2031 and
estimate an employment of almost 850,000 by the end of 2036, which is
shown by the orange marker. Both targets are above the projections
implying that the ambition set by the LEP could be difficult to achieve.
Hertfordshire
LEP
Figure 3.3.8 Employment projections in Hertfordshire LEP
Figure 3.3.7 Employment projections in New Anglia LEP

Economic Strategy for the East of England
43 Cambridge Econometrics
Figure 3.3.9 compares the projections to three different sets of targets from
the CPIER51 forecasts for the Cambridgeshire and Peterborough CA. The
blue node is the target that CPIER expects to deliver under their central
projection which is based on the shorter term (ST) rate returning to longer
term (LT) rate assumption. In other words, it assumes that the employment
first follows the growth rates closer to higher ONS employment growth before
returning to longer term ONS growth rates. The orange and green nodes are
the targets based on a longer-term rate (1981-2016 employment growth
trend) and a shorter-term rate (2010-2015 employment growth trend)
respectively. Of all the projected targets, none is feasible under LEFM and
EEFM projections.
However, these are not what CPIER expect the LEP to be by 2036, they are
what can be expected to happen under different employment growth and
development scenarios.
51 CPIER: Cambridgeshire & Peterborough Independent Economic review. This is the product of
Cambridgeshire and Peterborough Independent Commission which was established by Cambridgeshire
and Peterborough Combined Authority (CPCA) in 2017.
Cambridgeshire
and
Peterborough CA
Figure 3.3.9 Employment projections in Cambridgeshire and Peterborough CA

Economic Strategy for the East of England
44 Cambridge Econometrics
Figure 3.3.10 illustrates the employment projections in Bedfordshire and how
they compare to expected future employment from The Local Plan of Central
Bedfordshire. The local council expects to provide an additional 24,000-
30,000 jobs by 2036, which has been averaged to 27,000 for the purpose of
our analysis. The final estimate has been marked on the graph and it lies in
between the two projections. This means that the target is feasible. However,
it is important to stress that this target has been set out for Central
Bedfordshire only, hence the number can be underestimated for
Bedfordshire as a whole.
Figure 3.3.11 shows that, in Essex, employment is projected to increase by
almost 77,000 over the next 20 years, whilst the employment projection from
‘Growth and Infrastructure Framework (GIF)’52 by AECOM estimates an
additional 79,000 new jobs by 2036. This target is not far from CE’s
projections; hence we can conclude that Essex is likely to deliver an
employment target of 925,000 by the end of the projection period.
52 Growth and Infrastructure Framework: 2016-2036, commissioned by all of the local authorities in Essex.
Bedfordshire
Greater Essex
Figure 3.3.10 Employment projections in Bedfordshire

Economic Strategy for the East of England
45 Cambridge Econometrics
Similar to the population projection analysis, we use the ‘combined’
employment targets from the LEP areas to form an ambition for the East of
England. We are expecting the East of England to deliver around 600,000
new jobs by 2036, which is equivalent to employment of almost 4 million in
2036. This ambition is above the two sets of projections, yet, the gap is not
very substantial (see Figure 3.3.12).
Both forecasts project East of England employment to reach around 3.4
million in 2036, at an annual growth rate of 1% over the projection period.
Historically, the employment has been growing at similar rates (1.01% per
annum from 1997-2017). Therefore, the models assume the past trend
continues in this region.
Alongside this, Figure 3.3.13 compares the projections from CE to the
employment projections from the Office for Budget Responsibility (OBR) at a
UK level. In order to produce sensible comparisons, all data are expressed in
terms of indices (2017 = 100). This allows us to compare the future
employment growth pattern in the East of England to the national
employment trend over the next 20 years. The projections show that
employment growth at both the UK and the East of England levels will stay at
similar levels before the former starts to grow at slower rate in 2029. The
EEFM projects higher employment for the entire period and it projects growth
at similar rates to the LEFM employment projection after 2026.
East of England
Figure 3.3.11 Employment projections in Essex

Economic Strategy for the East of England
46 Cambridge Econometrics
GVA projections
The real GVA data in LEFM and EEFM (2017), as explained in the
Methodology section, are based on different price years. The former uses
2016 prices which is consistent with the recent ONS publications, while the
latter uses 2013 prices. Therefore, to ensure sensible comparisons, the
EEFM projection is scaled to the LEFM using the scaling factor from the
latest historical year (2017) so that the projections have the same starting
point.
Figure 3.3.12 Employment projections in East of England
Figure 3.3.13 Employment projection for East of England (2017 = 100)

Economic Strategy for the East of England
47 Cambridge Econometrics
New Anglia LEP expects its GVA to grow at a rate of 2% per annum to 2036,
which is equivalent to just over £55bn GVA at the end of the projection
period. Figure 3.3.14 shows that the higher GVA projection scenario from
EEFM predicts approximately £5bn less GVA compared to the target, and
around £8bn less when compared to the LEFM projection.
Figure 3.3.15 shows larger gaps between the GVA projections and the
planned target for Hertfordshire LEP. The LEP gives a very optimistic plan of
doubling the size of its GVA by 2050, which is estimated to be £57.2bn GVA
in 2036 – this is around 20% to 30% higher than the two projections. This
reflects the need of the local government to providing more stimulus to the
local economy to accelerate its economic growth.
New Anglia LEP
Hertfordshire
LEP
Figure 3.3.14 GVA projections in New Anglia LEP

Economic Strategy for the East of England
48 Cambridge Econometrics
Figure 3.3.16 shows the projections of GVA in Cambridgeshire and
Peterborough CA. The EEFM forecasts a faster growth of GVA compared to
the LEFM but falls short of meeting the target set by the CPCA. The CA
committed to double the economy over 25 years, which requires an annual
growth rate of 2.8% and that is translated to just over £40bn GVA by 2036.
Historically, the local economy has grown at a rate of 2.5% (1998-2017),
hence the target can only be achieved if the area goes beyond what it did
before. The Cambridgeshire and Peterborough Independent Economic
Commission stated that the target is realistic and will be achieved partly by
attracting knowledge-intensive businesses.
Cambridgeshire
and
Peterborough CA
Figure 3.3.15 GVA projections in Hertfordshire LEP
Figure 3.3.16 GVA projections in Cambridgeshire and Peterborough CA
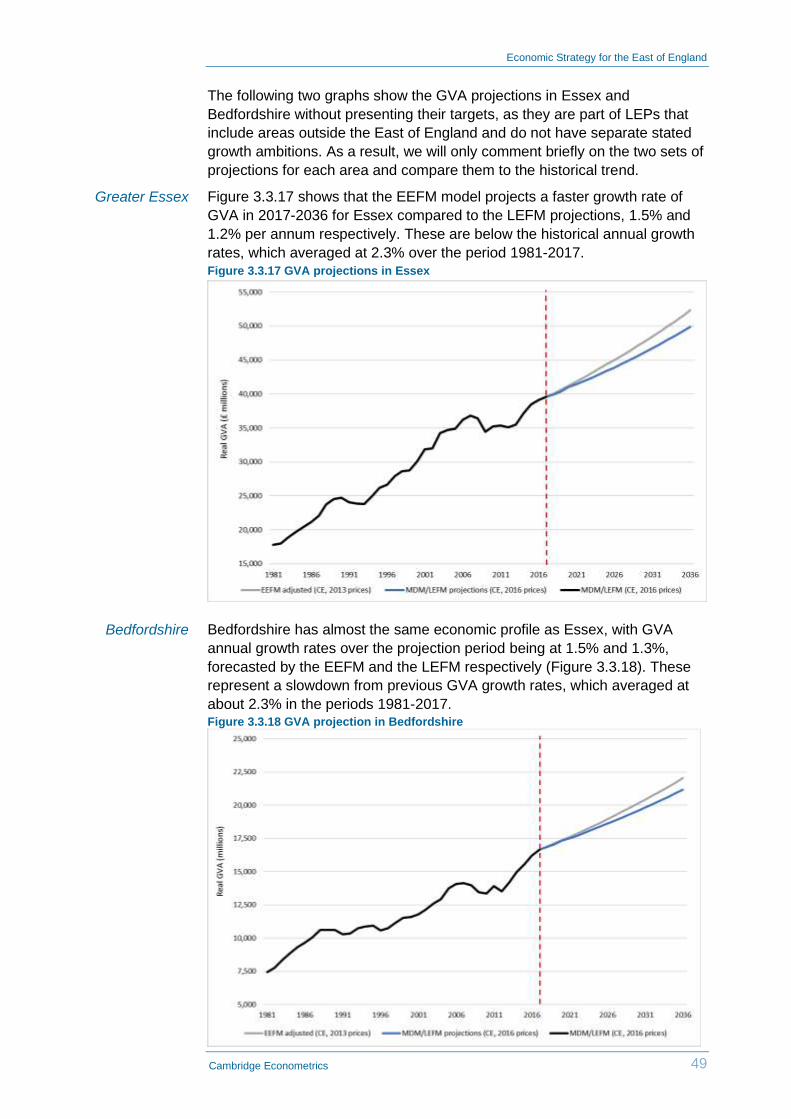
Economic Strategy for the East of England
49 Cambridge Econometrics
The following two graphs show the GVA projections in Essex and
Bedfordshire without presenting their targets, as they are part of LEPs that
include areas outside the East of England and do not have separate stated
growth ambitions. As a result, we will only comment briefly on the two sets of
projections for each area and compare them to the historical trend.
Figure 3.3.17 shows that the EEFM model projects a faster growth rate of
GVA in 2017-2036 for Essex compared to the LEFM projections, 1.5% and
1.2% per annum respectively. These are below the historical annual growth
rates, which averaged at 2.3% over the period 1981-2017.
Bedfordshire has almost the same economic profile as Essex, with GVA
annual growth rates over the projection period being at 1.5% and 1.3%,
forecasted by the EEFM and the LEFM respectively (Figure 3.3.18). These
represent a slowdown from previous GVA growth rates, which averaged at
about 2.3% in the periods 1981-2017.
Greater Essex
Bedfordshire
Figure 3.3.17 GVA projections in Essex
Figure 3.3.18 GVA projection in Bedfordshire

Economic Strategy for the East of England
50 Cambridge Econometrics
Since Bedfordshire and Essex do not have stated GVA targets in their own
right, we have used EEFM projections as estimates of their growth
ambitions. We have combined these forecasts with GVA targets for New
Anglia LEP, Hertfordshire LEP and Cambridgeshire and Peterborough CA in
order to obtain an overall growth ambition for the East of England. Given the
fact that the aims of the latter three authorities exceeded the model
projections, it is likely that this might be an underestimate of the true ambition
for the region.
Figure 3.3.19 shows that the combined ambition for the East of England is to
achieve a GVA figure of about £223.8bn by 2036, higher than the forecasts
of both the LEFM (£194bn) and the EEFM (£205bn). Compared to the GVA
projections of the 2017 Volterra report, the growth ambition sits between the
central and the high-growth scenario forecasts (£200bn and £240bn
respectively).
In order to better grasp the differences in overall growth, Figure 3.3.20
illustrates ambitions and forecasts for the East of England economy as an
index, with 2017 as the base year. This implies that the 2017 value is set to
100, and future or past values indicate the percentage difference with 2017
(e.g. a value of 110 in 2020 would imply a 10% growth since 2017).
Apart from the GVA growth figures implied by the LEFM and EEFM
projections and the combined ambitions, Figure 3.3.20 includes a projection
based on the Office for Budget Responsibility (OBR) forecasts. The OBR
publishes projections of the GDP growth rate for the UK up to 2067-68 in 10-
year intervals. Due to lack of official forecasts at the regional level, we have
used the OBR rates (under the baseline scenario) for the national economy
to estimate future growth for the East of England if it achieves the projected
national growth rate.53
Under the baseline OBR forecast, the GDP growth rate will fluctuate 1.2%
and 1.8% in 2018-20 and will remain constant at 1.6% in 2021-2017,
accelerating at 2.2% afterwards. This implies an average annual growth rate
of 1.8% and a cumulative growth rate of 41% in 2017-36. These are higher
than the projected growth from both the LEFM (1.2% average annual growth
rate; 25.5% cumulative) and EEFM (1.5% annual growth rate; 32.6%
cumulative) over the same time period.
Notably, the GVA targets set by the LEPs and CA in the East of England
indicate that their ambition is to grow faster than the country average (and
hence also than the model forecasts). The targeted GVA figure of £223.8 in
2036 is 45.1% higher than the 2017 value, implying that the regional
economy would have to achieve an average annual growth rate of about
1.98% if the target is to be met. Hence, the East of England as a whole
would have to perform better than the forecasted economic trends indicate in
order to achieve the combined growth ambition of the constituent LEPs and
CA.
53 Note that the OBR projections refer to GDP growth, which we use as a proxy for GVA.
East of England

Economic Strategy for the East of England
51 Cambridge Econometrics
Figure 3.3.19 GVA projections in the East of England
Figure 3.3.20 Projected GVA growth in the East of England over the next 20 years

Economic Strategy for the East of England
52 Cambridge Econometrics
3.4 The spatial dimension
As well as an overall plan for levels of growth, each LEP and CA has outlined
in broad terms a series of targeted growth areas within their boundaries,
whether this is in the form of a detailed spatial plan or a loose set of
development principles. We cover some of the dimensions of these
considerations below.
Most LEPs identify the need to concentrate growth in and around existing
urban settlements where possible. Not only does this provide for the
opportunity for greater levels of urbanisation benefits to accrue, but it also
reduces area’s reliance on motor vehicles and improves the potential for
environmental sustainability.
Younger people tend to prefer living in an urban setting, making it
significantly easier for businesses located in urban areas to attract them.
Urban and Rural Areas
Summary
The component LEPs and CA and other authorities within the East of
England do not individually lack for ambition. Authorities within the region
have identified several ambitious priorities for development over the next
few decades. While several of the targets and objectives of the different
local authorities overlap, there is no unifying overall ambition for the region,
as seen in the ‘Northern Powerhouse’ for the North of England and the
‘Engine’ for the Midlands.
Critically, all authorities aim to grow as centres of economic activity in their
own right, rather than as satellites of Greater London. There is also a
consensus across all local areas that boosting growth in knowledge-
intensive sectors is essential, but the needs of local populations across all
skills levels must be taken into account as well. Furthermore, it is noted
that this must be combined with measures to protect the valuable
environmental and rural assets that the region has in abundance.
Quantitative measures regarding the ambitions of the local development
bodies within the East of England region are provided in the strategic
documents of the Local Enterprise Partnerships and other local governing
bodies. These reveal that the growth targets for the next 20 years are to
surpass the forecasts of both the East of England Forecasting Model
(EEFM) and the Local Economy Forecasting Model (LEFM), as well as the
national growth rate predicted by the OBR.
Whilst the ambitions of the LEPs and CA do not seem overly unrealistic,
they do imply an acceleration of the regional economy relative to model
forecasts. Better regional coordination and a wider spatial and strategic
plan would be essential to overcoming the obstacles holding back the East
of England economy and achieving the combined growth target. Even
though incentives may exist to act in (relative) isolation and compete for
resources and funding, the areas constituting the East of England share
similar ambitions, face similar challenges and possess complementary
assets, making collaboration and unity a far more beneficial course of
action.

Economic Strategy for the East of England
53 Cambridge Econometrics
According to the Statistical Digest of Rural England (2019)54, the average
age of residents in rural areas is 44.6 years old, while in urban areas it is 39.
About 45% of those living in rural areas are aged below 45 years, while the
corresponding share in urban areas is almost 60%, with the latter having
significantly higher shares of the population in the 20-24, 25-29, 30-34 and
35-39 age groups.
Nevertheless, the ONS Statistical Bulletin on the mid-2018 population
estimates55 finds that most rural parts in England experience net inward
internal migration, while on the other hand a lot of urban centres face net
outward external migration, with people aged 20-30 years being the
exception. Rural areas have advantages as residential communities with
lower levels of crime, deprivation and anxiety compared to urban areas, as
well as higher levels of life expectancy, happiness and trust in their
neighbours.56
In England, employment in the Knowledge-Intensive Business Services
(KIBS) sector is concentrated mostly in urban centres, with the sector’s
employment share in urban areas being 17.4% compared to 11.6% in rural
areas. Furthermore, urban areas have higher employment shares across all
individual sectors that make up KIBS: finance (3.8% compared to 1.1%),
information and communication (4.6% compared to 2.7%) and professional,
scientific and technical services (9% compared to 7.8%).57 This is also
reflected in the skills distribution: 44.7% of those working in predominantly
urban areas have qualifications at NVQ4 or a higher level, while for those
working in predominantly rural areas the share is 35.4%.58
This is not to say that rural areas do not have a role to play as employment
sites. Their natural and geographical assets support specialisations in agri-
food and related activities (employment share in agriculture, forestry and
fishing of 7.5% compared to 0.2%), tourism (employment share in
accommodation and food service activities of 10% compared to 6.9%), as
well as large-scale manufacturing (11% compared to 7.5%).59
However, the future of rural areas is not solely limited to this: with the
increasing use of digital technology, some of the fastest growing sectors in
rural areas are professional services and IT, as knowledge workers choose
to work from home or from small cost-effective office space, and interact with
their clients remotely. For example, in the Greater Norwich outer hinterland60,
the information & communication and professional, scientific & technical
activities sectors were the first and third fastest-growing in the area over the
2009-17 period, with employment growth exceeding 30%.61
54https://assets.publishing.service.gov.uk/government/uploads/system/uploads/attachment_data/file/77510
9/01_Statistical_Digest_of_Rural_England_2019_January_edition.pdf
55https://www.ons.gov.uk/peoplepopulationandcommunity/populationandmigration/populationestimates/bul
letins/annualmidyearpopulationestimates/mid2018
56 See Statistical digest of rural England 2019 for the relevant data.
57 Ibid. 2016-17 data.
58 Ibid. Data for 2015.
59 Ibid. 2016-17 data.
60 Approximated to those areas of Norfolk outside a 10km radius of the city of Norwich.
61 Nomis data, Cambridge Econometrics calculations.

Economic Strategy for the East of England
54 Cambridge Econometrics
2011 Census data shows that the East of England ranks third among regions
in the UK in share of rural population (28.9%). The following maps by the
ONS (Figure 3.4.1) depict the rural characteristics of the region, as well as
the most significant urban conurbations:
Areas to the south and west of the East of England region unambiguously
form part of the London Commuter zone, and a recognition of this fact plays
an important role in the spatial strategy of impacted LEPs (SEMLEP, Herts
LEP and SELEP). Far from being seen as a challenge or a threat to local
industry, most LEPs recognise this to be an opportunity for collaboration and
complementarity with Greater London.
Many households with two or more working adults now make their location
decision based on the ability to work in different locations. A location from
which commuting to London is feasible does not necessarily imply a loss of
workers from the local economy; on the contrary, it may encourage
households to locate there, in a scenario where one adult commutes to
London whilst the other is available for work in the local economy.
Close proximity and travel times to London not only allow for ease of
commuting, but also of business collaboration or engagement in supply
chains. There are recognised agglomeration benefits experienced by firms
London Commuter Zone
Figure 3.4.1 ONS Rural-urban classification for England (left) and the East of England (right)
Economic Strategy for the East of England
55 Cambridge Econometrics
that are proximate enough to major cities to be able to effectively participate
in the urban economy from a distance.
Brunner (2013)62 gives the following definition of an economic corridor:
‘Economic corridors connect economic agents along a defined
geography. They provide connection between economic nodes or
hubs, usually centered on urban landscapes, in which a large amount
of economic resources and actors are concentrated. They link the
supply and demand sides of markets.’
Growth corridors utilise key infrastructure assets to connect markets, ideas
and people, thus supporting the development of economic clusters while also
improving the links between urban agglomerations (which are typically where
the clusters are located) and more rural areas. Such corridors can help
attract private investment and facilitate knowledge diffusion, communication,
trade and competitiveness by decreasing costs and delivery times.63
A unique characteristic of the East of England is the number, as well as the
importance, of the growth corridors intersecting the region, with the globally
significant tech-hub of Cambridge being a focal point for many of them. In
many ways, this corridor-based spatial strategy is currently considered to be
the best way of allowing the numerous advantages of the Cambridge
phenomenon to spill over into neighbouring regions to the mutual benefit of
both those regions and Cambridge-based firms and workers. These corridors
include:
• The London–Stansted–Cambridge corridor, which has been branded the
‘UK Innovation Corridor’64, as it connects two of the innovation-leading
and fastest-growing UK areas in London and Cambridge with a major
international airport in Stansted.65
• The Cambridge–Milton Keynes–Oxford Arc, which has been attracting
increasing attention from stakeholders in recent years, given the global
significance of the knowledge assets in the key centres of the corridor.66
This corridor is placed within the ‘Golden Triangle’ of Oxford, Cambridge
and London. Although the term ‘Golden Triangle’ was coined to describe
the group of world-leading universities in the above cities, it is
increasingly being used to ‘describe the growth of the technology and life
sciences sectors in the cities of Oxford, Cambridge, and Milton Keynes’
(Bidwells, 2017).67
• The Norwich–Cambridge Technology Corridor, connecting two cities with
world–class universities, knowledge–intensive local economies and
significant clusters in life sciences, agri–food, technology, IT and energy.
62 Available here: https://www.adb.org/sites/default/files/publication/100110/reiwp-117-economic-corridor-
development.pdf
63 Sources: https://www.carecprogram.org/?page_id=33 and
https://www.brookings.edu/research/economic-corridors/
64 https://hansard.parliament.uk/Lords/2019-04-30/debates/643E7F10-8527-47DF-B8A9-
49862AE16C3C/UKInnovationCorridor
65 See http://www.lsccgrowthcommission.org.uk/?p=812 and https://innovationcorridor.uk/about.
66 https://www.nic.org.uk/our-work/growth-arc/
67 https://www.bidwells.co.uk/faqs/what-is-the-golden-triangle-in-the-uk/
Economic Corridors

Economic Strategy for the East of England
56 Cambridge Econometrics
• The A14 corridor, linking the Port of Felixstowe (largest container port in
the UK) with Cambridge and the west of the country, supporting trade
and the logistics industry.
For New Anglia LEP and Greater Essex (SELEP), the East Anglian coastline
represents a significant asset that is worth considering in its own right,
providing opportunities in tourism, renewable energy, transport and logistics.
The coasts of Suffolk, Norfolk and Essex (the longest coastline in England68)
are traditional holiday destinations in England with a number of popular
seaside resorts such as Great Yarmouth, Lowestoft, Cromer, Hunstanton,
Clacton-on-Sea and Southend.
New Anglia has substantial energy generation infrastructure including
nuclear power generation at Sizewell, offshore gas assets in the Southern
North Sea, close to 1,000 offshore wind farm turbines, and tidal waves
generating renewable energy.69
In the ports of Felixstowe, Harwich, Tilbury and London Gateway the East of
England has some of the most significant trade and logistics assets in the
country.
The main economic corridors and assets in the East of England are
illustrated in Figure 3.4.2 below.
Whilst each local area has its own set of circumstances, there are a range of
objectives that are shared by all areas of the region. These include:
• improvements of both inter-city and intra-city infrastructure;
• provision of employment land and premises, as well as place-shaping
for technology-based businesses and skilled workers;
• maintaining the balance between high levels of housebuilding whilst
protecting the natural environment and quality of life of residents;
• the need to provide high-quality employment opportunities for existing
and future residents, of all skill levels
These shared spatial objectives are illustrated in Figure 3.4.3 below.
68 https://www.visiteastofengland.com/see-do/essex
69 Section 4.3 discusses in more detail the energy assets in the East of England.
Coastal Assets
Shared spatial objectives

Economic Strategy for the East of England
57 Cambridge Econometrics
A spatial vision for the East of England
Unlike other English regions (such as the West Midlands and the North
East), the East of England isn’t based around a single conurbation. This
presents challenges, but also opportunities. By combining the separate
spatial visions outlined by the LEPs and CA, an alternative vision of the
region as a network of economic corridors emerges, which provides a
different lens through which to envision future growth. Greater Cambridge
is the UK’s centre of innovation and its knowledge generation is rivalled
only by London in this regard. The area specialises in ideas and has a
leading position in innovation, design and technology consultancy in Global
Value Chains. Whilst the innovation and knowledge intensive activity in the
region isn’t restricted to Cambridge, it is undoubtedly concentrated around
the city. Figure 3.4.2 depicts the economic corridors within the East of
England, most of which are centred around Cambridge. There is a big
opportunity to more closely link Greater Cambridge to the rest of the region
and the UK.
However, the future of the East of England is not restricted solely to these
corridors. The region has many other valuable assets, including both high-
quality farmland and the East Anglian coastline. These assets offer
complementary capabilities, which make up a broad regional offer that is
greater than the sum of its parts.
Our vision of the future of the East of England is therefore a network of
dynamic knowledge corridors, that make the best possible use of their
infrastructural assets by linking the key regional clusters and institutions,
connecting with both the significant coastal assets to the East with
specialisations in logistics, offshore renewables and tourism, as well as to
the London Commuter belt to the south; interspersed with rural oases,
which themselves provide a wide range of growing employment
opportunities in the tourism and agri-food sectors, as well as hosting a
growing tech community in their own right.

Economic Strategy for the East of England
58 Cambridge Econometrics
Figure 3.4.2 Economic Corridors with high growth potential within the East of England
Figure 3.4.3 Shared objectives across the East of England

Economic Strategy for the East of England
59 Cambridge Econometrics
4 Challenges and Opportunities
4.1 Introduction
Based on the UK Industrial Strategy, Chapter 4 starts by describing the main
global and national challenges that need to be tackled in the future and how
the East of England is in a prime position to play a major role. Then, it takes
a more detailed look into the main assets and sectoral strengths of each area
within the East of England and the region as a whole.
4.2 The Grand Challenges and Emerging Sectors
The UK Industrial Strategy70 has set out Four Grand Challenges ‘to put the
UK at the forefront of the industries of the future, ensuring that the UK takes
advantage of major global changes, improving people’s lives and the
country’s productivity’. The Four Grand Challenges, formed based on
national and global economic, technological, social and environmental
trends, are the following:
1 Artificial Intelligence and Data: to put the UK at the forefront of the AI and
data revolution
2 Ageing Society: to harness the power of innovation to help meet the
needs of an ageing society
3 Clean Growth: to maximise the advantages for UK industry from the
global shift to clean growth through leading in the development,
manufacture and use of low carbon technologies, systems and services
that cost less than high carbon alternatives
4 Future of Mobility: to become a world leader in shaping the future of
mobility, given that profound change in how people, goods and services
move around towns, cities and the countryside is on the horizon
The East of England can, and should, take the lead in tackling the Grand
Challenges given its exceptional knowledge, geographical and natural
assets. More specifically:
• The East of England has a rich history and tradition in computer science
and information technology in both academia and business, and is
currently one of the most dynamic and innovative technology centres
globally spurred primarily by the ‘Cambridge Phenomenon’
• The region is home to world-class universities and research institutions in
the fields of medicine, pharmaceuticals and biosciences, as well as to
some of the most globally important companies in these sectors, thus
offering opportunities for collaboration, commercialisation and knowledge
exchange
• The East of England coastline is a major hub for offshore wind and
nuclear power generation, while the region’s decades-long history in the
70 Department for Business, Energy and Industrial Strategy (2017). Industrial Strategy: building a Britain fit
for the future. London, United Kingdom.
Grand Challenges

Economic Strategy for the East of England
60 Cambridge Econometrics
oil and gas sectors has endowed it with a developed and experienced
supply chain
• The region has several important knowledge and infrastructure assets
that can help make contributions in shaping the future of mobility, even
though the region does not have a particular specialisation here
Due to the rapid rate of technological progress and shifting global trends and
priorities, the products and services we consume will change in both
construction and functionality. Hence, the scope of global value chains will
evolve radically over the next few decades. This is particularly relevant for
the sectors of Smart Devices, Agri-Food, Construction and Professional
Services.
The East of England is well-placed to play a major role in driving forward the
future of these sectors, given that:
• Several globally and nationally significant technology clusters are thriving
in the area, while leading research universities with specialisations in
computer science and engineering are also located in the area and are
frequently collaborating with the business sector to produce innovative
ideas and products
• It has a unique combination of high-quality farmland and R&D focussed
on the agri-tech and bioscience sectors, allowing for both cutting edge
research and implementation
• The region includes several of the fastest growing housing markets in the
UK, which, combined with its proximity to London, expertise in
engineering and innovation and specialisation in construction, put it in an
excellent position to take the future of the sector forward
• Its diverse mix of local specialisations, knowledge assets, dynamic
business environment and technological know-how would be an
important asset in shaping the future of professional services
The following section provides more detailed information on the key assets,
capabilities and strengths of the East of England that put the region in a
prime position to tackle future challenges and take advantage of emerging
opportunities.
4.3 Assets and Strengths of the East of England
This section presents the key assets in the East of England that pertain to
knowledge and skills, business and innovation, energy resources and
geographical characteristics. Furthermore, it provides a sectoral analysis that
identifies the relative strengths of each area and the region as a whole.
The evidence linking skills and productivity is well established, but this link
can work in different ways. Firstly, a skilled workforce can reflect strength in
the demand-side of the economy, as highly-educated people work in sectors
that require their qualifications (and so contribute to value-added and
productivity performance), but it can also act as a supply-side attractor for
businesses (through Foreign Direct Investment, relocation or new business
starts).
Whilst a supply of graduate workers is important for knowledge-intensive
industries, these workers are often recruited from a national labour pool.
Emerging Sectors
Knowledge and skills

Economic Strategy for the East of England
61 Cambridge Econometrics
Providing local residents with the right combination of skills required by local
industries, often taught in a further education or apprenticeship setting, can
have a more direct impact on employment outcomes for resident
populations.
Knowledge institutions play a vital role in both generating, attracting and
retaining skilled workers within a local area. For example, the success of
Cambridge University in providing a constant stream of knowledge workers
into the local economy has played a major role in the success of the
Cambridge phenomenon. Growing and strengthening existing knowledge
institutions across the region is a vital element of any future regional skills
strategy.
New Anglia LEP has within its borders several institutions of higher and
further education which are supporting the area’s growing knowledge
intensive sectors. These institutions include the University of East Anglia, the
Norwich University of the Arts, the University of Suffolk and New Anglia
College Group, consisting of 11 colleges. According to the Complete
University Guide, the three universities are ranked 21st, 76th and 129th among
universities in the UK.
New Anglia is also focussing on building excellence in STEM disciplines
across its education and skills system, which are most relevant for the area’s
high impact sectors such as energy. Examples of specialist centres that were
recently completed with a financial contribution from the LEP include the
Ipswich Waterfront Innovation Centre focussing on STEM and ICT sectors;
the International Aviation Academy at Norwich, a collaboration with KLM
Engineering to provide aircraft services; the Easton and Otley College, a
construction training centre with a focus on new technologies; and the first
National Skills Academy in the UK for financial services, located in Ipswich.
In 2017 30.9% of the working age population in New Anglia had a
qualification at the level of NVQ4 or above. About 7% of school-leavers in
Norfolk and Suffolk took up apprenticeships in 2015/16 which is slightly
higher than the national average of 6%, according to the 2017 New Anglia
Economic Strategy Evidence Report.
The area’s higher education spending on R&D is about 2.8 times the national
average. However, New Anglia’s innovative research production in the main
science subjects such as biological sciences, computer science, and
engineering lies below the national average, according to Research
Excellence Framework (REF) results.71
The Cambridgeshire and Peterborough CA area has major higher education
institutions in the University of Cambridge and Anglia Ruskin University,
which play a major role as knowledge centres and sources that benefit
knowledge-intensive start-ups and businesses, while also being leading
employers in the area. In particular, the University of Cambridge is a leading
institution ranked 6th among the world’s universities (QS World Ranking,
2019) and renowned for excellent teaching and research, as well as the
many highly successful business spinoffs founded by its staff and students.
71 http://smartspecialisationhub.org/wp-content/uploads/2018/02/NEW-ANGLIA-SSH-PROFILE-Dec-
2018.pdf
New Anglia LEP
Cambridgeshire
and
Peterborough CA

Economic Strategy for the East of England
62 Cambridge Econometrics
The current skills and training provision in Cambridgeshire and Peterborough
is a microcosm of the UK as a whole, with areas well-served by a highly
skilled workforce next to areas dominated by a lower skilled population. The
south of the Greater Cambridge area has high skills levels and high wages
for the highly productive business sectors located there compared to the
northern parts and agricultural areas of the CA. Overall, this area is not
producing enough of the right skilled people that its growing businesses
need.
About 39.0% of the resident population have qualifications at NVQ4 and
above, comparable to the national average of 38.6%, but considerably more
than the East of England regional average of 34.7%.
While having just a single university, the University of Hertfordshire, the
Hertfordshire LEP area is also home to specialist research institutions in the
life sciences such as the UK Stem Cell Bank at Potters Bar.
Hertfordshire is investing in skills improvement programmes, especially
innovation in high productivity sectors that it wishes to excel in. For example,
through the Stevenage Bioscience Catalyst, highly skilled research teams
from world-class institutions such as the University of Cambridge and
University College London are attracted to Hertfordshire. Hertfordshire has
also partnered with Airbus and North Hertfordshire College to set up the
STEM skills centre to improve skills in STEM subjects and provision of
apprenticeships. The area has also developed an Enterprise Zone which is
facilitating the acquiring of sector-specific skills in enviro-tech and agri-tech
through practice and research by companies stationed in the Zone
(Hertfordshire LEP, 2017).
The proportion of well-qualified residents in the area exceeds the national
average. In 2017 the area had over 0.63m employee jobs and over 310,000
(42.7%) of its working age residents had a qualification at NVQ4 level or
above, a higher ratio than the UK’s 38.6%.
The area has a strong mixed skilled workforce reflecting its location in the
Golden Triangle innovation ecosystem linked to nearby clusters in Southern
Cambridgeshire, Essex and Bedfordshire. The skills base also reflects the
area’s sectoral composition of employers in pharmaceuticals, accountancy
services, sustainable construction techniques, logistics, advanced
engineering and manufacturing and space-related satellite technologies.
Essex has several university centres and further education colleges where
students acquire skills through courses and research. The universities
include the University of Essex, Anglia Ruskin University (which has a med-
tech campus in Chelmsford), and Writtle University College, as well as
multiple colleges, with many skilling students through traditional courses and
apprenticeships. Graduates from these institutions as well as from other
universities provide local and national enterprises with the skills they need.
The area also has specialist skills initiatives such as the Knowledge Gateway
at the University of Essex, which aims to improve skills available for
knowledge-based enterprises operating in science, technology and the
creative sectors in the area including advanced manufacturing, life sciences
and healthcare, and digital and creative services (Essex Economic
Commission, 2017). Another example is the Stansted Airport College, which
Hertfordshire
LEP
South East LEP
(Greater Essex)

Economic Strategy for the East of England
63 Cambridge Econometrics
is a partnership between Harlow College and the Stansted Airport, offering a
range of professional and technical courses in subjects such as aviation,
engineering, business, hospitality and events.
Around 33% of the working age population in 2017 were educated to at least
NVQ 4 level, therefore in relative terms Greater Essex is more than five
percentage points behind Great Britain overall by qualification level.72,73,74
However, the area’s GCSE results in 2016 were better than England overall
by about four percentage points. People in Essex are more likely to work at a
higher level of occupation relative to their highest qualification compared to
the UK overall.
Bedfordshire has two main higher education institutions, the University of
Bedfordshire and Cranfield University. The latter is a postgraduate research
university with strengths in engineering (especially aeronautical, mechanical
and manufacturing), science and technology. Other research institutions
specialising in advanced manufacturing and engineering include the British
Hydromechanics Research Group in Central Bedfordshire, the EPSRC
Centre for Doctoral Training in Sustainable Materials and Manufacturing
which is co-run by Cranfield University and two other UK universities, and the
Space Research Centre also at Cranfield University in Central Bedfordshire.
Bedfordshire’s high-tech skills are also evident in the thriving collaboration
happening between its universities science parks and leading businesses
such as BAE Systems and other leading universities.
Among the working age population, 35% have a qualification at NVQ4 or
above level, which is over three percentage points below the UK rate.
72 https://www.nomisweb.co.uk/reports/lmp/la/1941962833/report.aspx
73 https://www.nomisweb.co.uk/reports/lmp/la/1946157203/report.aspx
74 https://www.nomisweb.co.uk/reports/lmp/la/1946157204/report.aspx
SEMLEP
(Bedfordshire)

Economic Strategy for the East of England
64 Cambridge Econometrics
East of England knowledge and skills
Overall, the East of England is home to nine research universities, with
some of them having campuses in different locations across the region.
The universities, with the world-leading University of Cambridge standing
out, are some of its greatest assets, contributing directly to the regional
economy by attracting both domestic and international students as well as
through the dissemination and commercialisation of research and
innovation. Many of the university students stay on to work or start
businesses in the region after graduation thereby helping to meet the
region’s skills needs. However, there are significant regional disparities in
the share of the resident population with higher level qualifications,
indicating that some of the areas within the East of England have
difficulties in attracting or retaining higher-skilled workers. As a result, the
region as a whole lags behind the national average: as of 2017, 34.7% of
the resident population aged 16-64 had a qualification at NVQ4 level or
above, while the UK rate was 38.4%.
Apart from the universities, there are also multiple regional colleges, as
well as science parks and research institutions. These serve as sources
and centres of knowledge and often collaborate with each other and form
research partnerships. Moreover, they frequently engage in
commercialising this knowledge either directly or in collaboration with both
domestic and international businesses.
Figure 4.3.1 and Table 4.3.1 below summarise the knowledge and skills assets in the East of England.
Figure 4.3.1: Share of employees with NVQ4+ qualifications by LAD and locations of main universities in the East of England

Economic Strategy for the East of England
65 Cambridge Econometrics
Table 4.3.1 Summary of knowledge institutions and skills across the East of England
People and skills New Anglia LEP Cambridge and
Peterborough CA
Hertfordshire LEP South East LEP (Essex) South East Midlands
LEP (Bedfordshire)
Population Aged
16-64 (2017)
- 0.98m
- 59.1%
- 0.85m
- 62.7%
- 1.18m
- 62.7%
- 1.82m
- 61.1%
- 0.67m
- 63%
16-64 year-olds
with NVQ4+
qualification
- 30.9%
- 39%
- 42.8%
- 33%
- 35%
Universities - University of
Suffolk
- University of East
Anglia
- Norwich
University of the
Arts
- University of Cambridge
- Anglia Ruskin University
- University of
Hertfordshire
- University of Essex
- Anglia Ruskin University
(campus in Chelmsford)
- University of
Bedfordshire
- Cranfield University
Economic Strategy for the East of England
66 Cambridge Econometrics
Innovation is the process of extracting economic or social value from new
information, ideas or insight. Innovation can come in many forms, including
both product and process innovation. Although often driven by new
technologies, it can also simply derive from improved methods of internal
business organisation or market understanding which drive productivity. There
is a causal link from innovation to business dynamism and growth, particularly
in the creation of start-ups.
The importance of ideas and innovation to a regional economy can depend
upon whether a region’s firms are innovation leaders (for example,
undertaking research and development and/or producing patents) or
innovation followers (for example, adopting new methods to improve business
efficiency).
A lack of research and development (R&D) or innovation capacity in a region
(such as R&D-specific firms or limited non-university public sector R&D
capacity) can prevent innovation diffusion and ‘domestication’ within a region.
In addition, this could also make an economy less attractive to highly skilled
employees who are looking to work in higher productivity sectors.
Knowledge institutions have a significant role to play here, both in the
generation of ideas through university-led R&D, but also in that the ability of
an area to generate and commercialise new ideas is closely linked to the
knowledge and skill level of its workforce.
There is also a symbiotic relationship between innovation and business
dynamism, with regions with the most developed business-support systems
best placed to successfully commercialise any new knowledge that is
generated.
The economy of New Anglia LEP has thriving businesses of various sizes
spanning several business sectors. ONS data shows that in 2018 there were
62,750 business enterprises in New Anglia. Over 88% of these businesses
had nine or fewer employees while 9.7% had between 10-49 employees. In
comparison, the East of England had 236,895 businesses of which 8.4% had
between 10-49 employees.75 5,710 new businesses and 43,600 more jobs
were created over 2014-2017, according to the 2017 Norfolk and Suffolk
Economic Strategy Report.
Some of the notable companies with a presence in the LEP include BT,
Huawei, Ericsson, Aviva, and Lotus. Norwich is among the largest general
insurance centres in the UK and hosts notable financial services companies
such as Aviva, AXA and Marsh.
New Anglia also has several Enterprise Zones and business parks where
targeted resources and policies, such as reduced business rates over a
specified timeframe, simplified planning permission, and access to superfast
broadband, are implemented to support business growth.76
Average business enterprise spending on R&D in New Anglia was about 1.14
times the national average, according to ONS data from 2015. During 2010-
2012 New Anglia’s R&D spend as a percentage of GVA was 1.9% compared
to 1.2% by the UK overall. The area also saw a dramatic 50% increase in
75 https://www.nomisweb.co.uk/reports/lmp/lep/1925185555/report.aspx#tabidbr
76 https://newanglia.co.uk/enterprise-zones/
Business and innovation
New Anglia LEP

Economic Strategy for the East of England
67 Cambridge Econometrics
science and R&D employment in the decade after 2007, surpassing the UK
rate of 19% over the same period. 77
There is collaboration on R&D and commercialising innovations between
universities and science/research parks in the area such as Norwich Research
Park and Adastral Park (home to BT’s Global R&D HQ), Huawei, Cisco,
Ericsson and Tech Mahindra.
The area’s agri-food sector has successfully been offered grants from
Innovate UK at amounts nearly 1.4 times the national average, highlighting
this sector’s importance to the area.78
The Cambridgeshire and Peterborough CA area has high rates of globally
competitive businesses and start-ups which are at the forefront of the new
industrial revolution. According to the CA, the area has ‘the best performing
economy in the country outside London, contributing £5bn a year to UK PLC.
More than 25 of the world’s largest corporations are based in Cambridge and
there are over 4,500 knowledge intensive companies located within our area’. 79 Some of these businesses operate at the cutting edge in sectors such as life
sciences, advanced manufacturing and engineering, AI and computing. These
businesses are of strategic importance to Cambridgeshire and Peterborough
and have a net positive impact on the UK economy. In 2018 there were
35,220 businesses in the CA area with 88.8% of these having a maximum of
10 employees, while 8.9% of the businesses had 10-49 employees.80
There is a thriving business networking culture in the area which also has
strong links to contacts from outside this area. These networks facilitate the
diffusion of know-how through the business community and promote and
facilitate investment through increased availability of options to do business
and access finance for new business ventures. As of 2018 there were more
than 60 networks in Cambridge, with Cambridge Network and One Nucleus
being the oldest networks and having a membership of over 2000 between
them, including multi-national companies (Cambridgeshire and Peterborough
IER, 2018, p. 60).81
For Cambridge in particular, this networking can be seen through the
presence of successful angel investors such as Cambridge Angels and
Cambridge Capital Group as well as the thriving local media which reports
regularly on business matters and has regular business events such as annual
awards dinners. Among these leading media outlets are Cambridge News
which has a business section, Business Weekly which covers business-to-
business issues, and the more recent Cambridge Independent which focusses
on science and technology.82
77 https://newanglia.co.uk/wp-content/uploads/2017/12/2017-12-05-FINAL-Economic-Evidence-Report-
single-pages-HighRes.pdf
78 http://smartspecialisationhub.org/wp-content/uploads/2018/02/NEW-ANGLIA-SSH-PROFILE-Dec-
2018.pdf
79 http://cambridgeshirepeterborough-ca.gov.uk/business-board
80 https://www.nomisweb.co.uk/reports/lmp/comb/1853882376/report.aspx#tabidbr
81 Page 60:
http://www.cpier.org.uk/media/1671/cpier-report-151118-download.pdf
82 http://www.cpier.org.uk/media/1671/cpier-report-151118-download.pdf
Cambridgeshire
and
Peterborough CA

Economic Strategy for the East of England
68 Cambridge Econometrics
The CA’s two main cities are very innovative when compared to other UK
cities, with Cambridge ranking first and Peterborough 13th among UK cities for
the number of patent applications per 100,000 people.83 The southern part of
the CA (Cambridge and South Cambridgeshire) is the major hub of innovation
activity with significance at the global scale, where most of the R&D is carried
out at the University of Cambridge and several science parks where many
innovative start-ups and businesses are based.
An important asset contributing to the innovation leadership of the area is its
capacity to attract domestic and international skilled workers, innovators and
entrepreneurs to work in its research and innovation-generating sectors.
Businesses and innovation creation across the CA also benefit from the area’s
location and links to leading science clusters and corridors such as the
Cambridge-Milton Keynes-Oxford Arc, the Golden Triangle (Oxford–
Cambridge–London), the Norwich–Cambridge Technology Corridor, and the
UK Innovation Corridor/London–Stansted–Cambridge Consortium.
The business environment in Hertfordshire is conducive to and benefits from
the area’s location in the Golden Triangle linking London, Oxford and
Cambridge, which allows businesses access to the skilled workforce needed
for the area’s high-value businesses. Some high-profile companies with
connections to Hertfordshire are GlaxoSmithKline (GSK), Airbus, Ocado,
MBDA, Johnson Matthey, and Vinci. Hertfordshire county had over 61,000
enterprises in 2018, with just under 91% of these small in size and employing
no more than 9 people each and about 7.5% employing between ten and 49
people.84
The county is linked economically with surrounding areas such as Essex and
South Cambridgeshire to extract economic value from clusters specialising in
life sciences, agri-tech, and advanced engineering. It is home to over 200
firms in the life sciences sector which are underpinned by the area’s strategic
location and strong links to life sciences clusters in Cambridge and
biosciences in London, especially within universities.85
The presence of many knowledge-intensive businesses and operations in this
LEP area as well as the area’s strong links to surrounding tech and science
clusters has resulted in Hertfordshire being an innovation-generating centre. In
2015, analysis by the Department of Business, Innovation and Skills showed
that, out of 39 LEPs Hertfordshire ranked 2nd for business spending on R&D,
1st in bioscience and 2nd in space programmes, and 2nd overall for proportion
of enterprises undertaking product or process innovation.86
Greater Essex is the eighth largest local economy outside of London. It
provides several advantages for businesses, including the area’s proximity to
the London-Stansted-Cambridge corridor, lower employment and property
costs compared to the rest of the South East, access to UK markets via the
road and rail infrastructure and to international markets via air and sea. The
presence of major seaports (Harwich, London Gateway, Tilbury) and major
83 http://www.cpier.org.uk/media/1671/cpier-report-151118-download.pdf
84 https://www.nomisweb.co.uk/reports/lmp/lep/1925185549/report.aspx#tabidbr
85 https://www.hertfordshirelep.com/media/5417/hertfordshire-lep-sep-report-interactive.pdf
86 https://www.hertfordshirelep.com/media/5417/hertfordshire-lep-sep-report-interactive.pdf
Hertfordshire
LEP
South East LEP
(Greater Essex)

Economic Strategy for the East of England
69 Cambridge Econometrics
airports (Stansted and Southend) has led to developing expertise in logistics
and transportation.
The Greater Essex area has a strong entrepreneurial culture as reflected by
its high proportion of smaller businesses, according to a 2018 report by the
Essex Economic Commission. In 2018, Essex had in excess of 77,000
businesses, about 91% of which were micro with 0-9 employees and 8.1%
were small with 10-49 employees. There are several active business groups in
the area working to advance the interests of business, for example, Essex
Partners, the Essex Business Board, and Opportunities South Essex.
Essex has sites and businesses either engaged in innovation or translating
existing technological innovations into growth. The Harlow Enterprise Zone is
an innovation centre, while Uttlesford is associated with Chesterford
Science/Research Park. Advanced manufacturing, which accounts for 10% of
the area’s GVA, is an important sector. Areas with innovation potential in the
sector are Basildon and Rochford due to the presence of automotive
companies such as Ford. Anglia Ruskin University’s Harlow campus and the
University of Essex’s Colchester campus are active in innovation in the life
sciences and healthcare sectors.
Bedfordshire has a high rate of business dynamism. There were 26,795
businesses in Bedfordshire in 2018, of which 91% employed up to 9
employees while 7.5% had between 10 and 49 employees. As part of
SEMLEP, Bedfordshire lies within the LEP which in 2017 had the third-highest
rate of business start-ups per 10,000 people in the country, behind London
and Worcestershire.87 Luton, one of three constituent local authority districts in
Bedfordshire, had the highest net growth rate of private sector jobs among UK
cities in 2015-2016 (15.7%), amounting to 10,500 net job gains.88
Furthermore, 66% of respondents to a Central Bedfordshire Council survey
rated the area as a good place to do business.89
The area is highly innovative, with primary R&D taking place in science parks
and the area’s two universities (Cranfield University and the University of
Bedfordshire), with substantial collaboration across institutions. This helps to
support the area’s high value knowledge-intensive business services
operations, with aerospace, advanced engineering, bioscience, and food
science being areas of focus. Businesses in these sectors have strong links in
the Bedfordshire area and the surrounding clusters linked to the Cambridge-
Milton Keynes-Oxford Growth Corridor.
The area also has several specialist automotive engineering centres
specialising in vehicle testing and developing transport systems of the future.
Transport Systems Catapult, the UK’s technology and innovation centre for
intelligent mobility, is based in the region.
87 Page 98: http://www.semlep.com/modules/downloads/download.php?file_name=1237
88 Ibid., page 15. The city of Luton is defined as the Luton local authority district; see here for more details.
89 https://centralbedfordshire.app.box.com/s/0iimre4ewjkq6peyaev1gqxehxnjcilx
SEMLEP
(Bedfordshire)

Economic Strategy for the East of England
70 Cambridge Econometrics
East of England business and innovation
The East of England has a dynamic and competitive business
environment, with innovation having a central role. Compared to the UK
average, the East of England has a slightly higher share of micro
enterprises (0-9 employees) compared to the UK average (89.8%
compared to 89.3%), while having the same share (0.4%) of large
enterprises (250+ employees). Businesses in the East of England have the
second highest R&D expenditure in the country, while the Cambridgeshire
area has one of the highest employment shares in scientific R&D in the
country (Figure 4.3.2).
Higher R&D expenditure is associated with higher levels of innovation.
Indeed, data from the European Patents Office show that the East of
England is second among English regions in patents filed per million
inhabitants, while ranking first in patents published and granted per million
inhabitants.
Support for innovative start-ups is a central policy theme of the regional
authorities across the region, underlined by the number of science parks
and business incubators and accelerators that are active in the area.
These are depicted in Figure 4.3.3.
Table 4.3.2 summarises the business and innovation assets in the East of
England.
Figure 4.3.2 Employment share in scientific R&D

Economic Strategy for the East of England
71 Cambridge Econometrics
Note: The ‘Space to Innovate’ Enterprise Zone in New Anglia spans several sites within the LEP and is not shown in the map.
Figure 4.3.3 Map of main Enterprise Zones, Science Parks and Incubators & Accelerators in the East of England

Economic Strategy for the East of England
72 Cambridge Econometrics
Table 4.3.2 Summary of business and innovation across the East of England
People and skills New Anglia LEP Cambridge and
Peterborough CA
Hertfordshire LEP South East LEP
(Essex)
South East Midlands LEP
(Bedfordshire)
Number of businesses in
2018
- 62,750 - 35,220 - 61,000 - 77,000 - 26,795
Business share with 0-9
employees
- 88% - 88.8 - 91% - 91% - 91%
Business share with 10-
49 employees
- 9.7% - 8.9% - 7.5% - 8.1% - 7.5%
Enterprise Zones (EZ)
and science/research
parks
- Great Yarmouth and
Lowestoft EZ
- Space to Innovate EZ
- Cambridge Compass E,
Cambridge Biomedical
Campus, Cambridge Science
Park, Granta Park, University
of Cambridge
- Hertfordshire Enviro-
Tech EZ, Stevenage
Bioscience Catalyst,
Building Research
Establishment,
Rothamsted Research,
Cell and Gene Therapy
Catapult
- Harlow EZ, Chesterford
science/research park
- Luton Airport EZ, Transport
Systems Catapult

Economic Strategy for the East of England
73 Cambridge Econometrics
The East of England has major energy generation capabilities, with a unique
mix of wind power, nuclear and gas assets. The southern part of the North
Sea off the coasts of Norfolk, Suffolk and Essex has traditionally been a gas
extraction area, while it has also emerged as a major global hub for wind
energy production. There are currently close to 1,000 wind turbines off the
East of England coast generating 3.75GW of renewable energy, with an
additional investment of £50bn over the next ten years to deliver more than
1,000 additional turbines.90 Furthermore, the ports of Lowestoft, Great
Yarmouth and Harwich have key roles in supporting the offshore energy
industry. Finally, Sizewell in Suffolk is the location of nuclear energy power
station with one reactor currently in operation (out of a total of 15 in the UK),
with plans of expansion in the future currently in development.
As government policy pivots towards renewable energy sources in the future,
these have the potential to expand significantly, providing not only valuable
jobs and income for the region, but also playing a significant role in helping the
UK reduce its carbon emissions. With 60% of offshore wind energy in the UK
generated in the East of England91, the region is already an important centre of
renewable energy and its experience puts it in a prime position to take
advantage of the shift towards clean energy.
Another important physical asset for the East of England is the extent and
quality of its farmland. The region has a total farmed area of 1.4m hectares,
accounting for 15.3% of total farmed area in England (second to the South
West’s 19.3% share). 79% of the farmed area is arable, by far the highest
share and largest arable area among English regions. Combined with the
technological and scientific expertise of the area, this has evolved into a
significant asset for the region, that can play a major role in the future as
increasing focus is placed on the production of high-quality, healthy, ethical
and sustainable food. The region’s importance for the future of agri-food is
underlined by the fact that for the period 2004-16, the East of England
accounted for 35% of UK Research Council Funding in plant and crop
science; 24% in agri-environmental science and 16% in food science and
nutrition.
Figure 4.3.4 summarises the physical assets in the East of England.
90 New Anglia LEP (2017a)
91 East of England Science and Innovation Audit (2017).
Energy and physical assets

Economic Strategy for the East of England
74 Cambridge Econometrics
Figure 4.3.4 Wind power (top) and land assets (bottom) in the East of England
Figure 4.3.4(b): Land cover in England and Wales. Arable land (shown in burgundy) is heavily conentrated in the East of England
Figure 4.3.4(a): Location of current and future offshore windfarms around the UK coastline. The East Anglian coast represents the bottom half of the “Eastern Energy Coast”

Economic Strategy for the East of England
75 Cambridge Econometrics
Sectoral mix can be an important influence on productivity when it reflects a
region’s export base, its ability to bring income into the area and its ability to
compete effectively.
However, most evidence shows that the sectoral mix does not explain the
productivity gap between regions, not least because it is specialisation by
function within a sector (for example, front versus back-office functions in the
financial sector, or global versus national focus in manufacturing) that drives
productivity differences between regions rather than the sector within which
the function is located.
The East of England is a diverse economic area, and many of the individual
spatial nuances are averaged out when viewed at a regional level. Hence, this
section examines productivity and employment in the individual LEP areas
first, and then looks at the region as a whole.
The figures in the remaining part of this section show the relative productivity
(y axis) and relative employment (x axis) of each area compared to England
excluding London. Relative employment is defined as the ratio of the sectoral
employment share in that area to the employment share of the same sector in
the comparator area:
𝑟𝑒𝑙𝑎𝑡𝑖𝑣𝑒 𝑒𝑚𝑝𝑙𝑜𝑦𝑚𝑒𝑛𝑡 𝑜𝑓 𝑠𝑒𝑐𝑡𝑜𝑟 𝑖 =
𝑒𝑚𝑝𝑙𝑜𝑦𝑚𝑒𝑛𝑡 𝑖𝑛 𝑠𝑒𝑐𝑡𝑜𝑟 𝑖 𝑤𝑖𝑡ℎ𝑖𝑛 𝑎𝑟𝑒𝑎 𝑗
𝑡𝑜𝑡𝑎𝑙 𝑒𝑚𝑝𝑙𝑜𝑦𝑚𝑒𝑛𝑡 𝑖𝑛 𝑎𝑟𝑒𝑎 𝑗
𝑒𝑚𝑝𝑙𝑜𝑦𝑚𝑒𝑛𝑡 𝑖𝑛 𝑠𝑒𝑐𝑡𝑜𝑟 𝑖 𝑤𝑖𝑡ℎ𝑖𝑛 𝑐𝑜𝑚𝑝𝑎𝑟𝑎𝑡𝑜𝑟 𝑎𝑟𝑒𝑎 𝑧
𝑡𝑜𝑡𝑎𝑙 𝑒𝑚𝑝𝑙𝑜𝑦𝑚𝑒𝑛𝑡 𝑖𝑛 𝑐𝑜𝑚𝑝𝑎𝑟𝑎𝑡𝑜𝑟 𝑎𝑟𝑒𝑎 𝑧
The definition for relative productivity is similar. The interpretation of these
ratios is the following:
• Values above one in relative employment indicate an employment
specialisation of an area relative to England excluding London.
• Values above one in relative productivity indicate a productivity advantage
of an area relative to the comparator area.
Hence, an area has an employment specialisation and a productivity
advantage in sectors placed in the top right quadrant, while sectors in the
bottom left quadrant are ones where the area is less specialised and
productive than the country average. The top left quadrant represents sectors
that the area has high relative productivity, but does not have an employment
speciality in; the inverse holds for sectors in the bottom right quadrant.
According to the Norfolk and Suffolk Economic Strategy, there are nine
sectors in which New Anglia has distinct strengths. These are energy; life
sciences and biotech; ICT, tech and digital creative; agriculture, food and
drink; visitor economy – tourism and culture; financial services and insurance;
transport, freight and logistics; construction and development; advanced
manufacturing and engineering. 92
New Anglia is competitive in these sectors which are an important part of the
local economy in terms of GVA and growth potential, as well as linking the
area with the national and broader global economies and exemplifying the
level and breadth of skills within the enterprises flourishing in the area. Part of
92 New Anglia LEP, 2017a (p. 12).
Sectoral strengths
New Anglia LEP

Economic Strategy for the East of England
76 Cambridge Econometrics
this competitiveness relies on New Anglia’s natural advantages such as fertile
soils that have made New Anglia the most productive farming region in the UK
and its ‘breadbasket’ while its coastal environment has made it possible for the
growth of the offshore windfarm renewable energy sector.
Each key sector is represented by a business-led sector group in which
members transfer knowledge and skills which harness innovation that feeds
the area’s growth. For example, the East of England Energy Group (EEEGR)
represents over 350 organisations from the area’s diversified energy sector
which spans oil, gas, wind, and tidal. The energy sector employs 19,000
people directly and is expected to grow further, given that some of the world’s
largest windfarms are under construction off the East Anglian coast.93
Analysis of 2017 sectoral data for New Anglia is shown in Figure 4.3.5. Here
we see that the New Anglia LEP area has sectoral productivity levels above
the level of England excluding London in six of the fourteen broad sectors
profiled. Of these, it also has relative employment specialisation in five:
Transportation and Storage (reflecting its strengths in shipping and logistics),
Finance and Accommodation and Food Services (reflecting its strength in
tourism), Insurance, Public Administration, and, particularly, Agriculture,
Mining, Electricity, Gas, Water and Waste (reflecting its strengths in Agri-food
and offshore power generation). Other identified niche strengths, such as in
life sciences and biotech or advanced manufacturing, are obscured by the
breadth of the sectors for which data is available.
93 https://newanglia.co.uk/project/energy/
Figure 4.3.5 Productivity and employment in the New Anglia LEP area compared to England (excluding London)

Economic Strategy for the East of England
77 Cambridge Econometrics
The Cambridgeshire and Peterborough CA area is renowned for excellence in
several key knowledge-intensive sectors which has led to the clustering of
businesses, especially in the southern part of the Authority around Cambridge.
These sectors include digital; life sciences; advanced manufacturing and
engineering; and agri-tech.
The CA has a vibrant economy with above average productivity levels in ten
out of the fourteen sectors.
2017 ONS data shows that the area’s three standout sectors are Professional;
Scientific and Technical Activities, Information and Communication, and
Education. For these sectors the CA area has higher productivity and higher
employment relative to England excluding London (see Figure 4.3.6).
The contiguous counties of Hertfordshire and Bedfordshire have been
analysed jointly. Remarkably, this combined region has productivity levels
above level for England excluding London in eleven of fourteen broad sectors.
Hertfordshire has strong businesses in the science and technology sectors
covering pharmaceuticals and life sciences; agri-tech; advanced engineering
and manufacturing agri-tech; IT/AI data economy; creative industries
(media/film/TV production), and sustainable construction materials and
methods. This is evidenced by resident businesses already listed above, as
well as well as R&D operations in the area, for example, at Stevenage
Bioscience Catalyst, Airbus, MBDA, Eisai and Rothamsted Research. In
August 2019 it also emerged that the GSK site at Sycamore House,
Stevenage had been bought by Dutch company, Kadans Science Partner,
who have promised to redevelop and extend Sycamore House into a modern,
Cambridgeshire
and
Peterborough CA
Hertfordshire and
Bedfordshire
Figure 4.3.6 Productivity and employment in the Cambridgeshire and Peterborough CA area compared to England (excluding London)

Economic Strategy for the East of England
78 Cambridge Econometrics
vibrant, multi-tenanted R&D facility, with expected an completion date of mid-
2021.
There is also R&D and innovation in transport in Bedfordshire, for example,
the advanced vehicle testing capacity at Millbrook Innovation Centre in Central
Bedfordshire, high-end performance technology such as in Next Generation
Transport innovation for freight, and advanced manufacturing technology for
food and drink, aerospace and defence, cultural and creative industries.
Much of the business and R&D activity in the area has strong links to
economic activity in surrounding areas (for example, with respect to where
workers commute across Bedfordshire and Hertfordshire). Looking at
productivity and employment in this area, we see in Figure 4.3.7 that the key
sectors for which the Hertfordshire and Bedfordshire area outperforms the rest
of England (excluding London) are in Arts and Recreation, Construction,
Wholesale and Retail Trade, Professional; Scientific and Technical Activities,
and Transportation and Storage.
The key sectors in the Greater Essex area include logistics and transport with
expertise facilitated by the presence of major sea ports and two international
airports (Stansted and Southend) and life sciences and health/social care
operations at Chesterton Research Park and at the of county’s two main
universities. Anglia Ruskin University is developing Med Tech facilities at
Harlow and Chelmsford while the University of Essex is undertaking research
in healthcare and assisted living at its campus in Colchester.
Other key sectors are advanced manufacturing in automotive and
medical/dental/optical machinery and pharmaceuticals; digital and creative
services; wholesale and retail trade; and financial and business services.
South East LEP
(Essex)
Figure 4.3.7 Productivity and employment in Bedfordshire and Hertfordshire LEPs area compared to England (excluding London)

Economic Strategy for the East of England
79 Cambridge Econometrics
Data from 2017 shows that Essex had productivity levels above the England
level excluding London in seven of fourteen broad sectors, according to Figure
4.3.8. These sectoral strengths are quite different to the rest of the region, with
less of a focus on hi-tech services, and higher levels of specialisation in
Construction, Transportation and Storage, and Wholesale and Retail Trade,
for example. In particular, the strength of the Transport and Storage sector is
linked to Essex being home to major sea ports which handle a substantial
amount of the UK’s sea traffic, and the presence within the area of both
Stansted and Southend airports.
Figure 4.3.8 Productivity and employment in Greater Essex compared to England (excluding London)
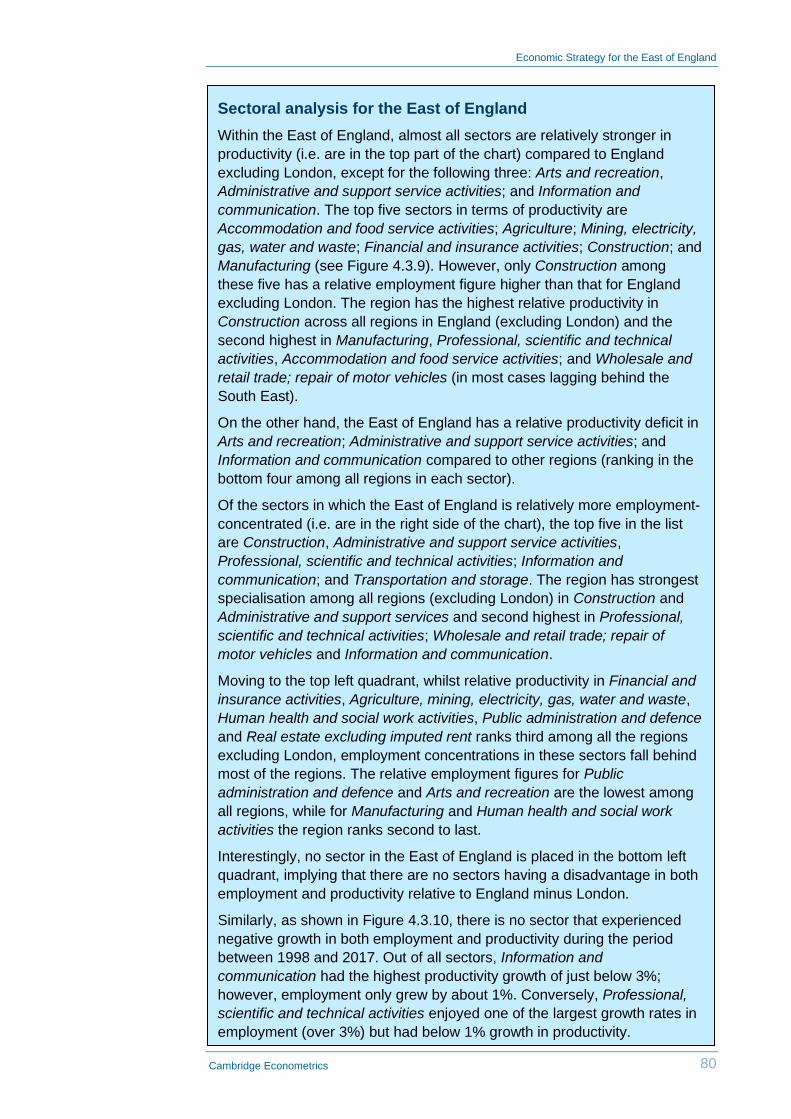
Economic Strategy for the East of England
80 Cambridge Econometrics
Sectoral analysis for the East of England
Within the East of England, almost all sectors are relatively stronger in
productivity (i.e. are in the top part of the chart) compared to England
excluding London, except for the following three: Arts and recreation,
Administrative and support service activities; and Information and
communication. The top five sectors in terms of productivity are
Accommodation and food service activities; Agriculture; Mining, electricity,
gas, water and waste; Financial and insurance activities; Construction; and
Manufacturing (see Figure 4.3.9). However, only Construction among
these five has a relative employment figure higher than that for England
excluding London. The region has the highest relative productivity in
Construction across all regions in England (excluding London) and the
second highest in Manufacturing, Professional, scientific and technical
activities, Accommodation and food service activities; and Wholesale and
retail trade; repair of motor vehicles (in most cases lagging behind the
South East).
On the other hand, the East of England has a relative productivity deficit in
Arts and recreation; Administrative and support service activities; and
Information and communication compared to other regions (ranking in the
bottom four among all regions in each sector).
Of the sectors in which the East of England is relatively more employment-
concentrated (i.e. are in the right side of the chart), the top five in the list
are Construction, Administrative and support service activities,
Professional, scientific and technical activities; Information and
communication; and Transportation and storage. The region has strongest
specialisation among all regions (excluding London) in Construction and
Administrative and support services and second highest in Professional,
scientific and technical activities; Wholesale and retail trade; repair of
motor vehicles and Information and communication.
Moving to the top left quadrant, whilst relative productivity in Financial and
insurance activities, Agriculture, mining, electricity, gas, water and waste,
Human health and social work activities, Public administration and defence
and Real estate excluding imputed rent ranks third among all the regions
excluding London, employment concentrations in these sectors fall behind
most of the regions. The relative employment figures for Public
administration and defence and Arts and recreation are the lowest among
all regions, while for Manufacturing and Human health and social work
activities the region ranks second to last.
Interestingly, no sector in the East of England is placed in the bottom left
quadrant, implying that there are no sectors having a disadvantage in both
employment and productivity relative to England minus London.
Similarly, as shown in Figure 4.3.10, there is no sector that experienced
negative growth in both employment and productivity during the period
between 1998 and 2017. Out of all sectors, Information and
communication had the highest productivity growth of just below 3%;
however, employment only grew by about 1%. Conversely, Professional,
scientific and technical activities enjoyed one of the largest growth rates in
employment (over 3%) but had below 1% growth in productivity.

Economic Strategy for the East of England
81 Cambridge Econometrics
Figure 4.3.10 Productivity and employment in the East of England compared to England
(excluding London)
Figure 4.3.9 Productivity and employment growth in the East of England

Economic Strategy for the East of England
82 Cambridge Econometrics
Manufacturing, Construction, Financial and insurance activities and
Professional, scientific and technical activities play a bigger role in driving high
productivity growth in the East of England than for the whole of England
excluding London, and all other regions within it. We also identified relatively
higher employment specialisation in the knowledge-intensive business sectors
(KIBS).
Although the East of England does not specialise in manufacturing overall,
within the sector the region does have a sizable employment surplus in Repair
of fabricated metal products, machinery and equipment, Processing and
preserving of meat and production of meat products, Manufacture of products
of wood, cork, straw and plaiting materials, and Manufacture of electronic
components and boards. Areas of manufacturing that have a large
employment deficit are the Motor vehicles or related sectors and Metal
production sectors. This combination reflects the area’s strong presence in the
UK agri-food supply chain, as well as more niche areas of high-value
manufacturing.
Of the sectors within KIBS, the East of England has the highest employment
surplus in Research and experimental development on natural sciences and
engineering. Other sub-sectors within the largest ten in surplus include
Activities auxiliary to insurance and pension funding, Management
consultancy activities, Architectural and engineering activities and related
technical consultancy and other media-related sectors like Publishing and
advertising activities. Furthermore, the East of England has significant
employment deficits in Monetary intermediation, Other financial service
activities, except insurance and pension funding and Other professional,
scientific and technical activities n.e.c., which are associated with the banking
sector and other consultancy-related services.
Subsector
analysis for the
East of England

Economic Strategy for the East of England
83 Cambridge Econometrics
Summary
The East of England has a combination of physical and institutional assets
that compares favourably to any other UK region, putting the region in a
prime position to take advantage of emerging opportunities and tackle
future challenges. These assets include:
• The presence of a world-leading university and associated globally
significant tech clusters in and around Cambridge, the UK’s leading
hub of innovation and knowledge generation outside of London
• The highest proportion of employment in scientific research and
development (1.1% in 2017) of any UK region
• Region-wide specialisations in high-value, knowledge intensive
services, particularly in the professional, technical and scientific
services and information and communication sectors
• A range of complementary specialisms, most notably in agri-food,
offshore renewables, tourism and construction, as well as some
niche high value manufacturing
• Close proximity to and high level of integration with London,
resulting in numerous business links and commuting movements
• Significant international gateways, including high capacity freight
and passenger terminals serving the European mainland, and (in
London Stansted) the fourth busiest airport in the UK
• A high quality of life, with a mix of smaller “liveable” cities with
significant cultural heritage and peaceful and affluent rural areas
The table below summarises the discussion and analysis of Chapter 4,
identifying the East of England’s key offer in addressing both the Four
Grand Challenges and exploiting the four identified emerging market
opportunities.
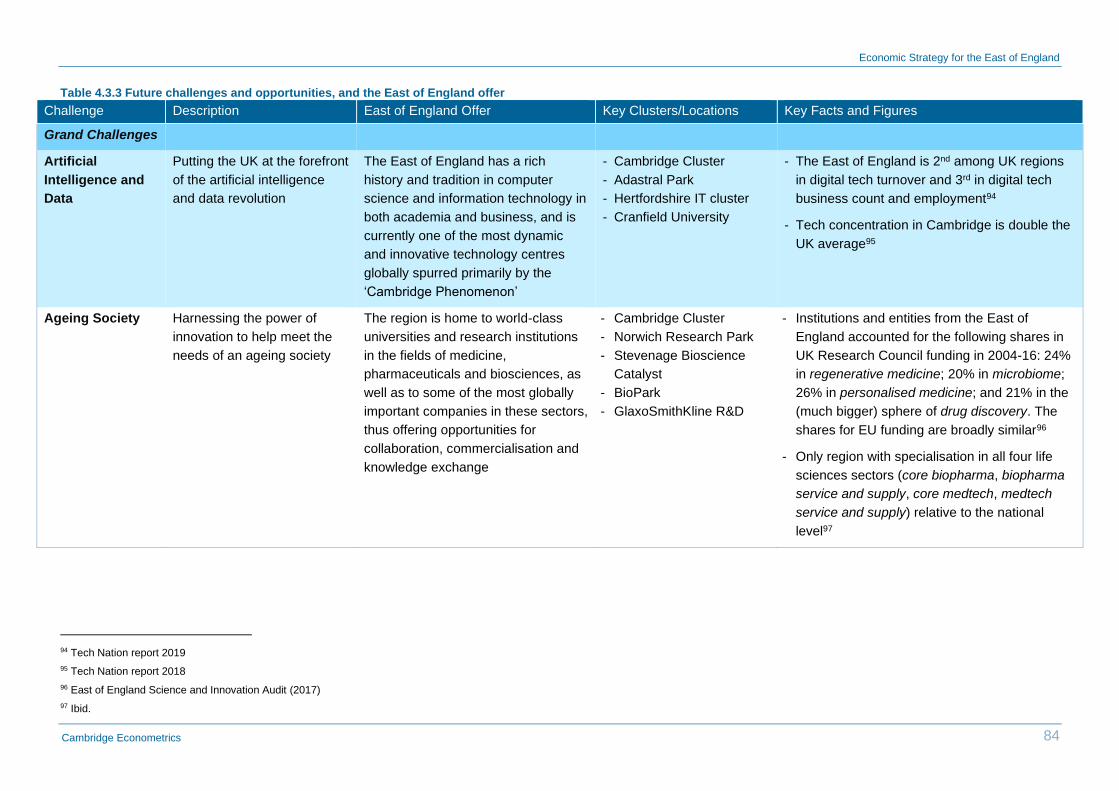
Economic Strategy for the East of England
84 Cambridge Econometrics
Table 4.3.3 Future challenges and opportunities, and the East of England offer
Challenge Description East of England Offer Key Clusters/Locations Key Facts and Figures
Grand Challenges
Artificial
Intelligence and
Data
Putting the UK at the forefront
of the artificial intelligence
and data revolution
The East of England has a rich
history and tradition in computer
science and information technology in
both academia and business, and is
currently one of the most dynamic
and innovative technology centres
globally spurred primarily by the
‘Cambridge Phenomenon’
- Cambridge Cluster
- Adastral Park
- Hertfordshire IT cluster
- Cranfield University
- The East of England is 2nd among UK regions
in digital tech turnover and 3rd in digital tech
business count and employment94
- Tech concentration in Cambridge is double the
UK average95
Ageing Society Harnessing the power of
innovation to help meet the
needs of an ageing society
The region is home to world-class
universities and research institutions
in the fields of medicine,
pharmaceuticals and biosciences, as
well as to some of the most globally
important companies in these sectors,
thus offering opportunities for
collaboration, commercialisation and
knowledge exchange
- Cambridge Cluster
- Norwich Research Park
- Stevenage Bioscience
Catalyst
- BioPark
- GlaxoSmithKline R&D
- Institutions and entities from the East of
England accounted for the following shares in
UK Research Council funding in 2004-16: 24%
in regenerative medicine; 20% in microbiome;
26% in personalised medicine; and 21% in the
(much bigger) sphere of drug discovery. The
shares for EU funding are broadly similar96
- Only region with specialisation in all four life
sciences sectors (core biopharma, biopharma
service and supply, core medtech, medtech
service and supply) relative to the national
level97
94 Tech Nation report 2019
95 Tech Nation report 2018
96 East of England Science and Innovation Audit (2017)
97 Ibid.

Economic Strategy for the East of England
85 Cambridge Econometrics
Clean Growth Maximising the advantages
for the UK industry from the
global shift to clean growth
The East of England coastline is a
major hub for offshore wind and
nuclear power generation, while the
region’s decades-long history in the
oil and gas sectors has endowed it
with a developed and experience
supply chain
- East of England Energy
Group
- East of England Energy
Zone
- OrbisEnergy
- 60% of offshore wind Energy in the UK
generated in the East of England98
- There are currently 986 wind turbines off the
region’s coast generating 3.75GW of
renewable energy, with an additional
investment of £50bn over the next ten years to
deliver more than 1,000 additional turbines99
Future of Mobility Being a world leader in
shaping the future of mobility
The region has several important
knowledge and infrastructure assets
that can help make significant
contributions in shaping the future of
mobility
- Aerospace Technology
Institute
- Millbrook Proving Ground
- Nissan Technical Centre
Europe
- Lotus Cars
- Multi-User Environment
for Autonomous Vehicle
Innovation (MUEAVI),
Cranfield University
- Cranfield is UK site of the Nissan Centre of
Excellence for design and development of
vehicles manufactured in the European plants,
employing 900 on site100
- Lotus will produce the first all-electric hypercar
by a British manufacturer101
98 Ibid.
99 New Anglia LEP (2017a)
100 Life at Nissan Cranfield.
101 News announcement by Lotus.

Economic Strategy for the East of England
86 Cambridge Econometrics
Challenge Description East of England Offer Key Clusters/Locations Key Facts and Figures
Other Emerging
Technologies
Smart Devices Staying at the technological
frontier by focusing on the
most leading-edge fields,
such as home and portable
entertainment platforms,
Internet of Things (IoT),
Virtual Reality (VR), Artificial
Intelligence (AI), connected
systems, sensors, and
robotics
Several globally and nationally
significant technology clusters are
thriving in the area, while leading
research universities with
specialisations in computer science
and engineering are also located in
the area and are frequently
collaborating with the business sector
to produce innovative ideas and
products
- Cambridge Cluster
- Adastral Park
- Hethel Engineering
Centre
- Hertfordshire IT cluster
- Airbus Defence and
Space Stevenage
- Cranfield University
- Businesses in Cambridge are 4 times more
likely to focus on electronics and components
than the national average102
- The East of England has employment
specialisations in a number of electronics,
materials and engineering subsectors103
Future of Agri-
Food
Developing specialisations in
producing high-quality,
healthy, ethical and
sustainable food without
being unaffordable
The East of England has a unique
combination of high-quality farmland
and R&D focused on the agri-tech
and bioscience sectors, allowing for
both cutting edge research and
implementation
- National Institute of
Agricultural Botany (NIAB)
- Rothamsted Research
- John Innes Centre
- Quadram Institute
- Hertfordshire IQ
- Agri-Tech East
- Eastern Agri-Tech Growth
Initiative
- For the period 2004-16, the East of England
accounted for 35% of UK Research Council
Funding in plant and crop science; 24% in agri-
environmental science and 16% in food
science and nutrition104
- The East of England has a total farmed area of
1.4m hectares, accounting for 15.3% of total
farmed area in England (second to the South
West’s 19.3% share). 79% of the farmed area
is arable, by far the highest share and largest
arable area among English regions105
102 Tech Nation report 2015.
103 See Chapter 4 of this report.
104 East of England Science and Innovation Audit (2017).
105 https://www.gov.uk/government/statistics/agricultural-facts-england-regional-profiles

Economic Strategy for the East of England
87 Cambridge Econometrics
Future of
Construction
Taking the lead in novel
construction methods and
trends, including offsite
construction, build-integrated
technology, energy efficiency
The fact that the East of England
includes several of the fastest
growing housing markets in the UK,
combined with its proximity to
London, expertise in engineering and
innovation and specialisation in
construction, put the region in an
excellent position to take the future of
construction forward
- Hertfordshire IQ
- Hethel Engineering
Centre
- Building Research
Establishment (BRE)
Watford
- According to ONS data106, the East of England
ranks 3rd among regions in Great Britain in
concentration of construction firms, and 4th in
concentration of construction-specific
employment
- Apart from the Cambridgeshire and
Peterborough CA, all other LEP areas in the
East of England have an employment
specialisation in construction107
Future of
Professional
Services
Taking advantage of
technological advances that
can improve the productivity
of the sector, such as new
analysis tools, virtual offices,
digital platforms, cloud
services, sharing of specialist
tacit knowledge
The region is well-placed to tackle
this challenge due to its diverse mix
of local specialisations, knowledge
assets, dynamic business
environment and technological know-
how
- Cambridge Cluster
- Adastral Park
- Norwich financial services
cluster
- Ipswich insurance
services cluster
- The region has significant employment
specialisation in the professional, scientific and
technical activities and information and
communication sector108
106 ONS (2018). Construction statistics: Number 19, 2018 edition.
107 See Chapter 4 of this report.
108 See Chapter 4 of this report.

Economic Strategy for the East of England
88 Cambridge Econometrics
5 Regional Constraints and Interventions
5.1 Introduction
Chapter 5 outlines the challenges the region faces, lists the main interventions
that the local authorities have planned for the future and identifies some broad
potential solutions.
5.2 Constraints
The growth potential of the East of England and the corresponding manifold
benefits to the UK economy, society and the environment will not be realised
without intervention. There are significant constraints currently holding back
the development of the region, which, in order to be lifted, require joined-up
local and national government action, as well as coordinated input from
businesses. These include:
• Future growth prospects in the Greater Cambridge area are currently
severely constrained by its ability to provide realistically affordable
housing109 and commercial space for future firms and employees, and,
not least, its ability to efficiently move daily commuters around and
between its various employment hubs, many of which are on the urban
fringe where they have poor public transport connectivity. Similar
issues are also affecting Hertfordshire.110
• The northern and eastern fringes of the region (Fenland and areas of
Norfolk and Suffolk) suffer from issues associated with rural
peripherality, including patchy infrastructure provision, low levels of
enterprise and innovation111, as well as difficulty in attracting young
graduates and/or accessing suitably further education skilled local
workers112. The key here is to better integrate these peripheral areas
into the economic market areas of their local employment centres,
without compromising the high levels of natural capital that make them
unique and attractive areas in their own right.
109 According to the Cambridgeshire and Peterborough Independent Economic Review (2018), both the
house-price-to-earnings ratio and the ratio of private median rents to median income in most
Cambridgeshire district council areas are higher than the England average. Cambridge is the least
affordable: the average house price is 13 times higher than average earnings (for England it is 7.8), while
the median rent is 41% of the median income (the relevant value for England is 27%).
110 Housing delivery in the post-recession period has consistently lagged behind the planned targets, while
the housing affordability ratio has declined for all local authority districts in the county over the period 2013-
15 (Hertfordshire LEP, 2017).
111 48 businesses created per 10,000 residents compared to the UK average of 72, while only 14% of active
enterprises introduced a new or significantly improved process or service between 2010 and 2012, below
the UK average of 19% (New Anglia LEP, 2017b).
112 In 2015, 36.7% of workers in Norfolk and Suffolk had a qualification of the highest level (NQV4 and
above; for higher education this implies at least a bachelor’s degree), while at the national level the relevant
figure was 42.9% (New Anglia LEP, 2017b). Furthermore, over the academic years 2014-15, more students
left Norfolk and Suffolk to study elsewhere than those choosing to study in the area (ibid.).

Economic Strategy for the East of England
89 Cambridge Econometrics
• A challenge facing Essex is to tackle its disadvantaged urban
communities in coastal areas.113 Making better use of coastal assets,
including in transport and logistics, offshore renewables and tourism to
provide employment opportunities, is key here.
• A pressing issue to the south and west of the region is the availability
of employment land and premises.114 Permitted Development Rights
have led to a lot of commercial office space being repurposed as
apartments – leading to loss of employment premises, and most
notably, of the land they are on for future redevelopment. Therefore,
existing employment sites are being encroached by residential use –
and become impossible to consolidate and regenerate as fit-for-
purpose, campus-style technology parks and business centres.
• Another issue is that the districts bordering the M25 get a lot of low-
value activities migrating from London to low-amenity employment
sites. Furthermore, there exists a risk that the Oxford to Cambridge
greenfield housing and employment sites will further push down market
attractiveness of brownfield and (old) new towns in places like Herts
and West Essex.
• Despite significant knowledge assets, the region as a whole suffers
from low levels of graduate retention.115 This is partly due to the lack of
a single central conurbation with the diverse and exciting entertainment
offer available in London or Manchester. The region needs to consider
what its unique offer is to attract and retain young workers.
• Finally, there is acknowledged to be a lack of regional coordination
across all sectors, technologies, challenges and factors of productivity.
The right spatial level for coordination needs to be considered on a
case-by-case basis.
5.3 Interventions
This subsection presents a summary of interventions that the relevant
authorities (local and national) have planned for the East of England in the
near future. It starts by listing the initiatives of the Local Enterprise
Partnerships in the region, followed by other local and national projects. The
subsection concludes by identifying common themes across the policies of the
different LEP areas. A detailed list of interventions is included in Annex C.
113 Parts of the Tendring District in north East Essex are the most deprived parts in the country, according to
the Indices of Multiple Deprivation for England, published by the Department for Communities and Local
Governments (South East LEP, 2017). Furthermore, Castle Point in Essex is one of two authority areas in
the country with the smallest proportion of over-16s holding advanced qualifications (ibid.).
114 For example, vacancy rates of commercial property in Norfolk and Suffolk have been dropping
throughout 2012-16 (with the exception of Great Yarmouth), while incubation space is oversubscribed (New
Anglia LEP, 2017b).
115 CE analysis of Higher Education Statistics Agency (HESA) data shows that the share of graduates from
an East of England institution that are employed in the region stands at 53.3%, one of the lowest retention
rates in England (more specifically, only the East Midlands, South East and South West have lower rates).
When excluding those that did not live in the region prior to their studies, this figure falls to 10.6% (once
again 4th lowest in England).

Economic Strategy for the East of England
90 Cambridge Econometrics
A major funding source for local development projects are the ‘Growth Deals’.
Growth Deals between the government and the LEPs provide capital funding
through the Government’s Local Growth Fund for local projects or
programmes that promote economic growth and job creation. Three stages of
funding have been agreed thus far, with the third round completed in 2017.
Another major funding tool is the £730m Growing Places Fund, targeted
specifically at infrastructure projects.
Through the three phases of Growth Deals, the New Anglia LEP has been
awarded £290.8m, with £69m secured during the third phase. The major
ongoing and future projects of the LEP fall under the following categories:
1 Infrastructure: Projects include transport infrastructure improvements and
expansions, aimed primarily at alleviating traffic congestion and supporting
housing development and key employment sites. Furthermore, significant
amounts will be allocated along the coastline in order to improve flood
defences (primarily in Great Yarmouth) and to a sandscaping scheme that
aims to protect the Bacton Gas Terminal and gas infrastructure from
erosion, while also bringing additional benefits to tourism and recreation.
Finally, the LEP will commit resources to digital infrastructure, aiming to
increase the coverage of superfast broadband in Norfolk and Suffolk.
2 Jobs, education and skills: Here the major initiatives are targeted at
improving skills that are important for the key sectors of the local economy
(including energy, maritime, information technology, engineering and ICT)
by funding specialist skills centres, such as the Energy and Engineering
Skills Centre of Excellence on East Coast College’s Lowestoft campus.
Furthermore, the LEP is developing Sector Skills Plans, which aim to
identify the skills needs of the most important sectors of the local economy
and develop plans to ensure these needs are met. 116
3 Enterprise: Measures here include a new angel investment programme to
support innovative start-ups, a new business park (Atex Business Park) on
brownfield land and the expansion of the Great Yarmouth Energy Park.
For the Greater Cambridge Greater Peterborough area, local authorities have
secured funds of £146.7m to be spent between 2015 and 2021 through the
Growth Deal, of which £98m has already been committed to projects. The
allocation of the remaining funds is still under consideration, with the call for
major projects closing in November 2018. For Greater Cambridge and Greater
Peterborough, the main themes for the third stage are: housing delivery;
transport; innovation and business growth; skills infrastructure and Enterprise
Zones.
The emerging themes from the ongoing or planned projects are:
1 Transport: Road infrastructure improvements to tackle traffic congestion
and stimulate economic and housing development in Whittlesey and
Wisbech, as well as a rail study for the latter area.
2 Innovation: Funding for the new Haverhill Innovation Centre, as well as the
Eastern Agri-Tech Growth Initiative aimed at facilitating innovation in the
food, drink and horticulture sectors.
116 https://newanglia.co.uk/sector-skills-plans/
LEP initiatives
New Anglia LEP
Cambridgeshire
and
Peterborough CA

Economic Strategy for the East of England
91 Cambridge Econometrics
3 Enterprise: Projects to unlock commercial land and/or jobs.
4 Housing: Funding for housing development projects in East
Cambridgeshire, Ely and Peterborough, aiming to increase the supply of
affordable housing.
The main planned strategic projects for the Hertfordshire LEP are listed below:
1 Town centre improvements: Funding of projects that aim to improve the
attractiveness of various towns in the LEP area (Stevenage, Bishop’s
Stortford, Hatfield, South Oxhey) through the development of new streets,
housing, public places and office space.
2 Garden towns: Support for the development of the garden towns of Hemel
and Harlow & Gilston, targeting to boost job and new housing creation.
3 Road infrastructure: Projects to improve traffic conditions and flood
defences close to important residential and employment sites.
4 Innovation and skills: Funding support for new the new multi-site
Enterprise Zone Hertfordshire Innovation Quarter (IQ), as well as a
number of specialist research and skills centres and business parks (see
Annex C for more details).
The main upcoming and ongoing South East LEP projects for Essex aim to
support important employment and population hubs. The main areas of focus
are:
1 Infrastructure: Improvement and expansion of the road network to increase
safety and reduce journey times in key spots of the network, including
separate transport packages for the cities of Colchester and Basildon. It is
expected that these projects will boost employment and housing
construction, as well as provide better access to the Stansted Airport.
Furthermore, there are plans to fund the development of a new multi-
modal interchange and new station buildings to support transportation from
and to the port of London Gateway/Stanford le Hope.
2 City improvements: Redevelopment of town centres by providing new
public spaces, commercial property and road capacity improvements, as
well as a major new railway station in Chelmsford. These are expected to
aid housing development in the designated areas.
The main SEMLEP projects in the Bedfordshire area include:
1 Road infrastructure: The most important projects aim to improve access to
Luton Airport, as well as alleviate traffic congestion in the town of Bedford
with a view to increasing business productivity. These projects are also
expected to help create new jobs and houses in the designated areas.
2 City improvements: Funding for the Luton Hat District to create a network
of creative and digital industry workspaces in Luton. The projected outputs
include new jobs, usable floor space and creation of new start-ups and
more new opportunities for skills-based learning.
3 Skills: Funding support for the Business, Skills and Innovation Centre in
Luton and the STEM Teaching Block Provision project in Bedford.
Hertfordshire
LEP
South East LEP
(Essex)
South East
Midlands LEP –
SEMLEP
(Bedfordshire)

Economic Strategy for the East of England
92 Cambridge Econometrics
4 Technology: The key project is the Variable Temperature Emissions
Chamber for HGVs in Millbrook, which will be important for testing fuel
emissions and the performance of electric vehicles.
City Deals are agreements negotiated between the central government and
local bodies (local authorities, LEPs, other entities) that grant the latter
decision-making powers and funding to form and implement locally focussed
growth plans. Four such deals have been agreed in the East of England:
• Greater Cambridge City Deal: the Deal primarily focuses on investment in
infrastructure, housing development and improving the local skills supply
(including creating a locally responsive skills system). The anticipated
benefits of the Growth Deal include the establishment of an infrastructure
investment fund, the accelerated delivery of more than 30,000 homes and
the development of 1,000 new ones, the creation of 45,000 jobs and 400
apprenticeships.
• Greater Ipswich City Deal: the main focus of the Greater Ipswich City Deal
is to tackle youth unemployment and to enhance the level of skills in the
local economy. It includes the development of a locally responsive skills
system and programmes to support unemployed people aged 16-24 years
old and to maximise employer investment in skills, complemented by a
business support package. The Deal is estimated to deliver new jobs and
apprenticeships for young people and additional private and local public
investment in skills.
• Greater Norwich City Deal: the Deal is structured in three strands:
supporting businesses through enterprise and innovation initiatives;
developing essential infrastructure and housing; and creating a locally-
responsive skills system to maximise employer involvement and
investment. The City Deal is predicted to help create more than 19,000
jobs (among which are 3,000 high-value jobs in the Norwich Research
Park) speed up housing delivery and create 3,000 additional houses in the
North East Norwich Growth Triangle.
• Southend-on-Sea City Deal: the main aim of the £6m City Deal is to
support business creation and growth.
Two major infrastructure projects of national significance in the East of
England area include the Cambridge-Oxford Expressway and East-West Rail.
These projects share the main target of improving connectivity along the
Cambridge-Milton Keynes-Oxford Corridor, an area with major hubs of
research, innovation, technology, entrepreneurship and advanced
manufacturing.
Furthermore, Highways England has planned a number of major projects in
critical road arteries along the East of England. A full list is provided in Annex
C.
City Deals
Other initiatives
National projects

Economic Strategy for the East of England
93 Cambridge Econometrics
East of England summary
A cross-cutting theme across the LEPs is that investment in transport
infrastructure (in particular the road network), is the area of largest
expenditure. This underlines the importance that the LEPs place on
connectivity between and within regions and places, as well as the strain
that population growth has placed on current infrastructure. This is further
reflected in the SEPs, in which transport strategy is typically given a
prominent position. While each LEP identifies the strategic corridors that
are the most significant for economic growth, there are some common
denominators: the London-Stansted-Cambridge Corridor and the
Cambridge-Milton Keynes-Oxford Arc, both of which have major
technological, research and innovation assets. Within the LEP areas,
transport initiatives are aimed at improving productivity and living
conditions in the major urban centres by reducing traffic congestion.
Furthermore, a number of transport initiatives are designed to support
Enterprise Zones, innovation parks and new housing development outside
the large population centres.
Affordable housing is a major policy area for the LEPs in the East of
England. Apart from improving transport infrastructure, the LEPs have also
planned several initiatives to directly boost the provision of new homes and
transform cities and towns. Such measures include city regeneration
schemes, support for the creation of Garden Towns and Villages and
grants and loans for housing development.
Another emerging theme from the Strategic Economic Plans (SEPs) is the
acknowledgment of skills shortages and mismatches with local employer
needs as significant challenges, compounded by the demands of
technological progress. Hence, another major strand of LEP investment is
directed towards programmes and projects that aim to increase the level of
skills and knowledge stock in the local economies, particularly in Science,
Technology, Engineering and Mathematics (STEM) subjects. These
include the construction of new facilities or the upgrading of old ones within
higher education institutions and the establishment of new skills and
research centres.
Skills-supporting initiatives are also linked with promoting innovation, which
is a further shared target among the LEPs. To this end, the LEPs have
committed significant resources to creating innovation centres connected
to business hubs or research institutions, as well as financing smaller
schemes aimed at supporting business R&D.
An important part of the SEPs is to promote business creation and growth,
as well as the development of regional networks and clusters. A major
obstacle is the loss of employment space to housing development, which is
contributing to the increasing cost of business premises in the East of
England. Hence, significant investment is directed towards the
establishment and support of Enterprise Zones, business incubators and
business parks, as well as the regional Growth Hubs. Expansion and
improvement of digital infrastructure, a measure that would help improve
business competitiveness and innovation, is also a target shared among
many of the LEPs.

Economic Strategy for the East of England
94 Cambridge Econometrics
5.4 Potential solutions
One of the region’s biggest challenges, shared across all local jurisdictions, is
that several areas have a severe shortage of housing and employment space
provision, while other areas struggle to attract and keep residents and
businesses.117 Improvement and expansion of the regional transport network,
especially close to and between employment centres, is crucial in alleviating
the pressure in the high-demand areas around the region, while also helping
boost productivity and enhancing knowledge exchange and strategic
connections both within the region and with neighbouring regions. Transport
infrastructure improvements would also help the more peripheral areas
improve their offer to potential new residents and businesses, as well as
unlock new spaces for commercial and housing development.
The problem of attracting and retaining employees, particularly when it comes
to young graduates, could be further improved through creative place-making
and diversification of the entertainment options available.
Another important, and linked, intervention would be to facilitate the diffusion
of knowledge and employment opportunities within the region, as there are
large disparities between urban and rural areas, and to a lesser degree,
between some of the different urban centres as well. Supporting further and
in-work education provisions across the region could be helpful in this regard,
as well as providing incentives for business creation in disadvantaged areas
and collaboration of the commercial, research and public sectors across the
region.
Even though the East of England is at the forefront of technological
progress118, not all firms in the region have taken advantage of this. A
programme designed to encourage and facilitate the adoption of new
technology and procedures across all sectors would see better use made of
the region’s considerable knowledge assets.
Finally, in order to effectively address the problems holding back the region’s
potential, better coordination of the regional authorities is key. Unlike the
‘Powerhouse’ in the North and the ‘Engine’ in the Midlands, the East of
England does not currently have a unified strategy representing the region as
a whole. Nevertheless, it is evident that the areas making up the East of
England face several issues that are of similar nature or are, in a way,
complementary. Hence, it is important that the regional and local authorities
coordinate and collaborate in planning for the future development of the East
of England, so as to avoid contradictory policies, spot and solve problems
faster and more efficiently, and fully unlock the region’s potential.
117 In the New Anglia LEP area, the figure of people per job ranges from 1.56 in Norwich and 1.8 is St.
Edmundsbury to 2.85 in Waveney and 3.17 in North Norfolk (New Anglia LEP 2017a; 2017b). Furthermore,
in the Cambridgeshire and Peterborough Combined Authority area, there is evidence that housing
completions in more rural districts have fallen in recent years, while in the cities of Cambridge and
Peterborough housing delivery has accelerated (CPIER, 2017).
118 UK Innovation Survey data for 2014-16 show that the East of England is the 2nd most innovative English
region (narrowly behind the South East), with more than half of the businesses in the survey being
innovation active (The UK Innovation Survey: Headline Finding 2014 to 2016, 2018). Furthermore, as of
2017, the East of England is 2nd with 19.7% of total UK business R&D spend, with the South East being 1st
with 20.5%. (Department for Business, Energy & Industrial Strategy, 2017).

Economic Strategy for the East of England
95 Cambridge Econometrics
6 References
Brunner, H.-P. (2013). What is Economic Corridor Development and What
Can It Achieve in Asia’s Subregions? Working Paper Series on
Regional Economic Integration, Asian Development Bank. Cambridgeshire and Peterborough IER. (2018). The Cambridgeshire and
Peterborough Independent Economic Review. Cambridge.
Department for Business, Energy & Industrial Strategy. (2017). East of
England Science and Innovation Audit.
Department for Business, Energy & Industrial Strategy. (2017). Industrial
Strategy: building a Britain fit for the future. London, United Kingdom.
Department for Business, Energy and Industrial Strategy. (2018). The UK
Innovation Survey: Headline Finding 2014 to 2016. London, United
Kingdom.
Department for Environment, Food & Rural Affairs. (2019). Agricultural facts:
England regional profiles.
East of England Science and Innovation Audit Steering Group . (2017). East of
England Science and Innovation Audit.
Essex Economic Commission. (2017). Enterprising Essex: Opportunities and
Challenges. Essex.
Essex Economic Commission. (2018). Enterprising Essex: Meeting the
Challenge.
Hertfordshire LEP. (2017). Perfectly Placed for Business: Refreshed Strategic
Economic Plan.
Hertfordshire LEP. (2017b). Perfectly Placed for Business: The Refreshed
Strategic Economic Plan 2017-2030.
New Anglia LEP. (2017a). New Anglia Economic Strategy.
New Anglia LEP. (2017b). Economic Strategy Evidence Report.
New Anglia LEP. (2017c). Integrated Transport Strategy for Norfolk and
Suffolk.
South East LEP. (2017). Strategic Economic Plan Evidence Base.
Tech Nation. (2018). Tech Nation Report 2018.
Tech Nation. (2019). Tech Nation Report 2019.
Voltera Partners . (2017). Growth in the East of England and the role of
Stansted: An Economic Review.

Economic Strategy for the East of England
96 Cambridge Econometrics
Annex A: Literature overview
Table A1 lists the literature reviewed so far and provides a brief overview of
contents in the form of a chapter list.
Table A1: Literature on Local Enterprise Partnerships (New Anglia LEP, Greater Cambridge-Greater Peterborough CA, Hertfordshire LEP, and part of South East LEP, SE Midlands LEP); LADs and cities; and non-governmental entities (e.g. CNTC, CamKOx,
LSCC Growth Commission)
Literature and author Chapter list
Economic Strategy Evidence Report
(New Anglia LEP, 2017)
1. Economic profile at a glance,
2. Executive summary
3. People, demography and skills
4. Employment, jobs and earnings
5. Economic growth, productivity and living
standards
6. Our business base and its characteristics
7. Enterprise, innovation and competition
8. Trade, investment and overseas capital
9. Land use, housing and infrastructure
10. Sectors and supply chains
11. Glossary and compendium of data
sources
Norfolk and Suffolk Economic Strategy
(New Anglia, 2017)
1. Foreword
2. Norfolk and Suffolk 2017
3. Our Sectors
4. Our Ambitions
5. Priority Themes and Places
6. Making it Happen
New Anglia LEP developing a LIS for
Norfolk and Suffolk (links to a website)
Site with infrastructure-related material
1. Material which might be informative for
this project
Interactive investment map of Norfolk
and Suffolk (New Anglia LEP, 2018)
Map has information on Enterprise Zone sites
Cambridgeshire and Peterborough
Strategic Bus Review (CPCA, 2019)
1. Interventions in the cities’ networks
2. Rural and inter-urban bus services
3. Delivering modern public transport
4. Implementation and transition plan
Cambridgeshire and Peterborough
Independent Economic Review (CPCA,
2018)
1. Overview of area (historical, economic
growth/geography, market towns, natural
assets)
2. The future of CP
3. Business
4. Housing
5. Infrastructure

Economic Strategy for the East of England
97 Cambridge Econometrics
6. Health and well-being
7. Early Years, education, and skills
8. Market towns
9. Governance
Cambridgeshire and Peterborough
Strategic Spatial Framework (CPCA,
2018)
1. About Cambridgeshire and Peterborough
2. Strategic spatial issues
3. Supporting delivery of the development
strategy in local plans to 2036
4. Inclusive growth
5. Wider spatial context and working with
neighbouring areas
6. Next steps: opportunities for developing
the strategic spatial framework to 2050
Strategic Economic Plan: 2017-2030
(Hertfordshire LEP, 2017)
1. Understanding Hertfordshire’s economic
engine
2. wilder trends and drivers
3. our strategy
4. priorities (maintaining global excellence in
science and tech, harnessing our
relationship with London and elsewhere,
re-invigorating our places for the 21st
century, foundations for growth)
5. delivering ‘perfectly placed for business’
6. measuring success
Brexit & Hertfordshire: Understanding
the risks and potential impacts
(Hertfordshire LEP, 2018)
1. Exec summary
2. understanding Brexit
3. estimating potential Brexit risks for
Hertfordshire
4. Brexit impact studies
5. Additional data used to assess Herts’
Brexit risks
Building our Industrial Strategy – Our
response to the UK Government
Industrial Strategy (Hertfordshire LEP,
2018)
1. Intro (the case for a modern industrial
strategy)
2. Challenge 1: building on our strengths and
extending our excellence into the future
3. Challenge 2: Ensuring that every place
meets its potential by working to close the
gap between our best performing
companies, industries, place and people
and those which are less productive
4. Challenge 3: Making the UK one of the
most competitive places in the world to
start or grow a business
5. Conclusion: Delivering a modern Industrial
Strategy and Herts LEP’s agenda for
action
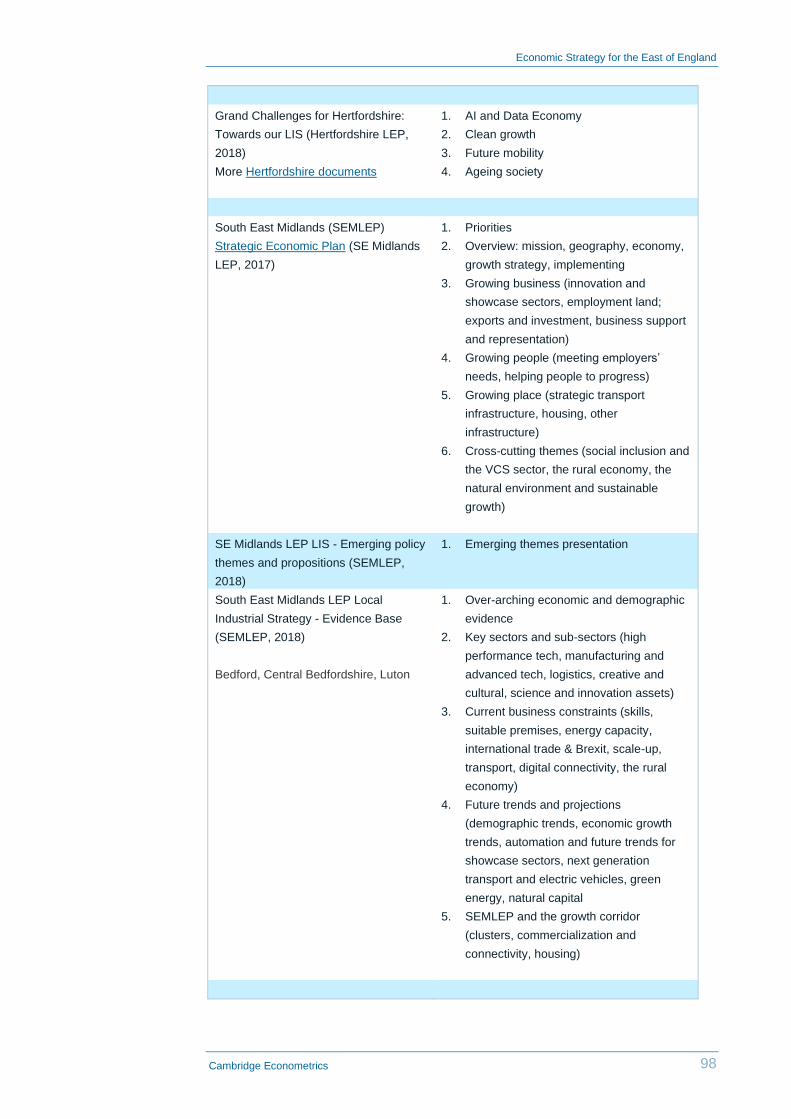
Economic Strategy for the East of England
98 Cambridge Econometrics
Grand Challenges for Hertfordshire:
Towards our LIS (Hertfordshire LEP,
2018)
More Hertfordshire documents
1. AI and Data Economy
2. Clean growth
3. Future mobility
4. Ageing society
South East Midlands (SEMLEP)
Strategic Economic Plan (SE Midlands
LEP, 2017)
1. Priorities
2. Overview: mission, geography, economy,
growth strategy, implementing
3. Growing business (innovation and
showcase sectors, employment land;
exports and investment, business support
and representation)
4. Growing people (meeting employers’
needs, helping people to progress)
5. Growing place (strategic transport
infrastructure, housing, other
infrastructure)
6. Cross-cutting themes (social inclusion and
the VCS sector, the rural economy, the
natural environment and sustainable
growth)
SE Midlands LEP LIS - Emerging policy
themes and propositions (SEMLEP,
2018)
1. Emerging themes presentation
South East Midlands LEP Local
Industrial Strategy - Evidence Base
(SEMLEP, 2018)
Bedford, Central Bedfordshire, Luton
1. Over-arching economic and demographic
evidence
2. Key sectors and sub-sectors (high
performance tech, manufacturing and
advanced tech, logistics, creative and
cultural, science and innovation assets)
3. Current business constraints (skills,
suitable premises, energy capacity,
international trade & Brexit, scale-up,
transport, digital connectivity, the rural
economy)
4. Future trends and projections
(demographic trends, economic growth
trends, automation and future trends for
showcase sectors, next generation
transport and electric vehicles, green
energy, natural capital
5. SEMLEP and the growth corridor
(clusters, commercialization and
connectivity, housing)

Economic Strategy for the East of England
99 Cambridge Econometrics
South East LEP Strategic Economic
Plan – Evidence Base119 (SELEP 2017)
1. Scope of evidence base
2. Why addressing productivity is more
important than ever before
3. Other structural issues that could further
impact on our future productivity
4. The UK Govt’s strategy for tackling these
issues and our low productivity
5. The characteristics of the SE LEP
economy
6. Cultivating world-leading sectors
7. Developing skills, employability &
business capabilities
8. Science; research and innovation,
business start-up and growth
9. Encouraging trade and inward investment
10. Infrastructure
11. Conclusion
Local Energy East Strategy – An
Energy Strategy for the Tri-LEP Area
(Cambridge and Peterborough CA-
Hertfordshire, New Anglia LEPs, 2018)
1. Objectives – themes (clean economic
growth, housing growth and commercial
site infrastructure, secure; local;
affordable; low-carbon consumption, clean
transport networks)
2. Context (global energy, policy, Industrial
Strategy, UK clean growth strategy, the
local energy East strategy, Energy
networks: challenges and opportunities)
3. Clean economic growth
4. Housing growth and commercial site
infrastructure
5. Secure; affordable; low-carbon
consumption
6. Clean transport networks
7. Future work
There are 47 LADs in the East of
England, most of which have working
Local Plans (often coordinated with
LAD groups and County Councils)
LAD Local Plans set out the area’s economic
development strategy setting out the vision,
policies and proposals for the future. These
plans cover areas on spatial planning, housing
provision, business support and employment
growth, transport and other infrastructure
provision
Economic Growth Potential of the
Cambridge Norwich Technology
Corridor (Cambridge Econometrics for
Breckland Distict Council, 2017)
1. Introduction (background and corridor
definition)
2. Context (local, regional and national)
3. Ambition 1: Cluster development
119 Included because scope document refers to ‘…and part of SE LEP’. This publication also
refers to material on Essex and other East of England geographies which lie within the project
focus area.

Economic Strategy for the East of England
100 Cambridge Econometrics
4. Ambition 2: Accommodating the spatial
expansion of the major city regions
5. Ambition 3: Ensuring inclusive growth
6. Conclusions
London Stansted Cambridge Growth
Corridor (LSCC Growth Commission,
2016)
1. Economic performance
2. Business, innovation and industry
3. People
4. Place
5. Travel to work and transport
6. Findings from existing local evidence
The next global knowledge region:
setting the ambitions and delivering the
vision (LSCC Growth Commission,
2016)
1. Findings from evidence and inquiry events
2. Ambition: our vision for the London-
Stansted-Cambridge corridor
3. Delivery: cooperation and collaboration
can deliver a step-change
Growth in the East of England and the
Role of Stansted – an economic review
(Volterra, 2017)
1. East of England economic context
2. Future growth in the East of England
(projections, challenges and opportunities
for future growth, growth scenarios,
infrastructure costs of growth)
3. The importance of Stansted to the region
(Stansted current economic importance,
the case for expansion at Stansted)
4. The need for a long-term vision
East of England science and innovation
audit, 2017
1. Introduction to the East of England
Science and Innovation area
2. Strengths in science and innovation
3. Theme 1: Life sciences
4. Theme 2: Agri-tech
5. Theme 3: Advanced material and
manufacturing
6. Theme 4: ICT
7. Conclusion
8. Annexes A-E on i) how the East of
England’s science and innovation audit
was developed, ii) high level business
cases for priority interventions iii) LEPs’
commitment to science and innovation in
their SEPs iv) list of stakeholders who
contributed to the SIA v) maps from
chapter 1
9. Appendices 1-4 containing theme
reports/evidence on life sciences, agri-
tech, advanced materials and
manufacturing, and ICT

Economic Strategy for the East of England
101 Cambridge Econometrics
Growing together – cities and regions
collaborating on shared priorities.
This report is an agenda for growing
together, and a statement of intent by
four business groups (London first,
North West Business Leadership Team,
the Northern Powerhouse Partnership,
and Business North)
1. Growing together for national prosperity
2. Mapping economic activity in UK
3. The North: capabilities and potential
4. The UK’s economically significant clusters
5. A shared agenda for growth
Recommendations: growing together to
compete in the global economy
Notes: Note: CPCA’s SEP is from 2014 under GCGP. CNTC refers to the Cambridge-Norwich
Technology Corridor. Source: Cambridge Econometrics.

Economic Strategy for the East of England
102 Cambridge Econometrics
Annex B: Productivity and Employment Density by Local Authority
A.1 Productivity

Economic Strategy for the East of England
103 Cambridge Econometrics

Economic Strategy for the East of England
104 Cambridge Econometrics

Economic Strategy for the East of England
105 Cambridge Econometrics

Economic Strategy for the East of England
106 Cambridge Econometrics

Economic Strategy for the East of England
107 Cambridge Econometrics

Economic Strategy for the East of England
108 Cambridge Econometrics

Economic Strategy for the East of England
109 Cambridge Econometrics

Economic Strategy for the East of England
110 Cambridge Econometrics
A.2 Employment Density

Economic Strategy for the East of England
111 Cambridge Econometrics

Economic Strategy for the East of England
112 Cambridge Econometrics

Economic Strategy for the East of England
113 Cambridge Econometrics

Economic Strategy for the East of England
114 Cambridge Econometrics

Economic Strategy for the East of England
115 Cambridge Econometrics

Economic Strategy for the East of England
116 Cambridge Econometrics

Economic Strategy for the East of England
117 Cambridge Econometrics

Economic Strategy for the East of England
118 Cambridge Econometrics
Annex C: Detailed Interventions
A major funding source for local development projects are the ‘Growth Deals’.
Growth Deals between the Government and the LEPs provide capital funding
through the Government’s Local Growth Fund for local projects or
programmes that promote economic growth and job creation. Three stages of
funding have been agreed thus far, with the third round completed in 2017.
Another major funding tool is the £730m Growing Places Fund, targeted
specifically at infrastructure projects.
New Anglia LEP
The New Anglia LEP has identified the following areas as “Priority Places”
based on the opportunities they provide for continued growth:
• Ipswich and the surrounding area
• Norwich and the Greater Norwich area
• The Norfolk and Suffolk Energy Coast, including Bacton, Great Yarmouth,
Lowestoft and Sizewell, with assets on and offshore
• The Cambridge-Norwich growth corridor – connecting two global centres
of research
• The east-west growth corridors along the A47 from Lowestoft and Great
Yarmouth to King’s Lynn, plus the A14 from Felixstowe through Ipswich,
Stowmarket, Bury St Edmunds, Newmarket and Haverhill to Cambridge
and Peterborough
• King’s Lynn - and the A10 and rail corridor to Cambridge
Through the three phases of Growth Deals, the New Anglia LEP has been
awarded £290.8m, with £69m secured during the third phase. Some of the
major ongoing projects that have received support from Growth Deal funds
include:
1 Infrastructure
• Transport:
Third River Crossing in Great Yarmouth (£120m; £2m from New Anglia LEP), aimed to support Great Yarmouth as centre for both offshore renewable energy and the offshore oil and gas industry, as well as improving access and strategic connectivity to the port
Eye Airfield Link Road (£5.4m; £1.46m from New Anglia LEP), which will improve journey time reliability and road safety and support the Eye Airfield Development Area, including the delivery of 600 new homes and 2,000 new jobs
Hempnall Roundabout (£4.4m; £0.651m from New Anglia LEP), was completed in November 2019 and is expected to help improve congestion and safety at the junction, as well as contribute to the delivery of 1,800 homes and 9.5 acres of employment space
- Transport packages to improve traffic conditions and accessibility for Thetford (£2.386m), Ipswich (£3.5m), Great Yarmouth (£8.875m), Attleborough (£4.621) and Norwich (£7.35m for the city centre and
LEP initiatives

Economic Strategy for the East of England
119 Cambridge Econometrics
£3.825m for other areas). Furthermore, the transport packages are expected to support the creation of new jobs and housing development
• Digital: Better Broadband for Suffolk and Better Broadband for Norfolk
programmes (£5m each) to extend the coverage of superfast broadband
• Other:
Flood defences in Great Yarmouth (£39m; £8.2m from New Anglia LEP) and Lowestoft (£69m; £10m from New Anglia LEP) to protect existing homes and businesses from flooding in the and to enable investment and economic growth in the area by protecting existing jobs and providing new employment opportunities
- Bacton to Walcott Coastal Management: a sandscaping scheme that was completed in Summer 2019 to protect the Bacton Gas Terminal and gas infrastructure from erosion, while also bringing additional benefits to tourism and recreation (£17-22m; £1.08m from New Anglia LEP)
2 Jobs, education and skills
• The Energy and Engineering Skills Centre of Excellence on East Coast
College’s Lowestoft campus, an £11.3m project (with £10m funding from
the New Anglia LEP) that opened in November 2019 .The Centre will
boost the development of technical skills and professional expertise in the
sectors of energy, maritime and engineering.
• The LEP has awarded £14.6m in capital funding for four new projects that
will improve the digital and information technology skills of the workforce
and boost innovation:
Digital Skills & Innovation Accelerator at the University of Suffolk (£6.5m): an Information and Communication Technology (ICT) research centre, aiming to “enhance productivity in sectors which use ICT as a key enabler”.
Digi-Tech Factory at City College Norwich (£6.1m): a building to host innovative IT workshops and facilities.
Digital & Technology Skills Hub at Suffolk New College (£1.6m): the Hub will offer courses and support for individuals to progress into higher education and higher-level apprenticeships.
- Norfolk & Suffolk Innovation Network (£0.4m): a network to promote Internet of Things (IoT) technology in Norfolk and Suffolk.
• The New Anglia LEP received resources from a £5m national fund to
deliver the New Anglia Careers Hub, one of 20 Career Hubs around
England. The Hub is made up of 32 local schools and colleges in Ipswich,
Norwich and along the A140 corridor, working together with universities,
training providers, employers and career professionals to improve careers
education. The Hub also works closely with the schools and boards of the
Ipswich and Norwich Opportunity Areas and the New Anglia Enterprise
Adviser Network.
3 Enterprise
• New Anglia Capital is an angel investment programme co-funded by the
New Anglia LEP and the Anglia Capital Group that supports innovative
start-ups and high-growth firms in Norfolk and Suffolk. About £3.5m has

Economic Strategy for the East of England
120 Cambridge Econometrics
been invested since the inception of the programme in 2014 to May 2018,
with the New Anglia LEP pledging a further £1m in mid-2018.
• A new business park, the Atex Business Park, is currently being
constructed on brownfield land close to the A14, supported by the New
Anglia LEP through loan funding of £0.63m.
• Brineflow Properties and Handling Ltd has made a £4m investment (with
support from the New Anglia LEP) in the Great Yarmouth Energy Park,
constructing “modern liquid fertiliser tanks, storage vessels and
manufacturing and processing equipment, supported by new underground
pipework to carry the imported fertiliser from ship tankers in the river port”.
Cambridgeshire and Peterborough CA
Some of the major ongoing projects in Greater Cambridge and Greater
Peterborough are listed below:
1 Transport
• New King’s Dyke level crossing: this project will tackle the current
congestion at the level crossing and provide future economic expansion
and housing stimulation within the Whittlesey area. The CA will provide
funding contribution of up to £16.4 million over the original £13.6 million
allocation to enable the scheme to progress to construction. Work is due to
begin in late 2020 and the project is scheduled to complete by the end of
2022.
• Wisbech road improvements and Wisbech rail study: The Cambridgeshire
& Peterborough CA allocated £10.5 million to a package of improvements
to the road system around Wisbech. The highway improvements will
stimulate housing, economic and jobs growth in the town, with the funding
coming via the Government’s Growth Deal package. A budget of £1.5
million was also approved to fund a detailed study into delivering a rail link
between Wisbech and March. The study will satisfy the requirements of
what is known as the GRIP 3b stage – part of Network Rail’s wider eight-
stage process for bringing rail infrastructure projects to completion.
2 Innovation
• Haverhill Innovation Centre: A new Innovation Centre located on Haverhill
Research Park, part of the Cambridge Compass Enterprise Zone. The
Centre is due to be completed in September 2020.
• Eastern Agri-Tech Growth Initiative: The Eastern Agri-Tech Growth
Initiative provides a boost to the food, drink and horticulture sectors by
supporting businesses looking to invest in specialist equipment, new
market and supply chain development, ways to improve productivity and
efficiency, and the application and commercialisation of Research and
Development. The initiative is run by the CA with support from New Anglia
LEP, Norfolk County Council, and the local authorities covering the two
LEP areas. In 2018, the CA agreed to extend the project to 2021, with a
further £4 million available to businesses.
3 Enterprise

Economic Strategy for the East of England
121 Cambridge Econometrics
• Growing Places Fund Extension: A £16.6m project as a successor to the
Growing Places Fund, primarily focused on projects which will unlock
commercial land and/or jobs. Investments are a mixture of grants and
loans.
4 Housing
• The CA has agreed to fund housing projects in East Cambridgeshire, Ely
and Peterborough through loans or grants of total value up to £32.6m.
For the Greater Cambridge Greater Peterborough area, local authorities have
secured funds of £146.7m to be spent between 2015 and 2021 through the
Growth Deal, of which £98m has already been committed to projects. The
allocation of the remaining funds is still under consideration, with the call for
major projects closed in November 2018. All programmes other than the call
for major projects opened for new application 22 July 2019. For Greater
Cambridge and Greater Peterborough, the main themes for the third stage
are: housing delivery; transport; innovation and business growth; skills
infrastructure and Enterprise Zones.
The Cambridgeshire and Peterborough CA published its new Local Transport
Plan (LTP)120 for the area in June 2019. The Transport Delivery Plan (2019 to
2035) contained within the LTP includes commitments to taking forward a
number of major infrastructure projects, including the dualling of the A10 road
between Cambridge and Ely, the development of a metro system for Greater
Cambridge (the Cambridgeshire Autonomous Metro – CAM), the improvement
of the A47 corridor and new rail stations in Soham and Cambridge South as
well as a new rail link to Wisbech. The LTP also commits to implementing
recommendations from the Strategic Bus Review within Greater Cambridge, to
ensure a more reliable, better quality and more attractive bus network for
passengers.
A longstanding target of local authorities and stakeholders has been the
establishment of an independent university in Peterborough. The new
University of Peterborough is due to open in 2022, with building work on the
site due to commence by October 2020. The CA has committed £12.6m to the
project so far.
Further investment in affordable housing has been planned as well. The CA is
providing £170m in grants, loans, guarantees and joint ventures towards the
development of 2,500 new affordable homes between 2017 and 2022.
Hertfordshire LEP
The main planned strategic infrastructure projects for the Hertfordshire LEP
are listed below:
1 Town centre improvements
• Stevenage Town Centre transformation: the project is part of 20-year
regeneration programme of Stevenage, with work on the first phase
120 The Transport Act 2000 requires local authorities to publish a Local Transport Plan (LTP) outlining their
policies regarding transport infrastructure, while the Transport Act 2009 added an additional requirement
that ‘proposals for the implementation of those policies’ must be specified as well. These proposals are
sometimes contained in a separate document, the Long-Term Transport Strategy (LTTS).

Economic Strategy for the East of England
122 Cambridge Econometrics
commencing in 2020. The gross development value of the project is
estimated at £350m, with funding from several partners, including
Hertfordshire LEP (£34m), Stevenage Borough Council, Hertfordshire
County Council and Hertfordshire Chamber of Commerce. The plan
includes the development of new streets, housing, public places and a
public services hub.
• Bishop’s Stortford town centre regeneration: as part of a multi-million
project to revitalise the town centre, the Hertfordshire LEP will provide
£9.6m in grant and loan funding towards building a new leisure quarter
with commercial space, a new arts and public services hub, a car park, a
new public square, green and office space.
• Hatfield town centre regeneration: a £6m investment will help transform
the town centre of Hatfield, with £4.8m allocated to residential and retail
developments and £1.2m to the redesign of the White Lion Square.
• South Oxhey regeneration: the Hertfordshire LEP will contribute £2.25m to
the £150m plan to provide high-quality homes and retail space in the town
of South Oxhey.
2 Housing
• Garden towns: The Harlow & Gilston Garden Town will receive £0.7m from
the government in order to accelerate its development, while Hemel
Garden Communities was announced as one of five new garden towns
that will receive funding from the Ministry of Housing, Communities & Local
Government. The former is expected to deliver up to 24,000 new homes
and the latter up to 11,000, while both are expected to boost job creation in
the local area.
3 Road infrastructure
• A120 bypass (Little Hadham) and flood alleviation scheme: the aim of the
£30m project is to alleviate congestion lose to the village of Little Hadham
and to reduce the risk of flooding. The Hertfordshire LEP invested £8.26m
and helped secure funding from the Department of Transport (£27.4m) as
part of a wider funding package, with the Environment Agency and
Hertfordshire County Council. Construction began in July 2019 and is
expected to be completed by the end on 2020.
• New River bridge on Essex Road, Hoddesdon: the project will improve
access and safety conditions for commercial and leisure vehicles, as well
as cyclists and pedestrians entering and exiting the Hoddesdon Business
Park. The Hertfordshire LEP will provide £6.5m for the project, with
Hertfordshire Country Council and Broxbourne Borough Council
contributing. Work to prepare the site for construction began in October
2019, and construction will begin in early 2020.
4 Innovation and skills
• Hertfordshire Innovation Quarter (IQ): Hertfordshire IQ is a multi-site
Enterprise Zone that is being developed by a partnership led by the
Hertfordshire LEP and including the Hertfordshire County Council, St
Albans City and District Council and Dacorum Borough Council. It is

Economic Strategy for the East of England
123 Cambridge Econometrics
expected to deliver 8,000 new jobs and space for 800 businesses upon
completion.
• Vaccinology & Cell Therapy Hub: The Hertfordshire LEP awarded the
Royal Veterinary College with £7m to support the development of a
Veterinary Vaccinology & Cell Therapy Hub on its Hawkshead campus in
Hatfield. The Hub will contain specialist facilities, including laboratories,
housing for animals and an incubator for small businesses and will aim to
develop vaccines and cell therapies that will fight key animal infections and
protect human health. Delivery is planned for 2020.
In the March 21st Hertfordshire LEP Board Meeting, it was decided that capital
funding will be provided to the following projects:
• North Hertfordshire College Hitchin Campus redevelopment (£3.7m)
• University Campus St Albans redevelopment (£5m)
• Cell & Gene Therapy Catapult Fit Out (£2.9m)
• Watford Business Park Phase II (£5m)
• Watford Infill Sites (£1.4m)
• University of Hertfordshire Sports Science Fit Out (£3.9m)
• HatTech Beaconsfield Court (£0.75m)
Furthermore, the Growing Business Fund (£2.8m from EU grant funds and
£3.5m from the LEP SME loan fund) will become available to support SMEs
after the appointment of a fund manager.
In the June 20th Hertfordshire LEP Board Meeting, it was decided that capital
funding will be provided to the following projects:
• M1 Junction 8 and associated roadways (£3m) – subject to a number of
conditions
• Stevenage Bioscience Catalyst (£1.2m) – based on a number of conditions
• Stevenage North Block (£1.5m) – based on the condition that any revenue
surplus would be shared on an equal basis between the applicant the LEP
• Watford Clarendon Road Expansion and Watford Junction Improvements
(£0.3m)
• Essex Road (New River Bridge) (£2.5m) – based on the condition that the
applicant will confirm the date for completion of the land sale
In the September 19th Hertfordshire LEP Board Meeting, it was decided that
capital funding will be provided to the following projects:
• Stevenage Bus station relocation (£9.6m) – subject to the scheme
obtaining planning permission and meeting BEIS requirements for the
Stevenage related GD3 allocation
• Russell Building scheme upgrade (£1.7m)
In the December 12th Hertfordshire LEP Board Meeting, it was decided that
LGF capital funding will be provided to the following projects:
• Hertfordshire Living Lab (£0.7m)
• Royal Veterinary College Cardiovascular Imaging Centre for Excellence
(£2.8m) – subject to the project achieving planning permission+

Economic Strategy for the East of England
124 Cambridge Econometrics
South East LEP (Essex)
The main upcoming and ongoing South East LEP projects for Essex include:
1 Road infrastructure
• A127/A130 Fairglen Interchange new link road: The scheme includes
building new roads and widening existing ones to help reduce journey
times and increase safety. In addition to the improvements for motorists, a
new walking and cycling bridge is planned which aims to offer significant
benefits for sustainable transport users. The South East LEP will
contribute £6.235m and the Essex County Council £3.6m, with the delivery
date set in Autumn 2022.
• A13 corridor widening: The Strategic Economic Plan 2014 of the South
East LEP identified the A13 corridor in Thurrock as “the largest single
growth opportunity in the area”, estimating that the A13 widening and other
planned transport investments will “directly enable the creation of 4,045
jobs and 3,340 new homes by 2021, and facilitate 43,610 jobs and 11,000
homes in the corridor”. The scheme, due to be completed in Winter
2020/21, will be funded by the South East LEP through the Local Growth
Fund with contributions from London Gateway Port. The provisional
allocation for the project included £5m as a capital grant and up to a
further £75m for construction.
• A131 Braintree to Sudbury: A transport package with safety and highways
improvements to key junctions along the A131 corridor, together with
enhancements to cycling and pedestrian crossing provision. The total
project was expected to cost is £3.6m, with the South East LEP funding
half and the Essex County Council funding half. The project is on hold after
Essex County Council undertook a comprehensive review of their Capital
Programme, with a view to reduce capital spending. As part of the review
the Council took the decision to withdraw their £1.8m funding.
• A131 Chelmsford to Braintree: The scheme includes a number of capacity,
passenger transport and safety improvements. It is due to be completed in
2020, with the overall project cost at £7.3m (£3.66m from the South East
LEP).
• A133 Colchester to Clacton: The purpose of this projects is to deliver
capacity, cycling and safety improvements along the A133 route
connecting Chelmsford with the seaside resort of Clacton. The expected
completion date is Spring 2020 and the cost is set at about £2.9m, with a
£2.7m contribution from the South East LEP.
• Gilden Way Upgrading, Harlow: The scheme consists of widening and
improvements to 1.8 kms of the existing two-way, two lane, Gilden Road,
Harlow to provide access for the new housing development at Harlowbury
and to provide a link to the proposed new Junction 7a on the M11. The
South East LEP will contribute £5m towards the total project cost of
£18.1m, while the delivery date is set to be in Winter 2021/22.
• M11 Junction 8 Improvements: The project includes three schemes
involving changes to M11 Junction 8 in order to improve traffic flow across
the junction, improve access to Stansted Airport, the Services area and
between the M11 and the A120. It is due to be completed in Spring 2021

Economic Strategy for the East of England
125 Cambridge Econometrics
and its total cost is £18.6m, with the South East LEP providing funding of
£2.7m.
2 City transport packages
• Basildon Integrated Transport Package: The aim of the package is to
deliver traffic management and sustainable travel infrastructure
improvements in Basildon. The objectives include supporting housing and
job growth, reducing congestion and promoting sustainability and
environmental improvements. The project cost is estimated at £9.845m,
with the South East LEP providing £6.586m in capital funding. The
completion date is set in Spring 2021.
• Colchester Integrated Transport Package: The schemes associated with
the Colchester Integrated Transport Package (ITP) focus on traffic and
congestion reduction, traffic management measures, and replacement of
highway infrastructure, to improve the economic vitality of the town centre
while delivering operational improvements across the wider town centre
area. The South East LEP will provide capital funding of £5m, with the total
project cost set at £12m. The expected completion date is Spring 2021.
3 City improvements
• Grays South: the project includes the provision of a new quarter within the
town centre, creating a high-quality arrival point including a new pedestrian
crossing for the railway and new public spaces defined by new commercial
developments. The South East LEP will contribute £10.8m, while the total
cost is expected to be £28.7m. The expected delivery date is 2024.
• Chelmsford City Growth Area Scheme: A package of schemes running to
Spring 2021 with the aim of providing additional transportation capacity
through enhanced sustainable transport, highways capacity improvements
and key safety and technology upgrades for the City of Chelmsford. The
total project cost is £15m, with a £10m contribution from the South East
LEP.
• Purfleet Centre Project: The Purfleet Centre project includes the
comprehensive redevelopment of a 140-acre site to provide a new town
centre for Purfleet featuring; 2,500 new homes, and a 600,000 sq ft film
and television studio complex, as well as supporting infrastructure. In total
it is anticipated that the development will create around 2,700 new jobs
(direct and indirect but excluding construction jobs). The expected
completion date is Winter 2029/30 and the total project cost is £122m
(£5m from the South East LEP).
4 Other transport infrastructure
• London Gateway/Stanford le Hope: London Gateway is a technologically
advanced deep-sea container port catering for global shipping. This
project, due to be delivered in Autumn 2020, includes the development of
a new multi-modal interchange and new station buildings to support
transportation from and to the port. £7.5m of the total £15.1m project cost
will be provided by the South East LEP.
• Beaulieu Park station in Chelmsford: the South East LEP will support the
creation of a new railway station in the northern part of Chelmsford with
£12m. This is expected to aid the development of 4,000 new homes in the

Economic Strategy for the East of England
126 Cambridge Econometrics
area. The total project cost is set at £157m and it is expected to be
completed by Winter 2025.
South East Midlands LEP – SEMLEP (Bedfordshire)
The main SEMLEP projects in the Bedfordshire area include:
1 Road infrastructure
• Improved highway access for Luton Airport: a number of junction
improvements near the airport to increase road capacity, expected to
create 750 new jobs and aid the development of 800 new homes The
£6.2m project is due to be complete in March 2020, with £1.2m funding
from the SEMLEP.
• M1-A6 Link Road: a new road to create a northern Luton bypass. This will
support the creation of 2,000 new jobs and 4,000 new homes, as well as
improve access to Luton Airport and relieve congestion. The project cost is
£60m, with the SEMLEP contributing £32.75m. The road is due to open in
2022.
• Transporting Bedford 2020: an £18.6m scheme to tackle traffic congestion
in the Bedford city centre and improve business productivity, including
smart traffic control and traffic signal technology. The SEMLEP is the
major contributor in the project with funding of £15.5m. The expected
completion date is 2021. The scheme is expected to result in eight
junctions with improvements to physical capacity, and a 10% increase in
town centre footfall compared to 2019 data.
• A421 upgrade: this project will see dual carriageway built from J13 on the
M1 to Milton Keynes opening up more land for employment with access to
the motorway network. It is expected to ease congestion and improve
access to planned housing developments in the area. The scheme cost is
projected at £29m (£23.5m from the SEMLEP) with a delivery date of
December 2020.
2 Skills
• Luton Hat District: four buildings are in development to create a network of
creative and digital industry workspaces in the Cultural Quarter, located
between Luton Station and Luton Town Centre. The projected outputs
include 133 new jobs, 2400m² of usable floor space developed, 11 new
start-ups per annum and more than 1,700 new opportunities for skills-
based learning. The SEMLEP will contribute £3.96m towards the total cost
of £9.4m, with the project completion date set as 2021.
3 Technology
• Variable Temperature Emissions Chamber for HGVs in Millbrook: the new
facility will be used primarily to test buses, trucks and off-highway vehicles
for emissions, fuel and lubricant performance and climatic performance. It
is also designed to test electric vehicles to determine energy consumption,
range and energy efficiency and to test vehicles using alternative fuels
such as hydrogen, LNG and CNG for range, emissions and fuel
consumption over a drive cycle. The total project cost is £9.5m with a
£2.4m contribution from the SEMLEP. Expected completion date is
Autumn 2020.

Economic Strategy for the East of England
127 Cambridge Econometrics
The new bidding round for capital funding through Growth Deal resources
closed in 2018 and in the SEMLEP Board approved 16 projects to go forward
for due diligence. Final funding decisions on the following were made at the
SEMLEP Board meeting on 22 May 2019:
• Business, Skills and Innovation Centre currently known as K Block in
Luton (£3m)
• STEM Teaching Block Provision, Bedford (£1.27m)
The following were also approved at the SEMLEP Board meeting on 25
September 2019:
• Houghton Brook Flood Storage Area scheme (£1m)
• Dunstable High Street Regeneration Phase 2 project (£2.5m)
City Deals are agreements negotiated between the central government and
local bodies (local authorities, LEPs, other entities) that grant the latter
decision-making powers and funding to form and implement locally focussed
growth plans. Four such deals have been agreed in the East of England:
• Greater Cambridge City Deal: the Deal primarily focuses on investment in
infrastructure, housing development and improving the local skills supply
(including the a locally-responsive skills system). The central government
will contribute up to £500m over a 20-25-year horizon and the Greater
Cambridge authorities will contribute a further £500m. This is expected to
help unlock a further £4bn in private investment. The anticipated benefits
of the Growth Deal include the establishment of an infrastructure
investment fund, the accelerated delivery of more than 30,000 homes and
the development of 1,000 new ones, the creation of 45,000 jobs and 400
apprenticeships.
• Greater Ipswich City Deal: the main focus of the Greater Ipswich City Deal
is to tackle youth unemployment and to enhance the level of skills in the
local economy. It includes the development of a locally responsive skills
system and programmes to support unemployed people aged 16-24 years
old and to maximise employer investment in skills, complimented by a
business support package. The Deal is estimated to deliver:
Over 3,500 young people supported into work, including 2,200 into sustained work
5,000 new apprenticeships over the next five years
£10m additional private and local public investment in skills
3,000 additional high value jobs and 400 new businesses; sector investment of £100m across the LEP by 2016
- A 5% increase in VAT registered businesses by 2019
• Greater Norwich City Deal: the Deal is structured in three strands:
supporting businesses through enterprise and innovation initiatives;
developing essential infrastructure and housing; and creating a locally-
responsive skills system to maximise employer involvement and
investment. The City Deal is predicted to help create more than 19,000
jobs (among which 3,000 high-value jobs in the Norwich Research Park)
Other initiatives
City Deals

Economic Strategy for the East of England
128 Cambridge Econometrics
speed up housing delivery and create 3,000 additional houses in the North
East Norwich Growth Triangle area.
• Southend-on-Sea City Deal: the main aim of the £6m City Deal is to
support business creation and growth.
Two major infrastructure projects of national significance in the East of
England area include the Cambridge-Oxford Expressway and the East-West
Rail. These projects share the main target of improving connectivity along the
Cambridge-Milton Keynes-Oxford Corridor, an area with major hubs of
research, innovation, technology, entrepreneurship and advanced
manufacturing.
Further major road projects by Highways England in the East of England
include:
• A14 Cambridge to Huntingdon improvement scheme (£1.5bn)
• A1(M) junction 6 to junction 8 smart motorway (£110m-156m)
• A12 Chelmsford to A120 widening scheme (cost pending)
• A428 Black Cat to Caxton Gibbet (£800m-£1.4bn)
• A47 Blofield to North Burlingham (£50m-100m)
• A47 Great Yarmouth junctions improvements (£25m-50m)
• A47 Guyhirn junction (up to £25m)
• A47 North Tuddenham to Easton improvement (£100m-250m)
• A47 Thickthorn junction (cost pending)
• A47 Wansford to Sutton dualling (£50m-100m)
• M1 junction 13 to junction 16: smart motorway (£373m)
• A major project currently under review is the Lower Thames Crossing,
which is expected to benefit the areas around Kent, Thurrock and Essex
by reducing congestion and travel times.
The East of England as a whole is not represented by a single Sub-national
Transport Body. Norfolk, Suffolk and Essex are represented by Transport
East, while Bedfordshire, Hertfordshire, Cambridgeshire and Peterborough are
represented by England’s Economic Heartland.
National projects