Economic Status and Health in Childhood: The Origins of ...
27
Economic Status and Health in Childhood: The Origins of the Gradient By ANNE CASE,DARREN LUBOTSKY, AND CHRISTINA PAXSON* The well-known positive association between health and income in adulthood has antecedents in childhood. Not only is children’s health positively related to house- hold income, but the relationship between household income and children’s health becomes more pronounced as children age. Part of the relationship can be ex- plained by the arrival and impact of chronic conditions. Children from lower- income households with chronic conditions have worse health than do those from higher-income households. The adverse health effects of lower income accumulate over children’s lives. Part of the intergenerational transmission of socioeconomic status may work through the impact of parents’ income on children’s health. (JEL I1) That wealthy people live longer and have lower morbidity, on average, than do poor peo- ple has been well documented across countries, within countries at a point in time, and over time with economic growth. The positive cor- relation between income and health is not lim- ited to the bottom end of the income distribution (Nancy E. Adler et al., 1994). Indeed, the gra- dient in health status—the phenomenon that relatively wealthier people have better health and longevity—is evident throughout the in- come distribution. In this paper we present ev- idence that the income gradients observed in adult health have antecedents in childhood, and suggest that part of the intergenerational trans- mission of socioeconomic status may work through the impact of parents’ long-run average income on children’s health. Using several large, nationally representative data sets, we find that children’s health is pos- itively related to household income, and that the relationship between household income and children’s health status becomes more pro- nounced as children grow older. A large com- ponent of the relationship between income and children’s health can be explained by the arrival and impact of chronic health conditions in childhood. Children from lower-income house- holds with chronic health conditions have worse health than do children from higher-income households. Further, we find that children’s health is closely associated with long-run aver- age household income, and that the adverse health effects of lower permanent income accu- mulate over children’s lives. These children ar- rive at the doorstep of adulthood with lower health status and lower educational attain- ment—the latter, in part, as a consequence of poor health. Our findings are of interest not only because they provide insight into the determinants of child well-being, but because they suggest sources of an income gradient in adulthood health. Hypotheses on the causes of the relation- ship between income and health are difficult to untangle in adulthood, and there is little consen- sus on the relative importance of mechanisms that lead from low income to poor health and of those that lead from poor health to low income (Victor R. Fuchs, 1982; Michael Marmot, 1999; James P. Smith, 1999). By focusing on children, we can eliminate the channel that runs from health to income. Generally in the United States children do not contribute to family income, and so the correlation between poor health in child- hood and low family income cannot be ex- * Case and Paxson: Department of Economics and Woodrow Wilson School, Center for Health and Wellbeing, Princeton University, Princeton, NJ 08544; Lubotsky: De- partment of Economics and Institute of Labor and Industrial Relations, University of Illinois at Urbana-Champaign, Champaign, IL 61820. We thank David Card, Janet Currie, David Cutler, Angus Deaton, seminar participants, and anonymous referees for helpful suggestions, and the John D. and Catherine T. MacArthur Foundation for financial support. 1308
Transcript of Economic Status and Health in Childhood: The Origins of ...

*WooPrinpartRelaChaDavanoandsup
Economic Status and Health in Childhood:The Origins of the Gradient
By ANNE CASE, DARREN LUBOTSKY, AND CHRISTINA PAXSON*
The well-known positive association between health and income in adulthood hasantecedents in childhood. Not only is children’s health positively related to house-hold income, but the relationship between household income and children’s healthbecomes more pronounced as children age. Part of the relationship can be ex-plained by the arrival and impact of chronic conditions. Children from lower-income households with chronic conditions have worse health than do those fromhigher-income households. The adverse health effects of lower income accumulateover children’s lives. Part of the intergenerational transmission of socioeconomicstatus may work through the impact of parents’ income on children’s health. (JEL I1)
veoie
err-mon
altnv
annrg
ivoshnro
l
-e-
-f
t
-
-
That wealthy people live longer and halower morbidity, on average, than do poor peple has been well documented across countrwithin countries at a point in time, and ovtime with economic growth. The positive corelation between income and health is not liited to the bottom end of the income distributi(Nancy E. Adler et al., 1994). Indeed, thegra-dient in health status—the phenomenon threlatively wealthier people have better heaand longevity—is evident throughout the icome distribution. In this paper we present eidence that the income gradients observedadult health have antecedents in childhood,suggest that part of the intergenerational tramission of socioeconomic status may wothrough the impact of parents’ long-run averaincome on children’s health.
Using several large, nationally representatdata sets, we find that children’s health is pitively related to household income, and that trelationship between household income achildren’s health status becomes more p
s
,
Case and Paxson: Department of Economics androw Wilson School, Center for Health and Wellbeingceton University, Princeton, NJ 08544; Lubotsky: Dement of Economics and Institute of Labor and Industriations, University of Illinois at Urbana-Champaignmpaign, IL 61820. We thank David Card, Janet Currieid Cutler, Angus Deaton, seminar participants, annymous referees for helpful suggestions, and the John
Catherine T. MacArthur Foundation for financiaport.
130
-s,
-
th--ind
s-ke
e-
ed-
nounced as children grow older. A large com-ponent of the relationship between income andchildren’s health can be explained by the arrivaand impact of chronic health conditions inchildhood. Children from lower-income house-holds with chronic health conditions have worsehealth than do children from higher-incomehouseholds. Further, we find that children’shealth is closely associated with long-run average household income, and that the advershealth effects of lower permanent income accumulate over children’s lives. These children ar-rive at the doorstep of adulthood with lowerhealth status and lower educational attainment—the latter, in part, as a consequence opoor health.
Our findings are of interest not only becausethey provide insight into the determinants ofchild well-being, but because they suggessources of an income gradient in adulthoodhealth. Hypotheses on the causes of the relationship between income and health are difficult tountangle in adulthood, and there is little consensus on the relative importance of mechanismthat lead from low income to poor health and ofthose that lead from poor health to low income(Victor R. Fuchs, 1982; Michael Marmot, 1999;James P. Smith, 1999). By focusing on childrenwe can eliminate the channel that runs fromhealth to income. Generally in the United Stateschildren do not contribute to family income, andso the correlation between poor health in child-hood and low family income cannot be ex-
d,-l
,,
dD.l
8
1309VOL. 92 NO. 5 CASE ET AL.: ECONOMIC STATUS AND HEALTH IN CHILDHOOD
plained by lower earnings of children (althoughit should be noted that ill children could reduceparental labor supply, a point we address inwhat follows). This does not imply that healthstatus has no effect on income in adulthood. Infact, our results indicate that children frompoorer households enter adulthood in poorergeneral health, with more serious chronic con-ditions, and having missed more days ofschool—all of which may compromise theirfuture earnings ability.
Wealthier parents may be better able to pur-chase medical care, nutritious foods, and saferenvironments for their children and, in these andmany other ways, income may have a causal ef-fect on children’s health. At the same time, chil-dren’s health may be influenced by a variety ofparental characteristics—including both geneticor behavioral factors—that are correlated with pa-rental income, and we find evidence for some“ third factor” explanations in our data.
We begin by establishing several facts aboutthe relationship between children’s health andhousehold income, and focus in particular onthe role of chronic conditions in children’shealth. We then explore the extent to which therelationship between income and health can beexplained by other characteristics of parents andthe child’s environment, such as parental healthand labor supply. We conclude with a discus-sion of mechanisms that underlie the relation-ship between income and health in childhood,and implications of this relationship for chil-dren’s human capital formation.
I. Data
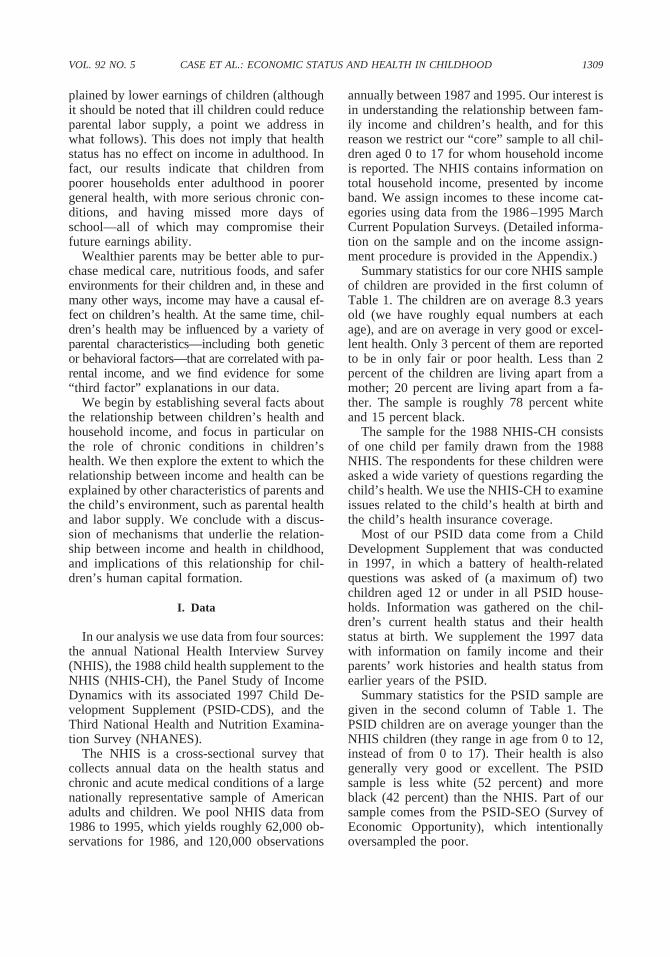
In our analysis we use data from four sources:the annual National Health Interview Survey(NHIS), the 1988 child health supplement to theNHIS (NHIS-CH), the Panel Study of IncomeDynamics with its associated 1997 Child De-velopment Supplement (PSID-CDS), and theThird National Health and Nutrition Examina-tion Survey (NHANES).
The NHIS is a cross-sectional survey thatcollects annual data on the health status andchronic and acute medical conditions of a largenationally representative sample of Americanadults and children. We pool NHIS data from1986 to 1995, which yields roughly 62,000 ob-servations for 1986, and 120,000 observations
annually between 1987 and 1995. Our interest isin understanding the relationship between fam-ily income and children’s health, and for thisreason we restrict our “core” sample to all chil-dren aged 0 to 17 for whom household incomeis reported. The NHIS contains information ontotal household income, presented by incomeband. We assign incomes to these income cat-egories using data from the 1986–1995 MarchCurrent Population Surveys. (Detailed informa-tion on the sample and on the income assign-ment procedure is provided in the Appendix.)
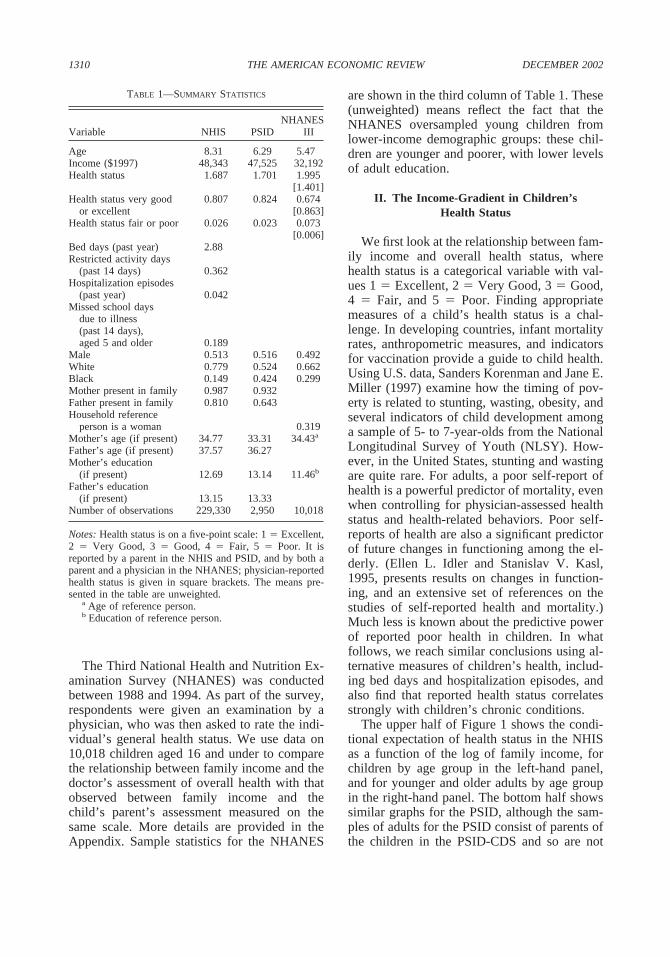
Summary statistics for our core NHIS sampleof children are provided in the first column ofTable 1. The children are on average 8.3 yearsold (we have roughly equal numbers at eachage), and are on average in very good or excel-lent health. Only 3 percent of them are reportedto be in only fair or poor health. Less than 2percent of the children are living apart from amother; 20 percent are living apart from a fa-ther. The sample is roughly 78 percent whiteand 15 percent black.
The sample for the 1988 NHIS-CH consistsof one child per family drawn from the 1988NHIS. The respondents for these children wereasked a wide variety of questions regarding thechild’s health. We use the NHIS-CH to examineissues related to the child’s health at birth andthe child’s health insurance coverage.
Most of our PSID data come from a ChildDevelopment Supplement that was conductedin 1997, in which a battery of health-relatedquestions was asked of (a maximum of) twochildren aged 12 or under in all PSID house-holds. Information was gathered on the chil-dren’s current health status and their healthstatus at birth. We supplement the 1997 datawith information on family income and theirparents’ work histories and health status fromearlier years of the PSID.
Summary statistics for the PSID sample aregiven in the second column of Table 1. ThePSID children are on average younger than theNHIS children (they range in age from 0 to 12,instead of from 0 to 17). Their health is alsogenerally very good or excellent. The PSIDsample is less white (52 percent) and moreblack (42 percent) than the NHIS. Part of oursample comes from the PSID-SEO (Survey ofEconomic Opportunity), which intentionallyoversampled the poor.
1310 THE AMERICAN ECONOMIC REVIEW DECEMBER 2002
The Third National Health and Nutrition Ex-amination Survey (NHANES) was conductedbetween 1988 and 1994. As part of the survey,respondents were given an examination by aphysician, who was then asked to rate the indi-vidual’s general health status. We use data on10,018 children aged 16 and under to comparethe relationship between family income and thedoctor’s assessment of overall health with thatobserved between family income and thechild’s parent’s assessment measured on thesame scale. More details are provided in theAppendix. Sample statistics for the NHANES
TABLE 1—SUMMARY STATISTICS
Variable NHIS PSIDNHANES
III
Age 8.31 6.29 5.47Income ($1997) 48,343 47,525 32,192Health status 1.687 1.701 1.995
[1.401]Health status very good
or excellent0.807 0.824 0.674
[0.863]Health status fair or poor 0.026 0.023 0.073
[0.006]Bed days (past year) 2.88Restricted activity days
(past 14 days) 0.362Hospitalization episodes
(past year) 0.042Missed school days
due to illness(past 14 days),aged 5 and older 0.189
Male 0.513 0.516 0.492White 0.779 0.524 0.662Black 0.149 0.424 0.299Mother present in family 0.987 0.932Father present in family 0.810 0.643Household reference
person is a woman 0.319Mother’s age (if present) 34.77 33.31 34.43a
Father’s age (if present) 37.57 36.27Mother’s education
(if present) 12.69 13.14 11.46b
Father’s education(if present) 13.15 13.33
Number of observations 229,330 2,950 10,018
Notes: Health status is on a five-point scale: 1 � Excellent,2 � Very Good, 3 � Good, 4 � Fair, 5 � Poor. It isreported by a parent in the NHIS and PSID, and by both aparent and a physician in the NHANES; physician-reportedhealth status is given in square brackets. The means pre-sented in the table are unweighted.
a Age of reference person.b Education of reference person.
are shown in the third column of Table 1. These(unweighted) means reflect the fact that theNHANES oversampled young children fromlower-income demographic groups: these chil-dren are younger and poorer, with lower levelsof adult education.
II. The Income-Gradient in Children’sHealth Status
We first look at the relationship between fam-ily income and overall health status, wherehealth status is a categorical variable with val-ues 1 � Excellent, 2 � Very Good, 3 � Good,4 � Fair, and 5 � Poor. Finding appropriatemeasures of a child’s health status is a chal-lenge. In developing countries, infant mortalityrates, anthropometric measures, and indicatorsfor vaccination provide a guide to child health.Using U.S. data, Sanders Korenman and Jane E.Miller (1997) examine how the timing of pov-erty is related to stunting, wasting, obesity, andseveral indicators of child development amonga sample of 5- to 7-year-olds from the NationalLongitudinal Survey of Youth (NLSY). How-ever, in the United States, stunting and wastingare quite rare. For adults, a poor self-report ofhealth is a powerful predictor of mortality, evenwhen controlling for physician-assessed healthstatus and health-related behaviors. Poor self-reports of health are also a significant predictorof future changes in functioning among the el-derly. (Ellen L. Idler and Stanislav V. Kasl,1995, presents results on changes in function-ing, and an extensive set of references on thestudies of self-reported health and mortality.)Much less is known about the predictive powerof reported poor health in children. In whatfollows, we reach similar conclusions using al-ternative measures of children’s health, includ-ing bed days and hospitalization episodes, andalso find that reported health status correlatesstrongly with children’s chronic conditions.
The upper half of Figure 1 shows the condi-tional expectation of health status in the NHISas a function of the log of family income, forchildren by age group in the left-hand panel,and for younger and older adults by age groupin the right-hand panel. The bottom half showssimilar graphs for the PSID, although the sam-ples of adults for the PSID consist of parents ofthe children in the PSID-CDS and so are not
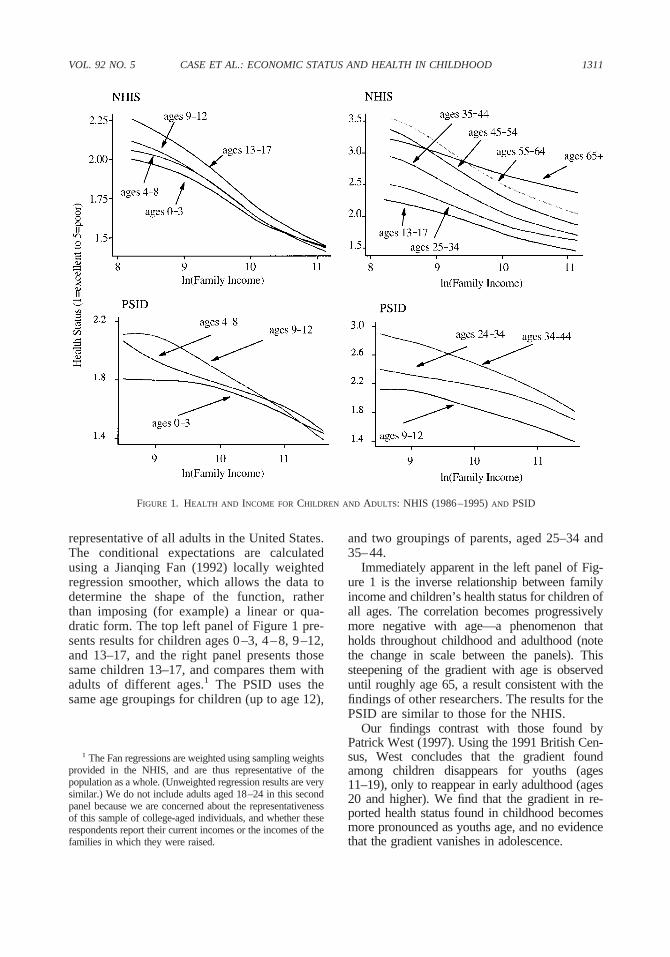
1311VOL. 92 NO. 5 CASE ET AL.: ECONOMIC STATUS AND HEALTH IN CHILDHOOD
FIGURE 1. HEALTH AND INCOME FOR CHILDREN AND ADULTS: NHIS (1986–1995) AND PSID
1 The Fan regressions are weighted using sampling weightsprovided in the NHIS, and are thus representative of thepopulation as a whole. (Unweighted regression results are verysimilar.) We do not include adults aged 18–24 in this secondpanel because we are concerned about the representativenessof this sample of college-aged individuals, and whether theserespondents report their current incomes or the incomes of thefamilies in which they were raised.
and two groupings of parents, aged 25–34 and35–44.
Immediately apparent in the left panel of Fig-ure 1 is the inverse relationship between familyincome and children’s health status for children ofall ages. The correlation becomes progressivelymore negative with age—a phenomenon thatholds throughout childhood and adulthood (notethe change in scale between the panels). Thissteepening of the gradient with age is observeduntil roughly age 65, a result consistent with thefindings of other researchers. The results for thePSID are similar to those for the NHIS.
Our findings contrast with those found byPatrick West (1997). Using the 1991 British Cen-sus, West concludes that the gradient foundamong children disappears for youths (ages11–19), only to reappear in early adulthood (ages20 and higher). We find that the gradient in re-ported health status found in childhood becomesmore pronounced as youths age, and no evidencethat the gradient vanishes in adolescence.
representative of all adults in the United States.The conditional expectations are calculatedusing a Jianqing Fan (1992) locally weightedregression smoother, which allows the data todetermine the shape of the function, ratherthan imposing (for example) a linear or qua-dratic form. The top left panel of Figure 1 pre-sents results for children ages 0–3, 4–8, 9–12,and 13–17, and the right panel presents thosesame children 13–17, and compares them withadults of different ages.1 The PSID uses thesame age groupings for children (up to age 12),
1312 THE AMERICAN ECONOMIC REVIEW DECEMBER 2002
There are many other parental, household,and child-specific characteristics that may varybetween households with 2-year-olds (say) andhouseholds with 12-year-olds. In order to con-trol for a range of other characteristics, we runordered probits of health status (integers from1 � excellent to 5 � poor) on income and onsets of household controls, and present the re-sults in the first four columns of Table 2 for theNHIS.2 We present two sets of results for eachage group. The first row (labeled “NHIS Con-trols 1” ) shows results of ordered probits ofhealth status on the log of family income, withage indicators, year indicators, and with con-trols for child and household characteristics,excluding parents’ educations. (Details aregiven in the notes to the tables.) The next set ofrows (“NHIS Controls 2” ) presents results inwhich, in addition to the variables in Controls 1,we include controls for parents’ educations andunemployment status. The results in Table 2 showthat the negative relationship between incomeand health status becomes more pronouncedand significant for each older age group.3
The addition of parents’ educational attain-ment to the set of controls has a large effect onthe estimated income coefficients, reducingthem by roughly a third for all ages relative toresults using Controls 1. However, the gradientsremain large and highly significant. Even withcontrols for parents’ educations, a doubling ofhousehold income is associated with an increasein the probability that a child is in excellent orvery good health of 4.0 percent (for ages 0–3),
2 The results presented here are robust to estimating themodels using ordinary least squares, and to using an indi-cator that health is reported to be “excellent” or “very good”as the dependent variable. The results are also robust toincome being entered in levels, rather than logarithms. Wehave also performed some preliminary tests of whetherincome affects how a family translates different levels of“ true” health into “perceived” health by looking at whetherthe cut points in our ordered probit models are sensitive toincome level. One simple test for this is to divide the sampleat median income into lower- and upper-income sub-samples, and rerun the ordered probits looking for signifi-cant differences in cut points between the poorer and richersamples. We find no significant difference in cut pointsbetween richer and poorer households. (Results are avail-able upon request from the authors.)
3 The income coefficients for adjoining age groups aresignificantly different from one another for all of the NHISresults in Table 2.
4.9 percent (ages 4–8), 5.9 percent (ages 9–12),and 7.2 percent (ages 13–17). (These results arenot reported in Table 2, but are available fromthe authors upon request.)
Although adding controls for education doesnot eliminate the effects of income, the coeffi-cients on parents’ educations are large and sig-nificant. Children living with a mother with ahigh-school degree are reported to be in betterhealth than those whose mothers have not fin-ished high school (the omitted category here).Children whose mothers have more than a high-school degree are reported to be in even betterhealth. A similar pattern is seen with respect tofathers’ educations. This may be because edu-cation makes parents more adept at protectingtheir children’s health. Alternatively, educationitself may not be causal, but may signify that theparent is patient, and may be more nurturing. Ineither case, if parents’ educations are omitted,their effects may load onto the income coeffi-cient, with which they are highly correlated.4
Distinct from the pattern we observed forincome, we see little change in the impact ofparents’ educations on children’s health statusbetween younger and older ages. Both mothers’and fathers’ educations have a slightly strongerimpact for children above age 3; the coefficienton the indicator that mother has more than ahigh-school degree, for example, jumps from�0.244 to �0.322 between age groups 0–3 and4–8. However, a comparison of the educationcoefficients for children aged 4–8, 9–12, and13–17 show that the relationship between par-ents educations and childrens’ health remain
4 Another explanation is that household income is mea-sured with error, and the “ true” household income may becorrelated with parents’ educations, leading to large (orlarger) coefficients on parents’ educations, as the educationcoefficients pick up part of the effect of “ true” income. Wehave explored whether measurement error in income isimportant in our analysis by instrumenting the log of familyincome with indicators for industry, occupation, and class ofworker in the household. For each age group and eachspecification, the instrumented coefficients show a strongereffect of income on health status, increasing the size of thecoefficients in absolute value between 25 and 50 percent.Other than its effect on the sizes of the coefficients, instru-mentation does little to the pattern of coefficients observedhere: the gradients for older children continue to be steeperthan those for younger children. Instrumentation does re-duce the estimated effects of mother’s and father’s educa-tions, but their coefficients remain large and significant.

1313VOL. 92 NO. 5 CASE ET AL.: ECONOMIC STATUS AND HEALTH IN CHILDHOOD
TABLE 2—HEALTH STATUS AND LN(FAMILY INCOME), NHIS AND NHANES
Panel A. NHIS
Health status (1 � Excellent to 5 � Poor)(ordered probits)
Beddays
Restrictedactivity
daysHospitalepisodes
Missedschooldays
Ages: 0–3 4–8 9–12 13–17 0–17 0–17 0–17 5–17Observations: 51,448 54,067 64,746 59,069 229,650 229,650 229,650 164,327
Variable (1) (2) (3) (4) (5) (6) (7) (8)
NHIS Controls 1:
ln(Family income) �0.183 �0.244 �0.286 �0.323 �0.096 �0.030 �0.0079 �0.021(0.008) (0.008) (0.008) (0.008) (0.031) (0.005) (0.0009) (0.003)
NHIS Controls 2:
ln(Family income) �0.114 �0.156 �0.187 �0.218 �0.198 �0.036 �0.0079 �0.019(0.008) (0.008) (0.008) (0.009) (0.035) (0.005) (0.0009) (0.003)
Mother’s education �0.136 �0.169 �0.170 �0.170 0.111 �0.011 �0.0021 �0.008� 12 years (0.018) (0.018) (0.017) (0.017) (0.075) (0.011) (0.0020) (0.007)
Mother’s education �0.244 �0.322 �0.336 �0.319 0.319 0.001 �0.0029 �0.018� 12 years (0.021) (0.020) (0.019) (0.019) (0.082) (0.012) (0.0022) (0.008)
Father’s education �0.148 �0.162 �0.169 �0.166 0.154 0.015 0.0042 0.005� 12 years (0.020) (0.020) (0.019) (0.019) (0.078) (0.012) (0.0021) (0.007)
Father’s education �0.283 �0.298 �0.311 �0.306 0.317 0.038 0.0040 0.012� 12 years (0.022) (0.021) (0.020) (0.020) (0.083) (0.013) (0.0022) (0.007)
Panel B. NHANES Controls 3
Parent-assessed health status(ordered probits)
Physician-assessed health status(ordered probits)
Age: 0–3 4–8 9–12 13–17 0–3 4–8 9–12 13–16Observations: 4,364 2,913 1,597 1,144 4,364 2,913 1,597 1,144
Variable (1) (2) (3) (4) (5) (6) (7) (8)
ln(Family income) �0.160 �0.176 �0.202 �0.230 �0.051 �0.071 �0.102 �0.075(0.025) (0.030) (0.041) (0.046) (0.030) (0.036) (0.046) (0.053)
Notes: NHIS results: The numbers in parentheses are robust standard errors, where correlation is allowed betweenunobservables for observations from the same household. For rows labeled “Controls 1,” each regression included completesets of age and year dummies; the logarithm of family size; indicators variables for whether the child has a mother in thehousehold, has a father in the household, is male, is black, is white; interactions of the indicator for whether a mother (father)is in the household with mother’s (father’s) age; indicators for whether both the mother and father were respondents to thehealth survey, whether the father and not the mother was a respondent to the health survey, and whether neither the mothernor father were respondents to the health survey (the excluded category is that the mother but not the father was therespondent). For rows labeled “Controls 2,” all variables in “Controls 1” are included plus the measures of the mother’s(father’s) schooling shown in the table and indicators of whether the mother (father) is unemployed, where each educationand unemployment variable is interacted with an indicator of whether the mother (father) is in the household. The sample isrestricted to children aged 17 or younger, who come from single-family households, who are members of the “primary family”in the household, who are children of either the reference person or spouse of reference person, who are of the same race asother children in the household, and who have nonmissing values for all of the variables included in the regression. Allchildren in a household are removed if any children in the household are removed. Total sample size is 229,330.
NHANES III results: The numbers in parentheses are standard errors. “Controls 3” includes an indicator for whether thefamily was in the highest income bracket, whether the child is white or black, male, whether the mother reported for the child,whether the person was sampled in 1988–1991, a complete set of dummies for the child’s age, the logarithm of family size,whether the household reference person is a woman, and the reference person’s age, education, and marital status. Cases aredropped if the survey respondent was not a parent of the child, or if the respondent was not the household reference personor married to the reference person.

5 Before giving his or her assessment of a child’s generalhealth, the NHANES doctor assessed the child’s locomo-tion, examined the child’s eyes for vision problems, took hisor her pulse (if age 4 or under) or blood pressure (if age 5or older), listened to the child’s chest and heart, and in-spected the child for dermatitis and signs of sexual devel-opment. The children were also given a series of laboratorytests. However, these tests were not administered by theexamining doctors and results of these tests were not knownto doctors when their health assessments were made.
6 Although the income coefficients are larger at higherages in the NHANES, the differences between adjoining agegroups are not significant.
1314 THE AMERICAN ECONOMIC REVIEW DECEMBER 2002
constant above age 3. That there is a steepeninggradient of health with respect to income withage, but no steepening with respect to parents’educations, is noteworthy. It appears that in-come (and what it buys a child) has a differenteffect on a child’s health from the skills thataccompany parental education.
One potential objection to the use of parents’reports of their children’s health status is thatthey are not objective, and may be colored bythe parent’s own health status. Such a findingwould be inconsistent with Mark R. Dadds et al.(1995), who present evidence that maternalmental health does not influence mothers’ re-ports of child health. We provide three addi-tional pieces of evidence on this issue. First, welook at 17-year-olds in the NHIS, who weregiven the option of reporting on their ownhealth. Specifically, we reproduced the resultsshown in the top panel of Table 2, adding bothan indicator for whether the 17-year-olds re-sponded for themselves and an interaction termof the logarithm of income with this indicator.In no case was the effect of either of the addedvariables significantly different from zero.
In addition, because the NHANES containsboth physician-assessed and parent-assessedhealth status, we can evaluate whether the gra-dient we observe using parent-assessed health,and the rotation of this gradient with age, aredue to a reporting bias that varies systematicallywith income. The bottom panel of Table 2 pre-sents coefficients of log family income in orderedprobits of parent-assessed health [columns (1)–(4)], and physician-assessed health [columns(5)–(8)]. The doctors who conducted theNHANES examinations generally report chil-dren to be in better health than do their parents.For example, while 7.6 percent of children inthe NHANES are reported by their parents to bein fair or poor health, only 0.6 percent arereported to be in fair or poor health by theNHANES doctors. And, the rank correlationbetween the parents’ and doctors’ report (on afive-point scale), although significantly differ-ent from 0, is only 0.05. Both the parents’ anddoctors’ reports have potential problems. Par-ents may be less able than doctors to objectivelyassess their child’s health relative to that ofother children. However, the NHANES doctorshad very limited information about the childrenthey examined. The doctors who conducted the
exams had never seen the children before, werenot present at the interview in which the chil-dren’s health histories were taken, and con-ducted only basic physical exams.5 It istherefore not surprising that few children werereported by these doctors to be in poor health, orthat there is not more agreement between par-ents and doctors. Despite these problems, thedoctor’s assessments provide a useful cross-check on our results that use parent reports. Forboth, we find a significant correlation betweenincome and children’s health status, with largereffects for older children. The coefficients onincome for physician-assessed health aresmaller in absolute value than those for parent-assessed health, possibly because physiciansuse a smaller range of the health scale than doparents. That the income gradient in physician-assessed health status also rotates with children’sages (at least through age 12) suggests that therotation we see in parent-assessed health is not theresult of reporting bias.6
A third way of evaluating the gradients wefind using parent reports of children’s health isto compare them with those we find for otherhealth-related outcomes. The last four NHIScolumns of Table 2 report the gradients weobserve for the number of days the child hasspent in bed and the number of hospitalizationepisodes in the past 12 months, and the numberof school days missed and days of restrictedactivity in the past two weeks. For all four ofthese measures of children’s health status wefind large and significant effects of family in-come.7 These, then, provide additional evidence
7 The relationships between income and the health mea-sures shown in the last four columns of Table 2 do notbecome uniformly larger with age. This is perhaps notsurprising, given that all of these health measures reflectboth health problems and responses to health problems. The

1315VOL. 92 NO. 5 CASE ET AL.: ECONOMIC STATUS AND HEALTH IN CHILDHOOD
that either income is itself protective of chil-dren’s health, or is correlated with things thatare protective of children’s health. Perhaps both.
III. Chronic Conditions andthe Gradient in Health
The previous section demonstrated that, onaverage, children’s health becomes poorer withage and that the differences in the health ofwealthier and poorer children become more pro-nounced with age. We turn now to examinewhether the accumulation of chronic healthconditions plays a role in the gradient. Poorerchildren may be more likely to suffer fromchronic conditions—such as asthma, epilepsy,or heart conditions—that lead to poorer healthstatus. In addition, their families may be lessable to provide the investments necessary tomaintain good health status in the presence of achronic condition.
To motivate the analysis in this section, sup-pose that all children are born into excellenthealth regardless of their income levels, so thatthere is initially no income gradient in chil-dren’s health. (That gradients in health becomemore pronounced with age due to the accumu-lation of chronic health conditions does notdepend on the assumption that all children areborn into excellent health. Income-related dif-ferences in birth weight and other measures ofbirth outcomes may account for the incomegradients in health observed at the youngestages. We will return to the role of health at birthin Section V.) Health shocks, in the form of thearrival of chronic conditions, arrive stochasti-cally. We assume that the probability that achild is burdened by a new chronic condition isnegatively related to his or her income level. Ifchronic conditions reduce the child’s healthstock, then over time poorer children will fall
farther behind wealthier children. In addition,parents may be able to undertake investmentsthat offset the effects of chronic conditions onhealth status. These investments could takemany forms, including using appropriate medi-cal care and prescription drugs, carefully fol-lowing treatment regimens, or modifying thechild’s living environment to reduce the sever-ity of the symptoms. If these parental invest-ments are correlated with income—eitherbecause money is necessary to treat the condi-tion, or because parents who earn high incomesare also better at managing health problems—then chronic conditions will do less damage tothe health of wealthier children.
These ideas are formalized in the followingempirical framework. Let C be an indicator forwhether the child has a specific chronic condi-tion, H be an indicator of poor health (measuredin practice as an indicator for whether the childis reported to be in fair or poor health), lny bethe logarithm of family income, and X be a setof controls, including the logarithm of familysize and indicators for the child’s age, race,gender, and the survey year. Family incomeaffects the probability that a child contracts achronic condition. Income also affects healthstatus, and the effect of income on health willdepend in part on whether or not the child has achronic condition.
The probability that a child is in poor healthcan be expressed as
(1) P�H�X� � P�H�C � 0, X�P�C � 0�X�
� P�H�C � 1, X�P�C � 1�X�
where all probabilities depend on the logarithmof income. Suppressing the X’s, the change inthe probability of poor health with respect toincome can be decomposed into three terms:
(2)�P�H�
�lny�
�P�H�C � 0�
�lny
� ��P�H�C � 1�
�lny�
�P�H�C � 0�
�lny �P�C � 1�
� �P�H�C � 1� � P�H�C � 0���P�C � 1�
�lny.
relationship between income and the first three health mea-sures (bed days, restricted activity days, and hospital epi-sodes) is larger for children aged 0–3 than for those aged4–8. This could reflect medical treatment for very youngchildren associated with prematurity and low birth weight,something that exhibits a strong income gradient. Incomegradients in bed days and restricted activity days increasewith age for children over the age of 3. Gradients in hospitalepisodes and days missed from school show no systematicpattern with age above the age of 3.
1316 THE AMERICAN ECONOMIC REVIEW DECEMBER 2002
The first term is the effect of income on poorhealth in the absence of the chronic condition.The second term, which we call the “severityeffect,” is the additional impact of income onpoor health given a chronic condition. The thirdterm, which we refer to as the “prevalence ef-fect,” is the effect of income on poor health thatworks through the greater chance that poorerchildren obtain the chronic condition.8
We use the following linear probability mod-els to estimate the terms in (2):
(3) C � �0 � �1lny � X�C � �C
(4) H � �0 � �1 �lny � lny�
� �2 C � �3 �lny � lny�C
� X�H � �H.
The probability of poor health is, then, esti-mated to depend on the logarithm of familyincome, chronic conditions, and their interac-tions with family income. In (4), we find itconvenient to express incomes as deviationsfrom mean income, in order to more readilyinterpret the coefficients as the effect of incomeat mean income. Because the NHIS assignseach family to one of six “condition lists,” wedo not know the full range of chronic conditionsfor any child. Equations (3) and (4) are esti-mated separately for each of 14 differentchronic conditions, so that (for example) in oneset of estimates C equals 1 if the child hasasthma, and 0 otherwise, and in other sets ofestimates C is an indicator for one of the 13other conditions.
The parameters of equations (3) and (4) canbe used to test a variety of hypotheses. First,they provide information on whether poorerchildren are more likely to obtain chronic con-ditions (in which case �1 will be negative), andwhether chronic conditions have a smaller im-pact on the health status of wealthier children(in which case �3 will be negative). Second, thecoefficient �2 provides information on whichchronic conditions have the most serious impacton health status. If income is effective at buff-
8 We thank a referee for suggesting this accountingframework.
ering children against the adverse effects of themost serious chronic conditions, then �3 will belargest (in absolute value) for those conditionsfor which �2 is largest. Third, it is plausible thatthe adverse effects of chronic conditions, andthe protective role of income in their presence,become more pronounced with the length oftime the child has the condition. We do notobserve the date of onset of each of these con-ditions. However, for conditions that are real-ized at young ages, older children will onaverage have had conditions for longer periods.By estimating (4) separately for older andyounger groups we can examine whether, in thecross section, �3 is larger for older children.Finally, the parameters of (3) and (4) can becombined to assess the “severity” and “preva-lence” effects of chronic health conditions. The“severity effect” is measured as �3C� , where C�is the average probability of having the chroniccondition, and the “prevalence effect” is mea-sured as �2�1.
Estimates of (3) and (4) may be affected bymeasurement error in health conditions. Twotypes of error are possible. First, parents maysimply misreport chronic conditions (see Mi-chael Baker et al., 2001). Second, poorer chil-dren may be less likely to have their chronicconditions diagnosed, or may not have condi-tions diagnosed until they reach older ages. Un-derdiagnosis among poorer children will biasthe estimates of the income gradients in condi-tions (�1) upwards. In addition, if only moresevere cases of illness among poor children arediagnosed, then estimates of the protective ef-fects of income given that a conditions occurs(�3) will be overstated. These biases are likelyto be less of a problem for medical conditionsthat are difficult to overlook—for example, ep-ilepsy, diabetes, or physical deformities. Inwhat follows, we present results for the fullrange of conditions, but then focus our attentionon conditions for which diagnosis and reportingerrors are unlikely.
We begin by examining whether there aregradients in the medical conditions that childrencontract. We selected a set of 14 potentiallyserious health conditions on which the NHIScollects information, leaving aside conditionsthat rarely if ever appear in childhood (e.g.,emphysema, arthritis, cirrhosis of the liver). Mostof the conditions we consider are “chronic” in

1317VOL. 92 NO. 5 CASE ET AL.: ECONOMIC STATUS AND HEALTH IN CHILDHOOD
FIGURE 2. GRADIENTS IN CHRONIC CONDITIONS: NHIS (1986–1995)
This result is consistent with Neal Halfon andPaul W. Newacheck (1993), who find that thedifference in the prevalence of asthma acrosschildren above and below the poverty line islargest for young children.
Table 3 presents descriptive statistics for the14 conditions we examine and estimates ofequations (3) and (4). The prevalence ratesrange from over 5 percent for respiratory ail-ments, to less than 1 percent for diabetes, epi-lepsy, and kidney disease. The estimates of �1shown in the second column indicate that onlytwo conditions—hay fever and sinusitis—arepositively related to income. The steepest (neg-ative) income gradients are for mental retarda-tion, hearing disorders, digestive problems, andasthma. In general, these findings are consistentwith Newacheck (1994), who argues that it isthe most serious chronic conditions that aremore common among poor children.
The estimate of �2 shows the change in theprobability of reporting fair or poor health witheach condition, evaluated at mean family in-come. The results indicate that conditions we
the sense that the fraction of children who havethese conditions increases with age. Exceptionsare digestive disorders, which are most commonamong very young children, and bronchitis. De-tailed information on these conditions is pro-vided in the Appendix. Figure 2 parallels Figure1, and shows nonparametric regressions of anindicator of having a medical condition on thelog of family income for children in differentage groups. We have graphed 9 of the 14 con-ditions to illustrate the diversity of relationshipsbetween specific medical conditions and in-come. The vertical lines in the figures are placedat the 25th, 50th, and 75th percentiles ofincome.
Many of the conditions are more prevalent atlower incomes for all age groups. These includedigestive disorders, hearing problems, heartconditions, epilepsy, and mental retardation.Others display a negative relationship betweenprevalence and income for some but not allages. For example, there is a negative associa-tion between asthma and income for childrenaged 8 and under, but not for older children.
1318 THE AMERICAN ECONOMIC REVIEW DECEMBER 2002
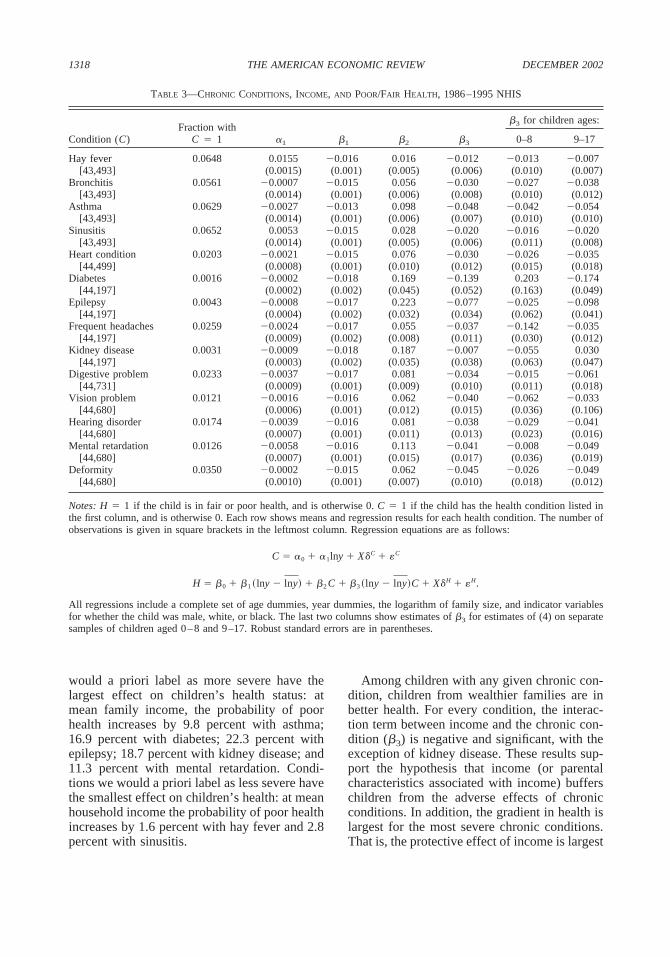
TABLE 3—CHRONIC CONDITIONS, INCOME, AND POOR/FAIR HEALTH, 1986–1995 NHIS
Condition (C)Fraction with
C � 1 �1 �1 �2 �3
�3 for children ages:
0–8 9–17
Hay fever 0.0648 0.0155 �0.016 0.016 �0.012 �0.013 �0.007[43,493] (0.0015) (0.001) (0.005) (0.006) (0.010) (0.007)
Bronchitis 0.0561 �0.0007 �0.015 0.056 �0.030 �0.027 �0.038[43,493] (0.0014) (0.001) (0.006) (0.008) (0.010) (0.012)
Asthma 0.0629 �0.0027 �0.013 0.098 �0.048 �0.042 �0.054[43,493] (0.0014) (0.001) (0.006) (0.007) (0.010) (0.010)
Sinusitis 0.0652 0.0053 �0.015 0.028 �0.020 �0.016 �0.020[43,493] (0.0014) (0.001) (0.005) (0.006) (0.011) (0.008)
Heart condition 0.0203 �0.0021 �0.015 0.076 �0.030 �0.026 �0.035[44,499] (0.0008) (0.001) (0.010) (0.012) (0.015) (0.018)
Diabetes 0.0016 �0.0002 �0.018 0.169 �0.139 0.203 �0.174[44,197] (0.0002) (0.002) (0.045) (0.052) (0.163) (0.049)
Epilepsy 0.0043 �0.0008 �0.017 0.223 �0.077 �0.025 �0.098[44,197] (0.0004) (0.002) (0.032) (0.034) (0.062) (0.041)
Frequent headaches 0.0259 �0.0024 �0.017 0.055 �0.037 �0.142 �0.035[44,197] (0.0009) (0.002) (0.008) (0.011) (0.030) (0.012)
Kidney disease 0.0031 �0.0009 �0.018 0.187 �0.007 �0.055 0.030[44,197] (0.0003) (0.002) (0.035) (0.038) (0.063) (0.047)
Digestive problem 0.0233 �0.0037 �0.017 0.081 �0.034 �0.015 �0.061[44,731] (0.0009) (0.001) (0.009) (0.010) (0.011) (0.018)
Vision problem 0.0121 �0.0016 �0.016 0.062 �0.040 �0.062 �0.033[44,680] (0.0006) (0.001) (0.012) (0.015) (0.036) (0.106)
Hearing disorder 0.0174 �0.0039 �0.016 0.081 �0.038 �0.029 �0.041[44,680] (0.0007) (0.001) (0.011) (0.013) (0.023) (0.016)
Mental retardation 0.0126 �0.0058 �0.016 0.113 �0.041 �0.008 �0.049[44,680] (0.0007) (0.001) (0.015) (0.017) (0.036) (0.019)
Deformity 0.0350 �0.0002 �0.015 0.062 �0.045 �0.026 �0.049[44,680] (0.0010) (0.001) (0.007) (0.010) (0.018) (0.012)
Notes: H � 1 if the child is in fair or poor health, and is otherwise 0. C � 1 if the child has the health condition listed inthe first column, and is otherwise 0. Each row shows means and regression results for each health condition. The number ofobservations is given in square brackets in the leftmost column. Regression equations are as follows:
C � �0 � �1lny � X�C � �C
H � �0 � �1 �lny � lny� � �2 C � �3 �lny � lny�C � X�H � �H.
All regressions include a complete set of age dummies, year dummies, the logarithm of family size, and indicator variablesfor whether the child was male, white, or black. The last two columns show estimates of �3 for estimates of (4) on separatesamples of children aged 0–8 and 9–17. Robust standard errors are in parentheses.
Among children with any given chronic con-dition, children from wealthier families are inbetter health. For every condition, the interac-tion term between income and the chronic con-dition (�3) is negative and significant, with theexception of kidney disease. These results sup-port the hypothesis that income (or parentalcharacteristics associated with income) bufferschildren from the adverse effects of chronicconditions. In addition, the gradient in health islargest for the most severe chronic conditions.That is, the protective effect of income is largest
would a priori label as more severe have thelargest effect on children’s health status: atmean family income, the probability of poorhealth increases by 9.8 percent with asthma;16.9 percent with diabetes; 22.3 percent withepilepsy; 18.7 percent with kidney disease; and11.3 percent with mental retardation. Condi-tions we would a priori label as less severe havethe smallest effect on children’s health: at meanhousehold income the probability of poor healthincreases by 1.6 percent with hay fever and 2.8percent with sinusitis.

10 Evidence from the 1988 NHIS-CH, which collectedinformation about a set of health problems for each samplechild, indicates that there is substantial co-morbidity. Forthis much smaller sample (17,000 children), we find thatchildren with asthma (to take one example) are also signif-icantly more likely to suffer from many other chronic con-ditions, including repeated tonsilitis, ear infections,deafness, respiratory and food allergies, and frequent head-aches. These children are no more likely, however, to sufferfrom epilepsy, congenital heart disease, diabetes, and hand/arm/leg impairments—none of which have any logical con-nection with asthma. Regressions of health status on
1319VOL. 92 NO. 5 CASE ET AL.: ECONOMIC STATUS AND HEALTH IN CHILDHOOD
for the conditions that cause the greatest erosionto children’s health status. The largest interac-tion terms are observed for asthma (�0.048),diabetes (�0.139), and epilepsy (�0.077)—three of the chronic conditions that lead to thelargest average deterioration of health status.(The only exception here is kidney disease,where the condition has a large and significanteffect on health status, but income appears notto be protective.) It was noted above that ifpoorer children are less likely to be diagnosedunless their conditions are very serious, thenestimates of �3 will be overstated. However,estimates of �3 are large for conditions such asdiabetes, epilepsy, and deformities, for whichmeasurement error and differential diagnosisrates by income are less likely to occur.
In the last two columns of Table 3 we exam-ine whether the protective effect of income inthe presence of chronic conditions is larger forolder children. Consistent with the hypothesisthat the buffering effect of income is cumula-tive, we find that income is more protective ofchildren’s health status at older ages for all butthree of the conditions presented. However, theestimates of �3 are not precise, and the differ-ences between the coefficients for younger andolder conditions are not significant.
The top panel of Table 4 presents decompo-sitions of the income gradient in poor healthinto the three components shown in equation(2), plus a residual, for a selected group ofchronic conditions. All terms are expressed as afraction of the estimated effect of income onpoor health, obtained from a regression of H onthe logarithm of income and the elements in X.9
Several of the chronic conditions we observeexplain substantial shares of the income gradi-ent in health. Asthma explains the largest share:the sum of the severity and prevalence effectsaccounts for approximately 20 percent of thegradient. Physical deformities account for 9.3percent, and heart conditions account for nearly5 percent. Because there may be co-morbidityacross conditions, these shares cannot be
9 The estimated effect of income on health, shown in thefirst column of Table 4, differs across conditions only be-cause different subsamples of the NHIS were asked aboutdifferent groups of chronic conditions. The results are sim-ilar if we instead use the effect of income on health esti-mated over the full sample.
summed to arrive at a total share of the incomegradient in health explained by the full set ofconditions.10 However, these results provide ev-idence that chronic conditions play an importantrole in the income gradient in children’s health.
The effect of income that is mediated throughchronic conditions works largely through theseverity effect rather than the prevalence effect.This is most apparent for asthma and physicaldeformities. For each of these conditions,poorer children are not much more likely tohave the condition, but are more likely to be inpoor health given that they have the condition.It was noted above that if poorer children areless likely to be diagnosed when they havemilder forms of conditions, the prevalence ef-fect will be biased down and the severity effectwill be overstated. However, the fact that theseverity effects dominate for conditions that areunlikely to go unnoticed (such as diabetes,epilepsy and deformities) indicates that thiscannot be the whole story. In addition, a com-parison of the second and third panels in Table4 indicates that the severity effects are if any-thing larger for older children, a group forwhich underdiagnosis is less likely to be aproblem.
The last two panels of Table 4 present de-compositions for two additional measures ofpoor health: days in bed due to illness andthe number of hospitalization episodes in thelast year. Again, asthma accounts for a substan-tial fraction of the income gradient in these
condition indicators and a limited set of interactions be-tween condition indicators demonstrate that the adverseeffects of multiple conditions are more severe than the sumof the effects of individual conditions. Returning to ourexample of children with asthma, we find that in orderedprobits of health status, interactions between indicators ofasthma and 19 other chronic conditions are highly jointlysignificant. (Details are available from the authors.)

1320 THE AMERICAN ECONOMIC REVIEW DECEMBER 2002
TABLE 4—A DECOMPOSITION OF THE RELATIONSHIP BETWEEN HEALTH MEASURES
AND INCOME FOR SELECTED CHRONIC CONDITIONS
Condition (C)
Fraction of �H/�lny due to:
�H/�lny�H/�lny,C � 0
Severityeffect of C
Prevalenceeffect of C Residual
(1) (2) (3) (4) (5)
All Ages, H � Indicator that Health Is Fair or Poor:
Asthma �0.0163 0.7742 0.1847 0.0164 0.0247Heart condition �0.0160 0.9522 0.0388 0.0098 �0.0008Diabetes �0.0180 0.9880 0.0124 0.0017 �0.0021Epilepsy �0.0180 0.9717 0.0187 0.0101 �0.0006Deformity �0.0169 0.9133 0.0926 0.0009 �0.0067
Ages 0–8, H � Indicator that Health Is Fair or Poor:
Asthma �0.0131 0.7562 0.1744 0.0376 0.0318Heart condition �0.0145 0.9547 0.0361 0.0093 �0.0000Diabetes �0.0136 10.004 �0.0072 0.0006 0.0024Epilepsy �0.0136 0.9865 0.0068 0.0090 �0.0023Deformity �0.0151 0.9662 0.0319 0.0046 �0.0027
Ages 9–17, H � Indicator that Health Is Fair or Poor:
Asthma �0.0204 0.7896 0.1915 �0.0007 0.0196Heart condition �0.0177 0.9499 0.0413 0.0105 �0.0017Diabetes �0.0232 0.9786 0.0211 0.0023 �0.0020Epilepsy �0.0232 0.9631 0.0212 0.0101 0.0056Deformity �0.0192 0.8667 0.1382 �0.0014 �0.0035
All Ages, H � Number of Bed Days in Last Year:
Asthma �0.2340 0.3944 0.4805 0.0588 0.0663Heart condition �0.1041 0.8019 0.1086 0.0917 �0.0022Diabetes �0.2386 0.9113 0.0992 0.0064 �0.0169Epilepsy �0.2386 0.9184 0.0219 0.0604 �0.0169Deformity �0.0869 0.7414 �0.0134 0.2739 �0.0022
All Ages, H � Number of Hospital Episodes in Last Year:
Asthma �0.0106 0.5486 0.3767 0.0243 0.0504Heart condition �0.0069 0.9412 0.0192 0.0400 �0.0004Diabetes �0.0120 0.9967 �0.0005 0.0037 0.0001Epilepsy �0.0120 0.9636 0.0080 0.0286 �0.0002Deformity �0.0074 0.9792 0.0189 0.0032 �0.0014
Notes: The results in this table are based on the regressions of the form shown in Table3. Column (1) shows the coefficient on the logarithm of income from a regression of H on thelogarithm of income and the set of controls listed in the note to Table 3. Column (2) is equalto �1 divided by column (1). Column (3) is �3C� divided by column (1). Column (4) is �2�1
divided by column (1). Column (4) is column (1) minus the sum of columns (2), (3), and (4),divided by column (1).
episodes than children without asthma, this isespecially true for poor children with asthma.The other conditions shown, which are morerare than asthma, account for less of the gradi-ent, and also do not consistently show severityeffects that are substantially larger than preva-lence effects.
measures. Over 50 percent of the gradient inbed days and 40 percent of the gradient inhospitalization episodes are explained byasthma alone. Furthermore, the severity effectsfor asthma are much larger than the prevalenceeffect. Although children with asthma spendmore days in bed and have more hospitalization
1321VOL. 92 NO. 5 CASE ET AL.: ECONOMIC STATUS AND HEALTH IN CHILDHOOD
TABLE 5—HEALTH STATUS AND FAMILY INCOME AT DIFFERENT AGES, PSID(Dependent Variable: Health Status [1 � Excellent to 5 � Poor])
Variable
Panel A. Ordered Probits of Health Status on Log of Average Income in Different Periods of Life
Ages 0–3 Ages 4–8 Ages 9–12
(1) (2) (3) (4) (5) (6) (7) (8) (9) (10) (11) (12)
Log(mean income 6years to 1 yearbefore birth)
�0.137 �0.083 �0.160 �0.075 �0.176 �0.066(0.069) (0.077) (0.059) (0.070) (0.068) (0.084)
Log(mean income ages0–3)
�0.160 �0.125 �0.177 �0.022 �0.199 �0.092(0.068) (0.075) (0.056) (0.079) (0.062) (0.090)
Log(mean income ages �0.223 �0.184 �0.195 0.0404–8) (0.055) (0.070) (0.066) (0.101)
Log(mean income ages �0.236 �0.2069–12) (0.059) (0.080)
Chi-square test: joint 6.68 18.33 19.30significance ofincome coefficients
(0.0354) (0.0004) (0.0007)
Chi-square test: 0.10 1.93 2.56equality ofcoefficients
(0.7463) (0.3814) (0.4652)
Panel B. Ordered Probits of Health Status on the Log of Average Income During the Child’s Entire Life
Log(mean income �0.160 �0.253 �0.297birth year to 1997) (0.068) (0.063) (0.075)
Panel C. Ordered Probits of Health Status on the Log of Average Incomefrom Six Years Prior to Birth Through 1997
Log(mean income six �0.182 �0.257 �0.344years prior to birthto 1997)
(0.082) (0.070) (0.075)
Panel D. Ordered Probits of Health Status on the Log of Average Incomefrom Nine Years Prior to Birth Through 1997
Log(mean income nine �0.183 �0.261 �0.359years prior to birthto 1997)
(0.081) (0.072) (0.088)
Number ofobservations: 809 809 809 1,078 1,078 1,078 1,078 883 883 883 883 883
Notes: Standard errors are in parentheses. All regressions include a complete set of age dummies, and indicators that child is male, white, orblack; an indicator that mother is present; mother’s age interacted with her presence; mother’s education interacted with her presence; anindicator that father is present; father’s age interacted with his presence; father’s education interacted with his presence; and the log of familysize. If a parent’s education is missing, the mean education for that sex is assigned, and an indicator variable is included that education ismissing. Log(mean income ages 0–3) is the log of the mean income for the household when the child was between the ages of 0 and 3. Otherincome variables analogously defined.
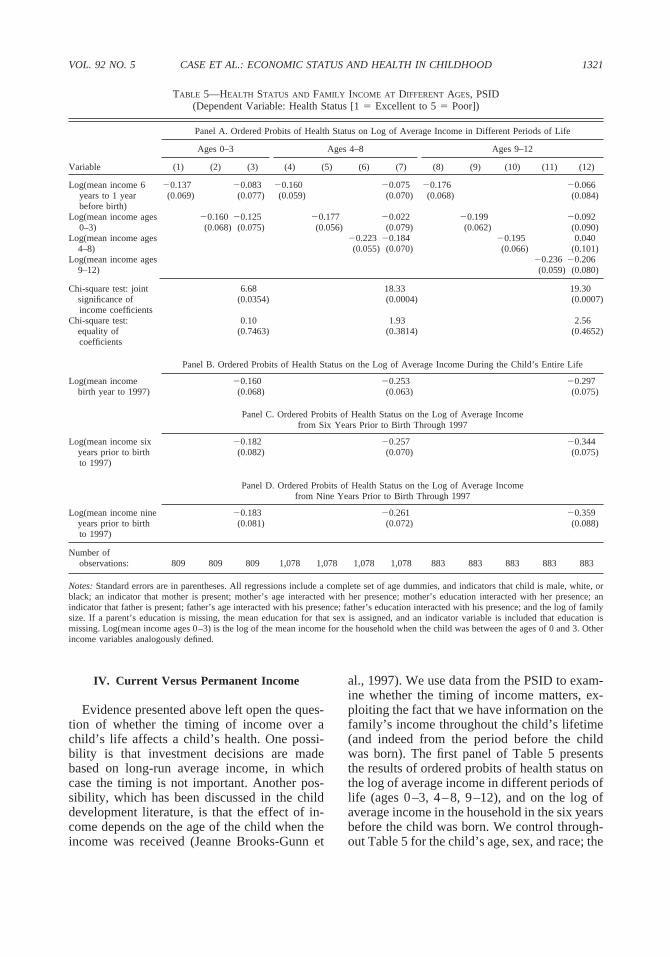
al., 1997). We use data from the PSID to exam-ine whether the timing of income matters, ex-ploiting the fact that we have information on thefamily’s income throughout the child’s lifetime(and indeed from the period before the childwas born). The first panel of Table 5 presentsthe results of ordered probits of health status onthe log of average income in different periods oflife (ages 0–3, 4–8, 9–12), and on the log ofaverage income in the household in the six yearsbefore the child was born. We control through-out Table 5 for the child’s age, sex, and race; the
IV. Current Versus Permanent Income
Evidence presented above left open the ques-tion of whether the timing of income over achild’s life affects a child’s health. One possi-bility is that investment decisions are madebased on long-run average income, in whichcase the timing is not important. Another pos-sibility, which has been discussed in the childdevelopment literature, is that the effect of in-come depends on the age of the child when theincome was received (Jeanne Brooks-Gunn et

11 We do not take this as evidence in support of thepermanent income model of consumption and saving. Un-like current consumption, health status is a stock thatevolves slowly over time. Even if the permanent incomemodel is not valid, so that current consumption tracks cur-rent income (especially for poorer consumers), health statusmay change little in response to short-term income fluctu-ations. Although health-related behaviors and stress-in-duced physical problems may change with current income,their effects on health status may take time to becomemanifest.
1322 THE AMERICAN ECONOMIC REVIEW DECEMBER 2002
presence of the child’s mother, and her age andeducation if present; the presence of the child’sfather, and his age and education if present; andthe log of family size. If a parent’s education ismissing, the mean education for that sex isassigned, and an indicator variable is includedthat education is missing. Each column of PanelA presents the results of a different orderedprobit.
We see in Table 5 that family income in theyears before the child is born and those at dif-ferent ages of life are all equally correlated witha child’s current health status. Family incomeprior to the child’s birth is significantly corre-lated with the child’s current health, for childrenof all ages [columns (1), (4), and (8) of PanelA]. Moreover, the coefficient on income prior tobirth for children aged 0–3 (�0.137) is notsignificantly different from that on income dur-ing the years when the child is aged 0–3(�0.160). The same pattern is seen for olderchildren: the coefficient on income prior to birthfor children aged 9–12 (�0.176) is not signif-icantly different from that on income duringages 0–3 (�0.199), ages 4–8 (�0.195), or ages9–12 (�0.236).
These results are consistent with the hypoth-esis that long-run average income determineshealth investments and health status at differentages. If this is true, the coefficients on incomewhen the child was aged 0–3, for children nowaged 4 or above, cannot be interpreted as theimpact of income arriving during ages 0–3. Forthese older children, the coefficient on incomefrom earlier ages (and indeed that before birth)just provides us with an estimate of the impactof permanent income on children’s health attheir current age.
We cannot reject that income at different ageshave equal effects on a child’s health status, andin the last three panels we impose their equality.We estimate ordered probits of health status onthe log of average income for all years the childhas been alive (birth year to 1997) in Panel B;on the log of average income from the six yearsprior to birth through 1997, in Panel C; and onthe log of average income from the nine yearsprior to birth through 1997, in Panel D. Usingincome since birth, we find a significant rela-tionship between income and health status thatbecomes more pronounced at older ages (thecoefficient increases from �0.160 for the
youngest children to �0.253 for children aged4–8, to �0.297 for children aged 9–12). Whenwe use income from six years prior to birththrough to current age, these coefficients be-come larger in absolute value (�0.182, �0.257,�0.344); our measure of permanent income be-comes less noisy when we use these additionalyears of data. The coefficient estimates changevery little with additional lags beyond that point(see the results when we add lags of income forseven to nine years before birth in Panel D). Wetake the evidence in Table 5 to suggest thatchildren’s health status is most closely associ-ated with the household’s permanent income,and that the impact of permanent income on achild’s health status becomes larger, the older isthe child.11
V. Understanding the Gradient
The results presented above are consistentwith a model in which permanent income af-fects children’s health status, and does so in partthrough its effect on parental management ofchildren’s chronic conditions. These results donot rule out many third factor explanations,such as a lasting effect of poor health at birth, ora spurious correlation between children’s healthand household income that derives from poorparental health. We evaluate these potential ex-planations in this section.
A. Health at Birth
The discussion above proceeded under theassumption that all children were born in excel-lent health. In fact, health at birth varies acrosschildren. Some children are born with healthproblems, such as prematurity, low birth weightfor gestational age, or congenital birth defects.
12 This is consistent with the findings of Marie C. Mc-Cormick et al. (1993) but somewhat at odds with those ofJanet Currie and Rosemary Hyson (1999). Currie and Hy-son, using data from the British National Child Develop-ment Survey (1958 birth cohort) find a significant effect oflow birth weight on the probability a woman reports fair orpoor health at age 23, but not at age 33, and a significanteffect of low birth weight on the probability that men reportfair or poor health at age 33, but not at age 23.
1323VOL. 92 NO. 5 CASE ET AL.: ECONOMIC STATUS AND HEALTH IN CHILDHOOD
There are several reasons to think that heter-ogeneity in health at birth could account for atleast some of our earlier findings. First, it maybe that children born to poorer women are atgreater risk of being born with health problems,possibly due to poorer prenatal care, higherrates of maternal smoking that accompanylower income levels, or other maternal or envi-ronmental characteristics associated with lowincome. Poor birth health could therefore pro-duce a gradient in health among very youngchildren. Second, if poorer children are bornwith the most severe health problems, ones thatrequire a longer recovery period or that result inchronic conditions, then the gap in health be-tween rich and poor children might increasewith age, as wealthier children who are born inpoor health recover whereas poorer childrenwho are born in poor health do not. Finally,holding constant the severity of health problemsat birth, wealthier children may recover fasterbecause their parents spend more on their care.
For policy purposes, it is important to exam-ine whether health at birth accounts for a largepart of the gradient between health and incomein childhood. If so, it implies that equalizing thequality of prenatal health care and working toimprove maternal health behaviors in the pre-natal period may go a long way toward elimi-nating the gradients we observe throughoutchildhood.
We use data from the NHIS to examinewhether health at birth accounts for the relation-ship between current health and current income.The core NHIS collects no information onhealth at birth. However, the NHIS-CH supple-ment collects information for one child per fam-ily on the child’s birth weight and the number ofnights the child spent in the hospital after thebirth. In Table 6, we show results of orderedprobits of current health status on poor health atbirth, including interactions of poor birth healthwith age and income. We use, as an indicator ofpoor health at birth, that a child spent one weekor longer in the hospital after birth and/or thatthe child was born at very low birth weight (lessthan 3.5 pounds). This assigns poor birth healthto 10 percent of our sample. (Results are similarusing different cutoffs for poor birth health.)
The results indicate that poor birth health haslarger adverse effects on children at low incomelevels, and that improvements with age are
slower for poorer children. Column (2) showsthat poor health at birth is positively related topoor health later in life, but that the effects ofpoor health at birth diminish with age. Theaddition of controls for poor health at birth hasvery little effect on the health-income gradient,or on our estimate of the rotation of the gradientwith age. Results in column (2) also suggest thatthe adverse effects of poor health at birth oncurrent health dissipate with age.12 The thirdcolumn includes an interaction of health at birthand income, and indicates that poor birth healthhas a larger adverse effect on poorer children. Inthe fourth column, we examine the hypothesisthat higher-income children recover from poorhealth at birth more quickly than do poorerchildren, by including an interaction of age,poor health at birth, and income. (The birthhealth/income interaction is omitted, which im-poses the implicit restriction that poor health atbirth has identical effects on health status forpoor and rich children at age 0.) The parameterestimate for this interaction term is negative andmarginally significant, indicating that the ad-verse effects of health at birth on current healthdecline more quickly with age for wealthierchildren. The final column shows results of anordered probit that include a complete set ofinteractions of poor health at birth with age,income, and income times age. The parameterestimates are consistent with the hypothesis thatwealthier children are less affected by poorhealth at birth, and recover more quickly. How-ever, although the “health at birth” variables arejointly significant, with this number of interac-tions the individual parameters are not esti-mated precisely. Most important for ouranalysis, adding controls for birth health doesnot alter the basic finding that lower income isassociated with worse health. Health at birthdoes not account for the income gradient inchildhood health.

1324 THE AMERICAN ECONOMIC REVIEW DECEMBER 2002
TABLE 6—BIRTH HEALTH AND INCOME, NHIS-CH: Ordered Probits(Dependent Variable: Health Status [1 � Excellent to 5 � Poor])
Variable (1) (2) (3) (4) (5)
lny �0.091 �0.086 �0.082 �0.087 �0.087(0.020) (0.020) (0.021) (0.020) (0.021)
Age 0.067 0.074 0.072 0.065 0.065(0.020) (0.020) (0.020) (0.020) (0.021)
lny age �0.006 �0.007 �0.007 �0.006 �0.006(0.002) (0.002) (0.002) (0.002) (0.002)
Indicator: poor birth health 0.400 0.847 0.397 0.354(0.062) (0.315) (0.062) (0.595)
(Poor birth health) age �0.026 �0.025 0.029 0.033(0.006) (0.006) (0.032) (0.060)
(Poor birth health) lny �0.047 0.004(0.032) (0.061)
(Poor birth health) lny �0.006 �0.006 age (0.003) (0.006)
Chi-square test: 48.41 50.46 51.43 51.44joint significance of birthhealth and all birth healthinteractions
(0.0000) (0.0000) (0.0000) (0.0000)
Chi-square test: 20.06 20.96 20.97joint significance of birthhealth interactions
(0.0000) (0.0000) (0.0000)
Notes: Standard errors are in parentheses. “Poor birth health” is an indicator variable equal to1 if birth weight is less than 3.5 pounds or the child is in the hospital for one week or longerafter the birth. Sample size � 13,841. Other controls include a complete set of age dummies,the logarithm of family size, indicators variables for whether the child has a mother in thehousehold, a father in the household, whether the child is male, black, or white; interactionsof the indicator for whether a mother is in the household with mother’s age and mother’seducation, and interactions of the indicator for whether a father is in the household withfather’s age and father’s education. Other controls include dummy variables for whether boththe mother and father were respondents to the health survey, whether the father and not themother was a respondent to the health survey, and whether neither the mother nor father wererespondents to the health survey (the excluded category is that the mother but not the fatherwas the respondent).
in poor health have lower earnings, and poorhealth is transmitted from parents to children—producing a spurious correlation between in-come and children’s health.
This line of reasoning might suggest equa-tions of the form shown in Table 2 shouldinclude controls for parental health. However,doing so has several potential pitfalls. If thehealth of parents is affected by their incomelevels (as is argued in much of the literature onsocioeconomic status and health), and income ismeasured with error, then the “effects” of pa-rental health may simply reflect the effects ofincome. In addition, if the health of both parentsand children are affected by current and laggedvalues of income, the parental health may serve
B. Parental Health as a Determinant ofChildren’s Health
Children’ s health may also be affected bythe health status of their parents, possiblythrough an inherited susceptibility to differentdiseases, a less healthy uterine environment,or lower quality care by sick parents. In ad-dition, the health of parents and childrenmight be affected by common but unmeasuredenvironmental factors, resulting in a correla-tion between their health levels. It is alsopossible that parental health is a “ third factor”that accounts for the income gradient inchildren’ s health: an income gradient inchildren’ s health might be observed if parents
1325VOL. 92 NO. 5 CASE ET AL.: ECONOMIC STATUS AND HEALTH IN CHILDHOOD
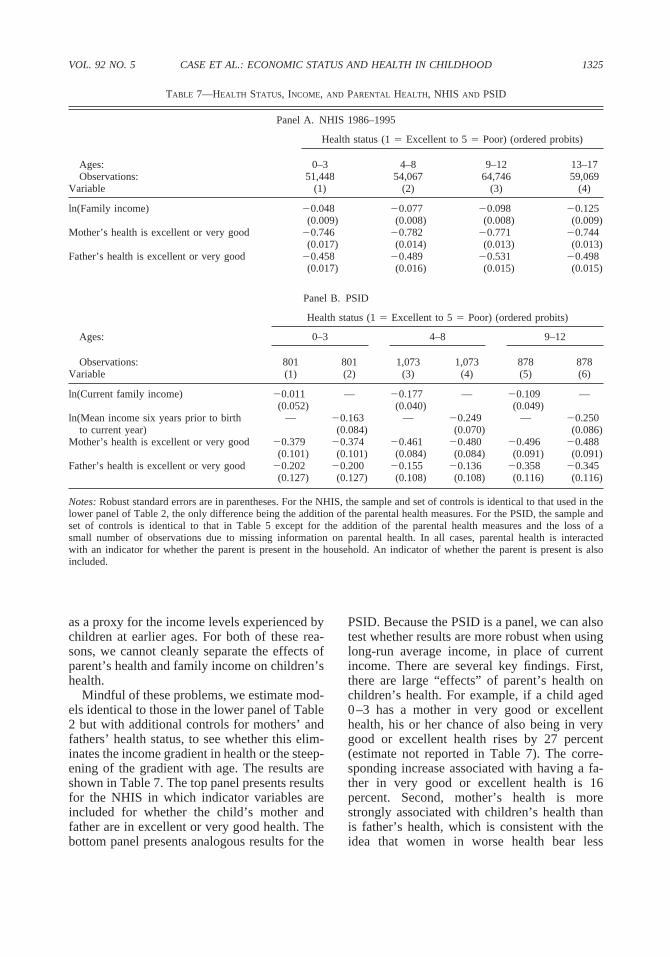
TABLE 7—HEALTH STATUS, INCOME, AND PARENTAL HEALTH, NHIS AND PSID
Panel A. NHIS 1986–1995
Health status (1 � Excellent to 5 � Poor) (ordered probits)
Ages: 0–3 4–8 9–12 13–17Observations: 51,448 54,067 64,746 59,069
Variable (1) (2) (3) (4)
ln(Family income) �0.048 �0.077 �0.098 �0.125(0.009) (0.008) (0.008) (0.009)
Mother’s health is excellent or very good �0.746 �0.782 �0.771 �0.744(0.017) (0.014) (0.013) (0.013)
Father’s health is excellent or very good �0.458 �0.489 �0.531 �0.498(0.017) (0.016) (0.015) (0.015)
Panel B. PSID
Ages:
Health status (1 � Excellent to 5 � Poor) (ordered probits)
0–3 4–8 9–12
Observations: 801 801 1,073 1,073 878 878Variable (1) (2) (3) (4) (5) (6)
ln(Current family income) �0.011 — �0.177 — �0.109 —(0.052) (0.040) (0.049)
ln(Mean income six years prior to birth — �0.163 — �0.249 — �0.250to current year) (0.084) (0.070) (0.086)
Mother’s health is excellent or very good �0.379 �0.374 �0.461 �0.480 �0.496 �0.488(0.101) (0.101) (0.084) (0.084) (0.091) (0.091)
Father’s health is excellent or very good �0.202 �0.200 �0.155 �0.136 �0.358 �0.345(0.127) (0.127) (0.108) (0.108) (0.116) (0.116)
Notes: Robust standard errors are in parentheses. For the NHIS, the sample and set of controls is identical to that used in thelower panel of Table 2, the only difference being the addition of the parental health measures. For the PSID, the sample andset of controls is identical to that in Table 5 except for the addition of the parental health measures and the loss of asmall number of observations due to missing information on parental health. In all cases, parental health is interactedwith an indicator for whether the parent is present in the household. An indicator of whether the parent is present is alsoincluded.
PSID. Because the PSID is a panel, we can alsotest whether results are more robust when usinglong-run average income, in place of currentincome. There are several key findings. First,there are large “effects” of parent’s health onchildren’s health. For example, if a child aged0–3 has a mother in very good or excellenthealth, his or her chance of also being in verygood or excellent health rises by 27 percent(estimate not reported in Table 7). The corre-sponding increase associated with having a fa-ther in very good or excellent health is 16percent. Second, mother’s health is morestrongly associated with children’s health thanis father’s health, which is consistent with theidea that women in worse health bear less
as a proxy for the income levels experienced bychildren at earlier ages. For both of these rea-sons, we cannot cleanly separate the effects ofparent’s health and family income on children’shealth.
Mindful of these problems, we estimate mod-els identical to those in the lower panel of Table2 but with additional controls for mothers’ andfathers’ health status, to see whether this elim-inates the income gradient in health or the steep-ening of the gradient with age. The results areshown in Table 7. The top panel presents resultsfor the NHIS in which indicator variables areincluded for whether the child’s mother andfather are in excellent or very good health. Thebottom panel presents analogous results for the

1326 THE AMERICAN ECONOMIC REVIEW DECEMBER 2002
healthy children, or that poor health in womenmakes them less able caregivers.13
Third, the inclusion of controls for parents’health reduces the coefficients on family in-come. For children in the oldest age group, thecoefficient on family income in an ordered pro-bit of health status declines from �0.218 whenno health variables are included (lower panel ofTable 2), to �0.125 when indicators of whetherparent’s health is excellent or very good areincluded. However, these estimates are stilllarge and highly significant. In addition, thegradients in income still increase substantiallywith the age of the child, whereas the gradientsin parental health do not. Controlling for paren-tal health status does not eliminate the rotationof the gradient with age.
The results in the lower panel, using thePSID, provide evidence that some of the de-cline in the coefficients for family incomemay be because parental health is a proxy forpermanent or long-run income. As was truefor the NHIS, when controls for parentalhealth are added, the coefficients on currentfamily income decline [columns (1), (3), and(5)]. However, when long-run income is sub-stituted for current income, the coefficients onfamily income return to values that are similarto those in Table 5. Although parental health(and especially maternal health) is associatedwith child health, it does not account for therelationship between long-run income andchild health.14
13 We also estimated regressions with a complete set ofindicators for parental health (along a five-point scale).There is a nonmonotonic relationship between mother’shealth status and that of children aged 0–3: as one movesfrom “ fair” to “poor” health of the mother, the child’s healthstatus improves. Perhaps when mother’s health is especiallypoor fathers play a bigger role in children’s health provi-sion. We also find evidence that a parent’s health has abigger “effect” on a child’s health if that parent is therespondent, and a smaller (although still large and signifi-cant) effect if the other parent is the respondent. This is truefor both mothers and fathers. This is evidence of a possiblereporting bias, so that sick parents think of their children asmore sickly. An alternative explanation is that when theother parent reports, the health of the parent who does notreport is measured with more error, and this shows up as anattenuated coefficient. In either case, the income effect isunchanged when these interactions are included.
C. Genetic Ties
The powerful connection between parents’health status and children’s health status leadsus to ask whether permanent income is simplyproxying for a genetic tie between parents andchildren. A simple genetic story is that parentswho are healthier have healthier children, andalso earn more money because of their betterhealth endowments. We use information onadoptive versus biological parents (available inthe NHIS-CH) to test this hypothesis. Providedthat wealthier adoptive parents are not in aposition to select healthier infants, we shouldfind a significant income gradient in the healthof birth children, but little gradient in the healthof adopted children, if a simple genetic story isdriving our results. Panel A of Table 8 showsestimates of ordered probits identical to those inTable 2 (using Controls 2), but on the smallerNHIS-CH sample. As before, we find an incomegradient in health that increases with age. Theordered probits in Panel B add a complete set ofindicators for family type: birth mother andfather, birth mother and other father, birthmother only, other mother only, other motherand birth father, birth father only, other fatheronly, or two nonbirth parents, and each of thesecontrols interacted with the log of family in-come. We present in the table the coefficientsfor two polar cases: the income effect for a childliving with both birth parents, and the incomeeffect for a child living with two nonbirth par-ents. For no age group is there a significantdifference in the impact of income based onparental type and, for three of the four agegroups, the impact of income is larger for chil-dren living with nonbirth parents. We cannotreject equality of the eight income parentaltype coefficients for any age group. These re-sults cast doubt on the simple genetic story.
14 Interestingly, the coefficients on parental health do notchange when long-run income is substituted for current
income. This is not because parental health is uncorrelatedwith long-run income: an ordered probit of mother’s healthstatus on all of the controls appearing in Table 7 showmother’s health to be significantly correlated with long-runaverage family income ( z-score � 3.3). However, when thelogarithm of long-run family income is omitted from or-dered probits of children’s health, its effect is absorbedprimarily by an indicator that the child is black (whichincreases by 28 percent), and by mother’s education (whichmore than doubles in absolute value), and by father’s edu-cation (which increases by 50 percent in absolute value).
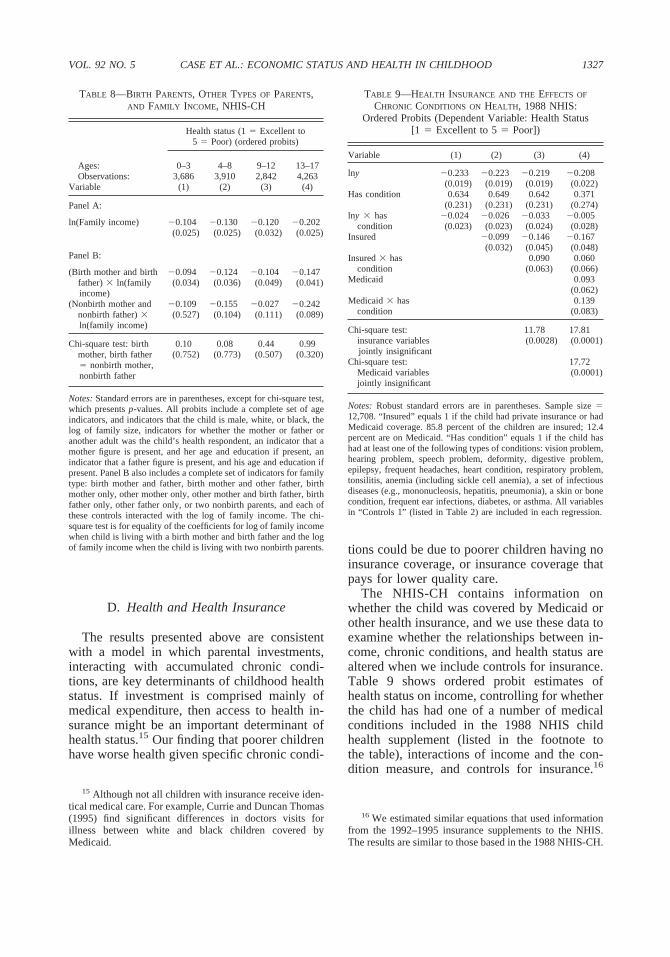
1327VOL. 92 NO. 5 CASE ET AL.: ECONOMIC STATUS AND HEALTH IN CHILDHOOD
D. Health and Health Insurance
The results presented above are consistentwith a model in which parental investments,interacting with accumulated chronic condi-tions, are key determinants of childhood healthstatus. If investment is comprised mainly ofmedical expenditure, then access to health in-surance might be an important determinant ofhealth status.15 Our finding that poorer childrenhave worse health given specific chronic condi-
TABLE 8—BIRTH PARENTS, OTHER TYPES OF PARENTS,AND FAMILY INCOME, NHIS-CH
Health status (1 � Excellent to5 � Poor) (ordered probits)
Ages: 0–3 4–8 9–12 13–17Observations: 3,686 3,910 2,842 4,263
Variable (1) (2) (3) (4)
Panel A:
ln(Family income) �0.104 �0.130 �0.120 �0.202(0.025) (0.025) (0.032) (0.025)
Panel B:
(Birth mother and birth �0.094 �0.124 �0.104 �0.147father) ln(familyincome)
(0.034) (0.036) (0.049) (0.041)
(Nonbirth mother and �0.109 �0.155 �0.027 �0.242nonbirth father) ln(family income)
(0.527) (0.104) (0.111) (0.089)
Chi-square test: birth 0.10 0.08 0.44 0.99mother, birth father� nonbirth mother,nonbirth father
(0.752) (0.773) (0.507) (0.320)
Notes: Standard errors are in parentheses, except for chi-square test,which presents p-values. All probits include a complete set of ageindicators, and indicators that the child is male, white, or black, thelog of family size, indicators for whether the mother or father oranother adult was the child’s health respondent, an indicator that amother figure is present, and her age and education if present, anindicator that a father figure is present, and his age and education ifpresent. Panel B also includes a complete set of indicators for familytype: birth mother and father, birth mother and other father, birthmother only, other mother only, other mother and birth father, birthfather only, other father only, or two nonbirth parents, and each ofthese controls interacted with the log of family income. The chi-square test is for equality of the coefficients for log of family incomewhen child is living with a birth mother and birth father and the logof family income when the child is living with two nonbirth parents.
15 Although not all children with insurance receive iden-tical medical care. For example, Currie and Duncan Thomas(1995) find significant differences in doctors visits forillness between white and black children covered byMedicaid.
tions could be due to poorer children having noinsurance coverage, or insurance coverage thatpays for lower quality care.
The NHIS-CH contains information onwhether the child was covered by Medicaid orother health insurance, and we use these data toexamine whether the relationships between in-come, chronic conditions, and health status arealtered when we include controls for insurance.Table 9 shows ordered probit estimates ofhealth status on income, controlling for whetherthe child has had one of a number of medicalconditions included in the 1988 NHIS childhealth supplement (listed in the footnote tothe table), interactions of income and the con-dition measure, and controls for insurance.16
TABLE 9—HEALTH INSURANCE AND THE EFFECTS OF
CHRONIC CONDITIONS ON HEALTH, 1988 NHIS:Ordered Probits (Dependent Variable: Health Status
[1 � Excellent to 5 � Poor])
Variable (1) (2) (3) (4)
lny �0.233 �0.223 �0.219 �0.208(0.019) (0.019) (0.019) (0.022)
Has condition 0.634 0.649 0.642 0.371(0.231) (0.231) (0.231) (0.274)
lny has �0.024 �0.026 �0.033 �0.005condition (0.023) (0.023) (0.024) (0.028)
Insured �0.099 �0.146 �0.167(0.032) (0.045) (0.048)
Insured has 0.090 0.060condition (0.063) (0.066)
Medicaid 0.093(0.062)
Medicaid has 0.139condition (0.083)
Chi-square test: 11.78 17.81insurance variablesjointly insignificant
(0.0028) (0.0001)
Chi-square test: 17.72Medicaid variables (0.0001)jointly insignificant
Notes: Robust standard errors are in parentheses. Sample size �12,708. “ Insured” equals 1 if the child had private insurance or hadMedicaid coverage. 85.8 percent of the children are insured; 12.4percent are on Medicaid. “Has condition” equals 1 if the child hashad at least one of the following types of conditions: vision problem,hearing problem, speech problem, deformity, digestive problem,epilepsy, frequent headaches, heart condition, respiratory problem,tonsilitis, anemia (including sickle cell anemia), a set of infectiousdiseases (e.g., mononucleosis, hepatitis, pneumonia), a skin or bonecondition, frequent ear infections, diabetes, or asthma. All variablesin “Controls 1” (listed in Table 2) are included in each regression.
16 We estimated similar equations that used informationfrom the 1992–1995 insurance supplements to the NHIS.The results are similar to those based in the 1988 NHIS-CH.
1328 THE AMERICAN ECONOMIC REVIEW DECEMBER 2002
The second column indicates that childrenwith insurance— either private insurance orMedicaid—are in significantly better health.The point estimate indicates that in the absenceof any medical conditions, being insured has thesame effect on health status as a 54-percentincrease in income. However, adding the insur-ance measure does not alter the estimated ef-fects of income on health. The third columnadds an interaction of the indicators for whetherthe child is insured and whether he or she has anadverse medical condition. This coefficientshould be negative if families with insuranceare better equipped to deal with medical prob-lems. Instead, it is positive and impreciselyestimated.
This anomalous result could be due to the factthat the insurance measure includes Medicaid,and a child on Medicaid may have worse healthfor a variety of other reasons. (The parents ofpoor children may learn that their children areeligible for Medicaid only when the children aresick and presented for treatment.) In the fourthcolumn we add an indicator for whether thechild receives Medicaid, and an interaction ofMedicaid with the condition indicator. We findthat adding these controls for Medicaid does notalter the previous finding that insurance doesnothing to improve the health of children withadverse medical conditions. In addition, the re-sults indicate that children who are insured andreceive Medicaid have worse health status thanthose who have private insurance, and the hy-pothesis that the net effect of Medicaid onhealth is zero (given no adverse medical condi-tions) cannot be rejected.17 Children who re-ceive Medicaid and have a medical conditionhave significantly worse health status than thosewith no insurance and a medical condition (F-statistic � 4.41, p-value � 0.04). It seems im-plausible that Medicaid actually damageschildren’s health (see Currie and Jonathan Gru-
17 The net effect of having Medicaid when there are noadverse health conditions is �0.1171 � 0.0754 � �0.0417.The F-statistic for the test that this effect equals zero is 0.79( p-value � 0.38).
ber, 1996, on the beneficial impact of Medicaidexpansions on infant mortality rates) and wethink the more likely explanation for this resultis that Medicaid is correlated with unmeasuredfamily characteristics that are related to poorhealth outcomes. For our purposes, the impor-tant finding is that controlling for insurancedoes not substantially alter the estimated effectsof income on health.
E. Children’s Health andMaternal Labor Supply
Another possible explanation for the in-come gradient in children’ s health is that theparents of less-healthy children reduce theirlabor supply, producing a positive correlationbetween low income and poor health. Ourearlier results suggest that this is unlikely toprovide a complete explanation of our find-ings: incomes from before the child was bornwere seen to have as strong an effect onchildren’ s health status in the PSID as incomein any period of a child’ s life. We provideadditional evidence here, using data from thePSID to examine the impact of a child’ s poorhealth at birth on subsequent maternal laborsupply. We focus on birth health in Table10, in order to compare mother’ s labor-supplydecisions before and after the birth of thechild in poor health. (It is not possible toassess how health problems contracted laterin childhood affect maternal labor supply,because the PSID does not provide informa-tion on the date of onset of health problems.)We look at maternal labor supply during thefirst three years of a child’ s life, since ourearlier results indicate that poor health at birthcarries over into poor health in this time pe-riod. The PSID has information on whetherthe child was born at low weight (5.5 poundsor less) or spent time in a neonatal intensivecare unit, which we use to construct an indi-cator of poor health at birth.
Table 10 shows regressions of an indicator ofmothers’ employment status on an indicator ofthe child’s health at birth. These results provideevidence that poor health at birth does not affectmaternal labor supply. Mothers of infants withhealth problems are not significantly less likelyto work in the first three years of the child’s
The advantage of using the NHIS-CH for this analysis isthat information on a wide range of medical conditions wascollected from all sample children, so that it is possible toconstruct a measure of whether the child had any of anumber of health conditions.

1329VOL. 92 NO. 5 CASE ET AL.: ECONOMIC STATUS AND HEALTH IN CHILDHOOD
TABLE 10—MOTHERS’ LABOR-FORCE PARTICIPATION FOLLOWING THE BIRTH OF A CHILD, PSID
Variable
Indicator: mother worksin birth year
Indicator: mother worksin 1st year after birth
Indicator: mother worksin 2nd year after birth
(1) (2) (3) (4) (5) (6) (7) (8) (9)
Indicator: low birth 0.015 0.009 0.014 0.023 �0.012 �0.009 0.021 0.008 0.001weight or ICU stay (0.032) (0.031) (0.048) (0.031) (0.031) (0.052) (0.034) (0.035) (0.058)
Indicator: mother 0.461 0.422 0.384worked year before (0.022) (0.023) (0.025)
ICU/LBW mother 0.455 0.416 0.394worked year beforebirth
(0.060) (0.061) (0.065)
Not ICU/LBW 0.462 0.423 0.382mother worked yearbefore birth
(0.024) (0.024) (0.027)
F-test: ICU � not ICU 0.01 0.01 0.03( p-value) (0.9101) (0.9237) (0.8696)
Number of observations: 1,996 1,799 1,799 2,083 1,782 1,782 1,722 1,508 1,508
Notes: Robust standard errors are in parentheses, estimated allowing correlation between unobservables for children in thesame household. Also included in all regressions are mother’s age and education (if she is present in the household); father’seducation (if he is present in the household); indicators that mother and father are present in the birth year [columns (1), (4),and (7)]; in the 1st year after birth [columns (2), (5), and (8)]; and in the 2nd year after birth [columns (3), (6), and (9)]; andindicators that the mother is white and that the mother is black. The variable ICU/LBW is an indicator that the child had alow birth weight (less than 2,500 grams, 5.5 pounds) or that the child was moved to a neonatal intensive care unit (ICU) afterbirth.
18 Evidence on mothers’ work hours, and on fathers’labor-force participation, are consistent with results pre-sented in Table 10. These are available from the authorsupon request.
differences in parent and child health-relatedbehaviors at different levels of income. Choicesmade concerning how often a child sees a doc-tor or dentist, how closely a child is supervisedat home, and whether the child wears a seat belt,together with family routines and eating habits,may have both short-term and long-term healthimplications. Many of these behaviors are cor-related with socioeconomic status, and so maypotentially explain at least part of the associa-tion between children’s health and householdincome. Case and Paxson (2002) found thatchildren in higher-income households are sig-nificantly more likely to wear seat belts and tohave a regular bedtime, and are significantlyless likely to live with a cigarette smoker. Al-though these behaviors are correlated with in-come, it is not possible to tell whether the effectof income is causal: buckling seat belts does notcost money; neither does refraining from smok-ing at home. However, it is possible that thelack of adequate resources strips parents of theenergy necessary to wrestle children into seatbelts. Poorer parents may also smoke to bufferthemselves from poverty-related stress anddepression.
That these parent and child health-related be-haviors are correlated with children’s health
life; neither do they work significantly fewerhours.18 In the first regression, the coefficient onthe indicator of poor health at birth is typicallypositive, although not significantly differentfrom zero. The second column indicates thatwhether a woman worked in the year prior tothe birth is an important determinant of whetherand how much a mother works in the first threeyears after the birth. However, as indicated inthe third column, of mothers who worked priorto the child’s birth, there is no significant dif-ference in work status of those who did and didnot have a child with poor health at birth. Ourconclusion is that the positive relationship be-tween income and health in childhood is not dueto the poor health of children reducing familyincome.
F. Parent and Child Health-RelatedBehaviors
The robust relationship between children’shealth status and family income may be due to
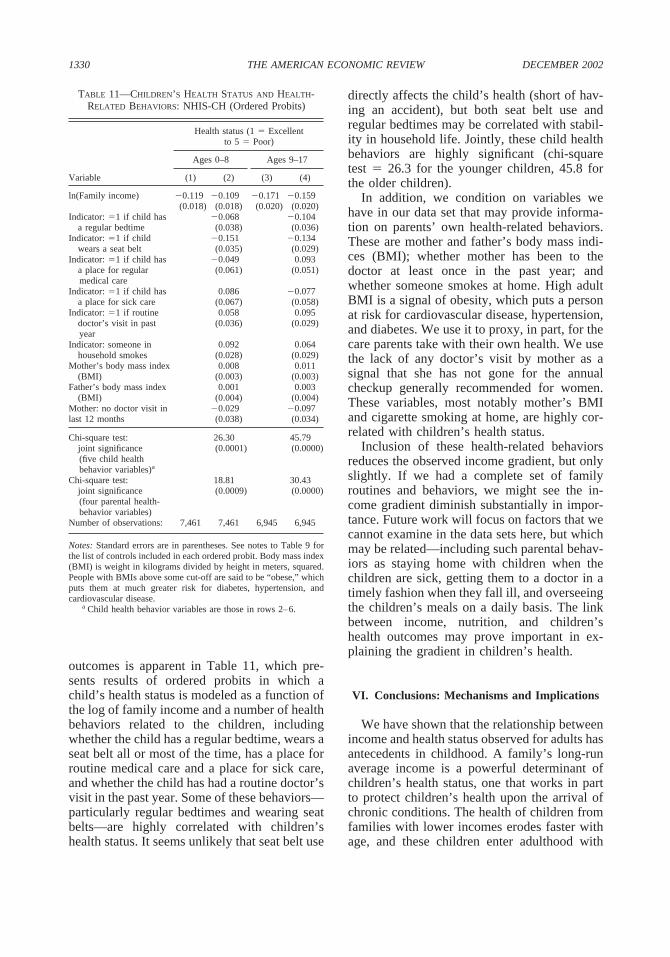
1330 THE AMERICAN ECONOMIC REVIEW DECEMBER 2002
outcomes is apparent in Table 11, which pre-sents results of ordered probits in which achild’s health status is modeled as a function ofthe log of family income and a number of healthbehaviors related to the children, includingwhether the child has a regular bedtime, wears aseat belt all or most of the time, has a place forroutine medical care and a place for sick care,and whether the child has had a routine doctor’svisit in the past year. Some of these behaviors—particularly regular bedtimes and wearing seatbelts—are highly correlated with children’shealth status. It seems unlikely that seat belt use
TABLE 11—CHILDREN’S HEALTH STATUS AND HEALTH-RELATED BEHAVIORS: NHIS-CH (Ordered Probits)
Variable
Health status (1 � Excellentto 5 � Poor)
Ages 0–8 Ages 9–17
(1) (2) (3) (4)
ln(Family income) �0.119 �0.109 �0.171 �0.159(0.018) (0.018) (0.020) (0.020)
Indicator: �1 if child has �0.068 �0.104a regular bedtime (0.038) (0.036)
Indicator: �1 if child �0.151 �0.134wears a seat belt (0.035) (0.029)
Indicator: �1 if child has �0.049 0.093a place for regularmedical care
(0.061) (0.051)
Indicator: �1 if child has 0.086 �0.077a place for sick care (0.067) (0.058)
Indicator: �1 if routine 0.058 0.095doctor’s visit in pastyear
(0.036) (0.029)
Indicator: someone in 0.092 0.064household smokes (0.028) (0.029)
Mother’s body mass index 0.008 0.011(BMI) (0.003) (0.003)
Father’s body mass index 0.001 0.003(BMI) (0.004) (0.004)
Mother: no doctor visit in �0.029 �0.097last 12 months (0.038) (0.034)
Chi-square test: 26.30 45.79joint significance(five child healthbehavior variables)a
(0.0001) (0.0000)
Chi-square test: 18.81 30.43joint significance(four parental health-behavior variables)
(0.0009) (0.0000)
Number of observations: 7,461 7,461 6,945 6,945
Notes: Standard errors are in parentheses. See notes to Table 9 forthe list of controls included in each ordered probit. Body mass index(BMI) is weight in kilograms divided by height in meters, squared.People with BMIs above some cut-off are said to be “obese,” whichputs them at much greater risk for diabetes, hypertension, andcardiovascular disease.
a Child health behavior variables are those in rows 2–6.
directly affects the child’s health (short of hav-ing an accident), but both seat belt use andregular bedtimes may be correlated with stabil-ity in household life. Jointly, these child healthbehaviors are highly significant (chi-squaretest � 26.3 for the younger children, 45.8 forthe older children).
In addition, we condition on variables wehave in our data set that may provide informa-tion on parents’ own health-related behaviors.These are mother and father’s body mass indi-ces (BMI); whether mother has been to thedoctor at least once in the past year; andwhether someone smokes at home. High adultBMI is a signal of obesity, which puts a personat risk for cardiovascular disease, hypertension,and diabetes. We use it to proxy, in part, for thecare parents take with their own health. We usethe lack of any doctor’s visit by mother as asignal that she has not gone for the annualcheckup generally recommended for women.These variables, most notably mother’s BMIand cigarette smoking at home, are highly cor-related with children’s health status.
Inclusion of these health-related behaviorsreduces the observed income gradient, but onlyslightly. If we had a complete set of familyroutines and behaviors, we might see the in-come gradient diminish substantially in impor-tance. Future work will focus on factors that wecannot examine in the data sets here, but whichmay be related—including such parental behav-iors as staying home with children when thechildren are sick, getting them to a doctor in atimely fashion when they fall ill, and overseeingthe children’s meals on a daily basis. The linkbetween income, nutrition, and children’shealth outcomes may prove important in ex-plaining the gradient in children’s health.
VI. Conclusions: Mechanisms and Implications
We have shown that the relationship betweenincome and health status observed for adults hasantecedents in childhood. A family’s long-runaverage income is a powerful determinant ofchildren’s health status, one that works in partto protect children’s health upon the arrival ofchronic conditions. The health of children fromfamilies with lower incomes erodes faster withage, and these children enter adulthood with

1331VOL. 92 NO. 5 CASE ET AL.: ECONOMIC STATUS AND HEALTH IN CHILDHOOD
both lower socioeconomic status and poorerhealth.
An important priority for future research is toidentify the mechanisms that underlie the rela-tionship between income and children’s health.We have been able to rule out several possiblemechanisms: insurance does not play a crucialrole in protecting health upon the arrival of achronic condition, health in childhood does notappear to be a persistent reflection of health atbirth, and a simple genetic model cannot ex-plain the association between health andincome.
The results in this paper highlight the role ofchronic conditions in the relationship betweenincome and health. It may be that higher-income parents are better able to manage chronichealth problems. For example, socioeconomicstatus has been implicated as a determinant ofadherence to and compliance with treatmentsfor childhood epilepsy (S. R. Snodgrass et al.,2001) and diabetes (Catherine L. Davis et al.,2001; S. J. Thompson et al., 2001).
What are the implications of poor health inchildhood? In addition to the direct welfare andfinancial costs of illness, poor childhood healthresults in lower levels of human capital accu-mulation. Less-healthy children spend moredays in bed and miss more school. We haveexplored the implications of this for years ofcompleted schooling using data on school-agedchildren (ages 5–17) from the NHIS-CH. Inregressions of years of completed education ona complete set of age indicators, income,whether the child has one of the medical con-ditions defined in the footnote to Table 9, andinteractions of income and the condition indi-cator, we find that having a condition reducesyears of education, but that it does so less forchildren with higher incomes. In addition, thegreater adverse effect of having a medical con-dition for a poorer child grows larger as thechild becomes older: the positive effect of in-come on education when a condition is presentis more than four times larger for the older agegroup. Poorer children arrive at the doorstep ofadulthood with lower health status and with lesseducation. It is an open question whether thesefactors result in lower earnings as adults—con-tributing to the gradients observed in adulthoodand providing a partial explanation for observedintergenerational transmission of poverty.
APPENDIX
National Health Interview Survey 1986–1995
The NHIS asks a knowledgeable householdmember to report on the health status and healthconditions of children aged 0–17. Each house-hold was randomly assigned to answer ques-tions from one of six “conditions lists,” andinformation was collected on whether eachhousehold member had experienced each of themedical conditions on the assigned conditionlist. (The NHIS was substantially redesignedafter 1995, which limits us to the period1986–1995.)
We start with 314,455 children aged 0–17,and drop 43,707 cases (14 percent) for whomhousehold income is not reported. After remov-ing these observations, we also exclude childrenwho fall into the following categories: (1) Wedeliberately exclude children when there isdoubt about whether reported household in-come adequately reflects the income over whichthe child may have a claim. Thus we removefrom our analysis children who, at the time ofthe interview, were not living with at least oneof their parents (5,483 cases). (2) We removechildren who were not the sons or daughters ofthe reference person or spouse (18,608 chil-dren). Our concern with including children re-siding with a grandparent head of household(the largest alternative to residing with a paren-tal head—13,741 cases) is that we do not knowhow long the child has lived with the grandpar-ent, and we may be falsely assigning to the childincome that does not reflect the income in whichthe child has a share, or has had a share for anunknown period of time. (3) We remove chil-dren in households containing more than onefamily (899 children), and children who are notmembers of the “primary family” within thehousehold (2,382 children). (4) We remove5,095 children from households where childrenin the households are reported to be of differentraces. (Difference in race within a sibship mayreflect children having fathers of different races,and we would not choose to remove such chil-dren just for this reason. However, difference inreported race may also be due to measurementerror, or to children being fostered.) (5) We arealso interested in whether our results are robustto the inclusion (exclusion) of controls for
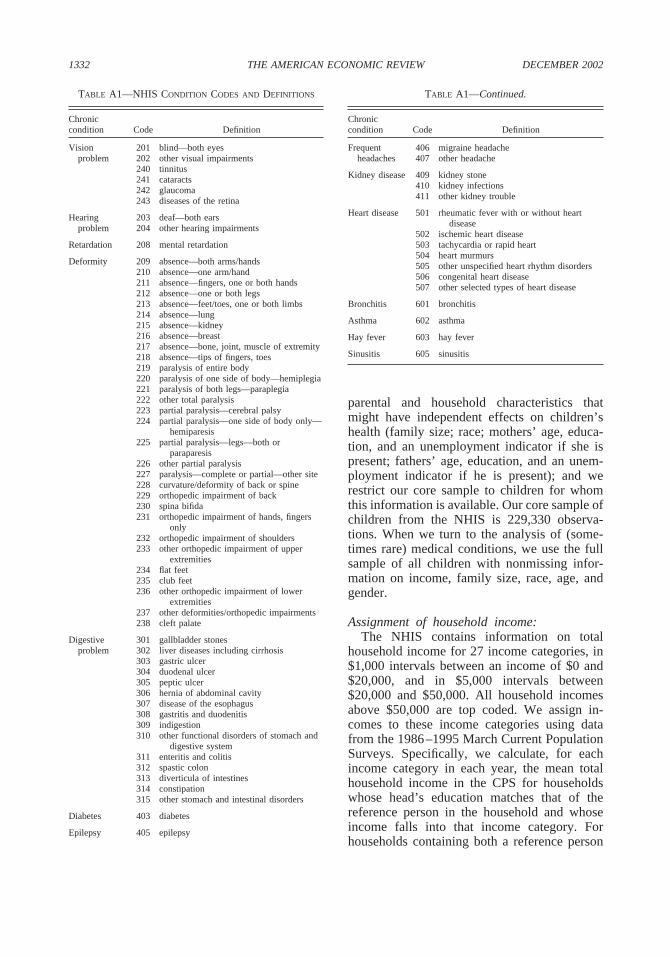
1332 THE AMERICAN ECONOMIC REVIEW DECEMBER 2002
TABLE A1—NHIS CONDITION CODES AND DEFINITIONS
Chroniccondition Code Definition
Vision 201 blind—both eyesproblem 202 other visual impairments
240 tinnitus241 cataracts242 glaucoma243 diseases of the retina
Hearing 203 deaf—both earsproblem 204 other hearing impairments
Retardation 208 mental retardation
Deformity 209 absence—both arms/hands210 absence—one arm/hand211 absence—fingers, one or both hands212 absence—one or both legs213 absence—feet/toes, one or both limbs214 absence—lung215 absence—kidney216 absence—breast217 absence—bone, joint, muscle of extremity218 absence—tips of fingers, toes219 paralysis of entire body220 paralysis of one side of body—hemiplegia221 paralysis of both legs—paraplegia222 other total paralysis223 partial paralysis—cerebral palsy224 partial paralysis—one side of body only—
hemiparesis225 partial paralysis—legs—both or
paraparesis226 other partial paralysis227 paralysis—complete or partial—other site228 curvature/deformity of back or spine229 orthopedic impairment of back230 spina bifida231 orthopedic impairment of hands, fingers
only232 orthopedic impairment of shoulders233 other orthopedic impairment of upper
extremities234 flat feet235 club feet236 other orthopedic impairment of lower
extremities237 other deformities/orthopedic impairments238 cleft palate
Digestive 301 gallbladder stonesproblem 302 liver diseases including cirrhosis
303 gastric ulcer304 duodenal ulcer305 peptic ulcer306 hernia of abdominal cavity307 disease of the esophagus308 gastritis and duodenitis309 indigestion310 other functional disorders of stomach and
digestive system311 enteritis and colitis312 spastic colon313 diverticula of intestines314 constipation315 other stomach and intestinal disorders
Diabetes 403 diabetes
Epilepsy 405 epilepsy
parental and household characteristics thatmight have independent effects on children’shealth (family size; race; mothers’ age, educa-tion, and an unemployment indicator if she ispresent; fathers’ age, education, and an unem-ployment indicator if he is present); and werestrict our core sample to children for whomthis information is available. Our core sample ofchildren from the NHIS is 229,330 observa-tions. When we turn to the analysis of (some-times rare) medical conditions, we use the fullsample of all children with nonmissing infor-mation on income, family size, race, age, andgender.
Assignment of household income:The NHIS contains information on total
household income for 27 income categories, in$1,000 intervals between an income of $0 and$20,000, and in $5,000 intervals between$20,000 and $50,000. All household incomesabove $50,000 are top coded. We assign in-comes to these income categories using datafrom the 1986–1995 March Current PopulationSurveys. Specifically, we calculate, for eachincome category in each year, the mean totalhousehold income in the CPS for householdswhose head’s education matches that of thereference person in the household and whoseincome falls into that income category. Forhouseholds containing both a reference person
TABLE A1—Continued.
Chroniccondition Code Definition
Frequent 406 migraine headacheheadaches 407 other headache
Kidney disease 409 kidney stone410 kidney infections411 other kidney trouble
Heart disease 501 rheumatic fever with or without heartdisease
502 ischemic heart disease503 tachycardia or rapid heart504 heart murmurs505 other unspecified heart rhythm disorders506 congenital heart disease507 other selected types of heart disease
Bronchitis 601 bronchitis
Asthma 602 asthma
Hay fever 603 hay fever
Sinusitis 605 sinusitis
1333VOL. 92 NO. 5 CASE ET AL.: ECONOMIC STATUS AND HEALTH IN CHILDHOOD
and spouse, we used the education of the male(whether he was the reference person or not) tomatch income information across the data sets.The resulting income distribution tracks closelythat found in the Current Population Survey.
Definitions of medical conditions:The conditions we use are drawn from five of
the six “condition lists” in the National HealthInterview Survey. Table A1 maps the NHIScondition codes and definitions into the defini-tions we use.
National Health and NutritionExamination Survey
We restrict our sample to children whosesurvey information was given by a parent, andwhose household reference person was eitherthat parent or a spouse. Family income is mea-sured within twenty $1,000 brackets between $0and $19,999 per year, $5,000 brackets between$20,000 and $49,999, and one bracket for$50,000 and above. The survey was conductedin the period 1988–1994. Families are onlyidentified as being surveyed in the first or sec-ond wave (each of roughly three years). Theaverage annual inflation rate of 3.8 percentthat prevailed during this period is likely tointroduce a moderate degree of measurementerror in measures of real income. We assignfamilies to the midpoint of their income intervaland adjust for the difference in the average pricelevel between the first and second half of thesurvey.
REFERENCES
Adler, Nancy E.; Boyce, Thomas; Chesney, Mar-garet A.; Cohen, Sheldon; Folkman, Susan;Kahn, Robert L. and Syme, S. Leonard. “So-cioeconomic Status and Health, The Challengeof the Gradient.” American Psychologist,January 1994, 49(1), pp. 15–24.
Baker, Michael; Stabile, Mark and Deri, Cather-ine. “What Do Self-Reported, Objective Mea-sures of Health Measure?” National Bureauof Economic Research (Cambridge, MA)Working Paper No. W8419, 2001.
Brooks-Gunn, Jeanne; Duncan, Greg J. andMaritato, Nancy. “Poor Families, Poor Out-comes: The Well-Being of Children and
Youth,” in G. Duncan and J. Brooks-Gunn,eds., Consequences of growing up poor. NewYork: Russell Sage Foundation, 1997, pp.1–17.
Case, Anne and Paxson, Christina. “Parental Be-havior and Child Health.” Health Affairs,March/April 2002, 21(2), pp. 164–78.
Currie, Janet and Gruber, Jonathan. “Health In-surance Eligibility, Utilization of MedicalCare, and Child Health.” Quarterly Journalof Economics, May 1996, 111(2), pp. 431–66.
Currie, Janet and Hyson, Rosemary. “ Is the Im-pact of Health Shocks Cushioned by Socio-economic Status? The Case of LowBirthweight.” American Economic Review,May 1999 (Papers and Proceedings), 89(2),pp. 245–50.
Currie, Janet and Thomas, Duncan. “MedicalCare for Children: Public Insurance, PrivateInsurance, and Racial Differences in Utiliza-tion.” Journal of Human Resources, Winter1995, 30(1), pp. 135–62.
Dadds, Mark R.; Stein, Ruth E. K. and Silver,Ellen Johnson. “The Role of Maternal Psy-chological Adjustment in the Measurementof Children’s Functional Status.” Journal ofPediatric Psychology, August 1995, 20(4),pp. 527–44.
Davis, Catherine L.; Delamater, Alan M.; Shaw,Kimberly H.; La Greca, Annette M.; Eidson,Margaret S.; Perez-Rodriguez, Jose E. and Ne-mery, Robin. “Parenting Styles, Regimen Ad-herence, and Glycemic Control in 4- to 10-Year-Old Children with Diabetes.” Journalof Pediatric Psychology, March 2001, 26(2),pp. 123–29.
Fan, Jianqing. “Design-Adaptive NonparametricRegression.” Journal of the American Statis-tical Association, December 1992, 87(420),pp. 998–1004.
Fuchs, Victor R. “Time Preference and Health:An Exploratory Study,” in V. R. Fuchs,ed., Economic aspects of health. Chicago:University of Chicago Press, 1982, pp. 93–120.
Halfon, Neal and Newacheck, Paul W. “Child-hood Asthma and Poverty: Differential Im-pacts and Utilization of Health Services.”Pediatrics, January 1993, 91(1), pp. 56–61.
Idler, Ellen L. and Kasl, Stanislav V. “Self-Ratings of Health: Do They Also Predict
1334 THE AMERICAN ECONOMIC REVIEW DECEMBER 2002
Change in Functional Ability?” Journal ofGerontology: Social Sciences, November1995, 50(6), pp. S344–53.
Korenman, Sanders and Miller, Jane E. “Effectsof Long-Term Poverty on Physical Health ofChildren in the National Longitudinal Studyof Youth,” in G. Duncan and J. Brooks-Gunn,eds., Consequences of growing up poor. NewYork: Russell Sage Foundation, 1997, pp.70–99.
Marmot, Michael. “Epidemiology of Socioeco-nomic Status and Health: Are DeterminantsWithin Countries the Same as BetweenCountries?” in Nancy E. Adler, Michael Mar-mot, Bruce S. McEwen, and Judith Stewart,eds., Socioeconomic status and health in in-dustrial nations. New York: New YorkAcademy of Sciences, 1999, pp. 16–29.
McCormick, Marie C.; Brooks-Gunn, Jeanne;Workman-Daniels, Kathryn and Peckham,George J. “Maternal Rating of Child Health atSchool Age: Does the Vulnerable Child Syn-drome Persist?” Pediatrics, September 1993,92(3), pp. 380–88.
Newacheck, P. W. “Poverty and ChildhoodChronic Illness.” Archives of Pediatric andAdolescent Medicine, November 1994,148(11), pp. 1143–49.
Smith, James P. “Healthy Bodies and ThickWallets: The Dual Relation between Healthand Economic Status.” Journal of EconomicPerspectives, Spring 1999, 13(2), pp. 145–66.
Snodgrass, S. R.; Vedanarayanan, V. V.; Parker,C. C. and Parks, B. R. “Pediatric Patients withUndetectable Anticonvulsant Blood Levels:Comparison with Compliant Patients.” Jour-nal of Child Neurology, March 2001, 16(3),pp. 164–68.
Thompson, S. J.; Auslander, W. F. and White,N. H. “Comparison of Single-Mother andTwo-Parent Families on Metabolic Controlof Children with Diabetes.” Diabetes Care,February 2001, 24(2), pp. 234–38.
West, Patrick. “Health Inequalities in the EarlyYears: Is There Equalization in Youth?” So-cial Science and Medicine, March 1997,44(6), pp. 833–58.