JK Tyre summer internship report on two wheeler tyre segment

Russia
Andrei PantioukhovVP, Russian operations
Capital Markets Day 2015

1. Operational review
(market / business / production)
2. Strategy update and long-range plan
Contents
2
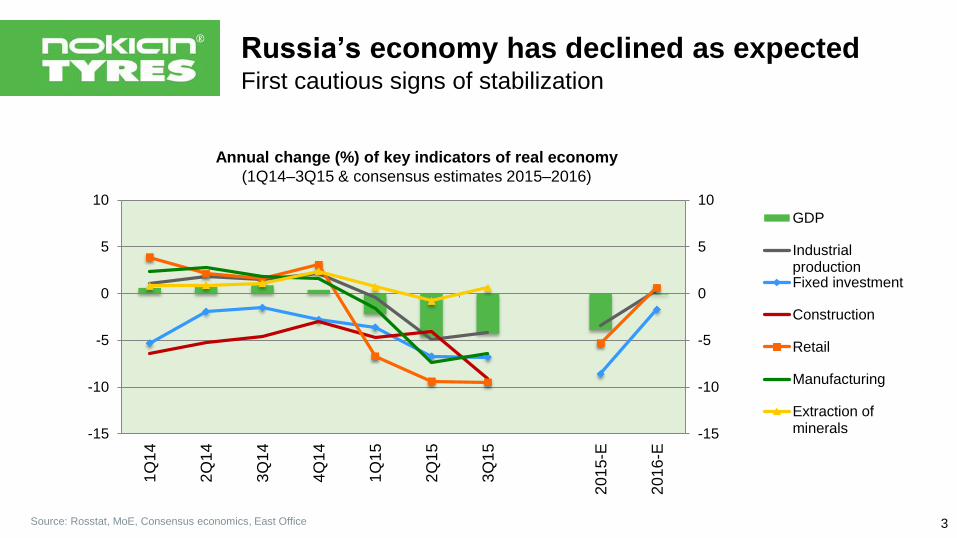
Russia’s economy has declined as expectedFirst cautious signs of stabilization
Source: Rosstat, MoE, Consensus economics, East Office
-15
-10
-5
0
5
10
-15
-10
-5
0
5
10
1Q
14
2Q
14
3Q
14
4Q
14
1Q
15
2Q
15
3Q
15
201
5-E
201
6-E
GDP
IndustrialproductionFixed investment
Construction
Retail
Manufacturing
Extraction ofminerals
Annual change (%) of key indicators of real economy
(1Q14–3Q15 & consensus estimates 2015–2016)
3

Ruble clearly follows oil priceImpact of other exchange rate factors limited
2000
3000
4000
5000
6000
7000
8000
9000
20
30
40
50
60
70
80
90
RUB/EUR (LHS) RUB/USD (LHS)
Brent RUB/bbl (RHS) Budget 2016
Oil price impact on RUB exchange rate
Urals oil price USD/bbl RUB/USD
40 77-80
50 61-65
60 52-55
Source: CBR, EIA, East Office 4

Inflation is slowing downGiven no further devaluation, it should be under control
Sep 2015 % YoY
CPI* +15.7
Food +17.4
Non-food +15.2
Services +13.8
Source: CBR, Consensus Economics, gazeta.ru, East Office
3
4
5
6
7
8
9
10
11
12
13
14
15
16
17
18
19
20
3
4
5
6
7
8
9
10
11
12
13
14
15
16
17
18
19
20
Russia's CPI inflation % YoY, Russia’s Central Bank key rate
CPI
Consensus Forecast(Oct-2015)
CBR Key rate
Minfin Estimate
* CPI – consumer price index
5

Weak consumer confidence and retail turnoverDriven by low purchasing power
2013
Consumer confidence index
Quarters
2007 2008 2009 2010 2011 2012 2013 2014 2015
Retail turnover development
as a % to monthly average of 2012
total turnover eliminated seasonality trend
Source: Rosstat
2014 2015
6

Sales of new cars remain sluggishMonthly sales on 2009 level
-80%
-60%
-40%
-20%
0%
20%
40%
60%
80%
100%
0
50 000
100 000
150 000
200 000
250 000
20
09
/1
20
09
/3
20
09
/5
20
09
/7
20
09
/9
20
09
/11
20
10
/1
20
10
/3
20
10
/5
20
10
/7
20
10
/9
20
10
/11
20
11
/1
20
11
/3
20
11
/5
20
11
/7
20
11
/9
20
11
/11
20
12
/1
20
12
/3
20
12
/5
20
12
/7
20
12
/9
20
12
/11
20
13
/1
20
13
/3
20
13
/5
20
13
/7
20
13
/9
20
13
/11
20
14
/1
20
14
/3
20
14
/5
20
14
/7
20
14
/9
20
14
/11
20
15
/1
20
15
/3
20
15
/5
20
15
/7
20
15
/9
un
its
MONTHLY CAR AND LCV SALES
Foreign brands
Local brands
Foreign change y-o-y
Local change y-o-y
0
1 000 000
2 000 000
3 000 000
4 000 000
2009 2010 2011 2012 2013 2014 2015 e
un
its
ANNUAL CAR AND LCV SALES
Local brands
Foreign brands
Source: AEB, Global Insight 7
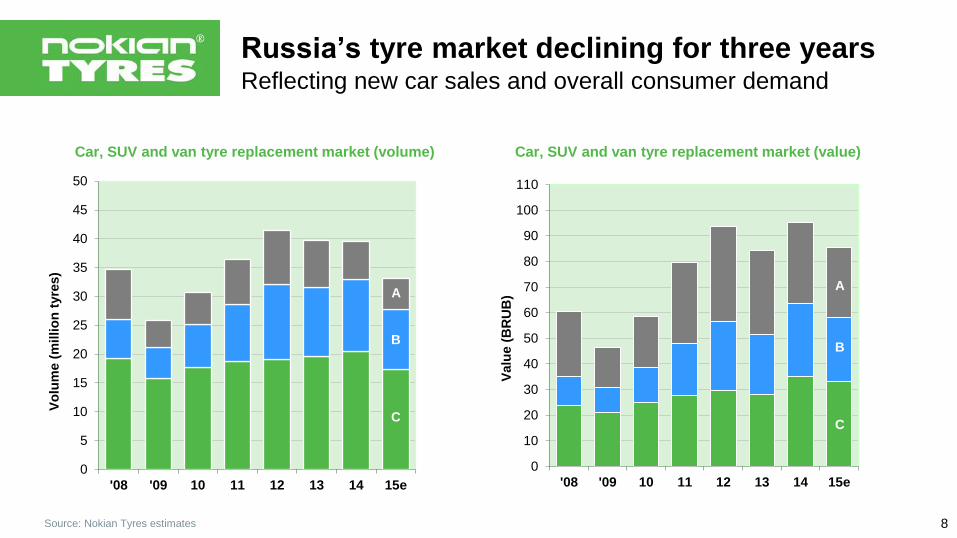
Russia’s tyre market declining for three yearsReflecting new car sales and overall consumer demand
0
5
10
15
20
25
30
35
40
45
50
'08 '09 10 11 12 13 14 15e
Vo
lum
e (
millio
n t
yre
s)
x
0
10
20
30
40
50
60
70
80
90
100
110
'08 '09 10 11 12 13 14 15e
Valu
e (
BR
UB
)
Car, SUV and van tyre replacement market (volume) Car, SUV and van tyre replacement market (value)
C
B
A
C
B
A
Source: Nokian Tyres estimates 8
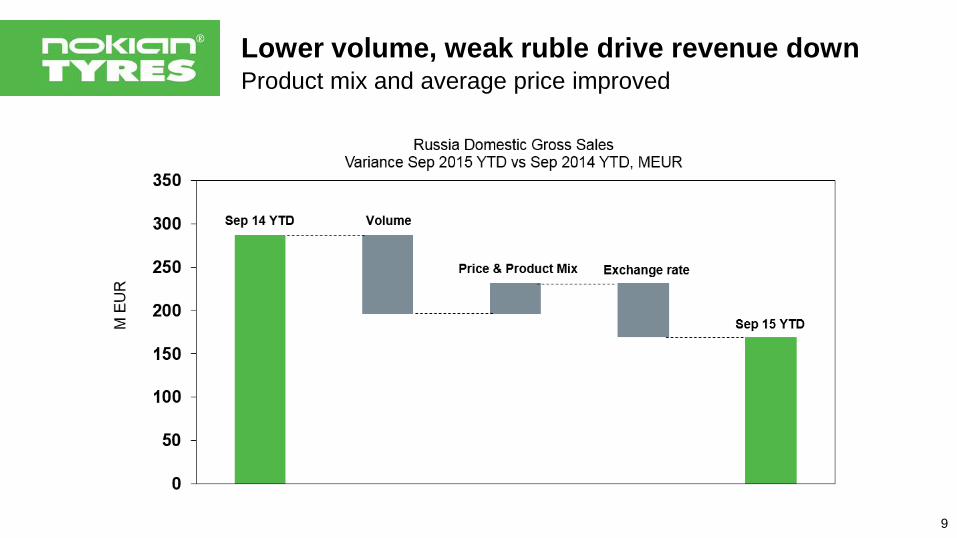
Lower volume, weak ruble drive revenue downProduct mix and average price improved
9
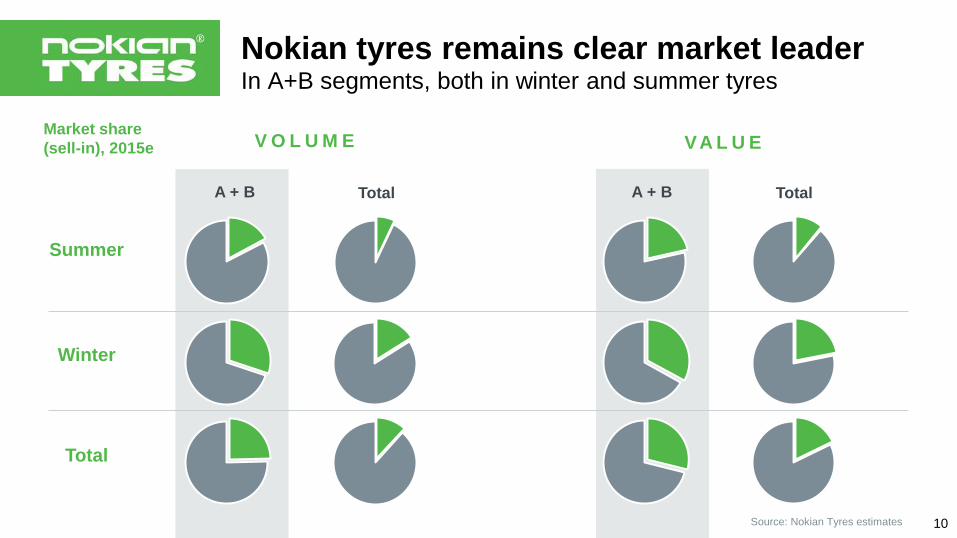
Nokian tyres remains clear market leaderIn A+B segments, both in winter and summer tyres
Market share
(sell-in), 2015e V O L U M E VA L U E
Summer
A + B Total
Winter
Total
A + B Total
10Source: Nokian Tyres estimates

Marketing and sell-out support programAimed at keeping market share on sell-out level
LIFE-LONG EXTENDED GUARANTEEFOR ALL HAKKAPELIITTA PRODUCTSCONVINCING MAGAZINE TEST VICTORIES
‘TYRE MOUNTING FOR FREE’ CAMPAIGNSEFFECTIVE ADVERTISING
11

Vsevolozhsk factory – main production base10 years of success
Production capacity increased from 1 m
(2005) to 15.5. m units / year
Biggest car tyre factory in Russia: over 70
million tyres produced since 2005
The most modern tyre factory in Europe:
high level of automation
The best efficiency in the industry: only
~1,000 employees at the factory
Wide product range for all markets: over
1,300 SKUs in production
Export to over 40 countries: ~70% of the
factory’s production output in 2015
Biggest exporter of consumer goods in
Russia
Significant tax benefits
12

1. Operational review
(market / business / production)
2. Strategy update and long-range plan
Contents
13
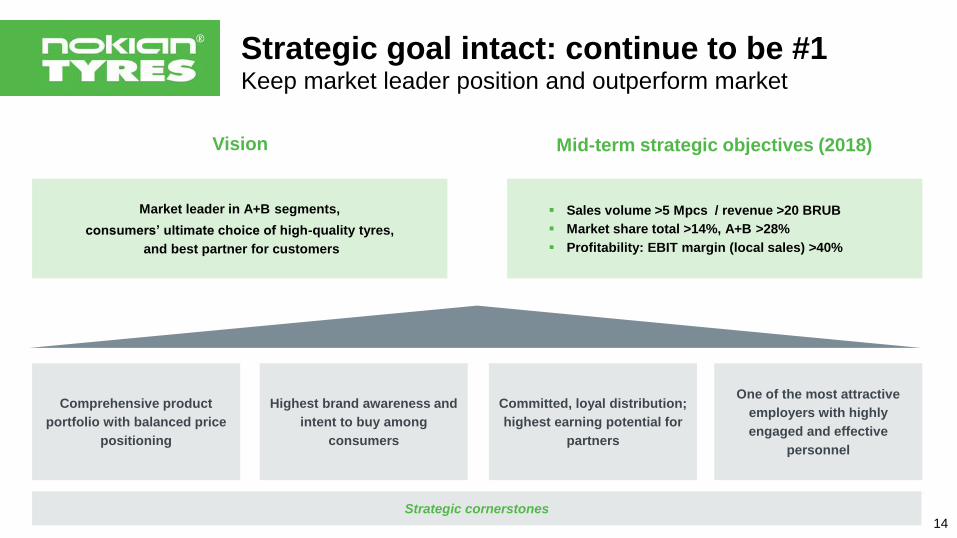
Strategic goal intact: continue to be #1Keep market leader position and outperform market
Sales volume >5 Mpcs / revenue >20 BRUB
Market share total >14%, A+B >28%
Profitability: EBIT margin (local sales) >40%
Market leader in A+B segments,
consumers’ ultimate choice of high-quality tyres,
and best partner for customers
Comprehensive product
portfolio with balanced price
positioning
Highest brand awareness and
intent to buy among
consumers
Committed, loyal distribution;
highest earning potential for
partners
One of the most attractive
employers with highly
engaged and effective
personnel
Strategic cornerstones
Vision Mid-term strategic objectives (2018)
14
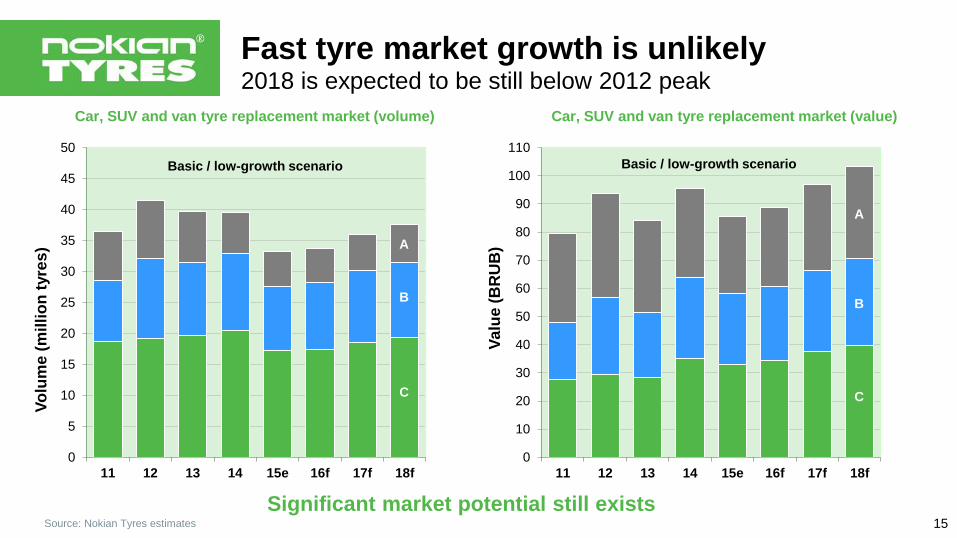
Fast tyre market growth is unlikely2018 is expected to be still below 2012 peak
Significant market potential still exists15Source: Nokian Tyres estimates
0
5
10
15
20
25
30
35
40
45
50
11 12 13 14 15e 16f 17f 18f
Vo
lum
e (
milli
on
tyre
s)
x
0
10
20
30
40
50
60
70
80
90
100
110
11 12 13 14 15e 16f 17f 18f
Va
lue
(B
RU
B)
x
Car, SUV and van tyre replacement market (volume) Car, SUV and van tyre replacement market (value)
C
B
A
C
B
A
Basic / low-growth scenario Basic / low-growth scenario

0
5
10
15
20
25
30
35
40
45
50
11 12 13 14 15e 16f 17f 18f
Vo
lum
e (
milli
on
tyre
s)
x
0
5
10
15
20
25
30
35
40
45
50
11 12 13 14 15e 16f 17f 18f
Vo
lum
e (
milli
on
tyre
s)
x
Car, SUV and van tyre replacement market (volume) Car, SUV and van tyre replacement market (volume)
C
B
A
C
B
A
16
Pessimistic / stagnant scenario Optimistic / modest growth scenario
Source: Nokian Tyres estimates
Growth may vary depending on scenarioVariation between optimistic and pessimistic up to 20%

Competition has clearly intensifiedKey players are committed to the Russian market
Tight pricing environment, aggressive pricing policies by some competitors;
Launch of local production facilities affecting the approach and level of activity of competitors;
Localized production and extended product range becoming key factors in shaping competitive
landscape;
Role of Japanese and Korean players growing due to increased focus and competitive pricing;
Competitive threat from Chinese and other Asian players, not established in Russia directly,
weakening due to ruble devaluation;
Russian producers gaining share due to lower competition from China;
Emerging overcapacity situation resulting in further pricing pressure.
17

Target to outperform market in any scenarioMarket share in A+B segments to grow from 25% to 30%
10,0
11,0
12,0
13,0
14,0
15,0
2015e 2016f 2017f 2018f
basic optimistic pessimisticScenarios:
20,021,022,023,024,025,026,027,028,029,030,0
2015e 2016f 2017f 2018f
basic optimistic pessimisticScenarios:
Market
share, %
(volume)
Market
share, %
(volume)
A + B segments Total market
Source: Nokian Tyres estimates18

Optimal product mix and price positioning keyTarget to maximize revenue and profit
Segments
A:
B:
A:
B:
19

New business models in distribution evolvingPlan to pilot various consignment schemes
Manufacturer Distributor Retailer Consumer
Consignment sales
Logistics Service
Now
Meantime
Future
20

New business concepts in B2B2C e-commerceProactive approach to digital disruption
B2B
New web shop for business-to-
business customers
State-of-the-art e-commerce platform
enabling deep integration to corporate
ERP systems and making new
features and tools available for
boosting B2B online sales
Scalable and extendable solution
adjusted to specific B2B needs
B2C
Up-to-date web shop for direct sales
from the manufacturer to end
consumers
The new e-commerce platform
bringing better user experience to
online consumers
Strong prerequisite for owning the
end consumer and leveraging B2C
sales
vianor.ru
Sustainable, flexible and user-friendly
marketplace adjusted to business
needs of Vianor partners and
preferences of online consumers
Marketplace concept expanding
opportunities in selling products and
services
Significant step in strategic
evolvement of B2B2C model in line
with strong trends in online sales
21
Nokian tyres set to remain market leaderExecutive summary
Period of Russia’s tyre market fast growth is over: by 2018 the total market will still be below the
peak levels of 2012 with a clearly weaker structure of segments. However, significant market
potential still exists.
Competition has clearly intensified, with major manufacturers expanding their product ranges into
cheaper segments, adopting aggressive pricing strategies and localizing their production.
Russia remains a key market for Nokian Tyres. The strategic target will remain intact: outperform
the market and keep the market leader position.
Key strategic dimension for Nokian Tyres is the optimal product portfolio, i.e. product range and
price positioning within and across A and B segments.
Big changes are taking place in the area of distribution: new concepts based on consignment
approach are being developed and piloted.
Focus on consumer is increasingly important; changing consumer behavior and growing role of
ecommerce will have a big impact on marketing strategies and business concepts.
22

Thank you!