Economic resilience: a financial perspective · a structural drag, this aspect of resilience is a...
30
Economic resilience: a financial perspective Note submitted to the G20 on 7 November 2016 December 2016
Transcript of Economic resilience: a financial perspective · a structural drag, this aspect of resilience is a...
Economic resilience: a financial perspective Note submitted to the G20 on 7 November 2016
December 2016

This publication is available on the BIS website (www.bis.org).
© Bank for International Settlements 2016. All rights reserved. Brief excerpts may be reproduced or translated provided the source is stated.
ISBN 978-92-9259-019-2 (online)
Economic resilience: a financial perspective i
Table of contents
Introduction ............................................................................................................................................... 1
The financial cycle: nature, costs and policy messages ............................................................ 3
Monitoring the financial cycle ............................................................................................................ 5
Current risks through the prism of the financial cycle .............................................................. 9
Macro-financial stability framework .............................................................................................. 13
Prudential policy ........................................................................................................................... 13
Monetary policy ............................................................................................................................ 16
Fiscal policy ..................................................................................................................................... 17
Policy principles...................................................................................................................................... 22
References ................................................................................................................................................ 23


Economic resilience: a financial perspective 1
Economic resilience: a financial perspective1
Note submitted to the G20, 7 November 2016
One aspect of resilience that is often underappreciated concerns financial imbalances. A resilient economy absorbs exogenous shocks and recovers quickly. But resilience also hinges on policies that contain the build-up of financial imbalances and mitigate the fallout of their correction, ie policies that tackle the financial cycle head on. This note discusses the nature of the financial cycle, its monitoring and the economic implications of booms and busts. It argues for a macro-financial stability framework, which accounts for both aspects of resilience. In this framework, prudential, monetary and fiscal policies complement each other in systematically leaning against the financial cycle.
Introduction
A resilient economy is a natural policy aspiration. One aspect of resilience is an economy’s capacity to absorb and quickly recover from adverse shocks, containing their impact on output and employment. Since temporary losses can easily become a structural drag, this aspect of resilience is a precondition for preserving an economy’s long-run growth potential.
Traditional policy prescriptions emphasise resilience to shocks. They call for the build-up of buffers, such as prudential safeguards in the private sector and space for public policy manoeuvre. These buffers would serve to quickly reverse any adverse dynamics caused by a shock.
However, economic resilience requires more than the capacity to withstand shocks. The Global Financial Crisis (GFC) has served as a stark reminder of a second aspect of resilience, related to financial imbalances. Prior to the GFC, an underpricing of risks and inflated asset valuations flattered financial institutions’ and households’ balance sheets. Seemingly validating low risk premia, these valuations encouraged leverage and the accumulation of risk exposures, which culminated in the crisis and a deep global recession. Thus, constraining the build-up of imbalances, and the associated build-up of vulnerabilities, is an integral part of resilience.
Financial imbalances are distinct from shocks. Resulting from private risk-taking and policy measures, they tend to build up over time in the stock of financial assets and liabilities and eventually become unsustainable. A correction is then inevitable and often leads to financial distress or an outright crisis. What may appear to be a shock is, in fact, the outcome of gradual, partly policy-induced, build-up of pressure.
This second aspect of resilience suggests a broader policy framework, focused also on the financial cycle. Besides preserving buffers for countering (exogenous)
1 This note was prepared by Nikola Tarashev ([email protected]) and Fabrizio Zampolli
([email protected]). Statistical support was provided by Matthias Lörch and Anamaria Illes.
2 Economic resilience: a financial perspective
shocks, prudential, monetary and fiscal policies should complement each other in stemming the slow and endogenous build-up of unsustainable financial imbalances. In addition, policies should focus on mitigating the fallout of the correction of financial imbalances on the rest of the economy and on inducing an orderly adjustment.
This note lays out a macro-financial stability framework, in which policies strengthen resilience by responding to the financial cycle at all times. One element of the framework comprises diagnostic tools. While financial cycle downturns tend to have clear manifestations – eg banking or market-wide distress – upturns are more difficult to identify as events unfold. That said, unusually strong credit growth and surging collateral values provide useful signals that an unsustainable boom is in the making. Since such booms mask weak balance sheets and often straddle borders, a comprehensive monitoring approach is necessary. This approach would consider, in particular, the accumulated stocks of debt, gross rather than net capital flows, leverage, maturity mismatches, the nationality rather than just the residence of borrowers and lenders, and the currency denomination of assets and liabilities.
Another element of the framework comprises the policy instruments. During upturns, prudential policy would stem risk-taking, which, even when sensible or compelling for individual agents, can destabilise the system as a whole. This policy would also ensure the adequacy of financial buffers needed to support intermediation during downturns and to restore market confidence. To lighten the task of prudential authorities, monetary policymakers would use the flexibility in current frameworks to lean systematically against the financial cycle by influencing borrowing costs. And, given the tight links between the financial and public sectors, sound fiscal policy would also play a key role. A countercyclical fiscal stance would build up resources during a financial upturn and deploy them swiftly when strains emerge, aiming to repair balance sheets and put the financial sector on a path to recovery. In all cases, policymakers would also pay close attention to safeguarding policy space, thus keeping dry powder for additional unforeseen shocks.
This note’s focus notwithstanding, policy actions in the financial sector alone would not achieve resilience. Resilience hinges also on sound fundamentals in the real economy, notably strong trend productivity growth and the capability to reallocate resources flexibly. While tackling the financial cycle may help to stem the erosion of productivity growth (see below), it is no substitute for structural policies that foster the flexibility of labour and product markets.2 Such policies would mitigate downturns by facilitating the smooth reallocation of resources from pockets of distress to more resilient and profitable sectors. In addition, by reaching for the technological frontier, structural policies would address potential secular challenges to aggregate productivity growth, eg the shift of demand towards services and population ageing.
The rest of the note is organised as follows. The first section presents key features of the financial cycle, discusses its economic costs and advocates a macro-financial stability framework designed to promote resilience. The second outlines key principles for monitoring the financial cycle. The third focuses on the current juncture and highlights specific evidence that confirms the importance of the financial cycle for economic resilience. In explaining the main attributes of a macro-financial stability
2 For in-depth analyses of structural policies’ impact on economic productivity, see Andrews and
Cingano (2014), IMF (2015a, 2016) and Saia et al (2015).

Economic resilience: a financial perspective 3
framework, the fourth section discusses in some detail the roles of prudential, monetary and fiscal policies. The final section distils the discussion into a list of policy principles for financial resilience.
The financial cycle: nature, costs and policy messages
At the heart of the financial cycle lies the mutually reinforcing interaction between financing constraints, perceptions of value and risk-taking behaviour. For example, underestimating risks in real estate markets would boost property prices, thus artificially raising collateral values. This would relax financing constraints and promote further risk-taking. Resilience hinges on constraining such procyclical behaviour, which can otherwise lead to the accumulation of unsustainable stocks of debt.3
Identifying the financial cycle as events unfold – ie pinning down the timing and amplitude of its upturns and downturns “in real time” – is difficult, not least because there is no single measure of financial activity and because this activity both responds to and influences policy actions. These difficulties – which are similar to those of measuring the traditional business cycle – call for exploring a battery of metrics and indicators. While the identification of the business cycle is often rooted in analyses of GDP and unemployment dynamics, the financial cycle encapsulates joint fluctuations in a wide set of financial variables. These range from credit aggregates – as a proxy for leverage and risk-taking – and asset prices, not least property prices – which drive available collateral values, trigger wealth effects and influence financing conditions. Graph 1 offers a specific example of financial cycle estimates.4
3 The discussion of financial procyclicality and countercyclical policy measures (see also further below)
draws on BIS (2008).
4 For a discussion of alternative approaches to measuring the financial cycle, see Box III.A of BIS (2016).
Financial and business cycles1 Graph 1
In per cent
1 Shaded areas plot NBER recessions in the United States. Lines plot the financial cycle, as measured by frequency-based (bandpass) filters capturing medium-term cycles in real credit, the credit-to-GDP ratio and real house prices.
Sources: M Drehmann, C Borio and K Tsatsaronis, “Characterising the financial cycle: don’t lose sight of the medium term!”, BIS Working Papers, no 380, June 2012; BIS calculations.
-20
-10
0
10
20
70 75 80 85 90 95 00 05 10 15
First oil crisis
Second oil crisisBlack Monday
Banking strains
Dotcom crash
Great Financial Crisis
↑ ↑
↓ ↓↓
↓
United States Spain United Kingdom

4 Economic resilience: a financial perspective
Since the early 1980s, financial cycles have exhibited four robust features. First, they have tended to last some 10 to 20 years and have thus been longer than the traditional business cycle. Second, financial booms have typically been followed by banking crises or periods of considerable financial stress. Third, cycles have been highly synchronised across countries, pointing to a global component. Fourth, they have evolved with the economic environment and policy frameworks. Their length and amplitude have grown considerably over time against the background of greater liberalisation of financial systems, stable macroeconomic conditions and a monetary policy that has tended to pay less attention to credit developments.
The financial dislocations in the aftermath of a boom (second feature above) are quite costly and undermine public finances. Even though existing cost estimates are based on different historical episodes, they indicate that crisis-related output losses accumulate over several years and are not fully recovered in subsequent expansions. Evidence incorporating the impact of the GFC suggests that the overall damage of a systemic banking crisis is roughly equivalent to the permanent loss of one year of GDP in net present value terms.5 This one-off loss may go hand in hand with a long-lasting decline in trend output growth: recent research has found that productivity growth can slow for many years after a crisis.6 In addition, a crisis would typically set in motion automatic fiscal stabilisers and discretionary public spending. Thus, the accumulation of private debt during the crisis tends to usher in a surge in public debt, of about 25%, five to eight years after a crisis.7
Given the outsize social costs of financial busts, the financial cycle merits policymakers’ close attention. Reliance on traditional business cycle indicators would not do the entire job. These may paint a benign picture just as financial imbalances are building up (first feature above). Likewise, it could be counterproductive to follow signals of markets’ perceptions and attitude to risks. Upbeat signals – such as the record low risk premia in 2007 – can provide a false sense of security. Conversely, purely temporary signals of fragile risk-taking capacity – eg the taper tantrum in 2013 or more recent risk-off episodes affecting emerging market economy (EME) assets – could lead policymakers to maintain easy financial conditions in order to avoid a disruptive unwinding of imbalances. However, the easy financial conditions could stoke the imbalances and amplify the magnitude of the eventual correction.
A macro-financial stability framework – in which authorities systematically respond to financial cycle developments – addresses these considerations.8 To the extent that inaction fuels longer and costlier cycles (fourth feature above), policy interventions during an upturn would need to constrain credit expansions that threaten to generate imbalances. During a downturn, policy stimulus would cushion the disruptive effects of the unwinding of previous imbalances. And after the crisis management stage, if a crisis does arise, the stimulus would be more measured,
5 Across academic studies that rely mostly on pre-2007 data, the median estimated cost of systemic
banking crises is roughly 60% of GDP in net present value terms. A study that focuses on the GFC and OECD countries points to a cumulative loss of about 180% of pre-crisis GDP. For further detail, see Box VI.D in BIS (2016) and the references therein.
6 See Borio, Kharroubi, Upper and Zampolli (2015).
7 See Graph V.1 in BIS (2016).
8 The term was first introduced in BIS (2005). For a recent elaboration of some of the framework’s features, see Chapter I in BIS (2014, 2015).

Economic resilience: a financial perspective 5
saving policy space for unforeseen headwinds down the road. In deploying available resources, priority would be given to swift balance sheet repair that can restore market confidence and the provision of key financial services. And in each case, policy interventions would be mindful of international spillovers and spillbacks (third feature above).9
Monitoring the financial cycle
The challenges in identifying financial cycle turning points suggest that no single indicator can suffice. Instead, it would be important to carefully consider an array of indicators, selecting them to fit the particular monitoring purpose. The indicators that seek to identify the most glaring excesses would then serve as a starting point for deeper analyses and policy discussions. For these discussions, it would also be necessary to combine the indicators with judgment of country specificities and new financial sector developments that are less amenable to formal measurement.10
In contributing to the policy debate, the BIS has derived early warning indicators (EWIs) of domestic banking distress. Based on credit-to-GDP, property prices and a debt service ratio, these indicators incorporate only data that a policymaker would have available when making a decision.11 Among the three indicators, the credit-to-GDP and property price gaps have fared better since the 1980s in signalling future crises three years or more in advance.12 For its part, the strength of the debt service ratio sets in at the one- to two-year horizon. The lead with which an EWI raises a red flag is important as it determines whether it would be possible to activate a particular policy instrument in time.
While these EWIs’ focus on credit and asset valuations within national borders, financial cycles also have important international aspects. For one, lending booms draw on wholesale funding, which typically has a cross-border element. In addition, exchange rate changes can generate self-reinforcing – and, thus, destabilising – capital flow and asset price dynamics. In analysing these issues, the BIS has stressed the importance of gross rather than net capital flows, borrowers’ and lenders’
9 There is also evidence that financial cycle proxies – ie measures of credit and asset price growth –
offer much useful information about macroeconomic slack. The run-up to the GFC revealed that output can grow above potential on the back of financial exuberance, even when information is low. See Juselius et al (2016).
10 Macro stress tests can be effective as crisis management and resolution tools, even though, given current technology, they tend to convey a false sense of security during upturns (Borio et al (2012)).
11 The BIS updates these EWIs semiannually and reports a subset in its March and September issues of the BIS Quarterly Review. In addition, the BIS publishes the full set of debt service ratios, as well as property prices and long harmonised series of credit aggregates. In addition, the OECD Vulnerability Indicator Database contains a list of more than 70 indicators, designed to predict severe recessions and crises.
12 See Drehmann and Juselius (2014).

6 Economic resilience: a financial perspective
nationality rather than just their location, and the currency denomination of assets and liabilities.13
To the extent that the overall balance sheet size is key to measuring the extent of risk-taking, the traditional focus on net flows – such as current account balances – misses important information about the international aspect of financial vulnerabilities. The reason is that a country’s investment, production and consumption expenditures – which drive its current account position – are largely unrelated to financial exposures – which depend on the structure of balance sheets.14 Thus, current account imbalances have been unreliable indicators of financial exposures.
The pre-GFC experience is a good example in this respect. Prior to 2007, the United Kingdom had a current account deficit and the euro area current account was largely balanced, while Asian countries had significant surpluses. Over the same period, however, banks in Europe were borrowing dollars short-term from US money market funds and “shipping” them back to the United States in the form of investments in long-term subprime mortgage-backed securities. This round-tripping remained masked by net flows but surfaced as sizeable gross flows from Europe to the United States.15 It is the accumulation of these gross flows (Graph 2, left-hand panel) that helps explain why the stress in the US housing market had much stronger repercussions in the European financial system than in Asia.16
Assessing the risks resulting from such flows requires a consolidated perspective. The balance sheets of internationally active entities – and the attendant exposures – straddle country borders. Thus, data that classify entities based on their residence – such as balance of payments data – would provide fragmented, and hence incomplete, information about risk exposures.17 By contrast, consolidated balance sheet data that classify entities based on the nationality of their headquarters capture exposures directly. The BIS consolidated banking statistics provide a case in point.
The relevance of consolidated balance sheets, of course, goes well beyond banks. For instance, measures of consolidated balance sheets automatically incorporate any firm’s offshore borrowing via affiliates abroad. All else equal, offshore borrowing raises leverage and, thus, credit risk, but would be classified as direct investment. If repatriated to the home country, offshore borrowing can allow even non-financial corporates (NFCs) to affect domestic funding conditions. In recent years these mechanisms have been especially important for EME NFCs, which have increasingly engaged in offshore borrowing since 2007 (Graph 3).
13 For a related analysis of capital flows, which focuses on financial vulnerabilities in EMEs, provides
methodological guidance for measuring these vulnerabilities and points to data gaps, see Tarashev et al (2016).
14 See Borio and Disyatat (2011, 2015).
15 See McGuire and von Peter (2012).
16 The recognition of the importance of gross capital flows has been a prominent recent theme in international finance: see Obstfeld (2012), Gourinchas and Rey (2014), Lane and Shambaugh (2010a,b) and Bénétrix et al (2015).
17 The so-called residence principle is rooted in the assumption of a “triple coincidence” of GDP area, decision-making unit and currency area. Despite its convenience for theoretical models, this assumption is often violated in practice (Avdjiev et al (2015)).

Economic resilience: a financial perspective 7
US dollar-denominated cross-border claims1
In billions of US dollars Graph 2
2007 2014
1 The thickness of the arrows indicates the size of the outstanding stock of claims. An arrow directed from region A to region B indicates lending from banks in region A to borrowers in region B.
Source: BIS locational banking statistics.
EME non-banks’ off-shore borrowing Graph 3
Rising share in debt securities1 Non-banks as surrogate intermediaries2 In per cent In billions of US-dollars
1 Outstanding US dollar international bonds issued by offshore affiliates of non-banks headquartered in the indicated country divided by the same amount plus the outstanding US dollar international bonds issued by non-bank residents of the indicated country. 2 Cross-border financing by non-banks is estimated as BoP minus BIS IBS. Cumulative flows staring from Q1 2005 for Chile, the Czech Republic, Hungary,India, Korea , Mexico, Poland, Russia, Turkey and South Africa. 3 BoP = sum of the balance of Payments (BoP) items “other liabilities: currencyand deposits” and “other liabilities: loans” for each listed country. 4 BIS IBS = cross-border claims of BIS reporting banks on each listed country from the BIS international banking statistics (IBS).
Sources: R McCauley, P McGuire and V Sushko: “Dollar credit to emerging market economies”, BIS Quarterly Review, December 2015, pp 27–41; IMF, Balance of Payments Statistics; BIS locational banking statistics by residence.
0
20
40
60
80
2002 2004 2006 2008 2010 2012 2014 2016
Brazil China Russia
0
200
400
600
800
1,000
05 06 07 08 09 10 11 12 13 14 15 16
BoP3 BIS IBS4
8 Economic resilience: a financial perspective
Borrowing in one currency and investing in another also affects balance sheet strength. But while the attendant risks are clear, the financial stability implications are difficult to assess ex ante. One reason is that apparent currency mismatches in the data may well be hedged. In addition, the identity and loss-absorbing capacity of the ultimate hedge provider are often unclear.
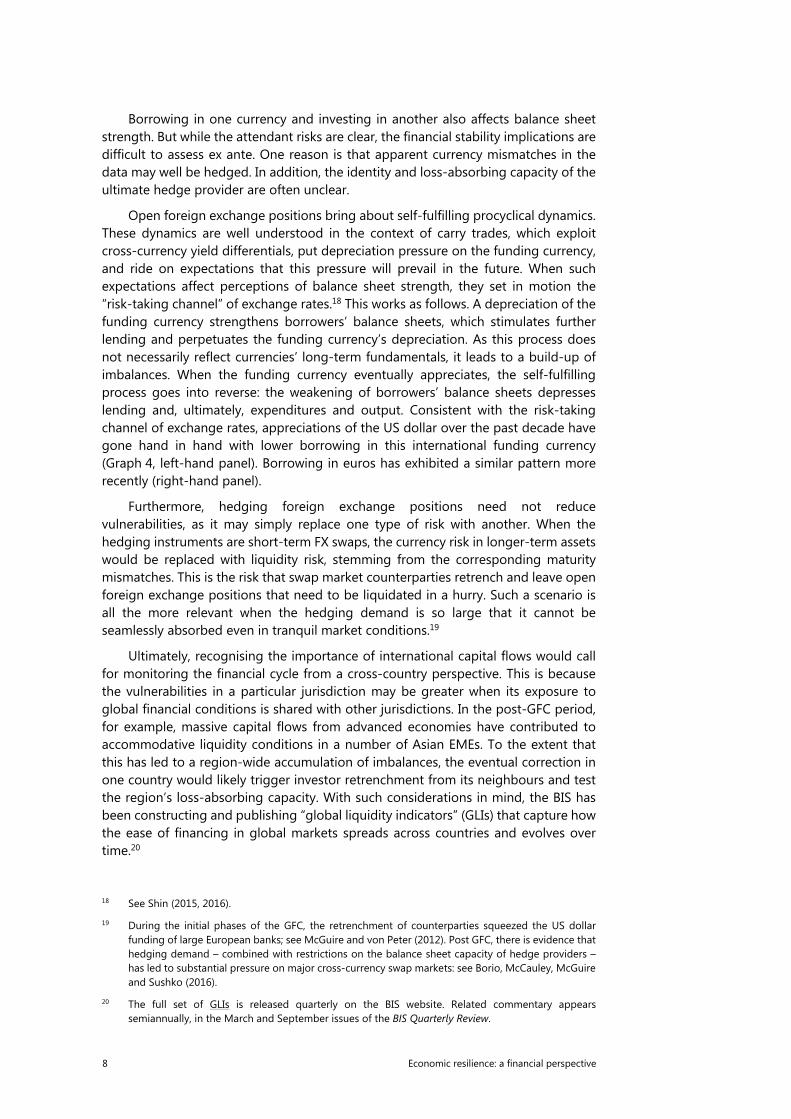
Open foreign exchange positions bring about self-fulfilling procyclical dynamics. These dynamics are well understood in the context of carry trades, which exploit cross-currency yield differentials, put depreciation pressure on the funding currency, and ride on expectations that this pressure will prevail in the future. When such expectations affect perceptions of balance sheet strength, they set in motion the “risk-taking channel” of exchange rates.18 This works as follows. A depreciation of the funding currency strengthens borrowers’ balance sheets, which stimulates further lending and perpetuates the funding currency’s depreciation. As this process does not necessarily reflect currencies’ long-term fundamentals, it leads to a build-up of imbalances. When the funding currency eventually appreciates, the self-fulfilling process goes into reverse: the weakening of borrowers’ balance sheets depresses lending and, ultimately, expenditures and output. Consistent with the risk-taking channel of exchange rates, appreciations of the US dollar over the past decade have gone hand in hand with lower borrowing in this international funding currency (Graph 4, left-hand panel). Borrowing in euros has exhibited a similar pattern more recently (right-hand panel).
Furthermore, hedging foreign exchange positions need not reduce vulnerabilities, as it may simply replace one type of risk with another. When the hedging instruments are short-term FX swaps, the currency risk in longer-term assets would be replaced with liquidity risk, stemming from the corresponding maturity mismatches. This is the risk that swap market counterparties retrench and leave open foreign exchange positions that need to be liquidated in a hurry. Such a scenario is all the more relevant when the hedging demand is so large that it cannot be seamlessly absorbed even in tranquil market conditions.19
Ultimately, recognising the importance of international capital flows would call for monitoring the financial cycle from a cross-country perspective. This is because the vulnerabilities in a particular jurisdiction may be greater when its exposure to global financial conditions is shared with other jurisdictions. In the post-GFC period, for example, massive capital flows from advanced economies have contributed to accommodative liquidity conditions in a number of Asian EMEs. To the extent that this has led to a region-wide accumulation of imbalances, the eventual correction in one country would likely trigger investor retrenchment from its neighbours and test the region’s loss-absorbing capacity. With such considerations in mind, the BIS has been constructing and publishing “global liquidity indicators” (GLIs) that capture how the ease of financing in global markets spreads across countries and evolves over time.20
18 See Shin (2015, 2016).
19 During the initial phases of the GFC, the retrenchment of counterparties squeezed the US dollar funding of large European banks; see McGuire and von Peter (2012). Post GFC, there is evidence that hedging demand – combined with restrictions on the balance sheet capacity of hedge providers – has led to substantial pressure on major cross-currency swap markets: see Borio, McCauley, McGuire and Sushko (2016).
20 The full set of GLIs is released quarterly on the BIS website. Related commentary appears semiannually, in the March and September issues of the BIS Quarterly Review.
Economic resilience: a financial perspective 9
Conceptual issues aside, data gaps raise important challenges in the monitoring of the financial cycle. Such gaps relate to the timeliness of the relevant data, the comparability of data across jurisdictions and the data limitations that prevent the identification of the ultimate bearers of risk. The G20 Data Gaps Initiative outlines important steps towards filling these gaps.21
Current risks through the prism of the financial cycle
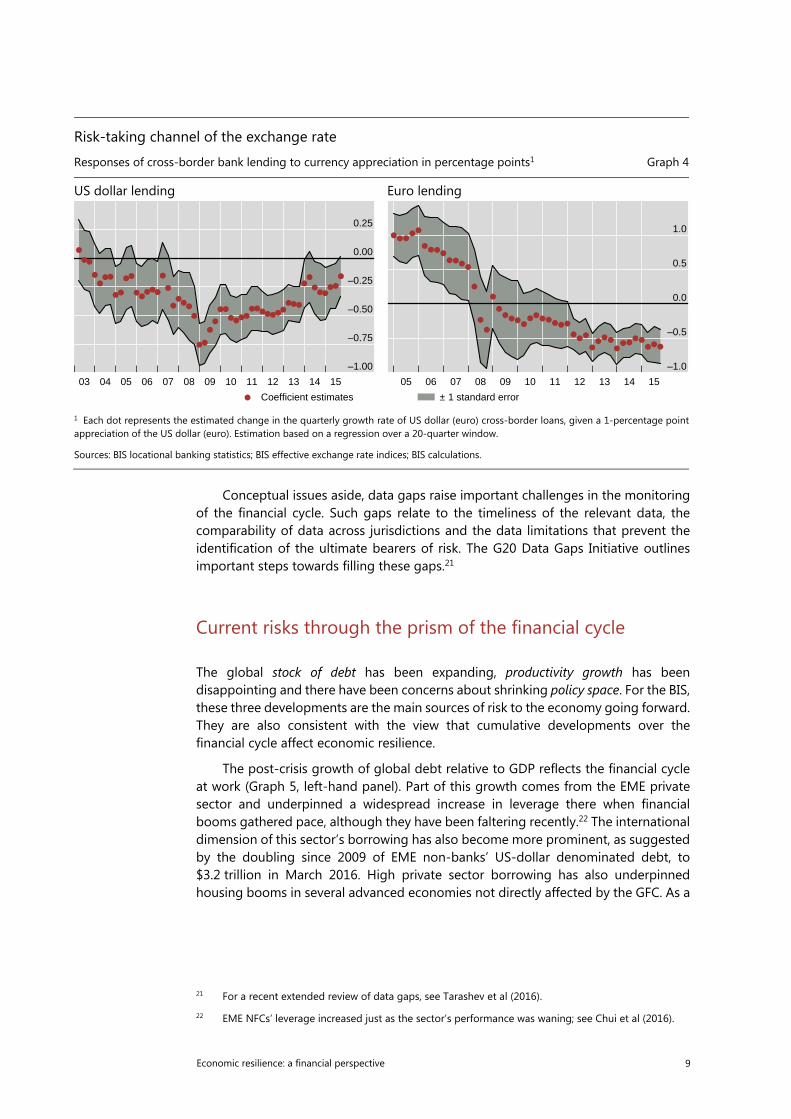
The global stock of debt has been expanding, productivity growth has been disappointing and there have been concerns about shrinking policy space. For the BIS, these three developments are the main sources of risk to the economy going forward. They are also consistent with the view that cumulative developments over the financial cycle affect economic resilience.
The post-crisis growth of global debt relative to GDP reflects the financial cycle at work (Graph 5, left-hand panel). Part of this growth comes from the EME private sector and underpinned a widespread increase in leverage there when financial booms gathered pace, although they have been faltering recently.22 The international dimension of this sector’s borrowing has also become more prominent, as suggested by the doubling since 2009 of EME non-banks’ US-dollar denominated debt, to $3.2 trillion in March 2016. High private sector borrowing has also underpinned housing booms in several advanced economies not directly affected by the GFC. As a
21 For a recent extended review of data gaps, see Tarashev et al (2016).
22 EME NFCs’ leverage increased just as the sector’s performance was waning; see Chui et al (2016).
Risk-taking channel of the exchange rate
Responses of cross-border bank lending to currency appreciation in percentage points1 Graph 4
US dollar lending Euro lending
1 Each dot represents the estimated change in the quarterly growth rate of US dollar (euro) cross-border loans, given a 1-percentage point appreciation of the US dollar (euro). Estimation based on a regression over a 20-quarter window.
Sources: BIS locational banking statistics; BIS effective exchange rate indices; BIS calculations.
–1.00
–0.75
–0.50
–0.25
0.00
0.25
03 04 05 06 07 08 09 10 11 12 13 14 15
Coefficient estimates
–1.0
–0.5
0.0
0.5
1.0
05 06 07 08 09 10 11 12 13 14 15
± 1 standard error

10 Economic resilience: a financial perspective
Early warning indicators for stress in domestic banking systems1 Table 1
Credit-to-GDP gap2 Property price gap3 Debt service ratio4 Debt service ratio if interest rates rise by 250 bp4, 5
Argentina 2.3
Australia 3.0 3.8 1.4 5.4
Brazil 4.2 –30.4 7.4 9.2
Canada 15.1 5.3 2.8 6.9
China 29.6 –1.9 5.4 8.7
France 2.2 –11.6 1.0 4.1
Germany –5.1 13.3 –1.8 0.0
India –2.9 1.8 2.9
Indonesia 9.1 12.6 0.8 1.5
Italy –13.8 –15.1 –0.1 2.0
Japan 2.4 16.0 –2.0 0.8
Korea 3.2 5.4 –0.6 3.0
Mexico 8.8 5.0 0.6 1.3
Russia 0.6 –34.3 4.0 5.5
Saudi Arabia 13.9
South Africa –0.3 –10.4 –0.3 1.0
Turkey 9.7 5.7 7.3
United Kingdom –21.8 0.2 –1.7 1.0
United States –8.8 4.2 –1.7 0.9
Memo:
CEE6 –11.9 9.7 0.1 1.5
Portugal –39.7 13.0 –1.6 1.7
Netherlands –20.2 –10.2 0.7 5.4
Nordic countries7 –1.2 3.4 1.0 5.0
Switzerland 6.1 7.8 0.0 3.2
Legend Credit/GDP gap>10 Property gap>10 DSR>6 DSR>6
2≤Credit/GDP gap≤10 4≤DSR≤6 4≤DSR≤6
For the credit-to-GDP gap, data up to Q2 2016 except for Argentina, Brazil, China, India, Indonesia, the Netherlands, Saudi Arabia, Turkey and South Africa, for which data end in Q1 2016; for the property price gap, data up to Q2 2016 except for the Netherlands, Norway and Switzerland, for which data end in Q3 2016; for the debt service ratio, data up to Q1 2016.
1 Thresholds for red cells are chosen by minimising false alarms conditional on capturing at least two thirds of the crises over a cumulative three-year horizon. A signal is correct if a crisis occurs in any of the three years ahead. The noise is measured by the wrong predictions outside this horizon. Beige cells for the credit-to-GDP gap are based on guidelines for countercyclical capital buffers under Basel III. Beige cells for the debt service ratio (DSR) are based on critical thresholds if a two-year forecast horizon is used. For a derivation of critical thresholds for credit-to-GDP gaps and property price gaps, see M Drehmann, C Borio and K Tsatsaronis, “Anchoring countercyclical capital buffers: the role of credit aggregates”, International Journal of Central Banking, vol 7, no 4, 2011, pp 189–240. Country aggregates are simple averages. 2 Difference of the credit-to-GDP ratio from its long-run, real-time trend calculated with a one-sided HP filter using a smoothing factor of 400,000, in percentage points. 3 Deviations of real residential property prices from their long-run trend calculated with a one-sided HP filter using a smoothing factor of 400,000, in per cent. 4 For the DSR series and methodology see www.bis.org/statistics/dsr/index.htm. Difference of DSRs from country-specific long-run averages since 1999 or later depending on data availability and when five-year average inflation fell below 10%, in percentage points. 5 Assuming that interest rates increase 2.50 percentage points and that all of the other components of the DSR stay fixed. 6 CEE = Central and eastern Europe: Bulgaria, the Czech Republic, Estonia, Hungary, Latvia, Lithuania, Poland, Romania and Russia; excluding the Czech Republic and Romania for the real property price gap; excluding Bulgaria, Estonia, Latvia, Lithuania and Romania for the DSR and its forecasts. 7 Finland, Norway and Sweden.
Sources: National data; BIS; BIS calculations.

Economic resilience: a financial perspective 11
result, the EWIs discussed above have been flashing red, signalling overheating in a number of countries (Table 1).23
In contrast to developments in EMEs’ private sector, aggregate household and corporate debt has not risen as a share of the corresponding aggregate GDP in advanced economies and has fallen somewhat in the countries most affected by the crisis. While the deleveraging that has taken place has likely impaired the traction of monetary policy (see below), it is also a precondition for a stronger and sustainable recovery. Indeed, the evidence that post-crisis recoveries are often “creditless” suggests that economies need to go through a period of deleveraging in order to return to sustainable growth.24
It is the public sector in advanced economies that has contributed substantially to overall debt growth post-GFC, partly to support the recovery. Since the end of the sovereign debt crisis of 2011–12, this sector has also ridden the tailwinds of exceptionally low borrowing costs. In the process, it has become vulnerable to investors reassessing the risk of exposures to highly indebted sovereigns in slowly growing economies.
23 For analyses showing that high household debt is key to subsequent slow growth, see Mian et al
(2015) and Jordà et al (2016).
24 See Calvo et al (2006), Claessens et al (2009), Bech et al (2012) and Takáts and Upper (2013).
Debt has been rising, and productivity falling, over financial cycles Graph 5
Global debt Labour productivity growth1 USD trn % of GDP 2000-05 = 100
Advanced economies (AEs): Australia, Canada, Denmark, the euro area, Japan, New Zealand, Norway, Sweden, Switzerland, the United Kingdom and the United States.
Emerging market economies (EMEs): Argentina, Brazil, Chile, China, Chinese Taipei, Colombia, the Czech Republic, Hong Kong SAR, Hungary, India, Indonesia, Korea, Malaysia, Mexico, Peru, the Philippines, Poland, Russia, Saudi Arabia, Singapore, South Africa, Thailand and Turkey.
1 Hodrick-Prescott filter applied to the logarithm of annual labour productivity per person employed.
Sources: IMF, World Economic Outlook; OECD, Economic Outlook; The Conference Board, Total Economy Database; national data; BIS; BIS calculations.
85
110
135
0
50
100
150
200
250
AEs EMEs AllEnd-2007
AEs EMEs AllEnd-2010
AEs EMEs AllEnd-2015
Global totalLhs:
General governmentNon-financial corporatesHouseholds
Rhs:
20
60
100
140
180
220
75 80 85 90 95 00 05 10 15
Global AEs EMEs

12 Economic resilience: a financial perspective
The financial cycle – in particular, the unrestrained build-up of financial imbalances in the run-up to the GFC – may have also contributed to the decline in productivity growth in advanced economies (Graph 5, right-hand panel). Indeed, recent BIS research has found that financial booms can erode productivity growth by directing labour to weaker-productivity sectors.25 And this misallocation of resources during the boom has larger and more persistent negative effects on productivity in the aftermath of a crisis that may follow. The economic consequences can be substantial: research findings suggest that the pre-crisis financial boom may have cut in half the average productivity growth in advanced economies between 2008 and 2013. Specific figures aside, the effects appear material.
As the GFC played out, it eventually sapped much of the policy space. The accommodative measures during the crisis were essential for stabilising the financial system and preventing a deeper recession. But their traction was undermined by the legacy of the boom: over-indebted private sectors in need of deleveraging and balance sheet repair, as well as a severely weakened banking system.26 Authorities’ room for manoeuvre thus narrowed while economic growth remained short of expectations, raising questions about whether aggregate demand policies – and in particular, monetary policy – may have been approaching their natural limits. At the same time, there have been hardly any signs that supply conditions have improved to support stronger long-term growth.
There is now a broad-based consensus that monetary policy alone cannot lead to balanced growth.27 Its limitations have become more evident as time has worn on. For instance, a prolonged period of ultra-low interest rates would eventually compress banks’ interest margins, which could undermine banks’ profitability and resilience and reduce their ability and incentives to lend. In addition, persistently low interest rates put in question pension funds’ ability to honour their commitments. This could lead corporates to cut back on investment in order to plug holes in defined benefit plans and could steer individuals to save more for retirement and consume less today.
As far as fiscal policy is concerned, the remaining space is subject to great uncertainty (see below). That said, crisis-driven declines in output and, in some cases, large-scale stimulus packages have probably reduced advanced economies’ room for manoeuvre. There is also reason to believe that this room has been narrowing in EMEs, not least because these economies typically face tighter financing constraints. In addition, financial booms tend to flatter fiscal positions, potentially overstating the resources governments can summon in the event of a downturn. Ultimately, limited fiscal space increases the public sector’s vulnerability to a swing in market sentiment and serious stress.
This puts a premium on prudent use of the available fiscal policy space. Such use could include public spending that focuses on productivity-enhancing investment or efficiency-enhancing tax cuts. And it would also include efforts to increase the quality of public spending, especially in economies where public consumption is already high.
25 See Borio, Kharroubi, Upper and Zampolli (2015).
26 See Bech et al (2012).
27 See G20 (2016).
Economic resilience: a financial perspective 13
Macro-financial stability framework
The key role of the financial cycle for economic resilience calls for a macro-financial stability framework. In this framework, prudential, monetary and fiscal policies would stem the build-up of financial imbalances by leaning more deliberately against financial booms than in the past. Forward-looking and mindful of remaining room for manoeuvre, these policies would then lean less aggressively and persistently against busts so as to avoid the bias in current frameworks. Importantly, as a rule, the various policies would pull in the same direction in order to reinforce each other and avoid sending conflicting signals.
Prudential policy
Prudential policy addresses discrepancies between privately optimal risk-taking and socially optimal outcomes. Microprudential measures target the resilience of individual institutions, treated on a standalone basis, mainly through requirements on capital and liquidity positions. Using similar instruments, macroprudential measures target financial resilience from the perspective of the overall system. They do so in two ways: targeting mainly risk concentrations, such as those resulting from large and systemically important institutions (the so-called structural or “cross-sectional” dimension), and targeting more specifically the financial cycle and sources of procyclicality (the so-called time dimension).28
While the strength of individual balance sheets embeds risk assessments, inevitable deficiencies in these assessments call for an overlay of conservatism. Capital requirements provide a case in point. In bank regulation, these have a risk-sensitive component that is based on models, be they internal to the banks or developed by external agencies or regulators themselves. New rules for insurers in Solvency II go in the same direction.29 Such requirements seek to align the level of capital with the exposures’ riskiness, thus contributing to a realistic pricing of risk. Given the models’ inherent limitations, however, regulation includes backstops, such as banks’ leverage ratio requirement. A leverage ratio has a complementary function, as it rests on a measure of total exposures, as opposed to the riskiness of these exposures.
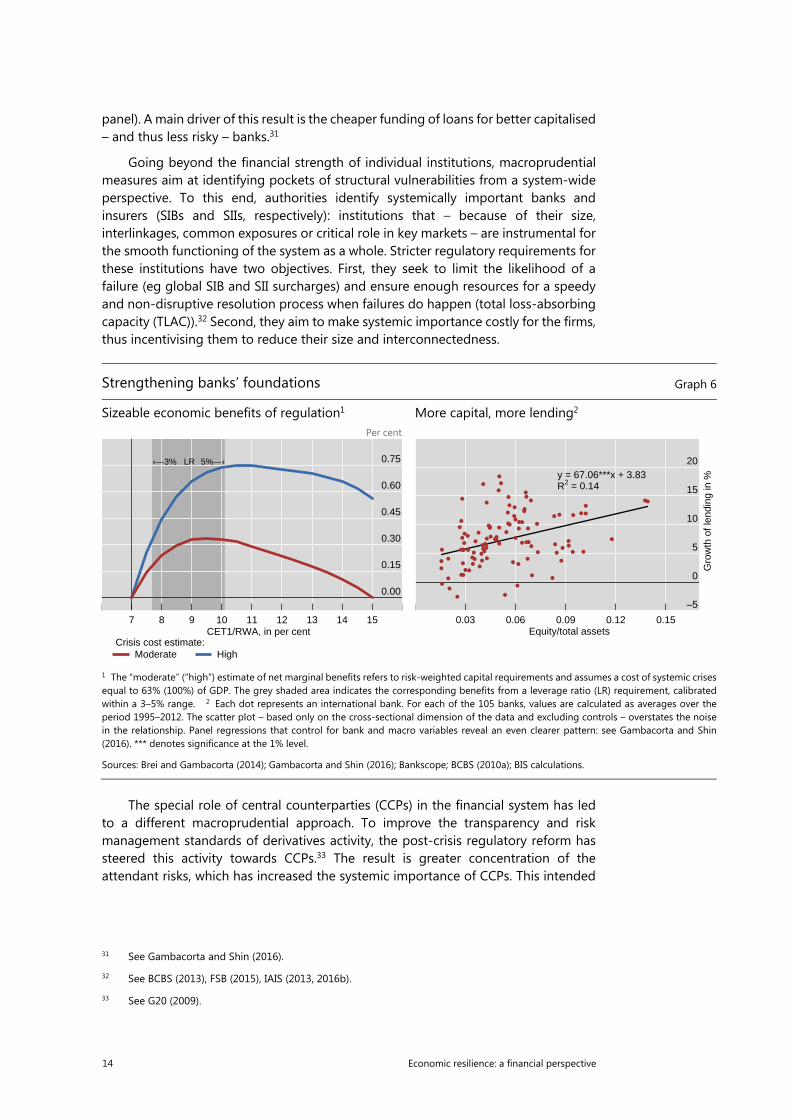
Prudential authorities also decide on the required level of financial institutions’ safeguards. Empirical studies, the Basel Committee’s long-term economic impact study and a recent update30 find that there is enough room for national authorities to raise banks’ requirements above the regulatory minima and still obtain net benefits. This is the case for both risk-based and leverage ratio requirements and reflects the benefits of averting a crisis by ensuring enough loss-absorbing capacity in the system (Graph 6, left-hand panel). Complementing these system-level findings, there is evidence that banks with higher equity-to-asset ratios lend more (right-hand
28 See Caruana (2015).
29 See European Commission (2009, 2014). In addition, the International Association of Insurance Supervisors is developing a risk-based global insurance capital standard for internationally active insurance groups; see IAIS (2016a).
30 See BCBS (2010a) and Fender and Lewrick (2015).
14 Economic resilience: a financial perspective
panel). A main driver of this result is the cheaper funding of loans for better capitalised – and thus less risky – banks.31
Going beyond the financial strength of individual institutions, macroprudential measures aim at identifying pockets of structural vulnerabilities from a system-wide perspective. To this end, authorities identify systemically important banks and insurers (SIBs and SIIs, respectively): institutions that – because of their size, interlinkages, common exposures or critical role in key markets – are instrumental for the smooth functioning of the system as a whole. Stricter regulatory requirements for these institutions have two objectives. First, they seek to limit the likelihood of a failure (eg global SIB and SII surcharges) and ensure enough resources for a speedy and non-disruptive resolution process when failures do happen (total loss-absorbing capacity (TLAC)).32 Second, they aim to make systemic importance costly for the firms, thus incentivising them to reduce their size and interconnectedness.
The special role of central counterparties (CCPs) in the financial system has led to a different macroprudential approach. To improve the transparency and risk management standards of derivatives activity, the post-crisis regulatory reform has steered this activity towards CCPs.33 The result is greater concentration of the attendant risks, which has increased the systemic importance of CCPs. This intended
31 See Gambacorta and Shin (2016).
32 See BCBS (2013), FSB (2015), IAIS (2013, 2016b).
33 See G20 (2009).
Strengthening banks’ foundations Graph 6
Sizeable economic benefits of regulation1 More capital, more lending2 Per cent
1 The “moderate” (“high”) estimate of net marginal benefits refers to risk-weighted capital requirements and assumes a cost of systemic crises equal to 63% (100%) of GDP. The grey shaded area indicates the corresponding benefits from a leverage ratio (LR) requirement, calibrated within a 3–5% range. 2 Each dot represents an international bank. For each of the 105 banks, values are calculated as averages over theperiod 1995–2012. The scatter plot – based only on the cross-sectional dimension of the data and excluding controls – overstates the noise in the relationship. Panel regressions that control for bank and macro variables reveal an even clearer pattern: see Gambacorta and Shin (2016). *** denotes significance at the 1% level.
Sources: Brei and Gambacorta (2014); Gambacorta and Shin (2016); Bankscope; BCBS (2010a); BIS calculations.
0.00
0.15
0.30
0.45
0.60
0.75
7 8 9 10 11 12 13 14 15
‹—3% LR 5%—›
CET1/RWA, in per cent
Moderate Crisis cost estimate:
High
–5
0
5
10
15
20
0.03 0.06 0.09 0.12 0.15
Gro
wth
of l
endi
ng in
%y = 67.06***x + 3.83R2 = 0.14
Equity/total assets
Economic resilience: a financial perspective 15
policy outcome has been combined with measures to strengthen CCPs’ resilience through stricter risk management standards.34
In turn, countercyclical macroprudential measures address the financial cycle head on. These measures have two interrelated objectives. The first is to build up prudential buffers during the financial cycle’s upturn in order to draw on them in a controlled manner during the downturn, thus containing the attendant costs. The second, more ambitious, goal is to restrain risk-taking during the boom, thus containing the development of vulnerabilities.
A concrete example of a policy rule that embeds this philosophy is countercyclical regulatory requirements.35 As regards banks, the Basel III guidelines identify one of the EWIs discussed above – namely, the credit-to-GDP gap – as the starting point for policy discussions about countercyclical capital buffers.36 The agreed international reciprocity in the implementation of these buffers seeks to address the financial cycle’s synchronicity and macroprudential policies’ cross-border effects. In CCP space, analogous measures seek to limit procyclical changes to clearing members’ margins and collateral.
Having gone a long way in responding to lessons from the GFC, prudential authorities now face two challenges. The first is to stay firm in defending the gains of the post-crisis regulatory reform. A key goal of the reform is to address features of the financial system that lead to unsustainable imbalances. For example, the high pre-crisis return on equity flattered banks’ performance measures but was attained on the back of unsustainably high leverage. Likewise, the pre-crisis environment created liquidity illusion, resulting in many market participants being caught by surprise when liquidity evaporated at the first sign of stress. Thus, steering the system towards more sustainable bank performance and a more realistic pricing of risks are important objectives.
The second challenge is to address the morphing of risks. As traditional financial players retrench, market-based finance is gaining ground, alongside the weight of asset managers. The post-crisis ascent of asset managers means new, potentially destabilising, market forces. Asset managers are a source of concern not because of high debt levels but because of mandates that can make them unwilling or unable to absorb temporary losses. Consistent with this, there is evidence that their behaviour could amplify market volatility. For one, fund flows tend to be procyclical: inflows follow high returns, while outflows follow low returns.37 In addition, far from dampening the effect of client orders on market prices, asset managers amplify it:
34 See CPSS and IOSCO (2012). Ongoing work by the CPMI, IOSCO and the FSB includes: offering further
guidance to national authorities for enhancing CCPs’ resilience and recovery planning; analysing CCPs’ exposure to common shocks; identifying and quantifying the interdependencies between CCPs and major financial institutions; and monitoring the implementation of resolution regimes.
35 In addition, there have been national efforts to put in place macroprudential frameworks, with the strong support of the G20. FSB-IMF-BIS (2016) provides a classification of these frameworks (in particular, Annex 1 and Table 1) and reviews studies of their effectiveness (Annex 2).
36 See BCBS (2010b). Authorities are expected to apply judgment in setting the buffer in their jurisdiction after using the best information available to gauge the build-up of system-wide risk, rather than relying mechanistically on the credit-to-GDP guide. For instance, national authorities may form their policy decisions using credit-to-GDP ratios based on different data series from the BIS’s as input data, leading to credit-to-GDP gaps that differ from those published by the BIS.
37 See BIS (2015), Chapter VI.
16 Economic resilience: a financial perspective
their discretionary trades tend to be in the same direction as client-induced trades.38 Recent policy initiatives are seeking an international response to these new sources of risk.39
Monetary policy
The macro-financial stability framework would require monetary policy frameworks to take financial stability considerations systematically into account. To keep financial conditions on an even keel at all times, monetary policy would lean against the wind of financial booms to help smooth the financial cycle. In effect, this strategy would recognise that information about financial imbalances could signal macroeconomic overheating even when the evolution of inflation is benign. During periods of stress, monetary policy would seek to maintain robust liquidity conditions, while leaving itself enough room for manoeuvre in a subsequent persistent downturn. This systematic monetary strategy would usefully complement other policies, thus helping to mitigate financial vulnerabilities and reap the benefits of crisis prevention.
Systematically incorporating financial stability considerations into monetary policy would suggest refinements of existing frameworks. It would be important to use the flexibility already embedded in monetary policy mandates to lengthen the policy horizon and look beyond short-term price stability, which would allow slow-moving financial imbalances to be taken into account. The case for such an approach has been strengthened by the long-standing weakening of the link between inflation and domestic measures of slack40 and by the likelihood that some of the disinflationary pressures reflect benign but persistent factors, not least the globalisation of the real economy and the entry of large, low-cost producers in the trading system. A second step would be to pay close attention to the risk of doing too little too late, as might be the case if authorities waited for imbalances to become obvious before responding. Acting at such a point could simply precipitate, instead of ward off, the problems. This suggests that a more systematic response to financial cycles might be preferable.
Analyses of monetary leaning against the financial cycle compare the output costs of tightening during a boom to the subsequent output benefits from reducing the likelihood and severity of a crisis down the road. Such analyses are not easy, not least because the relationship between policy actions and economic outcomes might change when the policy rule changes. And there is, as yet, no consensus on the balance of benefits and costs. That said, BIS research that incorporates realistic features of the financial cycle suggests that the potential benefits can be significant and that it is important to lean early.41
38 See Shek et al (2015).
39 See FSB (2016).
40 For a long time, inflation has proved quite insensitive to measures of domestic economic slack. See, among others, Stock and Watson (2007), Ball and Mazumder (2011) and Faust and Leeper (2015).
41 See Juselius et al (2016) and Filardo and Rungcharoenkitkul (2016). Studies that find limited benefits of leaning against the wind typically assume – inter alia – that crises do not result in permanent output losses, that leaning affects the probability of a crisis but not its costs and that there are no costs to waiting; see eg Ajello et al (2015), Svensson (2014, 2016) and IMF (2015b). Relaxing some of these assumptions, Adrian and Liang (2016) find higher benefits from a leaning strategy.
Economic resilience: a financial perspective 17
How far such a policy can be pursued will also depend on country-specific features. In particular, in a small open economy a central bank has more limited influence on borrowing costs and liquidity conditions, owing to the external factors discussed above. In particular, excessively accommodative global liquidity conditions raise challenging policy trade-offs. Raising the policy rate would tighten domestic currency liquidity conditions but would tend to lead to an appreciation of the domestic currency, thus attracting further capital flows and also setting in motion the risk-taking channel of exchange rates. This would suggest a relatively greater reliance on macroprudential measures, foreign exchange intervention and fiscal policy (see below).
From a more global perspective, large jurisdictions that are home to international funding currencies have a special responsibility. They could consider the cross-border effects of their domestic policies, at least insofar as they reverberate back (“enlightened self-interest”). International consultations can help here.
Fiscal policy
The financial and public sectors are closely intertwined. The link can run both ways. In one direction, a weak financial system can undermine fiscal health. Unsustainable financial booms often end in serious financial strains or outright crises, resulting in large increases in public debt. In this case, the loss of revenue and higher spending from the crisis-induced recession and slow recovery substantially add to any direct bailout costs needed to support troubled financial institutions. In the other direction, a weak fiscal position can undermine a financial system’s health. Directly, it reduces the value of financial institutions’ claims on the sovereign. Indirectly, it undermines the government’s ability to backstop banks once private loss-absorbing capacity – in the form of equity or bail-in-able debt – has been used. Banks’ capital may run thin and funding in collateralised markets may become more expensive.42 Furthermore, access to foreign funding may also deteriorate for all firms and the scope for stabilising fiscal interventions in a recession or a crisis may narrow, leading to larger drops in asset prices and credit demand than otherwise, hitting banks’ balance sheets indirectly.
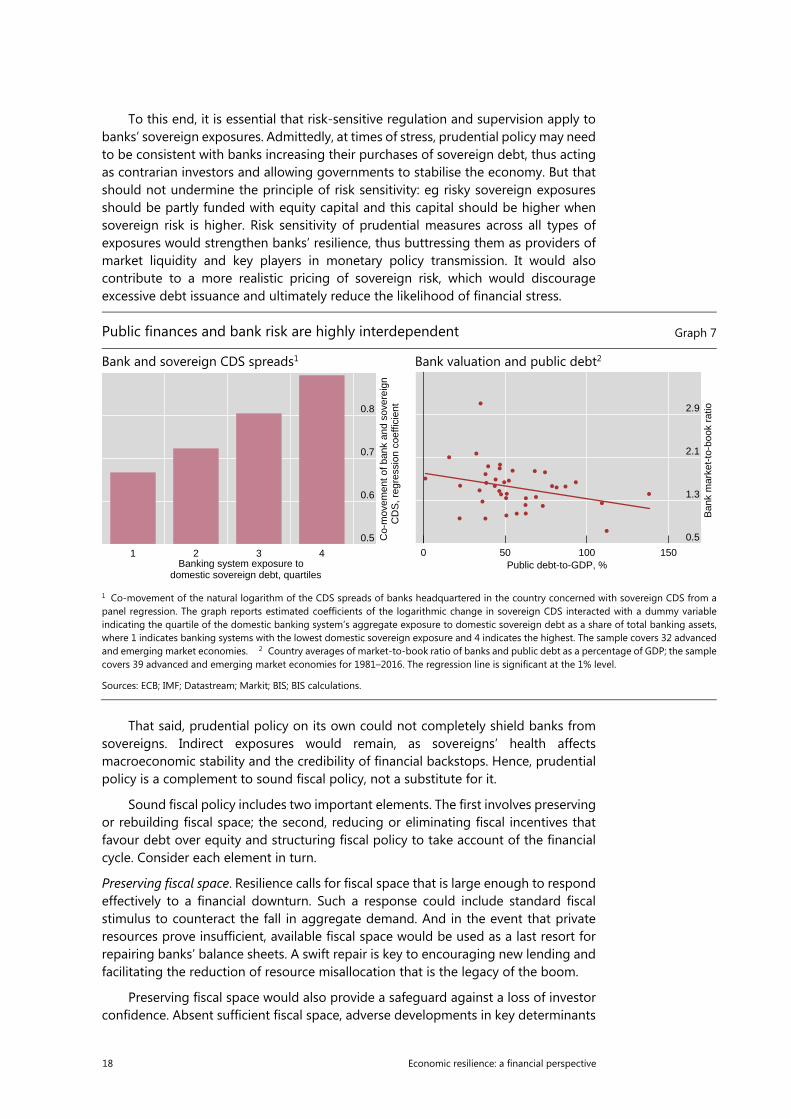
These two-way links create the potential for a vicious circle or doom loop, in which financial and sovereign risks and their effects on the broader economy can be mutually reinforcing. For instance, market-based measures of solvency risks for banks and sovereigns (CDS spreads) display a stronger correlation in countries with high public debt and larger banks’ sovereign exposures (Graph 7, left-hand panel). Even within the same country, banks with larger domestic sovereign exposures, less capital or more wholesale funding have cut credit to private firms by more in response to a rise in sovereign risk.43 Given these close ties, it is unsurprising that, across time and a large sample of countries, banks’ market valuations (their market-to-book values) and public debt ratios are negatively related (right-hand panel).
What can policymakers do to minimise the amplification of risk?
42 See CGFS (2011)
43 Studies exploiting micro data include de Bruyckere et al (2013), Demirgüç-Kunt and Huizinga (2013) and Bottero et al (2016). Earlier studies that identified the doom loop in the euro area include Sgherri and Zoli (2009) and Mody (2009).
18 Economic resilience: a financial perspective
To this end, it is essential that risk-sensitive regulation and supervision apply to banks’ sovereign exposures. Admittedly, at times of stress, prudential policy may need to be consistent with banks increasing their purchases of sovereign debt, thus acting as contrarian investors and allowing governments to stabilise the economy. But that should not undermine the principle of risk sensitivity: eg risky sovereign exposures should be partly funded with equity capital and this capital should be higher when sovereign risk is higher. Risk sensitivity of prudential measures across all types of exposures would strengthen banks’ resilience, thus buttressing them as providers of market liquidity and key players in monetary policy transmission. It would also contribute to a more realistic pricing of sovereign risk, which would discourage excessive debt issuance and ultimately reduce the likelihood of financial stress.
That said, prudential policy on its own could not completely shield banks from sovereigns. Indirect exposures would remain, as sovereigns’ health affects macroeconomic stability and the credibility of financial backstops. Hence, prudential policy is a complement to sound fiscal policy, not a substitute for it.
Sound fiscal policy includes two important elements. The first involves preserving or rebuilding fiscal space; the second, reducing or eliminating fiscal incentives that favour debt over equity and structuring fiscal policy to take account of the financial cycle. Consider each element in turn.
Preserving fiscal space. Resilience calls for fiscal space that is large enough to respond effectively to a financial downturn. Such a response could include standard fiscal stimulus to counteract the fall in aggregate demand. And in the event that private resources prove insufficient, available fiscal space would be used as a last resort for repairing banks’ balance sheets. A swift repair is key to encouraging new lending and facilitating the reduction of resource misallocation that is the legacy of the boom.
Preserving fiscal space would also provide a safeguard against a loss of investor confidence. Absent sufficient fiscal space, adverse developments in key determinants
Public finances and bank risk are highly interdependent Graph 7
Bank and sovereign CDS spreads1 Bank valuation and public debt2
1 Co-movement of the natural logarithm of the CDS spreads of banks headquartered in the country concerned with sovereign CDS from apanel regression. The graph reports estimated coefficients of the logarithmic change in sovereign CDS interacted with a dummy variable indicating the quartile of the domestic banking system’s aggregate exposure to domestic sovereign debt as a share of total banking assets,where 1 indicates banking systems with the lowest domestic sovereign exposure and 4 indicates the highest. The sample covers 32 advanced and emerging market economies. 2 Country averages of market-to-book ratio of banks and public debt as a percentage of GDP; the sample covers 39 advanced and emerging market economies for 1981–2016. The regression line is significant at the 1% level.
Sources: ECB; IMF; Datastream; Markit; BIS; BIS calculations.
0.5
0.6
0.7
0.8
1 2 3 4 Banking system exposure to domestic sovereign debt, quartiles
Co-
mov
emen
t of b
ank
and
sove
reig
n
C
DS
, reg
ress
ion
coef
ficie
nt
0.5
1.3
2.1
2.9
0 50 100 150Public debt-to-GDP, %
Ban
k m
arke
t-to
-boo
k ra
tio
Economic resilience: a financial perspective 19
of fiscal positions, such as interest rates, could trigger a rise in sovereign borrowing costs and force a sharp fiscal contraction. At present, extremely low (or even negative) long-term yields, and compressed term premia, pose a risk of a sharp adjustment in the future.
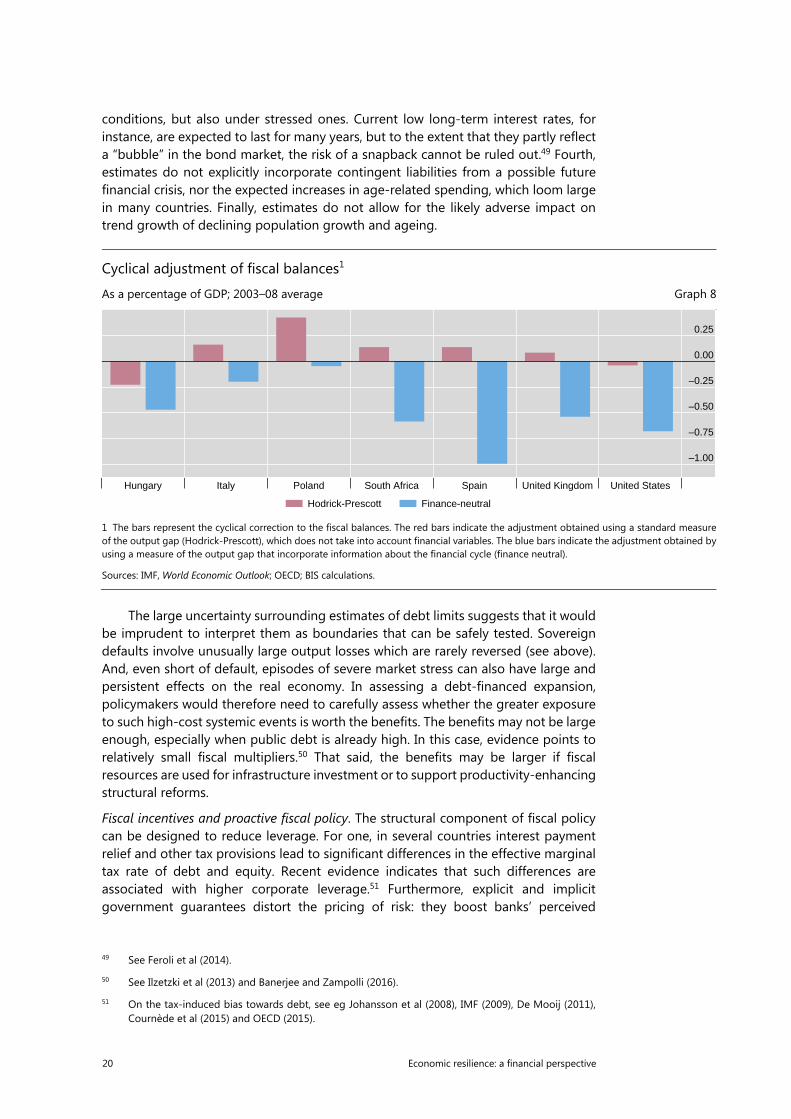
To ensure ample fiscal space, policymakers face at least two practical challenges. One is to protect whatever fiscal space there is in the upturn of the financial cycle. Indeed, financial booms flatter fiscal balances. Standard methods may indicate that potential output is permanently higher, when in fact it is only temporarily boosted by the financial boom. If so, higher revenues and lower expenditures would not last. Revenues might be further boosted by the attendant, yet temporary, increases in asset or commodity prices. And the nominal exchange rate might also appreciate, temporarily reducing the domestic currency value of FX-denominated debt and the corresponding interest payments. Unfortunately, standard measures of the cyclically adjusted fiscal balance do not account for these effects. Hence, when the boom turns to bust, fiscal positions may end up being much worse than policymakers had anticipated.44 One possible, albeit partial, remedy is to adjust fiscal balances with measures of the output gap45 that incorporate information about the financial cycle.46 Pre-crisis, this method would have signalled a deteriorating fiscal position in several countries, whereas the standard method indicated an improvement (Graph 8).47
The other challenge in assessing fiscal space is to estimate debt limits – how much debt can be raised without provoking strains as the creditworthiness of the sovereign comes into question. A debt limit is normally calculated as the present discounted value of the maximum average primary fiscal surplus that a country can sustain. A recent method calculates such an average surplus on the basis of historical experience, while allowing for political and economic considerations that prevent persistent increases in fiscal surpluses – a reaction function approach.48
Any estimates of debt limits should be taken with great caution. For one, even small changes to the estimated coefficients of the fiscal reaction function could alter debt limit estimates by roughly 100% of GDP. Second, estimated debt limits are largely based on extrapolation. Few countries have experienced debt levels anywhere near the estimated debt limits. It would therefore be imprudent to assume that financial markets would not react before those limits are reached (which would, in turn, invalidate the estimates). Third, estimates largely ignore the risk that economic conditions may suddenly deteriorate. Yet debt limits should naturally depend on a government’s ability to sustain debt not only under average economic and financial
44 The experiences of Spain and Ireland are telling. Their fiscal accounts looked strong during the pre-
GFC financial boom: the debt-to-GDP ratios were low and falling and fiscal surpluses prevailed. And yet, following the bust and the banking crises, sovereign crises broke out.
45 The output gap is the difference between the actual level of output and its long-run average level (or potential output). It is not observable and needs to be estimated. Standard methods that do not incorporate financial information may overstate potential output – that is, understate the output gap – during financial booms.
46 See Borio, Lombardi and Zampolli (2016).
47 The graph understates the true adjustment. The underlying method does not correct entirely for the change in the composition of revenues during a financial boom and does not account for contingent liabilities, which tend to increase as private debt rises during a boom (Borio, Lombardi and Zampolli (2016)).
48 See Box V.B in BIS (2016) for details.
20 Economic resilience: a financial perspective
conditions, but also under stressed ones. Current low long-term interest rates, for instance, are expected to last for many years, but to the extent that they partly reflect a “bubble” in the bond market, the risk of a snapback cannot be ruled out.49 Fourth, estimates do not explicitly incorporate contingent liabilities from a possible future financial crisis, nor the expected increases in age-related spending, which loom large in many countries. Finally, estimates do not allow for the likely adverse impact on trend growth of declining population growth and ageing.
The large uncertainty surrounding estimates of debt limits suggests that it would be imprudent to interpret them as boundaries that can be safely tested. Sovereign defaults involve unusually large output losses which are rarely reversed (see above). And, even short of default, episodes of severe market stress can also have large and persistent effects on the real economy. In assessing a debt-financed expansion, policymakers would therefore need to carefully assess whether the greater exposure to such high-cost systemic events is worth the benefits. The benefits may not be large enough, especially when public debt is already high. In this case, evidence points to relatively small fiscal multipliers.50 That said, the benefits may be larger if fiscal resources are used for infrastructure investment or to support productivity-enhancing structural reforms.
Fiscal incentives and proactive fiscal policy. The structural component of fiscal policy can be designed to reduce leverage. For one, in several countries interest payment relief and other tax provisions lead to significant differences in the effective marginal tax rate of debt and equity. Recent evidence indicates that such differences are associated with higher corporate leverage.51 Furthermore, explicit and implicit government guarantees distort the pricing of risk: they boost banks’ perceived
49 See Feroli et al (2014).
50 See Ilzetzki et al (2013) and Banerjee and Zampolli (2016).
51 On the tax-induced bias towards debt, see eg Johansson et al (2008), IMF (2009), De Mooij (2011), Cournède et al (2015) and OECD (2015).
Cyclical adjustment of fiscal balances1
As a percentage of GDP; 2003–08 average Graph 8
1 The bars represent the cyclical correction to the fiscal balances. The red bars indicate the adjustment obtained using a standard measure of the output gap (Hodrick-Prescott), which does not take into account financial variables. The blue bars indicate the adjustment obtained byusing a measure of the output gap that incorporate information about the financial cycle (finance neutral).
Sources: IMF, World Economic Outlook; OECD; BIS calculations.
–1.00
–0.75
–0.50
–0.25
0.00
0.25
Hungary Italy Poland South Africa Spain United Kingdom United States
Hodrick-Prescott Finance-neutral
Economic resilience: a financial perspective 21
creditworthiness – as reflected, for instance, in ratings – which tends to lower credit spreads. While guarantees can be essential to protect the financial system in periods of acute stress, the underpricing of risk strengthens incentives to lever up.
Cyclical fiscal policy could complement monetary policy and macroprudential tools to lean against the wind. To the extent that authorities base policies on cyclically adjusted measures of fiscal space, their stance would already be countercyclical. It would contribute to the build-up of fiscal resources during a financial upturn so that they could be deployed in a downturn. Whether fiscal policy can also dampen significantly the financial cycle is still an open question. That said, there are some promising indications that tighter fiscal policy may slow private credit growth without having large adverse effects on output.52 Another advantage of fiscal policy, at least compared to monetary policy, is that it can be more targeted and may limit the currency appreciation that could go along with higher interest rates. On the other hand, fiscal policy may be harder to implement in a timely fashion. For this reason, automatic stabiliser mechanisms aimed at the financial cycle rather than the business cycle may be a more promising avenue.
52 See Banerjee and Zampolli (2016).
22 Economic resilience: a financial perspective
Policy principles
Strive for financial resilience in two complementary ways.
o Build prudential buffers and policy space to withstand shocks.
o Systematically stem the accumulation of imbalances to avoid unsustainable financial booms.
Monitor financial resilience with a holistic perspective on balance sheet strength.
o Track the accumulated stock of debt, gross capital flows, leverage, short-term funding and the attendant maturity mismatches, borrowers’ nationality, and the currency denomination of assets and liabilities.
o Monitor countries’ exposure to a common financial cycle.
o Compile timely and internationally consistent data for monitoring the evolution of risk exposures.
Design prudential requirements in a way that accounts for the riskiness of exposures. In addition:
o Address inherent deficiencies of risk measurement through prudential backstops proportionate to the size of exposures.
o Apply prudential surcharges proportionate to the systemic importance of institutions and infrastructures.
Build up prudential buffers during financial booms. Ensure that these buffers can be drawn down when needed and are commensurate with substantial losses during a downturn.
Use the flexibility embedded in monetary policy frameworks to incorporate financial stability considerations.
In conducting fiscal policy, discount the apparent improvement in fiscal positions during financial booms and prepare for a substantial drainage of resources during busts.
Build adequate fiscal space in normal times to:
o instil confidence in the strength of the financial sector.
o be a viable last resort for swift post-crisis balance sheet repairs if private resources prove insufficient.

Economic resilience: a financial perspective 23
References
Adrian, T and N Liang (2016): “Monetary policy, financial conditions, and financial stability”, Federal Reserve Bank of New York Staff Reports, no 690, July.
Ajello, A, T Laubach, D López-Salido and T Nakata (2015): “Financial stability and optimal interest-rate policy”, presented at the Federal Reserve Bank of San Francisco conference “The new normal for monetary policy”.
Andrews, D and F Cingano (2014): “Public policy and resource allocation: evidence from firms in OECD countries”, Economic Policy, vol 29, no 78, pp 253–96.
Avdjiev, S, R McCauley and H S Shin (2015): “Breaking free of the triple coincidence in international finance”, BIS Working Papers, no 524, October.
Ball, L and S Mazumder (2011): “Inflation dynamics and the great recession,” NBER Working Papers, no 17044.
Banerjee, R and F Zampolli (2016): “What drives the short-run costs of fiscal consolidation? Evidence from OECD economies”, BIS Working Papers, no 553, March.
Bank for International Settlements (2005): 75th Annual Report, June.
——— (2008): “Addressing financial system procyclicality: a possible framework”, note for the FSF Working Group on Market and Institutional Resilience, September.
——— (2014): 84th Annual Report, June.
——— (2015): 85th Annual Report, June.
——— (2016): 86th Annual Report, June.
Basel Committee on Banking Supervision (2010a): An assessment of the long-term economic impact of stronger capital and liquidity requirements, August.
——— (2010b): Basel III: A global regulatory framework for more resilient banks and banking systems, December.
——— (2013): Global systemically important banks: updated assessment methodology and the higher loss absorbency requirement, July.
Bech, M, L Gambacorta and E Kharroubi (2012): “Monetary policy in a downturn: are financial crises special?”, BIS Working Papers, no 388, September.
Bénétrix, A, P Lane and J Shambaugh (2015): “International currency exposures, valuation effects and the global financial crisis”, Journal of International Economics, vol 96, supplement 1, July, pp S98–S109.
Borio, C and P Disyatat (2011): “Global imbalances and the financial crisis: link or no link?”, BIS Working Papers, no 346, May.
——— (2015): “Capital flows and the current account: taking financing (more) seriously”, BIS Working Papers, no 525, October.
Borio, C, M Drehmann and K Tsatsaronis (2012): “Stress-testing macro stress testing: does it live up to expectations?”, BIS Working Papers, no 369, January.
Borio, C, E Kharroubi, C Upper and F Zampolli (2015): “Labour reallocation and productivity dynamics: financial causes, real consequences”, BIS Working Papers, no 534, December.

24 Economic resilience: a financial perspective
Borio, C, M Lombardi and F Zampolli (2016): “Fiscal sustainability and the financial cycle”, BIS Working Papers, no 552, March.
Borio, C, McCauley R, McGuire P and V Sushko (2016): “Covered interest parity lost: understanding the cross-currency basis”, BIS Quarterly Review, September.
Bottero, M, S Lenzu and F Mezzanotti (2016): “Sovereign debt exposure and the bank lending channel: impact on credit supply and the real economy”, working paper, Harvard University, January.
Brei, M and L Gambacorta (2014): “The leverage ratio over the cycle”, BIS Working Papers, no 471, November.
Calvo, G, A Izquierdo and E Talvi (2006): “Phoenix miracles in emerging markets: recovering without credit from systemic financial crises”, NBER Working Papers, no 12101.
Caruana, J (2015): “Regulatory stability and the role of supervision and governance”, keynote address at the Tenth High-level Meeting on Global Banking Standards and Supervisory Priorities in the Americas, Montevideo, 28 October.
Chui, M, E Kuruc and P Turner (2016): “A new dimension to currency mismatches in the emerging markets: non-financial corporates”, BIS Working Papers, no 550, March.
Claessens, S, A Kose and M Terrones (2009): “What happens during recessions, crunches and busts?”, Economic Policy, vol 24, no 60, pp 655–700.
Committee on the Global Financial System (2011): The impact of sovereign credit risk on bank funding conditions, CGFS Papers, no 43, July.
Committee on Payment and Settlement Systems and International Organization of Securities Commissions (2012): Principles for financial market infrastructures, April.
Cournède, B, O Denk and P Hoeller (2015): “Finance and inclusive growth”, OECD Economic Policy Papers, no 14.
de Bruyckere, V, M Gerhardt, G Schepens and R Vander Vennet (2013): “Bank/sovereign risk spillovers in the European debt crisis“, Journal of Banking and Finance, vol 37.
Demirgüç-Kunt, A and H Huizinga (2013): “Are banks too big to fail or too big to save? International evidence from equity prices and CDS spreads”, Journal of Banking and Finance, vol 37.
De Mooij, R (2011): “Tax biases to debt finance: assessing the problem, finding solutions”, IMF Staff Discussion Note, no 11/11.
Drehmann, M, C Borio and K Tsatsaronis (2012): “Characterising the financial cycle: don’t lose sight of the medium term!”, BIS Working Papers, no 380, June.
——— (2011): “Anchoring countercyclical capital buffers: the role of credit aggregates”, International Journal of Central Banking, vol, 7, no 4, pp 189–240.
Drehmann, M, and M Juselius (2014): “Evaluating early warning indicators of banking crises: satisfying policy requirements”, International Journal of Forecasting, vol 30, no 3, pp 759–80.
European Commission (2009): Directive 2009/138/EC, 25 November.
——— (2014): Directive 2014/51/EU, 16 April.
Economic resilience: a financial perspective 25
Faust, J and E Leeper (2015): “The myth of normal: the bumpy story of inflation and monetary policy”, in Inflation dynamics and monetary policy, proceedings of the 39th Jackson Hole Symposium, Federal Reserve Bank of Kansas City, 27–29 August.
Fender, I and U Lewrick (2015): “Calibrating the leverage ratio”, BIS Quarterly Review, December.
Feroli, M, A Kashyap, K Shoenholtz and H S Shin (2014): “Market tantrums and monetary policy”, Chicago Booth Research Papers, no 14-09.
Filardo, A and P Rungcharoenkitkul (2016): “Quantitative case for leaning against the wind”, BIS Working Papers, forthcoming.
Financial Stability Board (2015): Total loss-absorbing capacity (TLAC) principles and term sheet, November.
——— (2016): “Proposed policy recommendations to address structural vulnerabilities from asset management activities”, 22 June.
Financial Stability Board, International Monetary Fund and Bank for International Settlements (2016): Elements of effective macroprudential policies – lessons from international experience, August.
G20 (2009): G20 Leaders Statement: The Pittsburgh Summit, 24–25 September, www.g20.utoronto.ca/2009/2009communique0925.html.
——— (2016): G20 Leaders’ Communique Hangzhou Summit, 4–5 September, www.g20.org/English/Dynamic/201609/t20160906_3396.html.
Gambacorta, L and H S Shin (2016): “Why bank capital matters for monetary policy”, Journal of Financial Intermediation, forthcoming. Also published as BIS Working Papers, no 558.
Gourinchas, P-O and H Rey (2014): “External adjustment, global imbalances, valuation effects”, in G Gopinath, E Helpman and K Rogoff (eds), Handbook of international economics, vol 4, pp 585–646.
Ilzetzki, E, E Mendoza and C Végh (2013): “How big (small?) are fiscal multipliers?”, Journal of Monetary Economics, vol 60, pp 239–54.
International Association of Insurance Supervisors (2013): Global systemically important insurers: policy measures, July.
——— (2016a): “Risk-based global insurance capital standard version 1.0”, public consultation document, July.
——— (2016b): Global systemically important insurers: updated assessment methodology, June.
International Monetary Fund (2009): “Debt bias and other distortions: crisis-related issues in tax policy”, IMF Policy Papers.
——— (2015a): “Structural reforms and macroeconomic performance: initial considerations for the Fund”, IMF Policy Papers.
——— (2015b): “Monetary policy and financial stability”, IMF Policy Papers.
——— (2016): “Time for a supply-side boost? Macroeconomic effects of labor and product market reforms”, World Economic Outlook, April, Chapter 3.
Johansson, Å, C Heady, J Arnold, B Brys and L Vartia (2008), “Taxation and economic growth”, OECD Economics Department Working Papers, no 620.
26 Economic resilience: a financial perspective
Jordà, O, M Schularick, and A M Taylor (2016): “The great mortgaging: Housing finance, crises and business cycles”, Economic Policy, vol 85, pp 107–40.
Juselius, M, C Borio, P Disyatat and M Drehmann (2016): “Monetary policy, the financial cycle and ultra-low interest rates”, BIS Working Papers, no 569, July.
Lane, P and J Shambaugh (2010a): “Financial exchange rates and international currency exposures”, American Economic Review, vol 100, pp 518–40.
——— (2010b): “The long or short of it: determinants of foreign currency exposure in external balance sheets”, Journal of International Economics, vol 80, pp 33–44.
McCauley, R, P McGuire and V Sushko (2015): “Dollar credit to emerging market economies”. BIS Quarterly Review, December, pp 27–41.
McGuire, P and G von Peter (2012): “The US dollar shortage in global banking and the international policy response”, International Finance, vol 15, issue 2.
Mian, A, A Sufi and E Verner (2015): “Household debt and business cycles worldwide”, NBER Working Papers, no 21581.
Mody, A (2009): “From Bear Stearns to Anglo Irish: How Eurozone sovereign spreads related to financial sector vulnerability”, IMF Working Papers, no 09/108.
Obstfeld, M (2012): “Does the current account still matter?”, American Economic Review: Papers and Proceedings, vol 102, no 3,pp 1–23.
OECD (2015): Measuring and Monitoring BEPS, Action 11 – 2015 Final Report, OECD/G20 Base Erosion and Profit Shifting Project.
Saia, A, D Andrews and S Albrizio (2015): “Public policy and spillovers from the global productivity frontier: industry level evidence”, OECD Economics Department Working Papers, no 1238.
Sgherri, S and E Zoli (2009): “Euro area sovereign risk during the crisis”, IMF Working Papers, no 09/222.
Shek, J, I Shim and H S Shin (2015): “Investor redemptions and fund manager sales of emerging market bonds: how are they related?”, BIS Working Papers, no 509, August.
Shin, H S (2015): “Exchange rates and the transmission of global liquidity”, speech at Bank of Korea-IMF Conference, 11 December.
——— (2016): “Global liquidity and procyclicality”, speech at the World Bank conference “The state of economics, the state of the world”, 8 June.
Stock, J and M Watson (2007): “Why has US inflation become harder to forecast?”, Journal of Money, Credit and Banking, vol 39, no 1, pp 3–33.
Svensson, L (2014): “Inflation targeting and ‘leaning against the wind’”, International Journal of Central Banking, vol 10, no 2, pp 103–14.
——— (2016): “Cost-benefit analysis of leaning against the wind: are costs larger also with less effective macroprudential policy?”, IMF Working Papers, no WP/16/3.
Takáts, E and C Upper (2013): “Credit and growth after financial crises”, BIS Working Papers, no 416, July.
Tarashev, N, S Avdjiev and B Cohen (2016): “International capital flows and financial vulnerabilities in emerging market economies: analysis and data gaps”, note submitted to the G20 International Financial Architecture Working Group, August.