Economic Potential for Utilizing Minced Fish in Cooked Sausage
6
Economic Potential for Utilizing Minced Fish in Cooked Sausage Products RICHARD J. AGNELLO Introduction The Magnuson Fishery Conservation and Management Act of 1976 (PL. 94- 265) and the American Fisheries Promo- tion Act of 1980 (PL. 96-561) combined to establish the legal basis for the con- servation and management of most fishery resources within the U.S. Fishery Conservation Zone (FCZ) and in some cases beyond the FCZ to the end of the U.S. continental shelf. The Acts also provide the opportunity for expand- ing the U.S. fishing industry especially in cases where foreign catch within the U.S. FCZ has been large. Unless domes- tic markets can be found, however, it is likely that the United States will con- tinue to allocate large quantities of un- derutilized species to foreign countries for the foreseeable future. PL. 94-265 and PL. 96-561 (together herein referred to as MFCMA) provide a ABSTRACT-In this paper the economic feasibility of using up to 15 percent minced fish flesh in cooked sausage products is in- vestigated. The cost structures for harvest- ing and processing walleye pollock and silver hake are examined in detail using alternative modes of production, account- ing procedures, and assumptions. For wall- eye pollock, a catcher/processor operation has the lowest cost structure. Minced fish appears to be price competitive with the middle to upper range of ingredients in frankfurters. Since the nutritional aspects of mincedfish are equal or superior to current frankfurter ingredients, a strong potential market appears to exist, although limited in size. The potential market for minced fish will not be large relative to either the cooked sausage market or the allowable level of foreign fishing (perhaps 10 percent in each case). Thus the impacts on both the U.S. fishing and agricultural sectors appear small. July-August-September 1983,45(7-8-9) framework for defining and allocating the Total Allowable Level of Foreign Fishing (TALFF). The MFCMA also de- termines that charges to foreigners for harvesting the resource be at least equal to management and enforcement costs incurred by the United States. Charges imposed on foreigners have included fees for permits, poundage caught, foreign surcharges, and on-board obser- vation. Permit and observer fees reflect administrative costs and are independent of resource value. Since poundage fees reflect a percentage (3.5, 7, or 10 per- cent) of dockside (or ex-vessel) price of fish actually caught by foreign vessels, these are related to resource valuation. A surcharge when imposed adds a fixed per- centage (20 percent in 1981) to pound- age and permit fees. Even in the case of poundage fees, it is not clear whether the fee is closely related to the value of the fish resource to foreigners. Since the poundage fee does not systematically vary according to willingness to pay by foreign harvesters, the fee for a particu- lar species may be below foreign valua- tions. Several studies support this view. Meuriot and Gates (1982) reviewed the literature as well as provided evidence that long-run net benefits to foreigners for walleye pollock, Theragra chalco- gramma, varied from $38 to $117 mil- lion per year (1979 dollars). In contrast, poundage fees for walleye pollock for 1981 totaled less than $21 million (or $0.76 per pound) based on a poundage fee of $14 per metric ton plus a 20 per- cent surcharge l . In response to incentives created by 'Fred Olson, Economist, National Mari ne Fisheries Service, NOAA, Washington, DC 20235. Pers. commun. the MFCMA, Government policies sup- portive of U.S. industry expansion ap- pear likely. Indeed, studies have been undertaken by the National Marine Fisheries Service to investigate future development possibilities (e.g., Combs, 1978, 1979). This paper investigates the economic potential of one such policy: Namely the utilization of up to 15 percent minced fish in the production of hot dogs and other cooked sausage products. Since the U. S. Department of Agriculture (USDA) establishes identity standards for hot dogs, the potential utilization of minced fish in products labeled hot dogs would require USDA approval. Some economic background relevant to the as- sessment of the utilization of minced fish in hot dogs is presented in this paper. Economic factors investigated include the potential market, costs, competi- tiveness of minced fish, and potential economic impacts. The meat-bone separation technology provides an opportunity for domestic utilization of some species which are often too small to fillet (e.g., walleye pollock; silver hake, Merluccius bilinearis; and red hake, Urophycis chuss). In addition, the meat-bone sep- aration technology enables recovery of high quality fish flesh from larger fish whose fillets have been removed in a traditional manner. These species in- clude most Atlantic cod, Gadus morhua; large silver hake, and large walleye pol- lock. Research and development has been done on the utilization of the meat-bone separation technology for fish (e.g., Richard J. Agnello is Associate Professor of Economics, University of Delaware, Newark, DE 19711. 21
Transcript of Economic Potential for Utilizing Minced Fish in Cooked Sausage

Economic Potential for Utilizing Minced Fishin Cooked Sausage Products
RICHARD J. AGNELLO
Introduction
The Magnuson Fishery Conservationand Management Act of 1976 (PL. 94265) and the American Fisheries Promotion Act of 1980 (PL. 96-561) combinedto establish the legal basis for the conservation and management of mostfishery resources within the U.S.Fishery Conservation Zone (FCZ) andin some cases beyond the FCZ to the endof the U.S. continental shelf. The Actsalso provide the opportunity for expanding the U.S. fishing industry especiallyin cases where foreign catch within theU.S. FCZ has been large. Unless domestic markets can be found, however, it islikely that the United States will continue to allocate large quantities of underutilized species to foreign countriesfor the foreseeable future.
PL. 94-265 and PL. 96-561 (togetherherein referred to as MFCMA) provide a
ABSTRACT-In this paper the economicfeasibility of using up to 15 percent mincedfish flesh in cooked sausage products is investigated. The cost structures for harvesting and processing walleye pollock andsilver hake are examined in detail usingalternative modes of production, accounting procedures, and assumptions. For walleye pollock, a catcher/processor operationhas the lowest cost structure. Minced fishappears to be price competitive with themiddle to upper range of ingredients infrankfurters. Since the nutritional aspects ofminced fish are equal or superior to currentfrankfurter ingredients, a strong potentialmarket appears to exist, although limited insize. The potential market for minced fishwill not be large relative to either the cookedsausage market or the allowable level offoreign fishing (perhaps 10 percent in eachcase). Thus the impacts on both the U.S.fishing and agricultural sectors appearsmall.
July-August-September 1983,45(7-8-9)
framework for defining and allocatingthe Total Allowable Level of ForeignFishing (TALFF). The MFCMA also determines that charges to foreigners forharvesting the resource be at least equalto management and enforcement costsincurred by the United States. Chargesimposed on foreigners have includedfees for permits, poundage caught,foreign surcharges, and on-board observation. Permit and observer fees reflectadministrative costs and are independentof resource value. Since poundage feesreflect a percentage (3.5, 7, or 10 percent) of dockside (or ex-vessel) price offish actually caught by foreign vessels,these are related to resource valuation. Asurcharge when imposed adds a fixed percentage (20 percent in 1981) to poundage and permit fees. Even in the case ofpoundage fees, it is not clear whether thefee is closely related to the value of thefish resource to foreigners. Since thepoundage fee does not systematicallyvary according to willingness to pay byforeign harvesters, the fee for a particular species may be below foreign valuations.
Several studies support this view.Meuriot and Gates (1982) reviewed theliterature as well as provided evidencethat long-run net benefits to foreignersfor walleye pollock, Theragra chalcogramma, varied from $38 to $117 million per year (1979 dollars). In contrast,poundage fees for walleye pollock for1981 totaled less than $21 million (or$0.76 per pound) based on a poundagefee of $14 per metric ton plus a 20 percent surcharge l
.
In response to incentives created by
'Fred Olson, Economist, National Mari neFisheries Service, NOAA, Washington, DC20235. Pers. commun.
the MFCMA, Government policies supportive of U.S. industry expansion appear likely. Indeed, studies have beenundertaken by the National MarineFisheries Service to investigate futuredevelopment possibilities (e.g., Combs,1978, 1979).
This paper investigates the economicpotential of one such policy: Namely theutilization of up to 15 percent mincedfish in the production of hot dogs andother cooked sausage products. Sincethe U. S. Department of Agriculture(USDA) establishes identity standardsfor hot dogs, the potential utilization ofminced fish in products labeled hot dogswould require USDA approval. Someeconomic background relevant to the assessment of the utilization of mincedfish in hot dogs is presented in this paper.Economic factors investigated includethe potential market, costs, competitiveness of minced fish, and potentialeconomic impacts.
The meat-bone separation technologyprovides an opportunity for domesticutilization of some species which areoften too small to fillet (e.g., walleyepollock; silver hake, Merlucciusbilinearis; and red hake, Urophycischuss). In addition, the meat-bone separation technology enables recovery ofhigh quality fish flesh from larger fishwhose fillets have been removed in atraditional manner. These species include most Atlantic cod, Gadus morhua;large silver hake, and large walleye pollock.
Research and development has beendone on the utilization of the meat-boneseparation technology for fish (e.g.,
Richard J. Agnello is Associate Professor ofEconomics, University of Delaware, Newark,DE 19711.
21

Table 1.-Actual and potential catch of selected gadidsfrom resources within U.S. jurisdiction, with comparisons (metric tons, Iiveweight basis)l.
TALFF US11/1/80 landings
Species and Optimum to (1977-81area of catch yield 12/31/81 avg.)
PacificWalleye pollock
Eastern BeringSea & Aleutians 1.100.000 1,055,450
Gulf of Alaska 196.933 170.640------
Total 1.296,933 1,226.090 1.558
North AtlanticSilver hake 55.000 19,400 18.485Red hake 22.000 5.500 2,420Atlantic cod 45.570' 43.575
------Grand total 1,419,503 1.250,990 66.038
Torry Fish Research Station, 1976). Although technically feasible for a varietyof products including cooked sausage,little commercial application has occurred in the United States. In Japan,however, large-scale commercial use ofwalleye pollock for processi ng intosurimi (a stabilized and frozen fish pastethat is made from minced fish) has takenplace over the last 10 years.
Potential for Minced Fish
The 1981 TALFF for walleye pollock,Atlantic cod, silver hake, and red haketotaled 1.25 million metric tons (2.76billion pounds, round or liveweightbasis). The TALFF, in accordance withthe MFCMA, excludes amounts allocated for domestic fishermen, either forlanding in U.S. ports or for at-sea transfer to foreign-flag vessels for processingand transport to foreign countries. TheTALFF is consequently smaller than theoptimum yield and the maximum sustainable yield, as determined in accordwith the MFCMA. Table I presents thereal and potential catch of the selectedspecies and especially shows the lowdomestic utilization of walleye pollock.One can clearly see that the potential ofthese underutilized species is quite largerelative to all U.S. landings. In 1981, theTALFF for walleye pollock aloneamounted to 45 percent of all U. S.
Table 2.-Prices for common hotdog ingredients, 1982dollars.
of minced fish). At 5, 10, and 15 percentrates of inclusion in meat franks only(perhaps 0.9 billion pounds excludingbeef and poultry franks), use of mincedfish flesh would be 45,90, and 135 million pounds. These magnitudes represent only a fraction of the 0.8-1.4 billionpounds of minced fish potentially available.
Meat franks and weiners are the leading item in the hot dog segment of thesausage market based on special surveydata for retail sales (sales for at-homeconsumption only) conducted by theUSDA (Sun, 1982). The breakdownwas: Beef, 52 million pounds; poultry,II million pounds; and meat, 87 millionpounds (average retail sales for 2-monthperiods during June 1977-November1980). On a percentage basis, retail salesfor the frank and wei ner categories ofbeef, poultry, and meat were 34.7,7.3,and 58.0 percent, respectively.
The total market for sausage is forecast to continue growing at an annualrate of I percent through 1987. However,the weiner and frank segment may continue to decline at a rate of 0.5 percentbecause of adverse publ icity created bythe nitrite issue (American Can Co.,1982).
Prices for the various types of hotdogs and sausage ingredients vary significantly. Average retail prices in 1980were $1.84, $1.11, and $1.58 for beef,poultry, and meat hot dogs, respectively,derived from Sun (1982) and the Consumer Price Index (CPI) for food items(USDL, 1982). At the wholesale level,the most common ingredients in hotdogs vary in price from $0.25 to $0.35 apound for mechanically deboned chicken to over $1.00 per pound for lean beef.Table 2 presents the current wholesaleprice structure for common hot dog ingredients.
Costs for Fish Flesh
Current production costs for fish fleshare derived from profit and loss statements found in Combs (1979). This report presents costs for seven underutilized species including two species forconsideration in cooked sausage,namely walleye pollock and silver hake.For Atlantic cod and red hake, both Atlantic species, costs similar to those of
PriceIngredients
Chicken 2
Mechanically deboned (meal and skin) 0.25Mechanically deboned (meat only) 0.35
'Source: Natiooa! Provisioner (1982:31).2Source: Jim Bacus, Vice President. ABC Research Cor·poration. 3437 S.w. 24th Ave .. Gainesville. FL 32607Pers. commun.
Nature of theU.S. Sausage Market
The U.S. sausage market, excludingpoultry items, amounted to about 5.04billion pounds in 1981-almost twicethe size of the U.S. market for fish. Ofthis, 2.18 billion pounds were cookedsausage in the form of hot dogs, frankfurters, weiners (1.42 billion pounds),and bologna (0.76 billion pounds)(American Meat Institute, 1982).
The amount of minced fish potentiallyavailable from harvesting and processing the TALFF is quite large relativeto possible use in the production offranks and other cooked sausage products. The amount of minced fish wouldclearly be in excess of possible demandin all cooked sausage products, even inthe unlikely event that all such sausagescontained 15 percent minced fish (requiring approximately 0.33 billion pounds
Fresh pork sausage malenals I
50 percent lean trimmings 0.4380 percent lean trimmings 0.80
Fresh boneless beef'50 percent lean trimmings $0.4375 percent lean trimmings 0.6985 percent lean trimmings 1.02
landings.Assuming yields of 30-50 percent of
the liveweight of fish, one obtains a potential minced fish output of O. 8-1.4 billion pounds for the 1981 TALFF (where2,205 pounds equals I metric ton). Production of mince from larger fish nowharvested and processed into fillets byU.S. firms would be quite small bycomparison although potentially important for the firms involved. Assuming a10 percent yield for Atlantic cod withfillets removed, and using average landings of 43,575 metric tons from Table I,around 10 million pounds of Atlanticcod mince would be available.
2.711.181
995.0071.234.031
'Source: USDC (1981a).2Represents 1981 actual harvest.
Total U.S.landings
MenhadenOther tinfishAll finfish
& shellfish
22 Marine Fisheries Review

Table 3.-Production costs per pound of input for walleye pollock, 1982 dollars'.
ing operation. Thus, there are three setsof harvesting variable and total costs,depending on the assumed ex-vesselprice of fish. Fixed costs are unaffectedby ex-vessel prices.
An alternative approach is to ignoresIGpper and crew expenses and also netout skipper and crew share (i.e., 40 percent) from total catch. All cost items arethus divided by 60 percent of total catchwhich reflects the owner's share. Thesecalculations appear in parentheses inTable 3. This approach makes it unnecessary to assume a set of ex-vesselmarket prices for fish harvested.
The two approaches are equivalent inderiving total cost per unit (i.e., averagetotal cost or ATC) when the price paidthe sIGpper and crew for their share of thecatch equals the ATC of the owner'sshare. For example, in Table 3 when anex-vessel price of $0.10 per pound isassumed, the two approaches convergeand yield ATC of $0.099 and $0.098,respectively. In this case the owner isbreaking even, and it makes no appreciable difference how we proceed. However, when the ex-vessel price (P) exceeds ATC and the owner is making aprofit (e.g., when P = $0.15), ATC islower when skipper and crew are nettedout of the calculations ($0.098 <$0.119). Alternatively when the exvessel price (P) is less than ATC andthe owner is incurring a loss (e.g.,when P = $0.05), ATC is higher whenskipper and crew share are netted out($0.098 >$0.079).
Although the two approaches may not
Mode of production
deviate significantly in the cakulation ofATC, they differ greatly in their allocations between average variable and average fixed costs. When labor costs areignored and skipper and crew share isnetted out of output, average variablecost is systematically lowered and average fixed cost is increased. This changein allocation between average variablecost and average fixed cost can be important for short-run marginal decisions.Since an operator will continue operating in the short run if price covers average variable cost, anything that affectsaverage variable costs can be important.
All of this may be academic sinceTable 3 indicates that a catcher/processor mode of production results in lowercosts. For a catcher/processor operation,skipper and crew shares are less important and not isolated in the data available. Thus, the ambiguity caused by thetwo accounting allocation approaches isavoided.
In Table 4, average variable costs andaverage total costs are converted from aninput to an output basis by assumingvarious yield percentages. These calculations were performed by dividing thenumbers in Table 3 by alternative yieldpercentages. Since only average variable costs and average total costs arerelevant for short run and long run decisions respectively, average fixed costsare not reported on an output basis. Table4 indicates that average costs are extremely sensitive to yield assumptions.The range of average total cost for walleye pollock using the least cost opera-
0098
0.307
$0.209
Catcher/processor
Total
0.072(0.095)
Total
0283 0.303 0.323(0.279)
0.335 0.375 0.395(0.374)
Ex-vessel price$0.05 $0.10 $0.15
0.238
0.038
0.276
Processing
Shore processing
Harvesting
0.045 0.065 00852(0041)
0.034(0.057)
0.079 0.099 0.119(0.098)
Ex-vessel price$0.05 $0.10 $0.15
Cost type
Variable
Total
FixedJ
silver hake are assumed since no detailed cost data were available. Since allvalues in this paper are reported in 1982dollars, adjustments to the values in theCombs' report, which are in 1979 dollars, were required. The Consumer PriceIndex (USDL, 1982) for all items wasused to adjust for inflation except wheremore specialized indices were available,as in the case of fuels, shipping costs,utilities, wages for processing labor, andfood'.
For harvesting and processing walleye pollock, two scenarios are investigated: I) Harvesting with shore processing and 2) a catcher/processor vessel. Inthe first scenario, Combs assumed an85-foot trawler targeting on walleye pollock (Combs, 1979:329) and a shorefacility processing a variety of Alaskabottom fish (Combs, 1979:59). For acatcher/processor, a 250- foot vesseltargeting on walleye pollock (Combs,1979:61) is assumed. A variety of outputs from processing operations is assumed by Combs including frozen fillets, frozen fillet blocks, frozen mincedblocks, and fish meal. Also when roeladen fish are available, Combs assumesprocessors will produce this specialtyproduct. Given the available data, it isnot possible to isolate costs for eachspecies and product type. Thus walleyepollock costs represent an average ofseveral product forms. Cooked sausageproducts would utilize frozen fillets aswell as frozen blocks (fillet or mince).Input costs per pound are computed bydividing total costs (variable plus fixed)by total catch. These results appear inTable 3. The calculations are straightforward except for the fact that the skipper and crew are generally paid in sharesof catch (40 percent) rather than inwages and salaries. Thus the value of thecatch must be determined before skipperand crew expenses can be calculated.Skipper and crew expenses were computed by assuming alternative values ofwalleye pollock catches of $0.05, $0.10,and $0.15 per pound ex-vessel, liveweight basis. Labor expenses weretreated as a variable cost in the harvest-
'John Vondruska, Economist, National MarineFisheries Service, NOAA, Washington, DC20235. Pers. commun.
lOutputs from processing operations include frozen fillets and frozen blocks (fillet and mince).2Numbers in parenthesis reflect alternative approach in dealing with skipper and crew share in harvesting, and are independent of ex-vessel prices.JFixed costs do not depend on ex-vessel price assumptions.
July-Augusr-Seprember 1983, 45(7-8-9) 23

Table 4.- Production costs per pound of output for walleye pollock, 1982 dollars'.
Table 5.-Production costs per pound of input for silver hake, 1982 dollars'.
'Outpuls from processing operations include frozen fillets and frozen blocks (fillel and mince).2Numbers in parenthesIs reflect an alternative approach in dealing with skipper and crew share Inharvesting. and are independent of ex-vessel price.
Ex-vessel price Ex-vessel price$0.05 $0.10 $0.75 $0.05 $0.10 $0.75
30 Percent 0.94 1.01 1.08 1.18 1.25 1.32 $0.70 $1.02'(0.93) (1.25)
40 Percent 0.71 0.76 0.81 0.89 0.94 099 0.52 0.77(0.70) (0.94)
50 Percent 0.57 0.61 0.65 0.71 0.75 0.79 0.42 0.61(0.56) (0.75)
assumed an 85-foot otter trawler and ashore facility processing a mixture ofdefatted fillet blocks and minced blocks(Combs, 1979:206-207). Average costsper pound of input and output for silverhake are found in Tables 5 and 6 respectively. The data available do not allow usto isolate costs by product type. Thussilver hake costs reflect an average offrozen blocks (fillet and mince). Yieldassumptions again have a much largereffect on average costs than do ex-vesselprice assumptions. From Table 6 we seethat average total cost varies from a lowof $0.68 per pound of output to a high of$1.27 per pound depending on assumptions. A comparison of walleye pollockand silver hake costs for the shore-basedprocessing model reveals lower harvesting costs but higher processing costs forwalleye pollock. These offsetting factors result in very similar total (harvesting plus processing) costs for walleyepollock and silver hake. When acatcher/processor operation is used forwalleye pollock, however, average costsare lower for it than for silver hake.
Competitiveness of Minced Fish
Table 7 presents average frozen blockprices for selected species along with therange of costs for walleye pollock andsilver hake found in Tables 4 and 6.Ex-vessel prices are also included forreference. Under some assumptions, the
Catcher/processor
Variable Total
0.082(0.113)
Total
0.342 0.362 0.382(0365)
0.260 0.280 0.300(0.252)
Ex-vessel price$0.10 $0.15 $0.20
Total
0.206
0.034
$0.172
variable cost, which is relevant in theshort run, the range is $0.42 to $0.70.
Similar calculations were performedfor silver hake using Combs' data which
Production stage
Shore processing
Mode of production
Harvesting and shore processing
Variable
0.048(0.079)
Harvesting
0.088 0.108 0.128'(0.080)
0.136 0.156 0.176(0.159)
Ex-vessel price$0.70 $0.75 $0.20
Total
Fixed J
Variable
Cost type
Yield
tion (i .e., a catcher/processor) is $0.61to $1.02 per pound for an assortment ofoutput including frozen fillets and frozenblocks (fillet and mince). For average
IOutputs from processing operations include frozen blocks (fillet and mince).2Numbers in parenthesis reflect alternative approach in dealing with skipper and crew share In
harvesting, and are independent of ex-vessel price.3Fixed costs do not depend on ex-vessel price assumptions.
Table 6.-Production costs per pound of outpullor silver hake, 1982dollars'.
IOutputs from processing operations include frozen blocks (fillet andmince).2Numbers in parenthesis reflect alternative approach in dealing withskipper and crew share in harvesting. and are independent of ex-vesselprice.
30 Percent 0.87 0.93 1.00 1.14 1.21 1.27'(0.84) (1.22)
40 Percent 065 0.70 0.75 086 0.91 0.96(0.63) (0.91)
50 Percent 0.52 0.56 0.60 068 0.72 0.76(0.50) (073)
Harvesting and shore processing
Table 7.-Average prices and costs for selected speciesand form (dollars per pound)'.
Average frozen Ex-vessel Cost rangeJ
Speciesblock price2 price (1982 $)'
and form 1981 1982' 1982 High Low
Walleyepollock $0.149 $1.02 $0.61
Regular $0.805 $0.175 (0.70) (0.42)Minced 0.400 0.350
Stiver 0.743 0.603 0.202 1.27 068hake (1.00) (0.50)
All. cod 0.329Regular 1.092 1.080Minced 0511 0503
Red hake 0.169
'Source: USDC (1982b).2Block prices reflect import prices since over 99 percent ofU.S. frozen fish blocks have been imported in recent years(USDC. 1982a).3Costs for walleye pollock represent a catcher/processormode. Numbers in parentheses reflect average variablecosts only.'July
Total
Ex-vessel pnce$0.10 $0.15 $0.20
Variable
Ex-vessel price$0 70 $0.15 $0.20
Yield
24 Marine Fisheries Review
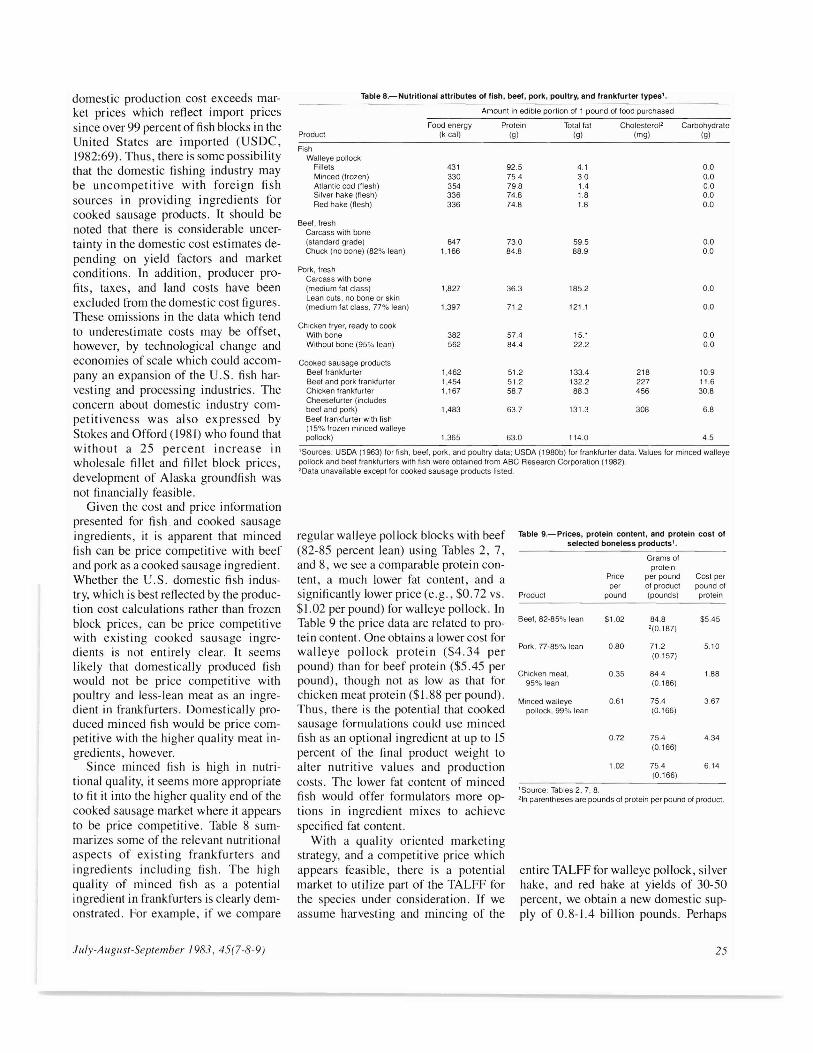
'Sources: USDA (1963) for fish. beef, pork. and pOUltry data; USDA (1980b) for frankfurter data. Values for minced walleyepollock and beef frankfurters with fish were obtained from ABC Research Corporation (1982).2Data unavailable except for cooked sausage products listed.
Table a.-Nutritional allributes offish, beef, pork, pOUltry, and frankfurter types'.
Amount in edible portion of 1 pound of food purchased
Food energy Protein Total fat Cholesterol' CarbohydrateProduct (k cal) (g) (g) (mg) (g)
FishWalleye pollock
Fillets 431 92.5 4.1 00Minced (frozen) 330 75.4 3.0 0.0Atlantic cod (flesh) 354 79.8 1.4 0.0Silver hake (flesh) 336 74.8 1.8 0.0Red hake (flesh) 336 74.8 1.8 00
Beef, freshCarcass with bone(standard grade) 847 73.0 59.5 0.0Chuck (no bone) (82% lean) 1.166 84.8 88.9 0.0
Pork, freshCarcass with bone(medium fat class) 1,827 363 185.2 00Lean cuts, no bone or skin(medium tat class. 77% lean) 1.397 71.2 121.1 00
Chicken fryer. ready to cookWith bone 382 57.4 15.1 0.0Without bone (95% lean) 562 84.4 22.2 00
Cooked sausage productsBeef frankfurter 1,462 51.2 133.4 218 10.9Beef and pork frankfurter 1,454 51.2 132.2 227 11.6Chicken frankfurter 1,167 58.7 883 456 308Cheesefurter (includesbeef and pork) 1,483 63.7 131.3 308 6.8Beef frankfurter with fish(15% frozen minced walleyepollock) 1,365 63.0 114.0 4.5
domestic production cost exceeds market prices which reflect import pricessince over 99 percent offish blocks in theUnited States are imported (USDC,1982:69). Thus, there is some possibilitythat the domestic fishing industry maybe uncompetitive with foreign fishsources in providi ng ingredients forcooked sausage products. It should benoted that there is considerable uncertainty in the domestic cost estimates depending on yield factors and marketconditions. In addition, producer profits, taxes, and land costs have beenexcluded from the domestic cost figures.These omissions in the data which tendto underestimate costs may be offset,however, by technological change andeconomies of scale which could accompany an expansion of the U. S. fish harvesting and processing industries. Theconcern about domestic industry competitiveness was also expressed byStokes and Offord (1981) who found thatwithout a 25 percent increase inwholesale fillet and fillet block prices,development of Alaska groundfish wasnot financially feasible.
Given the cost and price informationpresented for fish and cooked sausageingredients, it is apparent that mincedfish can be price competitive with beefand pork as a cooked sausage ingredient.Whether the U.S. domestic fish industry, which is best reflected by the production cost calculations rather than frozenblock prices, can be price competitivewith existing cooked sausage ingredients is not entirely clear. It seemslikely that domestically produced fishwould not be price competitive withpoultry and less-lean meat as an ingredient in frankfurters. Domestically produced minced fish would be price competitive with the higher quality meat ingredients, however.
Since minced fish is high in nutritional quality, it seems more appropriateto fit it into the higher quality end of thecooked sausage market where it appearsto be price competitive. Table 8 summarizes some of the relevant nutritionalaspects of existing frankfurters andingredients including fish. The highquality of minced fish as a potentialingredient in frankfurters is clearly demonstrated. For example, if we compare
July-August-September 1983, 45(7-8-9)
regular walleye pollock blocks with beef(82-85 percent lean) using Tables 2, 7,and 8, we see a comparable protein content, a much lower fat content, and asignificantly lower price (e.g., $0.72 vs.$1.02 per pound) for walleye pollock. InTable 9 the price data are related to protein content. One obtains a lower cost forwalleye pollock protein ($4.34 perpound) than for beef protein ($5.45 perpound), though not as low as that forchicken meat protein ($1.88 per pound).Thus, there is the potential that cookedsausage formulations could use mincedfish as an optional ingredient at up to 15percent of the final product weight toalter nutritive values and productioncosts. The lower fat content of mincedfish would offer formulators more options in ingredient mixes to achievespecified fat content.
With a quality oriented marketingstrategy, and a competitive price whichappears feasible, there is a potentialmarket to utilize part of the TALFF forthe species under consideration. If weassume harvesting and mincing of the
Table 9.-Prices, protein content, and protein cost ofselected boneless products',
Grams ofprotein
Price per pound Cost perper of product pound of
Product pound (pounds) protein
Beef, 82-85% lean $1.02 84.8 $5.45'(0.187)
Pork, 77-85% lean 080 71.2 5.10(0.157)
Chicken meat. 0.35 84.4 1.8895% lean (0.186)
Minced walleye 0.61 75.4 3.67pollock, 99% lean (0.166)
0.72 75.4 4.34(0.166)
1.02 75.4 6.14(0.166)
'Source: Tables 2,7,8.21n parentheses are pounds of protein per pound of product.
entire TALFF for walleye pollock, silverhake, and red hake at yields of 30-50percent, we obtain a new domestic supply of 0.8-1.4 billion pounds. Perhaps
25

U .S. cooked sausage products might absorb 0.1 billion pounds or approximately10 percent of the TALFF
Impacts of Minced Fish
Including up to 15 percent minced fishin cooked sausage products will likelyhave a small impact on both the U.S.cooked sausage market and domesticfisheries. Some impacts will be felt butwe can only speculate as to what theymight be. In the analysis by Combs(\979:63-70), it was estimated that after10 years around 14,000 jobs and annualwages of around $250 mill ion (1979 dollars) would be created if the entireTALFF of walleye pollock were absorbed by the domestic harvesting andprocessing industries. Inclusion of up to15 percent minced fish meat in cookedsausage products, by absorbing 10 percent of the TALFF, might thus create onthe order of 1,400 jobs in the fish harvesting and processing sectors. If thedomestic industry were not price competitive, the job creation potential woulddiminish.
The impact on employment in theU.S. agriculture sector is difficult to determine since it is unclear whetherminced fish would complement or substitute for existing ingredients. If consumers responded favorably to thehigher protein and lower fat opportunities afforded by minced fish, an expansion of the cooked sausage marketwould result. In this case, both the fishing and agriculture sectors wouldbenefit.
To the extent that the cooked sausagemarket would not expand with theminced fish option, minced fish woulddisplace some pork, beef, and poultry.The net employment impact, if the U.S.fishing industry were to supply most ofthe minced fish for cooked sausage,would probably be positive. This conclusion is based on a higher labor intensity in the U.S. fishing sector than U.S.agriculture. Although the evidence isscanty, from Combs (1979) we can com-
26
pute labor's share of total cost in severalfishing operations. For walleye pollock(shore processing and a catcher/processor) and silver hake (shore processing only), we compute direct laborcost shares of 0.285,0.274, and 0.402,respectively (Combs, 1979:59,61,207).These labor shares in fishing operationsare higher than 0.20 which is labor'sshare in all agriculture derived from arough calculation performed for theUnited States in 1979 (USDA,1980a:431, 464). Labor's share in agriculture was derived by dividing totalexpenses in agriculture (including animputed payment for family workersbased on a wage equal to that of hiredworkers) by the sum of payments tohired workers and imputed payments tofamily workers. Since the assumptionsof no market expansion for cooked sausage and no foreign involvement in supplying minced fish are not likely to beaccurate, the impact on U.S. agricultureis very difficult to determine. It's probably safe to say, however, that the impactson agriculture (positive or negative) willbe small.
Conclusion
It appears that allowing the use ofminced fish in cooked sausage productshas potential from an economic point ofview. Although modest in size, a marketin which minced fish can successfullycompete with existing cooked sausageingredients seems to exist. Benefits fromsuch a proposal would accrue to the U.S.fishing industry as well as the cookedsausage industry. The former would beprovided with the opportunity for wideruse of underutilized species through expanded markets while the latter wouldbenefit from more flexibility with respect to cost and nutritional formulations for cooked sausage. If foreign vessels supplied most of the minced fish forcooked sausage, benefits would still accrue to the United States through an increase in value of stocks and opportunities for increases in foreign fees.
Negative impacts on traditionalsuppliers of cooked sausage ingredientsappear small.
Acknowledgments
Funding for this study was providedby Contract 4IUSC252(C)(3) from theNational Marine Fisheries Service(NMFS). The author wishes to thankproject monitor John Vondruska for providing data and able assistance along theway. Views expressed are those of theauthor and do not necessarily representpositions of NMFS or NOAA.
Literature CitedABC Research Corporation. 1982. Research re
port #2. ABC Res. Corp., Gainesville, Fla.American Can Company. 1982. The meat out
look. Amer. Can Co., Greenwich, Conn.,55 p.
American Meat Institute. 1982. Meat facts: 1982edition. Am. Meat Inst., Wash., D.C., 36 p.
Combs, E. R., Inc. 1978. A study to determinethe export and domestic markets for currentlyunderutilized fish and shellfish. U.S. Dep.Commer., NOAA, Natl. Mar. Fish. ServoContract MO-AOI-78-00-4037, 416 p.
1979. Prospectus for developmentof the United States fisheries. U.S. Dep.Commer. ,NOAA, Fish. Dev. Task Force, 442p.
Meuriot, E., and J. Gates. 1982. An economicvaluation of foreign fishing allocations. Univ.R. I. Mar. Tech. Rep. 85,40 p.
National Provisioner. 1982. Daily market service, 11 Dec.
Stokes, R. L., and B. H. Offord. 1981. Alaskagroundfish: A financial feasibility analysis:Ocean Dev. IntI. Law. JI. 9(1-2):61-76.
Sun, T. Y. 1982. Demand and price analysis forfrankfurters. U.S. Dep. Agric., Natl. Econ.Div., ERS Staff Rep. AGES820804, Wash.,D.C.
Torry Fish Research Station. 1976. The production and utilization of mechanically recovered fish flesh. ConI. Proc., Minist. Agric.,Fish. Food, Aberdeen, Scotl.
USDA. 1963. Composition of foods. U.S. Dep.Agric., Agric. Handb. 8.
1980a. Agricultural statistics,1980. U.S. Dep. Agric., Wash., D.C., 603 p.
____ . 1980b. Composition of foods. U.S.Dep. Agric., Agric. Handb. 8-7.
USDC. 1982a. Fisheries of the United States,1981. U.S. Dep. Commer., NOAA, Natl.Mar. Fish. Serv., Curr. Fish. Stat. 8200. 131p.
1982b. Food fish market review.U.S. Dep. Commer., NOAA, Natl. Mar.Fish. Serv., Curr. Econ. Anal. F-33, 47 p.
USDL. 1982. Consumer price indices. U.SDep. Labor, Bur. Labor Stat.
Marine Fisheries Review