Economic Outlook & SME Focus Through Big Data - … · Economic Outlook & SME Focus Through Big...
22
Economic Outlook & SME Focus Through Big Data Prepared by: TMB Analytics Date: 31 May 2017
Transcript of Economic Outlook & SME Focus Through Big Data - … · Economic Outlook & SME Focus Through Big...
Economic Outlook &
SME Focus Through Big Data
Prepared by: TMB Analytics
Date: 31 May 2017
-2-
Global Economy 01
Global Economy
Interest Rate Outlook
FX Trend

3
GDP growth
Inflation rate
Unemployment rate
GDP growth
Inflation rate
Data source : Minute of FOMC March 14-15 ,2017 ; Bank of Thailand, CEIC, and TMB Analytics, as of May 2017
2.0%
2.0%
4.5%
Fed’s Projection
GDP on growth
momentum.
(1.8% long run growth)
Inflation reaches
Fed’s target at 2%.
Unemployment rate
continues to drop.
(4.8% long run
unemployment rate)
3.3%
Key Factors for Policy Rate Direction
3.7%
1.7% 2.2%
TMBA’s Projection
2017 2018-19
GDP gains momentum in 2018-2019, triggering inflationary pressure.
Strong demand recovery in 2018
Key Factors for Policy Rate Direction
2018-2019
4.5%
2.0%
2.1%
2017
Brighter Economic Outlook Leads to Hawkish Policies
-3-
4
1.4
2.1
2.9 3 3
3 3
1.5 2
2.25 2.5
2.75
3 3.25 3.25
0
1
2
3
4
5
6
2004 2006 2008 2010 2012 2014 16 17 18 19 20 21 22 23 24
0.1 -0.1
-0.7
-0.5 -0.3
0.0 0.3 0.3
-1.5
-0.5
0.5
1.5
2.5
3.5
2004 2006 2008 2010 2012 2014 16 17 18 19 20 21 22 23 24
Data source : Minute of FOMC March 14-15 ,2017 ; Bank of Thailand, TMB Analytics, as of May2017
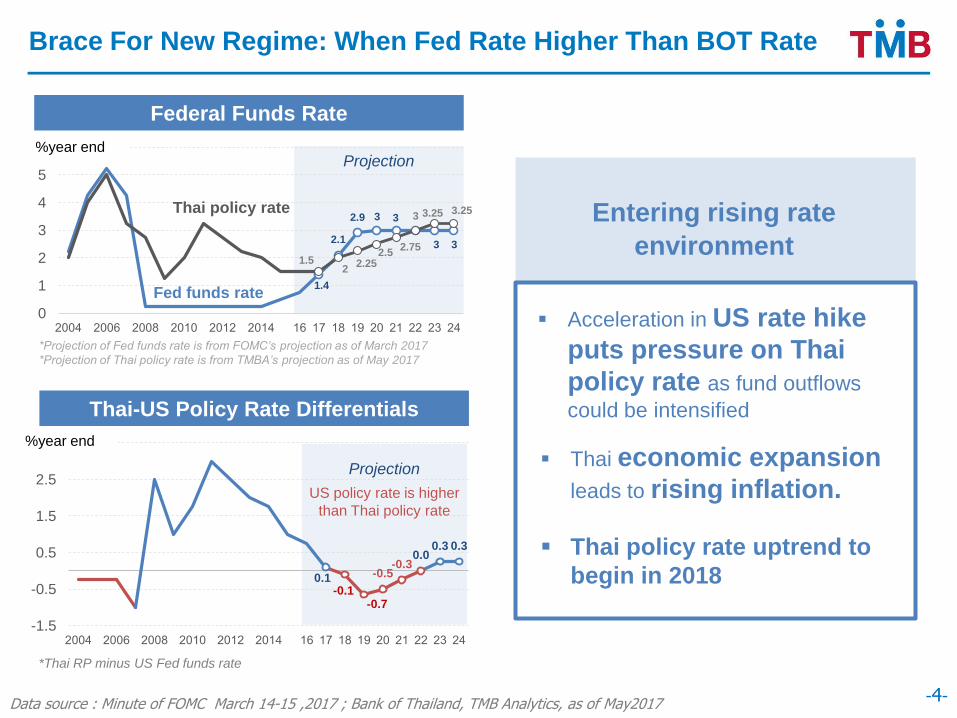
Federal Funds Rate
Entering rising rate
environment
*Projection of Fed funds rate is from FOMC’s projection as of March 2017
*Projection of Thai policy rate is from TMBA’s projection as of May 2017
Projection %year end
%year end
Thai-US Policy Rate Differentials
Projection
*Thai RP minus US Fed funds rate
Thai economic expansion
leads to rising inflation.
Acceleration in US rate hike
puts pressure on Thai
policy rate as fund outflows
could be intensified
Thai policy rate
Fed funds rate
US policy rate is higher
than Thai policy rate
Thai policy rate uptrend to
begin in 2018
Brace For New Regime: When Fed Rate Higher Than BOT Rate
-4-
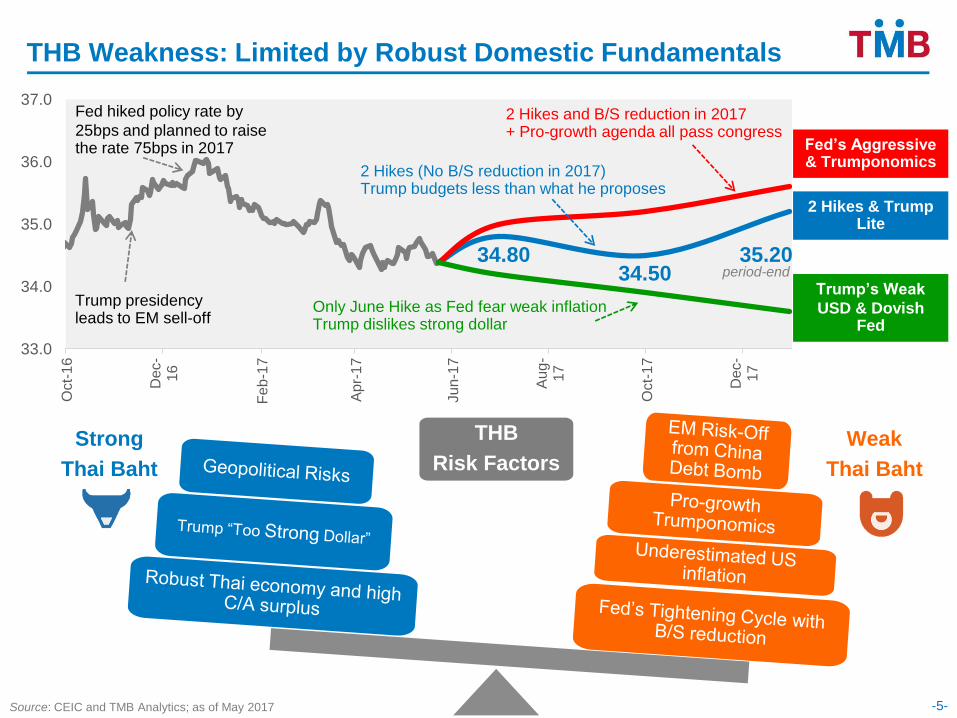
THB Weakness: Limited by Robust Domestic Fundamentals
Source: CEIC and TMB Analytics; as of May 2017 -5-
33.0
34.0
35.0
36.0
37.0
Oct-
16
De
c-
16
Feb-1
7
Ap
r-17
Ju
n-1
7
Au
g-
17
Oct-
17
De
c-
17
Trump presidency leads to EM sell-off
2 Hikes & Trump Lite
34.80 35.20
Fed hiked policy rate by
25bps and planned to raise the rate 75bps in 2017
period-end
Fed’s Aggressive & Trumponomics
Strong
Thai Baht
Weak
Thai Baht
THB
Risk Factors
Trump’s Weak
USD & Dovish Fed
2 Hikes and B/S reduction in 2017 + Pro-growth agenda all pass congress
34.50
2 Hikes (No B/S reduction in 2017) Trump budgets less than what he proposes
Only June Hike as Fed fear weak inflation Trump dislikes strong dollar
-6-
Domestic Economy 02
Growth Engines
2017 Export Trend
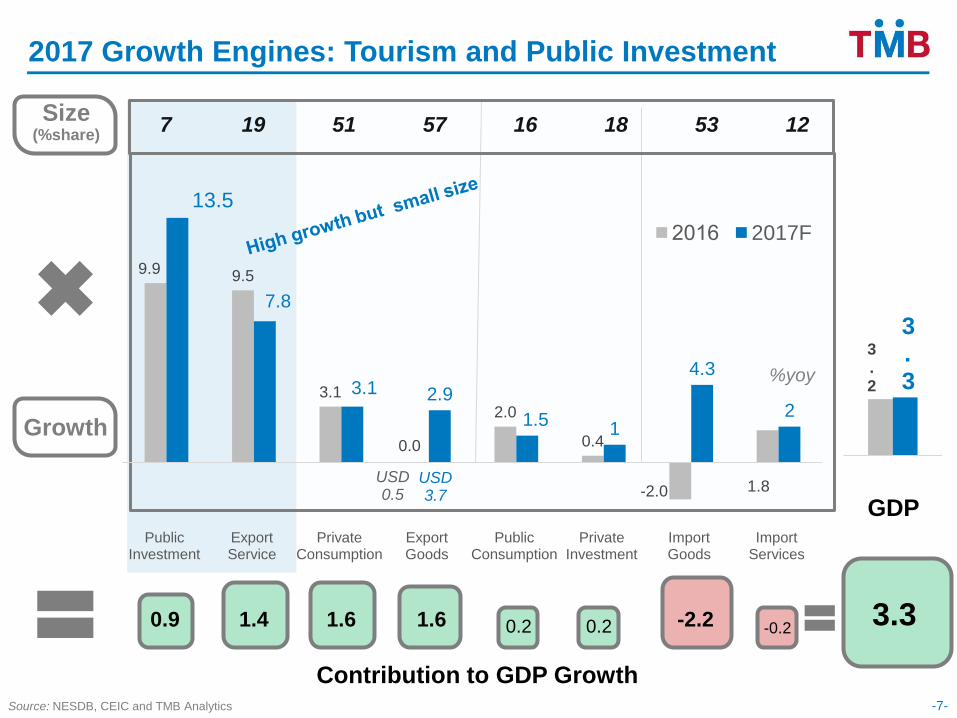
9.9 9.5
3.1
0.0
2.0
0.4
-2.0 1.8
13.5
7.8
3.1 2.9
1.5 1
4.3
2
Public Investment
Export Service
Private Consumption
Export Goods
Public Consumption
Private Investment
Import Goods
Import Services
2016 2017F
2017 Growth Engines: Tourism and Public Investment
Source: NESDB, CEIC and TMB Analytics -7-
USD 0.5
USD 3.7
%yoy
Contribution to GDP Growth
7 19 51 57 16 18 53 12 Size (%share)
Growth
0.9 1.4 1.6 1.6 0.2 0.2 -2.2 -0.2 3.3
3.2
3.3
GDP GDP
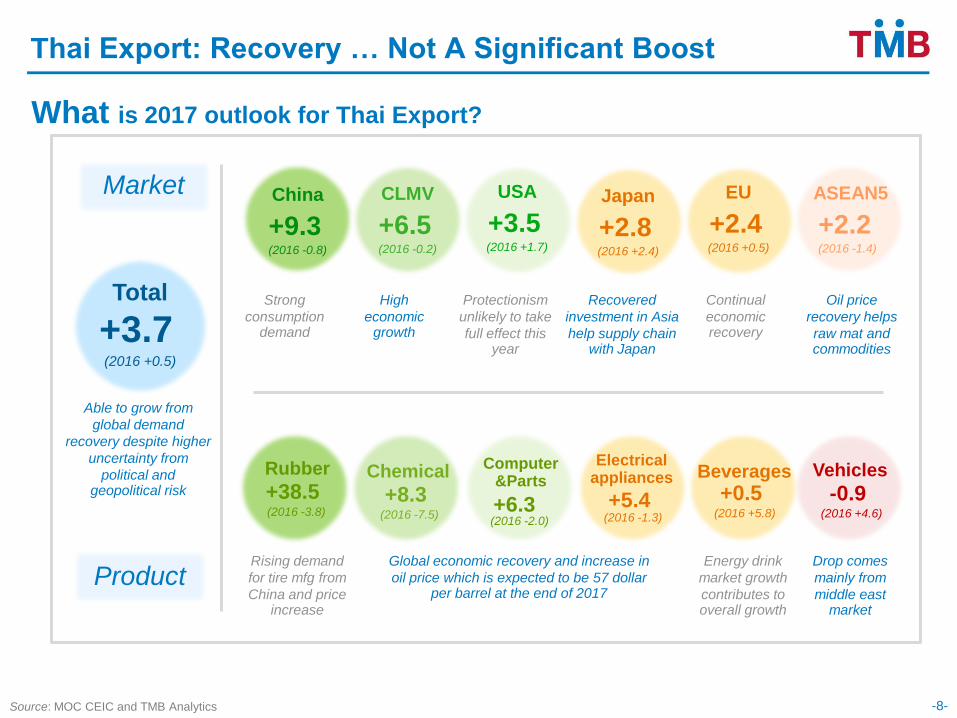
CLMV
(2016 -0.2)
+6.5
Rubber +38.5 (2016 -3.8)
-8- Source: MOC CEIC and TMB Analytics
What is 2017 outlook for Thai Export?
Total
(2016 +0.5)
+3.7
ASEAN5
(2016 -1.4)
+2.2 Japan
(2016 +2.4)
+2.8 China
(2016 -0.8)
+9.3 USA
(2016 +1.7)
+3.5 EU
(2016 +0.5)
+2.4
Able to grow from
global demand
recovery despite higher
uncertainty from
political and geopolitical risk
Strong
consumption demand
Oil price
recovery helps
raw mat and commodities
Recovered
investment in Asia
help supply chain with Japan
Continual
economic recovery
Protectionism
unlikely to take
full effect this year
Thai Export: Recovery … Not A Significant Boost
Computer &Parts
+6.3 (2016 -2.0)
Beverages +0.5
(2016 +5.8)
Electrical appliances
+5.4 (2016 -1.3)
Rising demand
for tire mfg from
China and price increase
Drop comes
mainly from
middle east market
Global economic recovery and increase in
oil price which is expected to be 57 dollar per barrel at the end of 2017
Energy drink
market growth
contributes to overall growth
Market
Product
High
economic growth
Vehicles -0.9
(2016 +4.6)
Chemical +8.3
(2016 -7.5)
90
100
110
14Q1 14Q3 15Q1 15Q3 16Q1 16Q3 17Q1 17Q3
Source: BOT, CEIC and TMB Analytics
70
75
80
2015 2016 2017
-9-
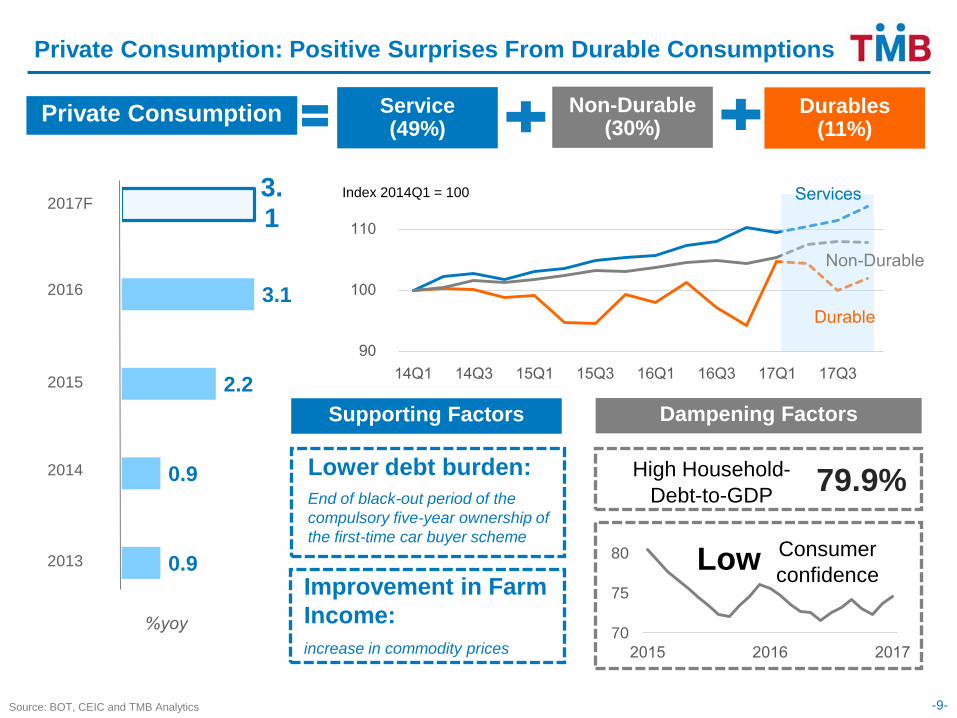
0.9
0.9
2.2
3.1
3.1
2017F
2016
2015
2014
2013
%yoy
Private Consumption
Lower debt burden:
End of black-out period of the
compulsory five-year ownership of
the first-time car buyer scheme
Improvement in Farm
Income:
increase in commodity prices
High Household-
Debt-to-GDP
Consumer
confidence
Supporting Factors
Index 2014Q1 = 100
Dampening Factors
Service (49%)
Non-Durable (30%)
Durables (11%)
79.9%
Durable
Non-Durable
Services
Private Consumption: Positive Surprises From Durable Consumptions
Low
Index 2014Q1 = 100
Source: NESDB, BOT, CEIC and TMB Analytics
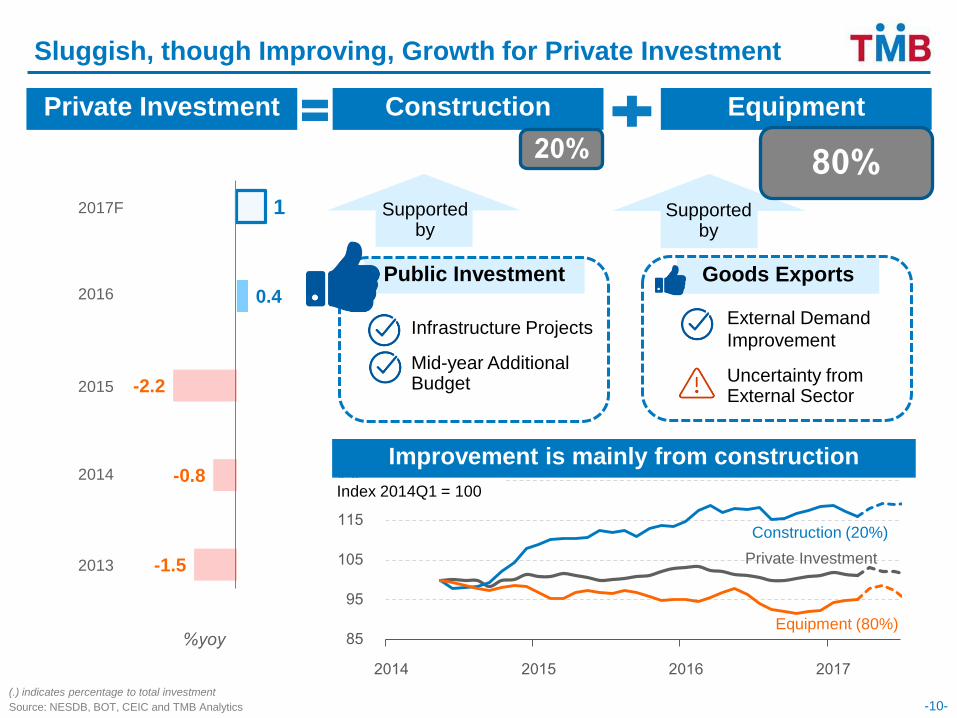
Private Investment
(.) indicates percentage to total investment
-10-
Construction Equipment
20% 80%
Public Investment Goods Exports
Supported by
Infrastructure Projects
Mid-year Additional Budget
External Demand
Improvement
Uncertainty from External Sector
-1.5
-0.8
-2.2
0.4
1 2017F
2016
2015
2014
2013
%yoy 85
95
105
115
125
2014 2015 2016 2017
Private Investment
Construction (20%)
Equipment (80%)
Supported by
Index 2014Q1 = 100
Sluggish, though Improving, Growth for Private Investment
Improvement is mainly from construction

-11-
SME Focus Through
Big Data 03
Regional
Businesses
SME
Landscape
Future SME
Businesses
-12-
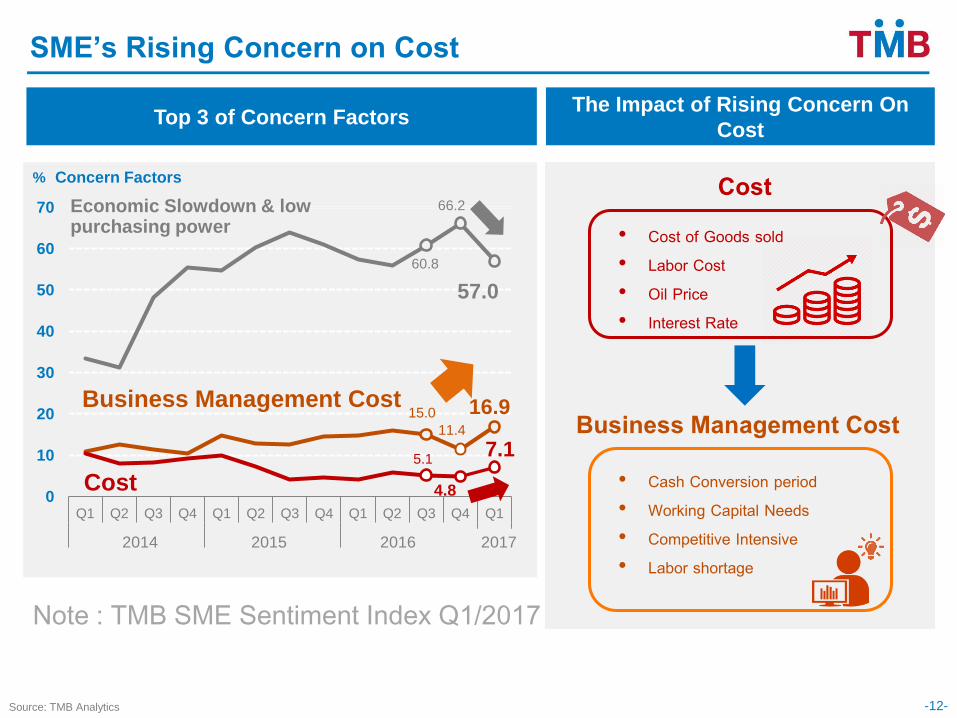
60.8
66.2
57.0
15.0
11.4
16.9
5.1
4.8
7.1
0
10
20
30
40
50
60
70
Q1 Q2 Q3 Q4 Q1 Q2 Q3 Q4 Q1 Q2 Q3 Q4 Q1
2557 2558 2559 2560
% Concern Factors
2014 2015 2016 2017
SME’s Rising Concern on Cost
Top 3 of Concern Factors
Economic Slowdown & low purchasing power
Business Management Cost
Cost
• Cost of Goods sold • Labor Cost • Oil Price • Interest Rate
• Cash Conversion period • Working Capital Needs • Competitive Intensive • Labor shortage
Cost
The Impact of Rising Concern On
Cost
Business Management Cost
Note : TMB SME Sentiment Index Q1/2017
Source: TMB Analytics

-13-
Landscape of Thai SME: Glimpse Into Firm Level Characters
95
90
85
80
75
70
65
60
55
50
45
40
35
30
25
20
15
10
5
0
-5
-10
-15
-20
-25
-30
-35
-40
-45
-50
-55
-60
-65
-70
-75
-80
-85
-90
-95
-4.75
-4.50
-4.25
-4.00
-3.75
-3.50
-3.25
-3.00
-2.75
-2.50
-2.25
-2.00
-1.75
-1.50
-1.25
-1.00
0.00
0.25
0.50
0.75
1.00
1.25
1.50
1.75
2.00
2.25
2.50
2.75
3.00
3.25
3.50
3.75
4.00
4.25
4.50
4.75
Ne
t P
rofi
t M
arg
in (
%)
DE Ratio
0
30
60
90
120
150
0 0.5 1 1.5 2 2.5 3 Net P
rofit M
arg
in (
%)
Debt To Equity Ratio
Manufacturing
0
30
60
90
120
150
0 0.5 1 1.5 2 2.5 3
Net
Pro
fit
Mar
gin
(%
)
Debt To Equity Ratio
Services
0
30
60
90
120
150
0 0.5 1 1.5 2 2.5 3
Net
Pro
fit
Mar
gin
(%
)
Debt To Equity Ratio
Trade
Juristic SMEs: 350K+ firms
9,500 firms
1,500 firms
17,000 firms
Cream SMEs:
28K firms
(8%)
Only 8% of SMEs Are Cream Services Have Higher Net Profit Margin
Source : DSS and TMB Analytics
-14-
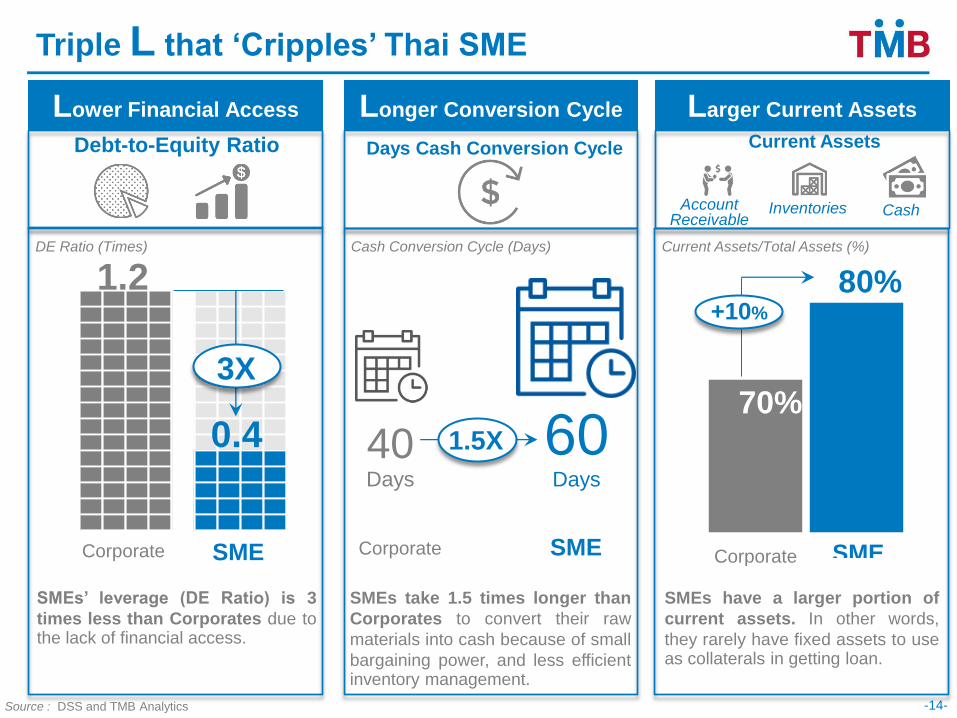
Triple L that ‘Cripples’ Thai SME
Lower Financial Access Longer Conversion Cycle Larger Current Assets
SMEs’ leverage (DE Ratio) is 3
times less than Corporates due to the lack of financial access.
Account Receivable
Inventories Cash
70%
80%
Corporate SME SME
+10%
1.2
0.4
3X
Corporate SME
SMEs take 1.5 times longer than
Corporates to convert their raw
materials into cash because of small
bargaining power, and less efficient inventory management.
Corporate SME
60 Days
40 Days
DE Ratio (Times) Current Assets/Total Assets (%)
Debt-to-Equity Ratio Days Cash Conversion Cycle
SMEs have a larger portion of
current assets. In other words,
they rarely have fixed assets to use as collaterals in getting loan.
Cash Conversion Cycle (Days)
1.5X
Source : DSS and TMB Analytics
Current Assets
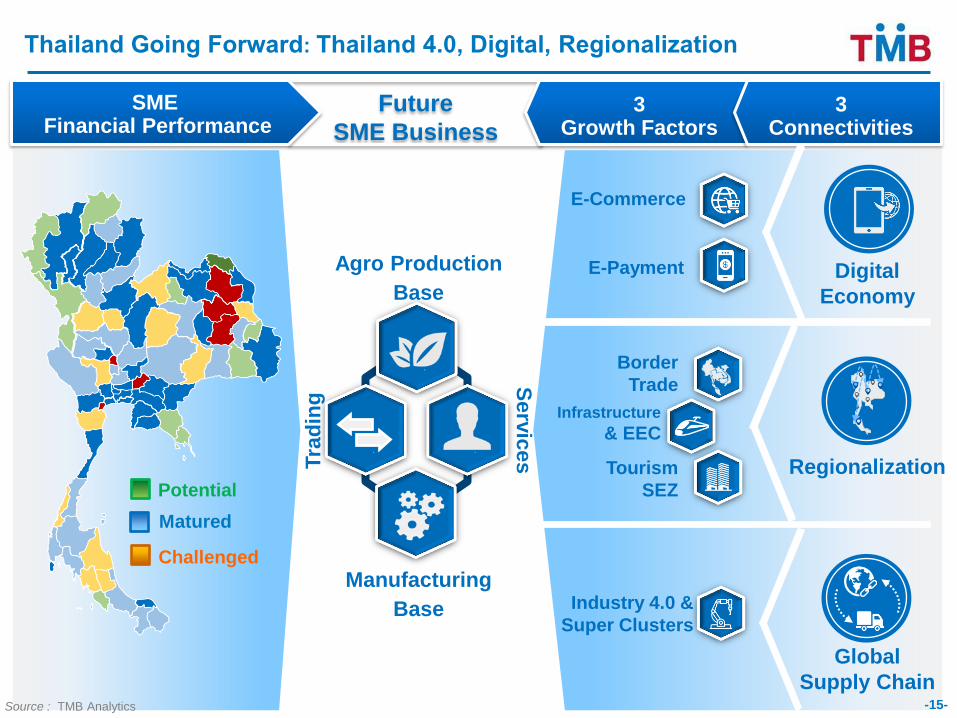
Future
SME Business
Thailand Going Forward: Thailand 4.0, Digital, Regionalization
Source : TMB Analytics
Industry 4.0 &
Super Clusters
Infrastructure
& EEC
Border
Trade
Tourism
SEZ
E-Commerce
Global
Supply Chain
Regionalization
3 Growth Factors
E-Payment Digital
Economy
SME Financial Performance
Potential
Matured
Challenged
3 Connectivities
Agro Production
Base
Manufacturing
Base
Serv
ices
Tra
din
g
-15-
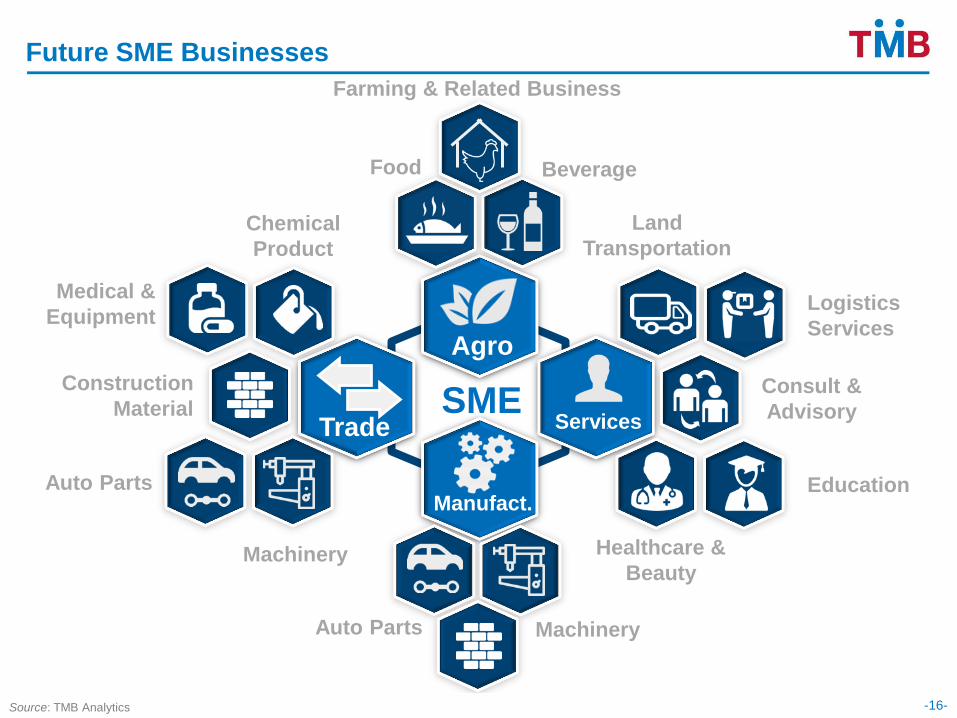
SME
Auto Parts Machinery
Construction Material
Food
Farming & Related Business
Beverage
Land
Transportation
Logistics
Services
Consult &
Advisory
Healthcare &
Beauty
Education Auto Parts
Machinery
Construction
Material
Medical &
Equipment
Chemical
Product
Future SME Businesses
Trade
Agro
Services
Manufact.
Source: TMB Analytics -16-
THANK YOU
Disclaimer
This document is issued by TMB Analytics, a division of TMB Bank PCL. All analyses are based on information available to
the public. Although the information contained herein is believed to be gathered from reliable sources, TMB makes no
guarantee to its accuracy and completeness. TMB may have issued, and may in the future issue, other reports that are
inconsistent with, and reach different conclusions from, the information presented in this report. Opinions or predictions
expressed herein reflect the authors’ views, not that of TMB, as of date of the analysis and are subject to change without
notice. TMB shall not be responsible for the use of contents and its implication.
-18-
United States Eurozone
Source: Bloomberg, and TMB Analytics’ projection
Japan China
2016
1.6%
2017
2.3%
GDP growth
2016
2.0%
2017
2.0%
2016
1.0%
2017
1.2%
2016
6.7%
2017
6.6%
GDP growth
GDP growth
GDP growth
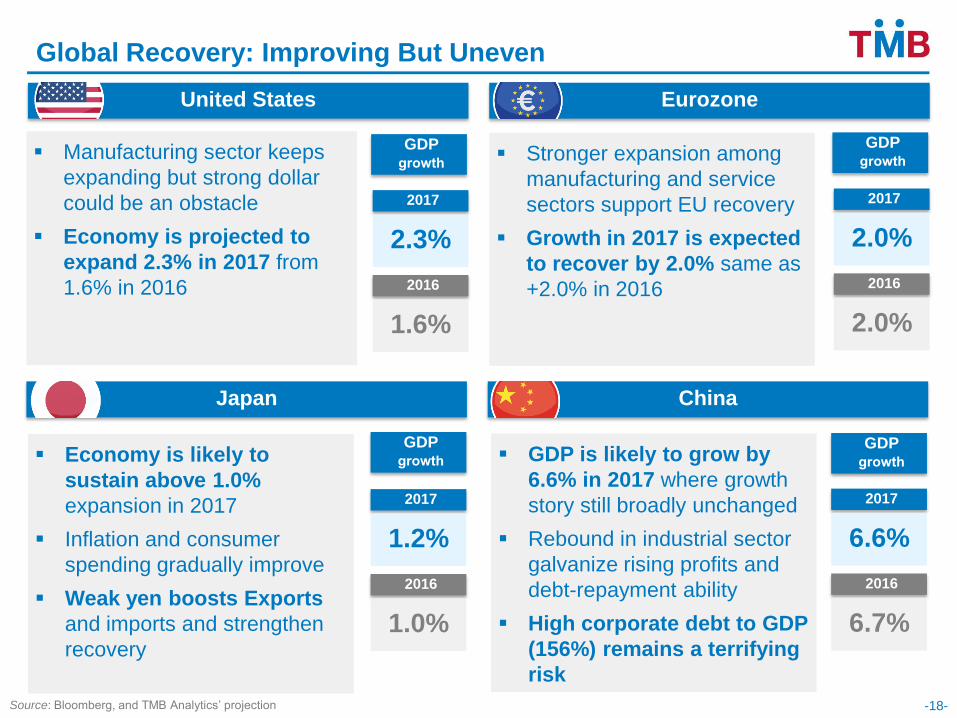
Manufacturing sector keeps
expanding but strong dollar
could be an obstacle
Economy is projected to
expand 2.3% in 2017 from
1.6% in 2016
Global Recovery: Improving But Uneven
Stronger expansion among
manufacturing and service
sectors support EU recovery
Growth in 2017 is expected
to recover by 2.0% same as
+2.0% in 2016
GDP is likely to grow by
6.6% in 2017 where growth
story still broadly unchanged
Rebound in industrial sector
galvanize rising profits and
debt-repayment ability
High corporate debt to GDP
(156%) remains a terrifying
risk
Economy is likely to
sustain above 1.0%
expansion in 2017
Inflation and consumer
spending gradually improve
Weak yen boosts Exports
and imports and strengthen
recovery
80
90
100
110
120
130
Jan-16 Jul-16 Jan-17
Number of Foreign Tourists and Revenue
1.7 1.8
32.6 35
-5
5
15
25
35
0.0
0.5
1.0
1.5
2.0
2013 2014 2015 2016E 2017F
Source: Department of Tourism and TMB Analytics -19-
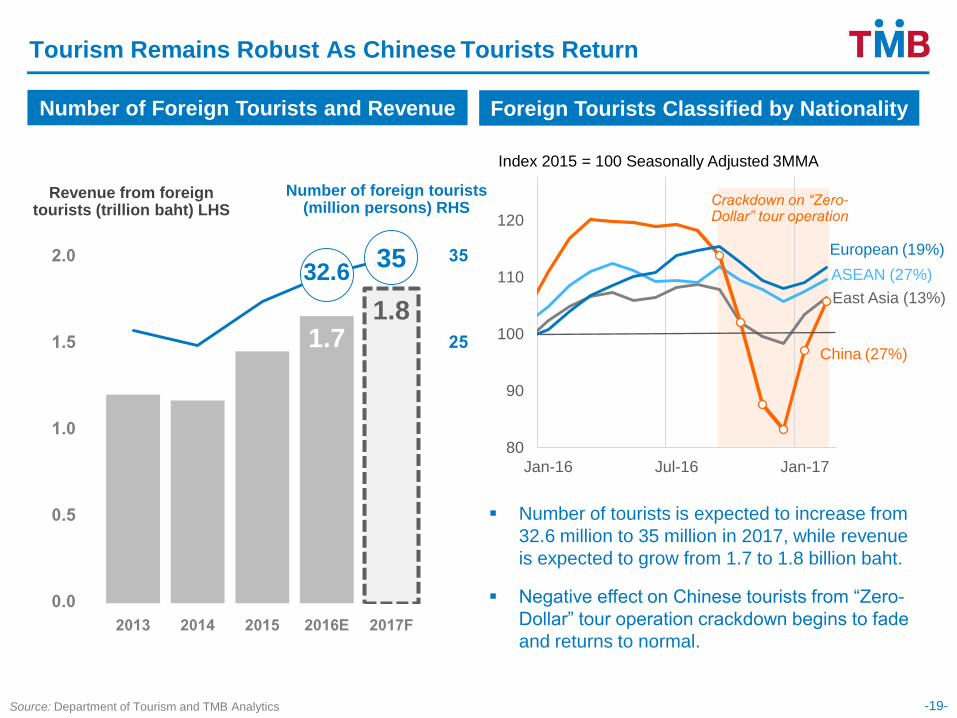
Tourism Remains Robust As Chinese Tourists Return
Number of foreign tourists (million persons) RHS
Revenue from foreign tourists (trillion baht) LHS
Foreign Tourists Classified by Nationality
Number of tourists is expected to increase from
32.6 million to 35 million in 2017, while revenue
is expected to grow from 1.7 to 1.8 billion baht.
Negative effect on Chinese tourists from “Zero-
Dollar” tour operation crackdown begins to fade
and returns to normal.
Index 2015 = 100 Seasonally Adjusted 3MMA
East Asia (13%)
China (27%)
European (19%)
ASEAN (27%)
Crackdown on “Zero-Dollar” tour operation
-20-
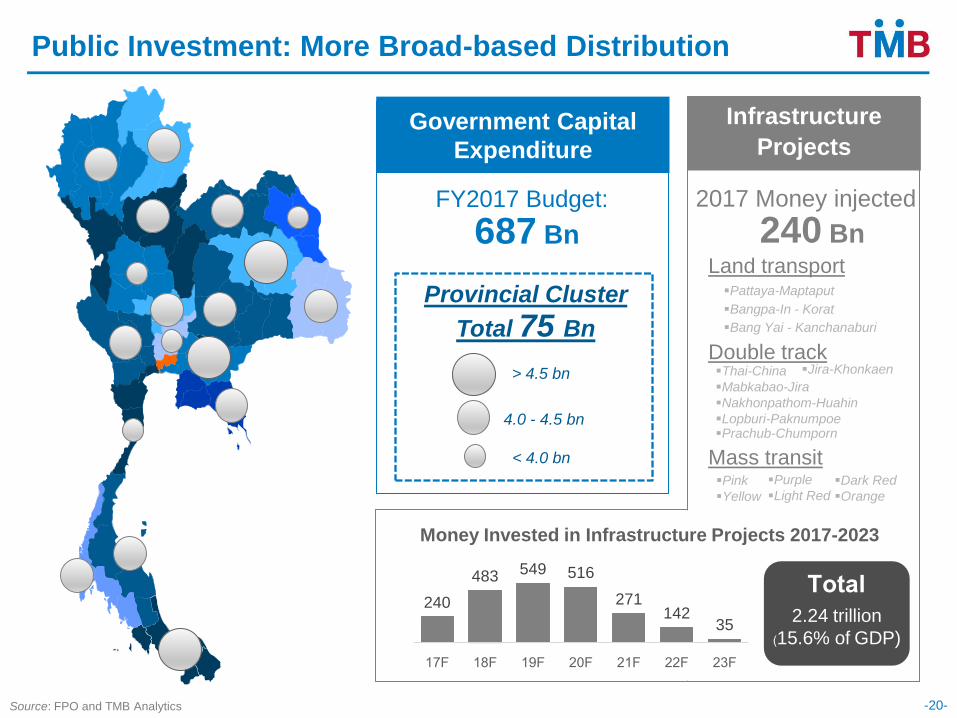
Infrastructure Projects
Government Capital
Expenditure
2017 Money injected FY2017 Budget:
Provincial Cluster
Total 75 Bn
Source: FPO and TMB Analytics
> 4.5 bn
4.0 - 4.5 bn
< 4.0 bn
687 Bn 240 Bn
Money Invested in Infrastructure Projects 2017-2023
Land transport
Double track
Mass transit
240
483 549 516
271 142
35
17F 18F 19F 20F 21F 22F 23F
Total 2.24 trillion
(15.6% of GDP)
Pattaya-Maptaput
Bangpa-In - Korat
Bang Yai - Kanchanaburi
Thai-China
Mabkabao-Jira
Nakhonpathom-Huahin
Lopburi-Paknumpoe Prachub-Chumporn
Jira-Khonkaen
Pink
Yellow
Dark Red
Orange
Purple
Light Red
Public Investment: More Broad-based Distribution
Classification: Confidential (C-3) -21-
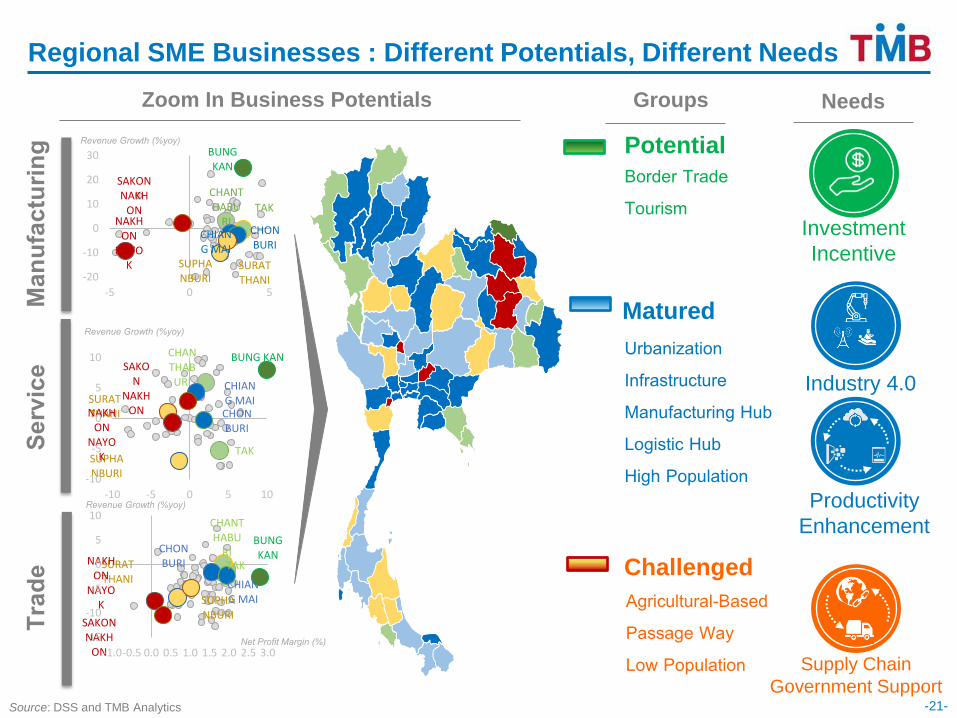
BUNG KAN
CHANTHABU
RI TAK
CHIANG MAI
CHON BURI
SUPHANBURI
SURAT THANI
NAKHON
NAYOK
SAKON NAKH
ON
-20
-10
0
10
20
30
-5 0 5 Manu
fact
urin
g Se
rvice
Tr
ade
BUNG KAN CHANTHABURI
TAK
CHIANG MAI CHON BURI
SUPHANBURI
SURAT THANI NAKHON
NAYOK
SAKON
NAKHON
-10
-5
0
5
10
-10 -5 0 5 10
BUNG KAN
CHANTHABU
RI TAK
CHIANG MAI
CHON BURI
SUPHANBURI
SURAT THANI
NAKHON
NAYOK
SAKON NAKH
ON -15
-10
-5
0
5
10
-1.0 -0.5 0.0 0.5 1.0 1.5 2.0 2.5 3.0
Revenue Growth (%yoy)
Revenue Growth (%yoy)
Revenue Growth (%yoy)
Net Profit Margin (%)
Potential Border Trade Tourism
Matured
Urbanization Infrastructure Manufacturing Hub Logistic Hub High Population
Challenged Agricultural-Based Passage Way Low Population Supply Chain
Government Support
Investment
Incentive
Industry 4.0
Groups Needs
Productivity
Enhancement
Regional SME Businesses : Different Potentials, Different Needs
Zoom In Business Potentials
Source: DSS and TMB Analytics
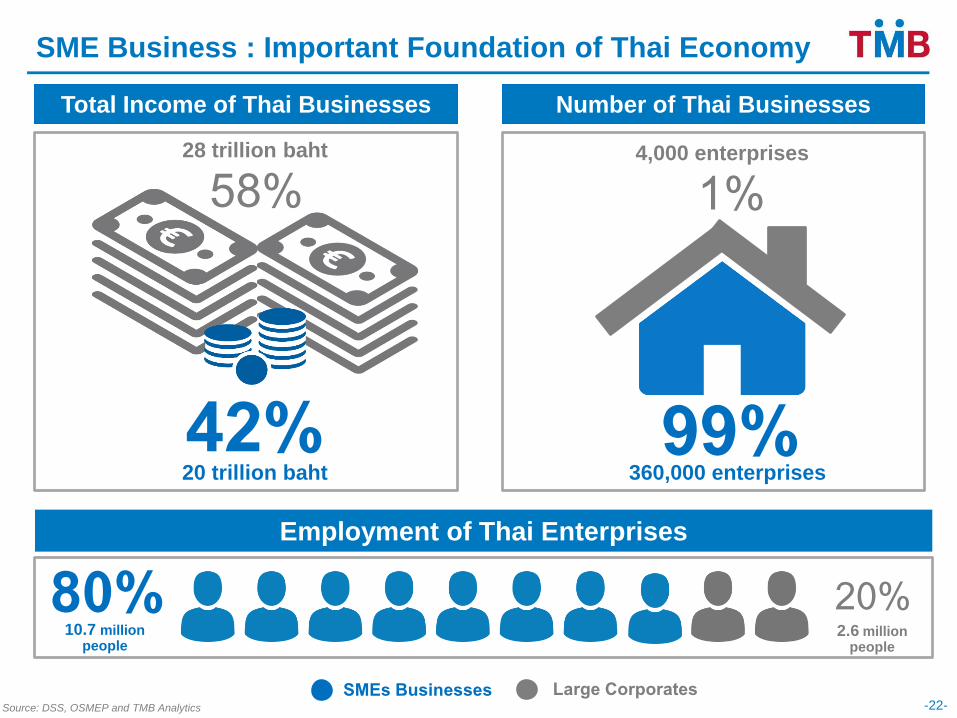
Source: DSS, OSMEP and TMB Analytics -22-
Total Income of Thai Businesses
58% 28 trillion baht
42% 20 trillion baht
80% Employment of Thai Enterprises
10.7 million people
20% 2.6 million
people
Number of Thai Businesses
1% 4,000 enterprises
99% 360,000 enterprises
SME Business : Important Foundation of Thai Economy
SMEs Businesses Large Corporates