Economic Outlook for Calhoun County 2014-15 - Battle Creek Area
53
2014–2015 Forecast for Calhoun County 2013 was an “OK” year George A. Erickcek Brian Pittelko W.E. Upjohn Institute for Employment Research January 16, 2014
Transcript of Economic Outlook for Calhoun County 2014-15 - Battle Creek Area

2014–2015 Forecast for Calhoun County
2013 was an “OK” year
George A. Erickcek Brian Pittelko
W.E. Upjohn Institute for Employment Research
January 16, 2014

Thanks to Our Sponsors
1

Outline
• Most think that the economy is stronger than it looks—only 74,000 new jobs in December
• The state economy continues to be driven by the car industry
• Calhoun County had a positive but disappointing year
• Forecast: more employment growth
2

GDP grew by 4.1 percent in the third quarter, and the forecast is positive
-10
-8
-6
-4
-2
0
2
4
6
2005 2006 2007 2008 2009 2010 2011 2012 2013 2014 2015
Percent change in GDP (average annual rate)
3
The last quarter of the year is expected to be slow as businesses work off unwanted inventories.

Capacity utilization has not yet fully recovered but business confidence is up
50.0
55.0
60.0
65.0
70.0
75.0
80.0
85.0
30
35
40
45
50
55
60
65
70
2006 2007 2008 2009 2010 2011 2012 2013
Pe
rce
nt
uti
lizat
ion
(%)
PM
I (>5
0 =
exp
ansi
on
; <5
0 =
co
ntr
acti
on
)
Purchasing Managers’ Index for Manufacturing and Industrial Capacity Utilization
Manufacturing PMI Capacity utilization
4

Employment conditions have improved; however, the number of job seekers per opening
is still double what it was in 2008
5

Employment has been slow to recover
94
96
98
100
102
104
106
108
110
-24 -18 -12 -6 0 6 12 18 24 30 36 42 48 54
Months from the trough
Employment Index (100 = Trough)
Current
6

Yes, we are coming off a bad one
54 months since the trough and we are still off more than a million jobs in the nation.
7
Recession Employment Loss in
Recession Employment Gains
in Expansion Net Change
Current -7,464 6,299 -1,165
2001 -1,593 4,933 3,340
1991 -1,242 9,287 8,045

Unemployment is falling, but there are still too many long-term unemployed workers
0
5
10
15
20
25
30
35
40
45
50
0
2
4
6
8
10
12
2008 2009 2010 2011 2012 2013
Perc
enta
ge u
nem
plo
yed
27
wee
ks o
r m
ore
Un
emp
loym
ent
rate
U.S. Unemployment Rate and Long-Term Unemployment
Unemployment rate Percentage unemployed 27 weeks or more
In December, the unemployment rate dropped because 347,000 individuals left the workforce.
8

Consumers appear to be holding more debt and not feeling that good about it
9 Source: Conference Board and the Federal Reserve.
0
20
40
60
80
100
120
-50.0
-40.0
-30.0
-20.0
-10.0
0.0
10.0
20.0
30.0
40.0
50.0
2006 2007 2008 2009 2010 2011 2012 2013
Ind
ex: 1
99
5 =
10
0
Bill
ion
s ($
)
Consumer Confidence and Change in Consumer Debt
Consumer debt Consumer confidence

Interest rates and inflation are moving upward but are still at historically low levels
10
-3.0
-2.0
-1.0
0.0
1.0
2.0
3.0
4.0
5.0
6.0
7.0
2008 2009 2010 2011 2012 2013
An
nu
al p
erce
nta
ge r
ate
Interest Rates and Inflation
30-year mortgages 10-year Treasury bill
3-month Treasury
12-month change in CPI-U

There isn’t a lot of demand for loans
-100
-80
-60
-40
-20
0
20
40
60
80
100
2008 Q1 2009 Q1 2010 Q1 2011 Q1 2012 Q1 2013 Q1
Net
per
cen
tage
of
resp
on
den
ts
Federal Reserve Senior Loan Officers Survey: Demand and Lending Standards for Commercial and Industrial
Loans by Medium-to-Large Firms
Reporting tightening standards
Reporting stronger loan demand
11
So let’s sum up
• The economy is expected to grow faster in 2014 than last year, but will still be below what we want
• The major problem is the lack of demand as seen in our capacity utilization rates and loan demand
• This means the number of job seekers per job will remain too high
• Don’t expect anything from Congress and the Fed will slowly—and I mean slowly—tighten the money supply
But there is something else as well 12

Starting in 1981 and continuing until today, most of the nation’s income growth has been
earned by the top 5 percent
0
20
40
60
80
100
120
140
160
180
200
19
67
19
69
19
71
19
73
19
75
19
77
19
79
19
81
19
83
19
85
19
87
19
89
19
91
19
93
19
95
19
97
19
99
20
01
20
03
20
05
20
07
20
09
20
11
Ho
use
ho
ld in
com
e ($
00
0s)
Income Level Quintiles, 2012 Dollars
Lowest Second Third Fourth Lower limit of top 5 percent
Source: Census Historic Income. 13

Why does it matter?
• Inequality limits consumer expending and, hence, slows the economy
• Research suggests that historical trends in upward mobility are declining
• Consumer confidence surveys indicate that households’ future expectations are at record lows
14

What should be done? That is the question
• Very little political will to make the tax code more progressive
• Increasing educational opportunities is a standard response but it is a long-term solution
• Current efforts are to increase the minimum wage
15

The state’s minimum wage of $7.40 has not changed since 2008
0
1
2
3
4
5
6
7
8
9
10
19
80
19
81
19
82
19
83
19
84
19
85
19
86
19
87
19
88
19
89
19
90
19
91
19
92
19
93
19
94
19
95
19
96
19
97
19
98
19
99
20
00
20
01
20
02
20
03
20
04
20
05
20
06
20
07
20
08
20
09
20
10
20
11
20
12
20
13
Wag
e ($
)
Minimum Wage, 1980–2013, Nominal
Michigan US
16
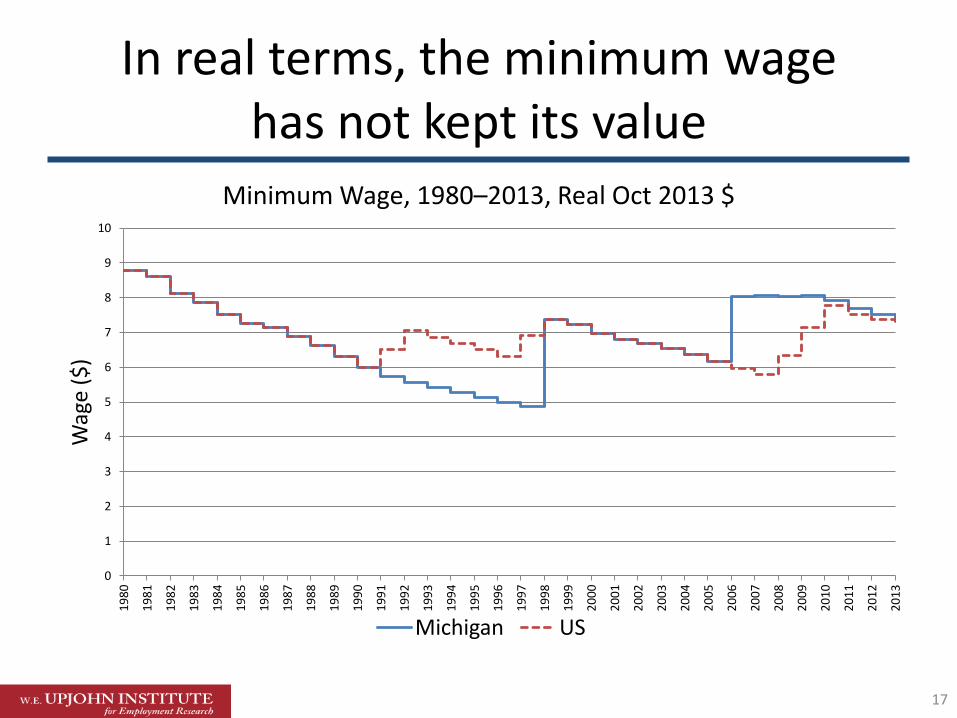
In real terms, the minimum wage has not kept its value
0
1
2
3
4
5
6
7
8
9
10
19
80
19
81
19
82
19
83
19
84
19
85
19
86
19
87
19
88
19
89
19
90
19
91
19
92
19
93
19
94
19
95
19
96
19
97
19
98
19
99
20
00
20
01
20
02
20
03
20
04
20
05
20
06
20
07
20
08
20
09
20
10
20
11
20
12
20
13
Wag
e ($
)
Minimum Wage, 1980–2013, Real Oct 2013 $
Michigan US
17

So should we increase the minimum wage?
• Worries:
– Negatively impact employment – Recent research indicates that this may not be the case
– Some individuals who earn the minimum wage do not live in low-income households. This is true.
• My preferred solution is to increase the Earned Income Tax Credit
• Bottom line: this issue will not go away
18

Turning to Michigan
• 2013 Employment Growth Estimates: 59.480 total jobs created, up 1.4%
17,570 manufacturing jobs, up 3.3%
• U of M’s Forecast is positive
66,730 additional jobs in 2014
65,050 additional jobs in 2015
19 Source: University of Michigan.

During the past four quarters, the state’s employment has increased by 64,400
-10 0 10 20 30 40 50 60 70
Government Other services
Leisure & hospitality Education & health
Business & professional Financial
Information Transportation & utilities
Retail Wholesale
Manufacturing Construction
Total
Employment (in 000s)
Employment Change, 3rd Quarter 2012 to 3rd Quarter 2013
20 Source: Michigan Labor Market Information, CES.
Implied manufacturing multiplier is 3.9 which is a bit too high.

Auto sales continue to pick up and are forecast to drive past 16 million units in 2014
21 Source: BEA.
0.0
2.0
4.0
6.0
8.0
10.0
12.0
14.0
16.0
18.0
20.0
22.0
24.0
2000 2001 2002 2003 2004 2005 2006 2007 2008 2009 2010 2011 2012 2013
15.5 million units in 2013

The auto outlook is promising
• The current fleet on the road is old, very old–11.4 years
• Incentives are back
• New selections – there will be 40 new launches in 2014
• Financing is available
22

Construction activity has a long way to go
0
10,000
20,000
30,000
40,000
50,000
60,000
2000 2001 2002 2003 2004 2005 2006 2007 2008 2009 2010 2011 2012 2013
Number of Building Permits Issued*
Total units Single family
Source: U.S. Census. 23
*2013 is an estimate

Calhoun County
• Modest employment gains and a declining unemployment rate
• Lagging retail market
• Still, it has out-performed comparison MSAs
• Talent attraction remains a challenge
• Forecast: continued growth
24

Employment gains have been modest: 370 jobs in the four-quarter period, 0.7% increase.
-150 -100 -50 0 50 100 150 200 250
Government
Other Services
Leisure & hospitality
Education & Health
Prof. and Business
Financial
Trade, Transport., and Util.
Manufacturing
Mining, Logging, Const.
Employment Change, Q3 2012 to Q3 2013
Source: BLS CES.
Given a 2.3 employment multiplier, manufacturing employment can be credited for powering the entire economy forwared.
25

The lack of linkage between manufacturing and trade is troublesome
Mining, Logging, Const.
Manufacturing
Trade, Transport., and
Util. Financial
Prof. and Business
Education & Health
Leisure & hospitality
Other Services
Government
-150
-100
-50
0
50
100
150
200
250
Employment Change, Q3 2012 to Q3 2013
Source: BLS CES. 26

The good news is that county’s unemployment rate is dropping; the bad news is that it is for
the wrong reason
0
2
4
6
8
10
12
14
2000 2001 2002 2003 2004 2005 2006 2007 2008 2009 2010 2011 2012 2013
Unemployment Rate for Calhoun County
27 Source: BLS LAUS and Upjohn Institute.

November-to-November Change
Year Labor Force Change Employment
Change Unemployment
Change
2011 -1,281 353 -1,634
2012 -685 110 -795
2013 519 209 310
Source: MI Labor Market Indicators, Local Area Unemployment Statistics.
Unfortunately, too many people have been dropping out the labor force
28
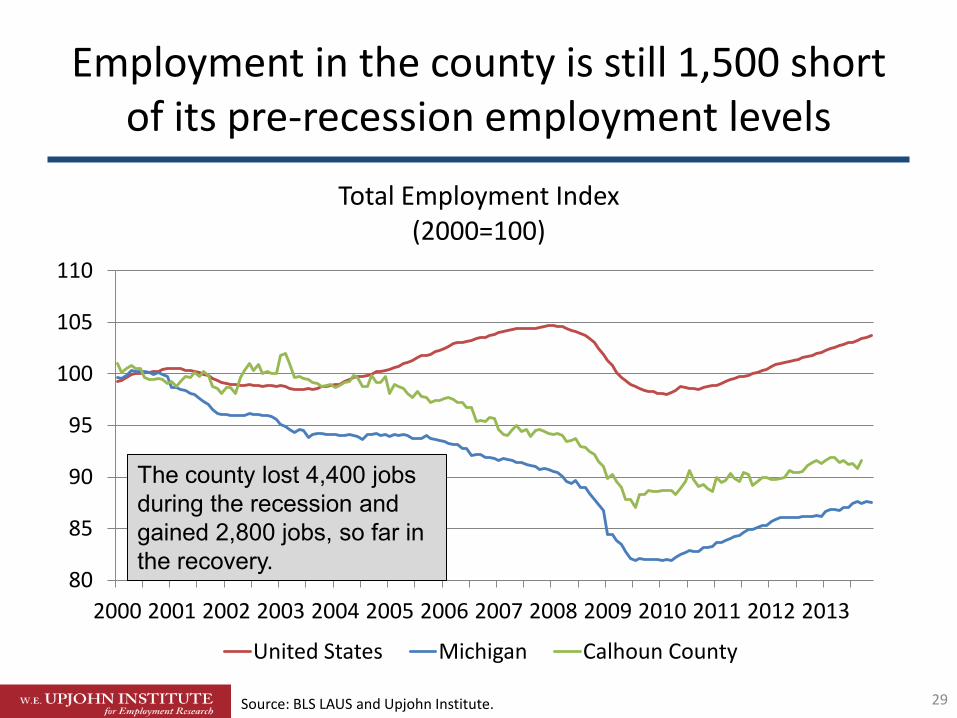
Employment in the county is still 1,500 short of its pre-recession employment levels
80
85
90
95
100
105
110
2000 2001 2002 2003 2004 2005 2006 2007 2008 2009 2010 2011 2012 2013
Total Employment Index (2000=100)
United States Michigan Calhoun County
29 Source: BLS LAUS and Upjohn Institute.
The county lost 4,400 jobs during the recession and gained 2,800 jobs, so far in the recovery.

Employment in the county’s service sector has hit a plateau
80
85
90
95
100
105
110
115
120
2000 2001 2002 2003 2004 2005 2006 2007 2008 2009 2010 2011 2012 2013
Private Services Employment Index (2000=100)
United States Michigan Calhoun County
30 Source: BLS LAUS and Upjohn Institute.

The county manufacturers have added 1,500 jobs since the recession
45
55
65
75
85
95
105
2000 2001 2002 2003 2004 2005 2006 2007 2008 2009 2010 2011 2012 2013
Manufacturing Employment Index (2000=100)
United States Michigan Calhoun County
31 Source: BLS LAUS and Upjohn Institute.

Employment gains are clearly auto driven
Food Printing
Chemical
Plastics & Rubber
Nonmetallic Mineral
Primary Metal
Fabricated Metal
Machinery Electrical
Equip.
Transportation
Misc.
-400
-300
-200
-100
0
100
200
300
400
500
600
Employment Change, Q1 2012 to Q1 2013
Source: BLS QCEW. 32

Construction activity is still flat
0
50
100
150
200
250
300
350
400
450
2004 2005 2006 2007 2008 2009 2010 2011 2012 2013
Construction Permits Issued, Calhoun Co.
Total, All Structure Types Single Family Houses
33 Source: U.S. Census. •Year to date, November 2013

And evidence suggests that housing prices are stable at best
0
20
40
60
80
100
120
140
160
180
200
FHFA Housing Price Index (1995=100)
Battle Creek
Source: FHFA Housing Index. 34

Comparison Analysis
• Altoona, PA
• Anderson, IN
• Jackson, MI
• Johnstown, PA
• Lebanon, PA
• Mansfield, OH
• Monroe, MI
• Muncie, IN
• Springfield, OH
• Wausau, WI
• Williamsport, PA
Comparison Areas:
35
Comparison Criteria
• All one-county metropolitan areas
• Within Midwest region
• Not college town or state capitol
• All within 15% population of Calhoun County (plus Jackson)
36

All of the comparison areas are experiencing lackluster employment growth
-1.1% -0.7%
-0.5% -0.3%
-0.2% -0.1%
0.1% 0.2%
0.3% 0.6%
1.6% 0.0%
1.0%
-1.5% -1.0% -0.5% 0.0% 0.5% 1.0% 1.5% 2.0%
Mansfield, OH Wausau, WI Monroe, MI
Springfield, OH Johnstown, PA
Jackson, MI Muncie, IN
Altoona, PA Lebanon, PA
Williamsport, PA Anderson, IN
Comparison Average Battle Creek, MI
Percent Change in Total Employment, Jan–Nov 2012 through Jan–Nov 2013
Source: BLS. 37

Calhoun County’s manufacturing sector is doing better than average . . .
-2.1% -1.9%
-0.9% -0.7%
-0.2% 1.1%
1.6% 1.7%
1.8% 2.7%
4.7% 0.7%
2.7%
-4% -2% 0% 2% 4% 6%
Johnstown, PA Williamsport, PA
Wausau, WI Lebanon, PA
Mansfield, OH Muncie, IN
Anderson, IN Altoona, PA Jackson, MI Monroe, MI
Springfield, OH Comparison Average
Battle Creek, MI
Percent Change in Manufacturing Employment, Jan–Nov 2012 through Jan–Nov 2013
Source: BLS. 38

. . . as are its service sectors
-1.1% -1.1%
-0.7% -0.6% -0.6%
-0.4% -0.2% -0.2%
0.0% 0.1%
1.6% -0.3%
0.7%
-1.5% -1.0% -0.5% 0.0% 0.5% 1.0% 1.5% 2.0%
Mansfield, OH Springfield, OH
Wausau, WI Monroe, MI Lebanon, PA Jackson, MI Altoona, PA
Johnstown, PA Williamsport, PA
Muncie, IN Anderson, IN
Comparison Average Battle Creek, MI
Percent Change in Service Providing Employment, Jan–Nov 2012 through Jan–Nov 2013
Source: BLS. 39

The Calhoun County unemployment situation is slightly better than average
9.6
9.3
8.8
8.7
8.3
8.1
7.9
7.2
6.9
6.9
6.2
8.0
7.3
0 2 4 6 8 10 12
Anderson, IN
Muncie, IN
Johnstown, PA
Jackson, MI
Mansfield, OH
Monroe, MI
Williamsport, PA
Springfield, OH
Altoona, PA
Wausau, WI
Lebanon, PA
Comparison
Battle Creek
Average Unemployment Rate, Jan–Nov 2013
Source: BLS. 40
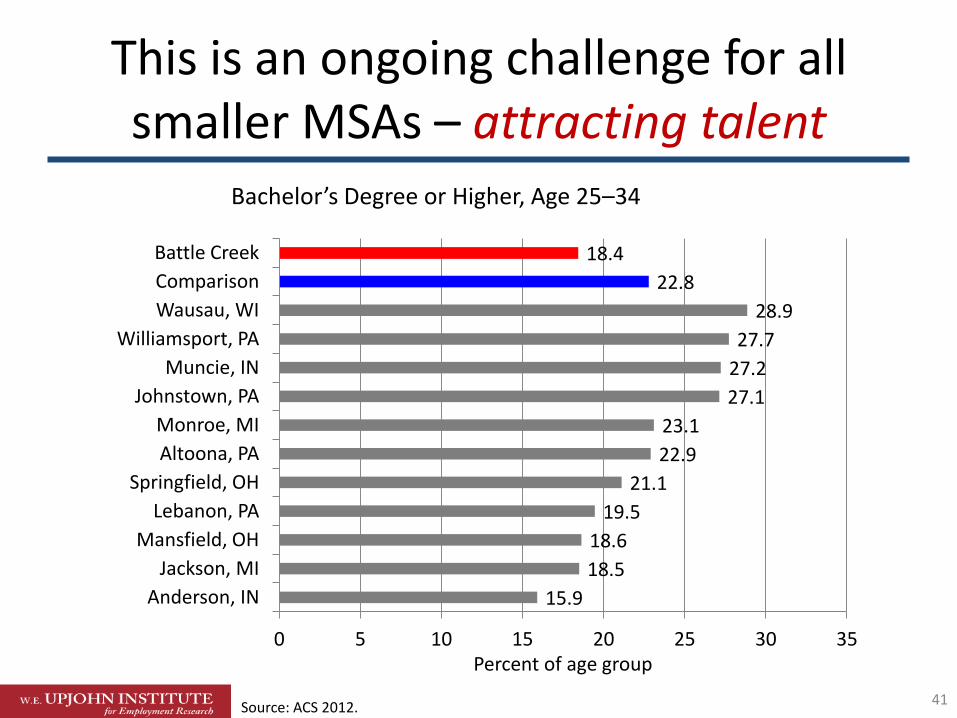
This is an ongoing challenge for all smaller MSAs – attracting talent
15.9
18.5
18.6
19.5
21.1
22.9
23.1
27.1
27.2
27.7
28.9
22.8
18.4
0 5 10 15 20 25 30 35
Anderson, IN
Jackson, MI
Mansfield, OH
Lebanon, PA
Springfield, OH
Altoona, PA
Monroe, MI
Johnstown, PA
Muncie, IN
Williamsport, PA
Wausau, WI
Comparison
Battle Creek
Percent of age group
Bachelor’s Degree or Higher, Age 25–34
Source: ACS 2012. 41

Nevertheless, knowledge-based entrepreneurship
is a strength of the county
15.3
15.3
16.3
16.3
17.3
17.4
18.1
19.3
20.1
23.1
26.6
18.7
24.6
0 5 10 15 20 25 30
Johnstown, PA
Wausau, WI
Lebanon, PA
Altoona, PA
Muncie, IN
Williamsport, PA
Springfield, OH
Jackson, MI
Mansfield, OH
Anderson, IN
Monroe, MI
Comparison
Battle Creek
Percent of industry
Self-Employed Professional, Scientific Technical Employed
Source: ACS 2012. 42

Just a reminder that education matters
0
10
20
30
40
50
60
70
Less than HS High school Some college
Associate's Bachelor's Graduate
Inco
me
($0
00
’s)
Annual Income by Educational Attainment
Source: IPUMS USA 2012. 43

Change in the number of job postings, 2012 to 2013
-4 -2 0 2 4 6 8 10
Public Administration Other Services
Accommodation and Food Arts, Ent., and Rec.
Health Care and Social Asst. Educational Services
Admin, Support, Waste Management
Prof., Sci., Tech Real Estate
Finance and Insurance Information
Transport. And Warehousing Retail Trade
Wholesale Trade Manufacturing
Construction Utilities
Ratio to total growth
Job Posting Index, 2012 to 2013 All Industries
Source: Burning Glass Labor Insight. 44

Job postings for knowledge-based workers lag in nearly all MSAs in the state
-6.0 -5.0 -4.0 -3.0 -2.0 -1.0 0.0 1.0 2.0
Bay City Benton Harbor
Saginaw Flint
Detroit Lansing Holland
Ann Arbor Muskegon
Jackson Battle Creek
Monroe Kalamazoo
Grand Rapids
Ratio to total growth
Job Posting Index, 2012 to 2013 Architecture and Engineering Occupations
Source: Burning Glass Labor Insight. 45
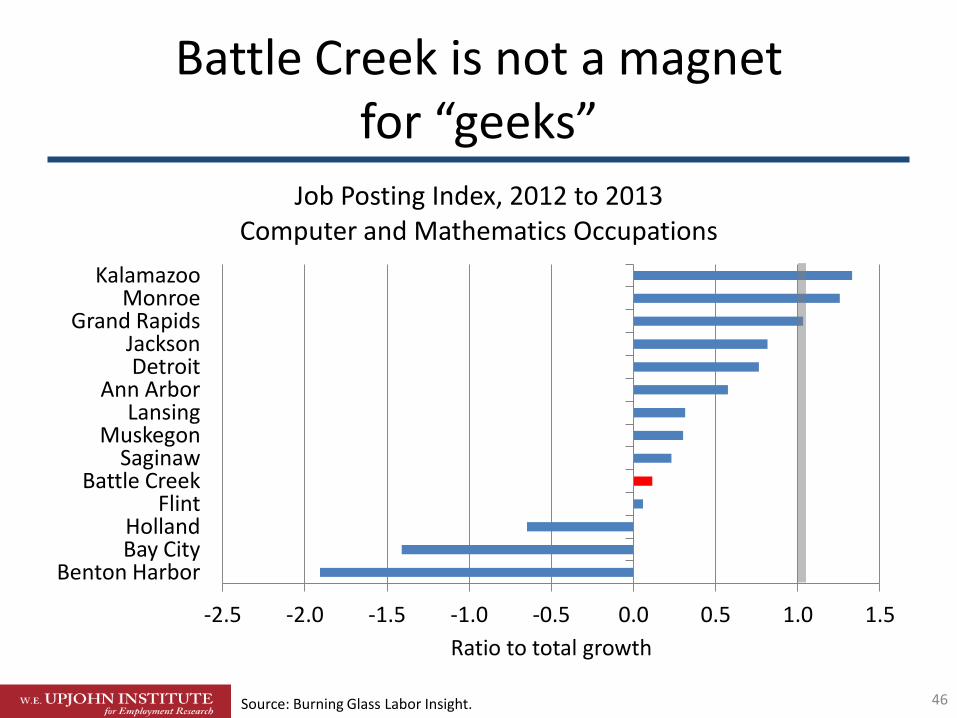
Battle Creek is not a magnet for “geeks”
-2.5 -2.0 -1.5 -1.0 -0.5 0.0 0.5 1.0 1.5
Benton Harbor Bay City Holland
Flint Battle Creek
Saginaw Muskegon
Lansing Ann Arbor
Detroit Jackson
Grand Rapids Monroe
Kalamazoo
Ratio to total growth
Job Posting Index, 2012 to 2013 Computer and Mathematics Occupations
Source: Burning Glass Labor Insight. 46

On to the 2014 and 2015 forecast
Not so fast, how good was your last year’s forecast?
The focus group blew it again!
47
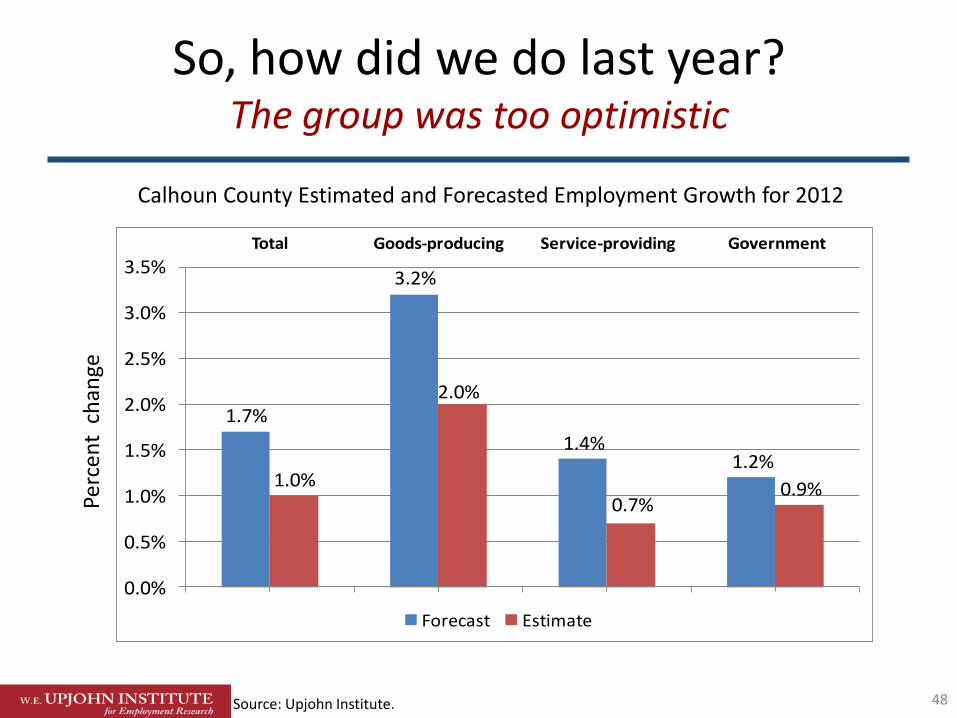
So, how did we do last year? The group was too optimistic
1.7%
3.2%
1.4%1.2%
1.0%
2.0%
0.7%0.9%
0.0%
0.5%
1.0%
1.5%
2.0%
2.5%
3.0%
3.5%Total Goods-producing Service-providing Government
Forecast Estimate
Perc
ent
ch
ange
Source: Upjohn Institute.
Calhoun County Estimated and Forecasted Employment Growth for 2012
48
Recent business reports have been robust
• Bleistahl
• Cosma Castings Michigan
• Denso
• Janesville Acoustics
• Post Cereal
• TRMI Inc
49
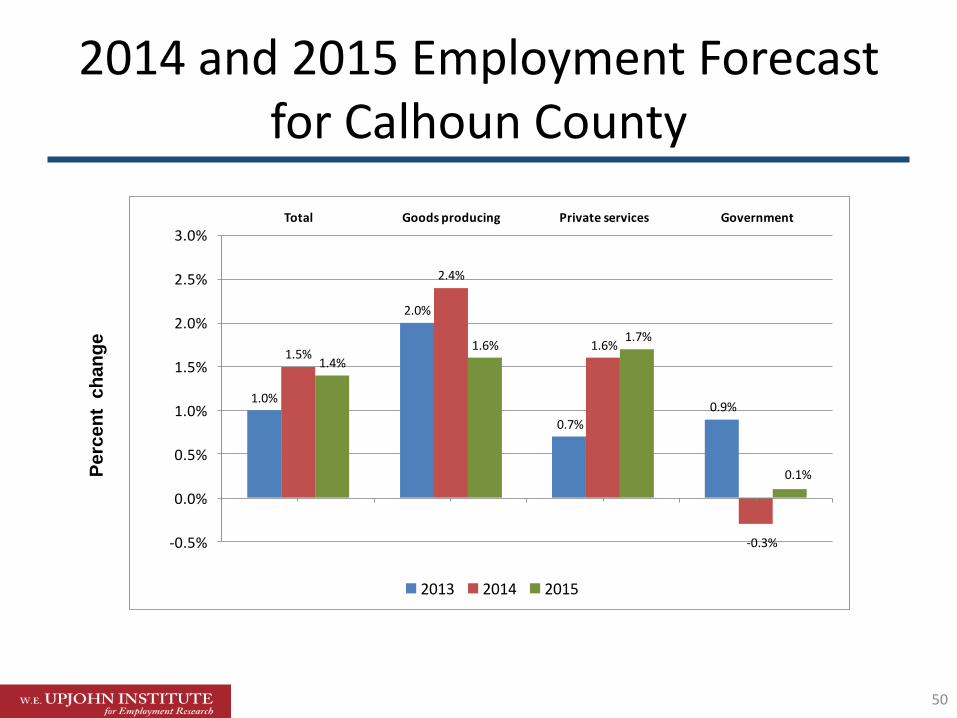
2014 and 2015 Employment Forecast for Calhoun County
1.0%
2.0%
0.7%
0.9%
1.5%
2.4%
1.6%
-0.3%
1.4%
1.6%1.7%
0.1%
-0.5%
0.0%
0.5%
1.0%
1.5%
2.0%
2.5%
3.0%Total Goods producing Private services Government
2013 2014 2015
Perc
en
t c
han
ge
50

Last words
• 2013 was a good year for Calhoun County
• Still, the drop in the area’s unemployment rate was due largely because individuals were leaving the workforce
• The link between the area’s manufacturing sector and its service sectors is very weak, suggesting strong retail leakage from the county
• Again, I believe 2014 will be a better year—however, this has been the fourth year in a row that our forecast has been too robust
51

2014–2015 Forecast for Calhoun County
2013 was an “OK” year
George A. Erickcek Brian Pittelko
W.E. Upjohn Institute for Employment Research
January 16, 2014