ECONOMIC OUTLOOK 2017 03-Mar-2017 - AXYS · PDF fileECONOMIC OUTLOOK 2017 03-Mar-2017 A: AXYS...
17
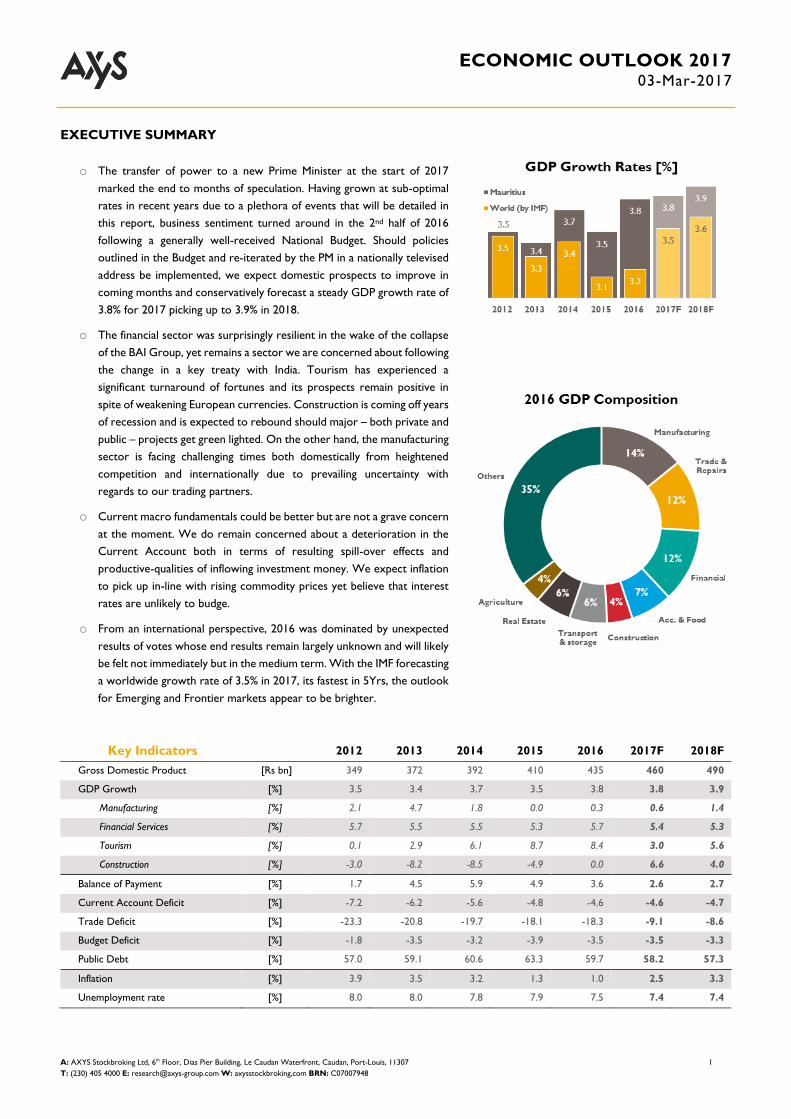
ECONOMIC OUTLOOK 2017 03-Mar-2017 A: AXYS Stockbroking Ltd, 6 th Floor, Dias Pier Building, Le Caudan Waterfront, Caudan, Port-Louis, 11307 1 T: (230) 405 4000 E: [email protected] W: axysstockbroking,com BRN: C07007948 EXECUTIVE SUMMARY o The transfer of power to a new Prime Minister at the start of 2017 marked the end to months of speculation. Having grown at sub-optimal rates in recent years due to a plethora of events that will be detailed in this report, business sentiment turned around in the 2 nd half of 2016 following a generally well-received National Budget. Should policies outlined in the Budget and re-iterated by the PM in a nationally televised address be implemented, we expect domestic prospects to improve in coming months and conservatively forecast a steady GDP growth rate of 3.8% for 2017 picking up to 3.9% in 2018. o The financial sector was surprisingly resilient in the wake of the collapse of the BAI Group, yet remains a sector we are concerned about following the change in a key treaty with India. Tourism has experienced a significant turnaround of fortunes and its prospects remain positive in spite of weakening European currencies. Construction is coming off years of recession and is expected to rebound should major – both private and public – projects get green lighted. On the other hand, the manufacturing sector is facing challenging times both domestically from heightened competition and internationally due to prevailing uncertainty with regards to our trading partners. o Current macro fundamentals could be better but are not a grave concern at the moment. We do remain concerned about a deterioration in the Current Account both in terms of resulting spill-over effects and productive-qualities of inflowing investment money. We expect inflation to pick up in-line with rising commodity prices yet believe that interest rates are unlikely to budge. o From an international perspective, 2016 was dominated by unexpected results of votes whose end results remain largely unknown and will likely be felt not immediately but in the medium term. With the IMF forecasting a worldwide growth rate of 3.5% in 2017, its fastest in 5Yrs, the outlook for Emerging and Frontier markets appear to be brighter. Key Indicators 2012 2013 2014 2015 2016 2017F 2018F Gross Domestic Product [Rs bn] 349 372 392 410 435 460 490 GDP Growth [%] 3.5 3.4 3.7 3.5 3.8 3.8 3.9 Manufacturing [%] 2.1 4.7 1.8 0.0 0.3 0.6 1.4 Financial Services [%] 5.7 5.5 5.5 5.3 5.7 5.4 5.3 Tourism [%] 0.1 2.9 6.1 8.7 8.4 3.0 5.6 Construction [%] -3.0 -8.2 -8.5 -4.9 0.0 6.6 4.0 Balance of Payment [%] 1.7 4.5 5.9 4.9 3.6 2.6 2.7 Current Account Deficit [%] -7.2 -6.2 -5.6 -4.8 -4.6 -4.6 -4.7 Trade Deficit [%] -23.3 -20.8 -19.7 -18.1 -18.3 -9.1 -8.6 Budget Deficit [%] -1.8 -3.5 -3.2 -3.9 -3.5 -3.5 -3.3 Public Debt [%] 57.0 59.1 60.6 63.3 59.7 58.2 57.3 Inflation [%] 3.9 3.5 3.2 1.3 1.0 2.5 3.3 Unemployment rate [%] 8.0 8.0 7.8 7.9 7.5 7.4 7.4
Transcript of ECONOMIC OUTLOOK 2017 03-Mar-2017 - AXYS · PDF fileECONOMIC OUTLOOK 2017 03-Mar-2017 A: AXYS...
ECONOMIC OUTLOOK 2017 03-Mar-2017
A: AXYS Stockbroking Ltd, 6th Floor, Dias Pier Building, Le Caudan Waterfront, Caudan, Port-Louis, 11307 1
T: (230) 405 4000 E: [email protected] W: axysstockbroking,com BRN: C07007948
EXECUTIVE SUMMARY
o The transfer of power to a new Prime Minister at the start of 2017
marked the end to months of speculation. Having grown at sub-optimal
rates in recent years due to a plethora of events that will be detailed in
this report, business sentiment turned around in the 2nd half of 2016
following a generally well-received National Budget. Should policies
outlined in the Budget and re-iterated by the PM in a nationally televised
address be implemented, we expect domestic prospects to improve in
coming months and conservatively forecast a steady GDP growth rate of
3.8% for 2017 picking up to 3.9% in 2018.
o The financial sector was surprisingly resilient in the wake of the collapse
of the BAI Group, yet remains a sector we are concerned about following
the change in a key treaty with India. Tourism has experienced a
significant turnaround of fortunes and its prospects remain positive in
spite of weakening European currencies. Construction is coming off years
of recession and is expected to rebound should major – both private and
public – projects get green lighted. On the other hand, the manufacturing
sector is facing challenging times both domestically from heightened
competition and internationally due to prevailing uncertainty with
regards to our trading partners.
o Current macro fundamentals could be better but are not a grave concern
at the moment. We do remain concerned about a deterioration in the
Current Account both in terms of resulting spill-over effects and
productive-qualities of inflowing investment money. We expect inflation
to pick up in-line with rising commodity prices yet believe that interest
rates are unlikely to budge.
o From an international perspective, 2016 was dominated by unexpected
results of votes whose end results remain largely unknown and will likely
be felt not immediately but in the medium term. With the IMF forecasting
a worldwide growth rate of 3.5% in 2017, its fastest in 5Yrs, the outlook
for Emerging and Frontier markets appear to be brighter.
Key Indicators 2012 2013 2014 2015 2016 2017F 2018F
Gross Domestic Product [Rs bn] 349 372 392 410 435 460 490
GDP Growth [%] 3.5 3.4 3.7 3.5 3.8 3.8 3.9
Manufacturing [%] 2.1 4.7 1.8 0.0 0.3 0.6 1.4
Financial Services [%] 5.7 5.5 5.5 5.3 5.7 5.4 5.3
Tourism [%] 0.1 2.9 6.1 8.7 8.4 3.0 5.6
Construction [%] -3.0 -8.2 -8.5 -4.9 0.0 6.6 4.0
Balance of Payment [%] 1.7 4.5 5.9 4.9 3.6 2.6 2.7
Current Account Deficit [%] -7.2 -6.2 -5.6 -4.8 -4.6 -4.6 -4.7
Trade Deficit [%] -23.3 -20.8 -19.7 -18.1 -18.3 -9.1 -8.6
Budget Deficit [%] -1.8 -3.5 -3.2 -3.9 -3.5 -3.5 -3.3
Public Debt [%] 57.0 59.1 60.6 63.3 59.7 58.2 57.3
Inflation [%] 3.9 3.5 3.2 1.3 1.0 2.5 3.3
Unemployment rate [%] 8.0 8.0 7.8 7.9 7.5 7.4 7.4

ECONOMIC OUTLOOK 2017 03-Mar-2017
A: AXYS Stockbroking Ltd, 6th Floor, Dias Pier Building, Le Caudan Waterfront, Caudan, Port-Louis, 11307 2
T: (230) 405 4000 E: [email protected] W: axysstockbroking,com BRN: C07007948
BIRD’S EYE VIEW
The Mauritian economy grew at a sub-optimal average rate of
3.6% during the past five years. On the bright side, the change in
leadership at the helm of Government ended months of speculation
bringing added clarity to forward policies which is expected to be
beneficial for business.
Factors having afflicted growth momentum include: stimulus
packages reaching “maturity” upon project completion; private
investment slowing down in 2014 ahead of general elections in a
year dominated by political manoeuvres which then extended into
2015 amid shifting policies. The collapse of the BAI Group that same
year fuelled a reversal in business sentiment. The mood in the first
half of 2016 remained weak as a consequence of the renegotiated
Indo-Mauritian DTA, government-level bottlenecks, as well as intra-
cabinet bickering which led to a mini-cabinet re-shuffling. Sentiment
eventually turned around in the second half of 2016 following a
generally well received National Budget.
Figure 1. A Breakdown of the Mauritian Economy
The composition of the Mauritian economy remained more-or-less
the same. Construction, as a share of the economy, shrank by 47bps
annually which in turn resulted in lower demand for Credit. Weak
growth in Mauritius’ main trading partners hurt manufacturing
which also shed some 32bps annually. An unexpected observation
was the annualised 10bps growth in share of GDP for Trade which
appears to have been propped by lower petrol and food prices
instead of being curtailed – as anticipated – following the collapse
of the BAI Group. Other similarly appreciable gains were witnessed
mostly in Government-driven sectors e.g. Defence, Education,
Health and other support services.
1 On the back of inflated assets
Rankings
Mauritius – having consistently been within the Top 25 until 2014 –
tumbled to the 49th position in the World Bank’s 2017 Doing
Business ranking; although it retains its Top Spot in Sub-Saharan
Africa. Mauritius lost Doing Business ranks in most sub-segments
including “Starting a Business”, “Getting Electricity”, and
“Protecting Minority Investors”. With regards to the Ibrahim
Index of African Governance, Mauritius held on to the top spot
which it has never conceded.
Figure 2. Ease of Doing Business Ranking
SECTORIAL PERSPECTIVES
Finance
The Financial Sector has remained spectacularly resilient averaging
a 5.5% growth rate these past five years. This amazing feat becomes
more impressive given the collapse of one of the island’s largest Life
Insurers1 and a fairly small retail bank; as well as Mauritius finally
giving in to India’s demand of being allowed to apply its capital gains
tax on portfolio flows. It appears that Government intervention –
which created an unwelcome precedent of “Moral Hazard” –
propped the industry and prevented contagion. The entire debacle
paints a picture of poor oversight.
Figure 3. Financial Industry Growth Rate
Banks have seen a deterioration of their asset quality which coupled
with sluggish demand for Credit has resulted in weakened PAT
growth. On the plus side, should Government deliver on its
promise to kick-start major infrastructure projects in 2017, we
believe lending will pick up; in addition to the fact that banks are

ECONOMIC OUTLOOK 2017 03-Mar-2017
A: AXYS Stockbroking Ltd, 6th Floor, Dias Pier Building, Le Caudan Waterfront, Caudan, Port-Louis, 11307 3
T: (230) 405 4000 E: [email protected] W: axysstockbroking,com BRN: C07007948
increasingly diversifying into fee-driven operations such as Wealth
Management.
Our earnest concerns lie with Global Business following the
renegotiation of the Indo-Mauritian DTA. Since then, India has also
renegotiated other bilateral DTAs with various countries. The
Mauritian jurisdiction remains the most advantageous, yet flows are
unlikely to remain the same. Counter to intuition, the expected
reduction in flows will have an impact2 on the National Current
Account (C/A) and Overall Balance of Payments (BoP) whose
deterioration – from current positive levels – could hurt the MUR.
A depreciation of our national currency would fuel inflation which
would in turn affect highly leveraged companies should the logical
interest rate hike follow. In addition to the above, the spill-over
effects from fewer licensees and flows is poised to affect
Professional services such as Auditing, Secretarial, Legal and other
Support services. Although we paint a bleak picture, Mauritius has
a positive track-record of re-inventing troubled sectors.
Consequently, we believe that focusing efforts in cementing
Mauritius as a well-regulated Financial Centre will help companies
diversify both their lines of business and markets. While we shall
lose some players in the short term, the Mauritian entrepreneur
has often forsaken short-term gains in favour of long-term growth.
It is with this very mind-set that we believe local players will
successfully diversify and expand their business internationally.
Travel & Leisure
Following years of stagnation, the Tourism Industry has registered
high growth rates north of 8% during the last two years. Both
Tourism Receipts at Rs56bn and Arrivals at 1.275M have grown by
11% in 2016. This stellar performance however, has not been seen
in the financials of listed hoteliers for reasons specific to each
group’s strategy and to some extent a weak post-Brexit GBP. Island
wide Occupancy rates are expected to have stood ~300bps higher
in 2016 setting a new national record.
Figure 4. Tourist Arrivals & Receipts
This fresh growth spurt has been essentially driven by improved air
connectivity with both Europe and Asia. A majority of the new
flights are operated by Charters. This suits local hotel groups which
2 Daily transient flows represent a few percentage points of GDP
have grown accustomed to the Tour Operator model. Although
the industry is doing well, the major downside risk of such an
approach can result in lower occupancies in the event that the
Charter chooses to cease flights as has been the case of China
Southern Airlines and most recently low-cost operator, Air Asia X,
after just six months. Further, the lifting of the moratorium on new
hotel developments and Government’s intent to maintain an
“appropriate” air connectivity policy to foster diversification
suggest prospects for the hospitality industry are promising.
Figure 5. Hotels Growth Rate
Consumer Staples and Discretionary
Trade & Repairs
With a share of GDP averaging just short of 12% over the past five
years, Trade is on par with Financial Services in terms of size,
however growth has averaged ~3.0%. While we would have
expected the collapse of the BAI Group to hurt consumer
confidence resulting in a drop in trade, the effect appears to have
been limited. It would therefore seem fair to conclude that retailers,
many of whom said that business had been slow in 2014 & 2015,
were rather affected by greater competition following a
proliferation of medium to large sized malls across the island. We
believe record low inflation rates kept consumption rolling. The
recent ~10% increase in petrol and diesel prices however, might
curtail consumption in 2017. Consumption might be affected more
strongly in the following year when professionals with medium-to-
high disposable incomes become the collateral casualties of the
altered DTA.
Figure 6. Trade & Repairs Growth Rate
ECONOMIC OUTLOOK 2017 03-Mar-2017
A: AXYS Stockbroking Ltd, 6th Floor, Dias Pier Building, Le Caudan Waterfront, Caudan, Port-Louis, 11307 4
T: (230) 405 4000 E: [email protected] W: axysstockbroking,com BRN: C07007948
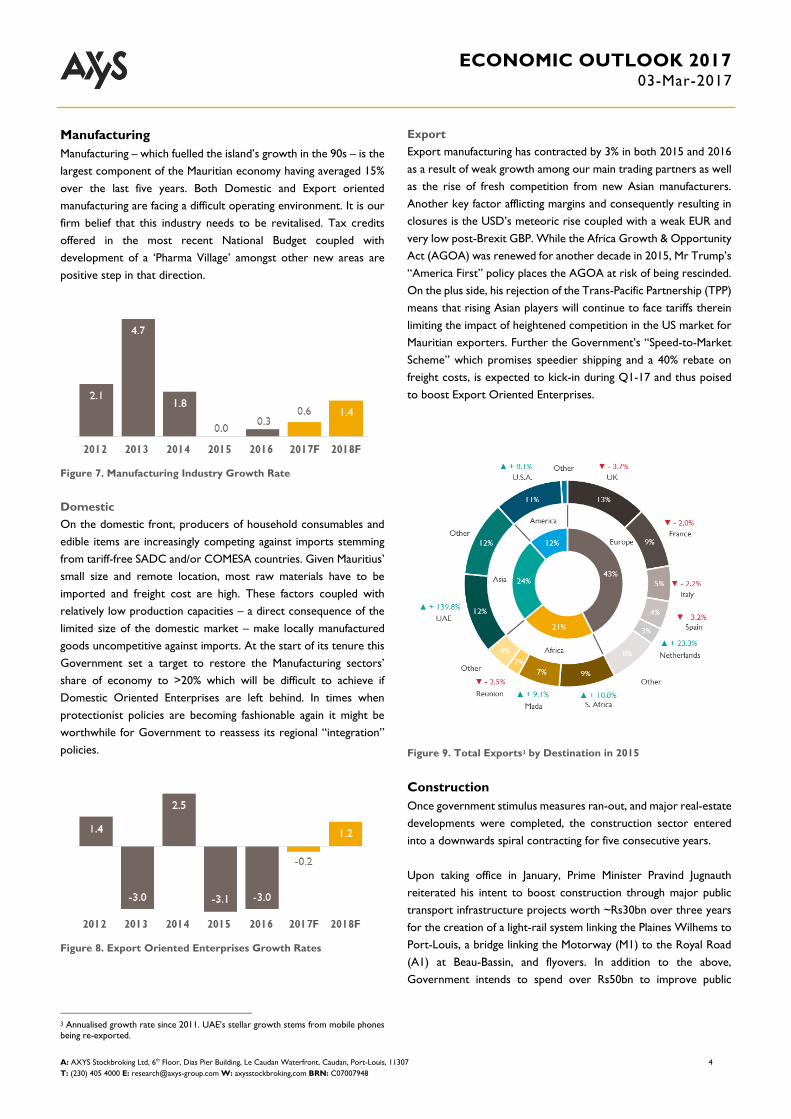
Manufacturing
Manufacturing – which fuelled the island’s growth in the 90s – is the
largest component of the Mauritian economy having averaged 15%
over the last five years. Both Domestic and Export oriented
manufacturing are facing a difficult operating environment. It is our
firm belief that this industry needs to be revitalised. Tax credits
offered in the most recent National Budget coupled with
development of a ‘Pharma Village’ amongst other new areas are
positive step in that direction.
Figure 7. Manufacturing Industry Growth Rate
Domestic
On the domestic front, producers of household consumables and
edible items are increasingly competing against imports stemming
from tariff-free SADC and/or COMESA countries. Given Mauritius’
small size and remote location, most raw materials have to be
imported and freight cost are high. These factors coupled with
relatively low production capacities – a direct consequence of the
limited size of the domestic market – make locally manufactured
goods uncompetitive against imports. At the start of its tenure this
Government set a target to restore the Manufacturing sectors’
share of economy to >20% which will be difficult to achieve if
Domestic Oriented Enterprises are left behind. In times when
protectionist policies are becoming fashionable again it might be
worthwhile for Government to reassess its regional “integration”
policies.
Figure 8. Export Oriented Enterprises Growth Rates
3 Annualised growth rate since 2011. UAE’s stellar growth stems from mobile phones
being re-exported.
Export
Export manufacturing has contracted by 3% in both 2015 and 2016
as a result of weak growth among our main trading partners as well
as the rise of fresh competition from new Asian manufacturers.
Another key factor afflicting margins and consequently resulting in
closures is the USD’s meteoric rise coupled with a weak EUR and
very low post-Brexit GBP. While the Africa Growth & Opportunity
Act (AGOA) was renewed for another decade in 2015, Mr Trump’s
“America First” policy places the AGOA at risk of being rescinded.
On the plus side, his rejection of the Trans-Pacific Partnership (TPP)
means that rising Asian players will continue to face tariffs therein
limiting the impact of heightened competition in the US market for
Mauritian exporters. Further the Government’s “Speed-to-Market
Scheme” which promises speedier shipping and a 40% rebate on
freight costs, is expected to kick-in during Q1-17 and thus poised
to boost Export Oriented Enterprises.
Figure 9. Total Exports3 by Destination in 2015
Construction
Once government stimulus measures ran-out, and major real-estate
developments were completed, the construction sector entered
into a downwards spiral contracting for five consecutive years.
Upon taking office in January, Prime Minister Pravind Jugnauth
reiterated his intent to boost construction through major public
transport infrastructure projects worth ~Rs30bn over three years
for the creation of a light-rail system linking the Plaines Wilhems to
Port-Louis, a bridge linking the Motorway (M1) to the Royal Road
(A1) at Beau-Bassin, and flyovers. In addition to the above,
Government intends to spend over Rs50bn to improve public

ECONOMIC OUTLOOK 2017 03-Mar-2017
A: AXYS Stockbroking Ltd, 6th Floor, Dias Pier Building, Le Caudan Waterfront, Caudan, Port-Louis, 11307 5
T: (230) 405 4000 E: [email protected] W: axysstockbroking,com BRN: C07007948
utilities infrastructure with a focus on renewable energy sources,
and replacement of leaky water pipes. Once kick-started such
medium-term projects are poised to stimulate growth for years to
come.
Figure 10. Construction Growth Rates
From a Private Sector perspective, weakened demand for high-end
real estate and moratorium on new hotels dampened Construction.
However, a little over a year following the introduction of ‘Smart-
City’ and ‘Property Development Schemes’, we expect
development permits granted to be on the rise and the process
simplified in coming years with a view to restore Mauritius’ Doing
Business Rank within the Top 25. Consequently, we believe this
industry will return to growth in years to come.
Figure 11. Location of Smart Cities
Property
Real Estate as a share of GDP has averaged 6.0% these last five years
but has experienced attenuated growth rates. The large supply of
new office buildings, commercial centres and residential apartments
has created a glut which is impacting rental on some properties, but
not for a select few well-positioned ones. Although we expect
rentals to remain stable in real terms over the years, the upcoming
developments should bring fresh impetus to the sector.
Figure 12. Property Growth Rate
MACROECONOMIC PERSPECTIVES
Monetary Policy
Figure 13. Headline Inflation Evolution
Headline inflation has fallen to record lows in recent years in-line
with sliding food and energy commodity prices which in turn gave
room for the Monetary Policy Committee (MPC) to lower the
Repo Rate by 40bps – largest cut in six years – to a record low 4.0%
in July 2016. Faced with now rising commodity prices, we expect
headline inflation to exceed 2% at the end of 2017 and 3% in 2018.
Given the fragility of the local economy and uncertain political and
economic climate in Europe, we do not believe that the MPC will
increase the Repo Rate this year. On the contrary, should the
EUR/USD fall below 1.05 and begin converging to parity, we believe
that the probability of a rate cut would increase significantly.
Figure 14. Key Repo Rate Evolution

ECONOMIC OUTLOOK 2017 03-Mar-2017
A: AXYS Stockbroking Ltd, 6th Floor, Dias Pier Building, Le Caudan Waterfront, Caudan, Port-Louis, 11307 6
T: (230) 405 4000 E: [email protected] W: axysstockbroking,com BRN: C07007948
Yields
The Bank of Mauritius (BoM) initiated a programme – after it was
agreed that the sterilised funds would not form part of statutory
debt ceiling computations – to mop-up excess liquidity in the
system which was in part a consequence of reduced investment.
This has had a positive effect with Sovereign (T-Bill, Notes & Bonds)
Yields coming-off record lows and in turn boosting investment
income for banks and investment funds. Starting Mar 1st 2017, BoM
has trimmed the number of Primary Dealers down to four (MCB,
SBM, Barclays & AfrAsia) with the intention of boosting the
Secondary market. The fewer number of bidders is also expected
to contribute in pulling the yield curve upwards.
Figure 15. Mauritian Sovereign Yields Evolution
Government Finances
We note that the Budget Deficit – which we would prefer to see
contained under 3% – has oscillated between 3% to 4% but, given
the need to stimulate growth through Government spending in
infrastructure, we remain content at under 4% until the situation
improves. Although the Public Sector debt currently exceeds the
legal ceiling of 60%, it is not debilitating. We are therefore not
apprehensive of so long as the borrowed funds are used to
invigorate growth.
Figure 16. Budget Deficit and Debt Evolution
Balance of Payments
The latest Balance of Payments (BoP) and Current Account (C/A)
figures have been fundamentally improved to capture transiting
Global Business flows which was previously lost in “errors and
omissions”. Having highlighted our key concerns for these two
metrics going forward in our discussion on the possible outcome of
DTA renegotiation, we remain comfortable with a C/A Deficit
under 5% and a positive BoP.
Figure 17. CAD and BoP Evolution
Foreign Direct Investment
BoP has now remained positive for 10 consecutive years a feat
which has been accompanied by a surge in Foreign Direct
Investment (FDI) since the mid-noughties. FDI in 2015 and 2016
have hovered at ~Rs10bn coming off peaks of Rs20bn and Rs18bn
achieved in 2012 and 2014 respectively. The flows have remained
geared towards Real Estate – which has a new moniker “PDS”
replacing “IRS & RES” – which as investments in non-productive
asset impacts the quality of FDI. A shift in FDI mix with an increase
in “Manufacturing” and “Tourism” would for starters be a leading
indicator that strong economic growth might be on the way.
Figure 18. FDI Evolution in Rs bn

ECONOMIC OUTLOOK 2017 03-Mar-2017
A: AXYS Stockbroking Ltd, 6th Floor, Dias Pier Building, Le Caudan Waterfront, Caudan, Port-Louis, 11307 7
T: (230) 405 4000 E: [email protected] W: axysstockbroking,com BRN: C07007948
Foreign Exchange
Figure 19. Currencies Evolution vs MUR
Given the large inward FDI and a positive BoP, it should not be a
surprise that the Rupee experiences consistent pressures towards
“strength” which the Central Bank alleviates through regular
monthly interventions on the foreign exchange market. Governor
Bheenick appears to have targeted a stable MUR Index4 through a
timely purchases of both USD and EUR whereas Governor Basant
Roi appears to be targeting5 a stable MUR/EUR rate exclusively and
rightly so through purchases of US Dollars. In the transition period
between Governors, the MUR depreciated by ~15% vis-à-vis peers
albeit with a slight lag – in-line with the Greenback’s surge – and
has since “gained” strength as a consequence of weakness in the
Single-currency and the Sterling.
Figure 20. MUR’s Evolution + BoM Interventions
This managed currency regime aids local companies which have
significant cross-border trade of goods and/or services.
Nonetheless, we often hear kvetching about the Rupee’s “super
strength”. If we were to apply the Economist’s light-hearted “Big
Mac Index” approach, with a Big Mac being sold at Rs94 compared
to $5.06 in USA, we discover that the MUR is undervalued by a
whopping 49% against the USD with an implied purchasing-power
parity exchange of Rs18.58. Wouldn’t that be a “super strong”
Rupee?
4 against a weighted basket of peer currencies 5 A policy aimed at helping exporters
Figure 21. Under v/s Over-valued currencies according to BigMac
Index
Labour
The unemployment rate which has averaged 7.9% over the
preceding five years is expected to drop to 7.4% in 2016. While this
improvement is welcome, we have not been particularly concerned
by the unemployment rate. As a country moving up the ladder in
terms of wealth per person and the high level of education
attainment, Mauritius is undergoing a transformation: the younger
generation has little interest in menial jobs. We believe that
imported labour is not replacing local labour, but rather filling the
vacuum created by locals not willing to take up some jobs.
Figure 22. Unemployment Evolution
The fact that youth unemployment is high is a signal for
Government to ensure that the new generation is given career
guidance to acquire skills-sets in the appropriate fields as well as
encouraging establishment of companies that would naturally
attract the millennials. The initiation of a “National Skills
Development Programme” is a positive step towards addressing the
more fundamental issue6 of jobs v/s skills mis-match.
6 Rather than raw unemployment
ECONOMIC OUTLOOK 2017 03-Mar-2017
A: AXYS Stockbroking Ltd, 6th Floor, Dias Pier Building, Le Caudan Waterfront, Caudan, Port-Louis, 11307 8
T: (230) 405 4000 E: [email protected] W: axysstockbroking,com BRN: C07007948
EAST AFRICAN PERSPECTIVES
East African countries of Kenya, Tanzania and Uganda have been
affected by a severe drought afflicting their agrarian economies.
Inflation is anticipated to soar driven by surging food inflation and
weakening of currencies in light of a strengthening dollar. In spite of
these difficult conditions, these economies are expected to register
GDP growth rates exceeding 5%; the growth being driven mainly
by public sector spending.
Kenya
Kenya’s economy has grown at an average rate of 5.6% over the
past three years and is expected to rise to 5.9% in 2016. Kenya is
expected to experience headwinds due to uncertainty ahead of
General Elections scheduled in August, a strong USD, and the
drought. Private Sector credit has deteriorated rendering the
banking sector more fragile, nonetheless, the IMF estimates Kenyan
GDP growth to stand at 5.3% in 2017, the slowest among the trio.
Figure 23. Kenyan GDP Growth Rate
Uganda
Like its neighbours, Uganda’s primary concern is high inflation rates
fuelled by the drought affecting both incomes and capacity to
consume, together with a depreciating Shilling and rising oil prices.
In spite of the above, enhanced Ugandan power generating capacity
is expected to provide fresh impetus to the economy. The IMF
estimates its economy to grow at 5.5% in 2017.
Figure 24. Uganda GDP Growth Rate
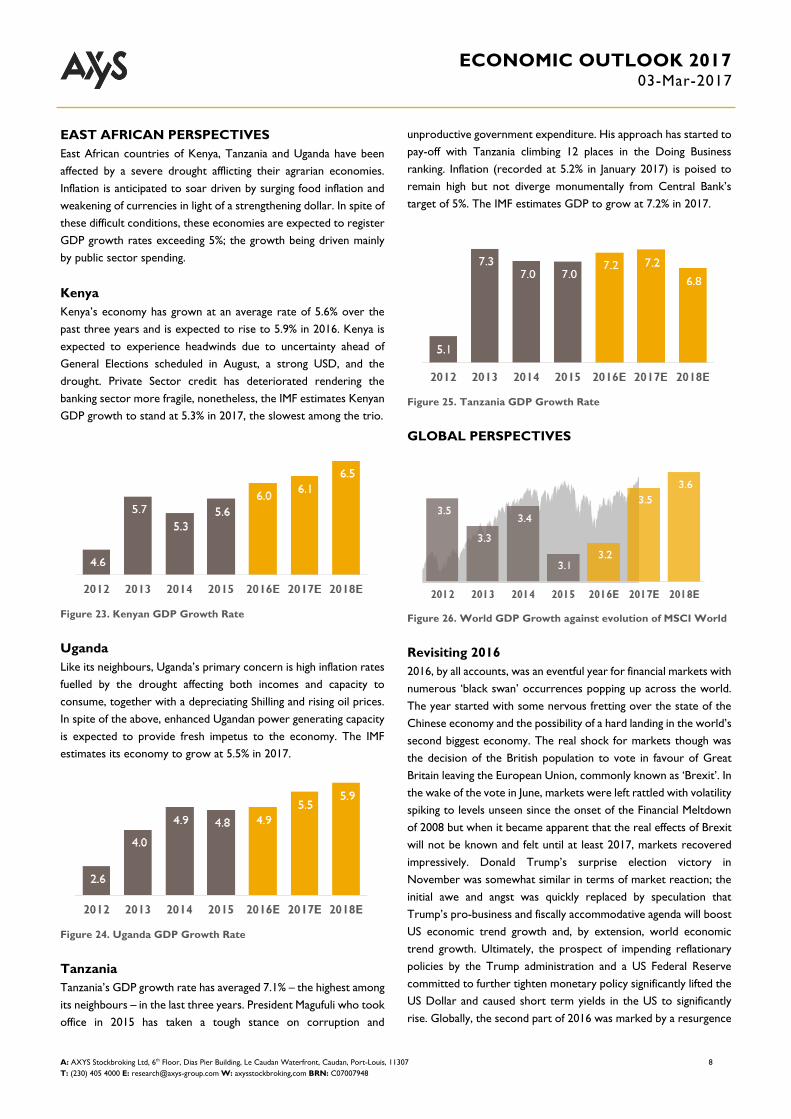
Tanzania
Tanzania’s GDP growth rate has averaged 7.1% – the highest among
its neighbours – in the last three years. President Magufuli who took
office in 2015 has taken a tough stance on corruption and
unproductive government expenditure. His approach has started to
pay-off with Tanzania climbing 12 places in the Doing Business
ranking. Inflation (recorded at 5.2% in January 2017) is poised to
remain high but not diverge monumentally from Central Bank’s
target of 5%. The IMF estimates GDP to grow at 7.2% in 2017.
Figure 25. Tanzania GDP Growth Rate
GLOBAL PERSPECTIVES
Figure 26. World GDP Growth against evolution of MSCI World
Revisiting 2016
2016, by all accounts, was an eventful year for financial markets with
numerous ‘black swan’ occurrences popping up across the world.
The year started with some nervous fretting over the state of the
Chinese economy and the possibility of a hard landing in the world’s
second biggest economy. The real shock for markets though was
the decision of the British population to vote in favour of Great
Britain leaving the European Union, commonly known as ‘Brexit’. In
the wake of the vote in June, markets were left rattled with volatility
spiking to levels unseen since the onset of the Financial Meltdown
of 2008 but when it became apparent that the real effects of Brexit
will not be known and felt until at least 2017, markets recovered
impressively. Donald Trump’s surprise election victory in
November was somewhat similar in terms of market reaction; the
initial awe and angst was quickly replaced by speculation that
Trump’s pro-business and fiscally accommodative agenda will boost
US economic trend growth and, by extension, world economic
trend growth. Ultimately, the prospect of impending reflationary
policies by the Trump administration and a US Federal Reserve
committed to further tighten monetary policy significantly lifted the
US Dollar and caused short term yields in the US to significantly
rise. Globally, the second part of 2016 was marked by a resurgence

ECONOMIC OUTLOOK 2017 03-Mar-2017
A: AXYS Stockbroking Ltd, 6th Floor, Dias Pier Building, Le Caudan Waterfront, Caudan, Port-Louis, 11307 9
T: (230) 405 4000 E: [email protected] W: axysstockbroking,com BRN: C07007948
in economic activity as the Eurozone and China witnessed a pick up
in the pace of expansion of their respective manufacturing and
services sectors.
Figure 27. SSA Growth against evolution of MSCI Frontier
Looking Ahead
Financial markets are riding high on optimism going into 2017 as
most expect the feel good sentiment surrounding the US economy
to propagate worldwide at some point this year. Market
participants have already mostly priced in an improved growth story
for the US and it remains to be seen whether Trump can transform
his ‘populist’ rhetoric into concrete policies. Equally important is an
objective assessment of the spill over effects of Trump-ism on other
economies, particularly China. According to numerous economists,
2016 was the start of a ‘de-globalisation’ trend; it remains to be
seen whether 2017 confirms this new state of affairs. In Europe, the
resurgent economy is somewhat clouded by a busy political
calendar. More than half a dozen European countries head to the
polls in 2017 with important elections being held in Germany,
France and to some extent Italy. Should the Eurozone be able to
navigate through this delicate year unscathed politically, its equity
markets are likely to post significant returns as economic growth
prospects are encouraging - courtesy of the ongoing European
Quantitative Easing (QE). Inflationary pressures are likely to come
to the fore in the United Kingdom as the effects of the significantly
depreciated Pound Sterling (GBP) on imported prices are felt
broadly across the UK economy and booming economic activities
also add to inflationary pressures. Last but not least, Emerging
Markets should continue to recover with a positive outlook for
both their respective currencies and equity markets. For instance,
Brazil was the standout performer last year, with its equity index,
the Bovespa Index rising by more than 60% in USD terms. Should
the world economy be effectively in a cyclical upturn as recent
economic figures suggest, the outlook for Emerging Markets will
brighten further.
CONCLUDING REMARKS
The freshly re-constituted cabinet combined with clearer policies
render the outlook for coming appreciably brighter than in recent
years. Government intends to boost the economy through major
infrastructure projects which should improve the velocity of money
which in turn signals an economy in bloom. Nonetheless,
headwinds, exist: we have expressed our concerns for the financial
sector which will require both transformation and stronger
regulation in order to diversify and develop fresh lines of business
as well as potential; and we have also discussed the repercussions
of rising inflation and currency volatility on our economy in times
of cries for greater protectionism abroad. Should this
administration deliver on its renewed promises, we expect
prospects to remain positive with a GDP growth rate of 3.8% in
2017 increasing to 3.9% in 2018.
Figure 28. Mauritius Growth against evolution of SEM

ECONOMIC OUTLOOK 2017 03-Mar-2017
A: AXYS Stockbroking Ltd, 6th Floor, Dias Pier Building, Le Caudan Waterfront, Caudan, Port-Louis, 11307 10
T: (230) 405 4000 E: [email protected] W: axysstockbroking,com BRN: C07007948
APPENDIX A – MAURITIUS KEY INFO
Country Information
Appellation Republic of Mauritius
Independence | Rep. March 12, 1968 | 1992
Government Westminster Dem.
President Dr Gurib-Fakim, Ameenah
Prime Minister Jugnauth, Pravind
Suffrage Universal, >18yrs
Off. & Biz. Language English & French
Geography
Area 2,040 km2
Excl. economic zone 1.9M km2
Capital Port-Louis
Location 20° 10' S; 57° 30' E
Time Zone GMT +4 hrs
Climate Sub-tropical
Tel. country code 230
Intnet country code .mu
Demographics
Population 1,263,500
Popn growth rate 0.24%
Median age 35.3 yrs
Life expectancy 75.4 yrs
Workforce 613,900
Unemployment 7.5%
Literacy 90.6% (2015)
Poverty 9.4% (2012)
Currency
Nomenclature Mauritian Rupee
Symbol/code Rs / MUR
Exchange rate (Mid) USD Rs 31.47 per USD
Exchange rate (Mid) EUR Rs 40.77 per EUR
Economy (2016)
GDP growth rate 3.8%
GDP at mkt price Rs 434.6bn
GDP per capita Rs 344,000
GDP ppp $ 25.9bn (138st)
GDP ppp per capita $ 20,500 (86th)
Budget deficit 3.5% of GDP
Public debt 59.7% of GDP
Current A/C deficit 4.6% of GDP
Headline Inflation 0.98%
Reserves 12.1 Months
Stock Exchange (2016)
Stocks | Fix Inc | ETFs 94 | 27 | 5
Key Indices Semdex | Alex 20
Market Cap Rs 279bn [64% of GDP]
Mean daily turnover Rs 60.2M [$ 1.88M]
Market PER | DY 16.42x | 3.08%

ECONOMIC OUTLOOK 2017 03-Mar-2017
A: AXYS Stockbroking Ltd, 6th Floor, Dias Pier Building, Le Caudan Waterfront, Caudan, Port-Louis, 11307 11
T: (230) 405 4000 E: [email protected] W: axysstockbroking,com BRN: C07007948
APPENDIX B – LISTED STOCKS BY SECTOR
Financial Services
Direct LCP @ Δ [%] Key Ratios
2-Mar YoY PER DY Activity
MCB ▲ 226.50 7.2 8.2x 3.9% Comm. Banking
SBM ▲ 7.02 3.2 7.7x 4.3% Comm. Banking
ABCB ▲ 27.70 58.3 12.0x 1.9% Comm. Banking
MEI ▲ 83.00 -0.9 6.8x 2.7% Gen. Insurance
MUA ▲ 61.00 1.7 16.5x 4.1% Gen. Insurance
SWAN ▲ 305.00 -20.3 10.9x 3.9% Gen. Insurance
SWANL ▲ 1,250.00 30.9 34.3x 3.7% Life Insurance
CIM ▲ 7.68 2.4 9.4x 4.4% Global Biz. & Cons Fin.
FINC ▲ 21.10 -3.9 27.2x 2.8% Leasing
IBL ▲ 36.20 48.1 565.8x 1.0% Glob Biz., Insu, Leasing & Banking
ROGE ▲ 28.75 0.5 68.5x 3.1% Glob Biz. & Insurance
UTIN ▼ 9.50 -25.4 ▬ 0.0% Glob Biz., Leasing, Wealth
CIEL ▲ 6.38 -0.3 12.1x 2.8% Glob Biz, Banking, Wealth
Indirect LCP @ Δ [%] Key Ratios
2-Mar YoY PER DY Through investment in
TERRA ▲ 32.15 5.4 17.4x 2.6% SWAN, SWANL, & UTIN
NITL ▲ 23.90 29.2 9.4x 3.7% SICOM
BMHL ▼ 27.60 2.0 48.7x 2.9% IBL & AfrAsia
ENLL ▲ 43.40 -7.7 #### 2.9% ROGE
ENL(P) ▲ 26.00 -4.6 131.4x 3.0% ENLL
EUDC ▲ 18.00 16.1 16.3x 4.4% SWAN
Travel & Leisure
Arts & Entertainment
Direct
LCP
@ Δ [%] Key Ratios
2-Mar YoY PER DY Activity
LOTO ▼ 5.72 68.2 21.6x 4.7% Lotto
ASL ▲ 59.00 57.8 7.3x 6.8% Sports Betting
MEDL ▼ 63.00 4.1 46.3x 2.7% Theme Park (Casela)
Indirect
LCP
@ Δ [%] Key Ratios
2-Mar YoY PER DY Through investment in
GAMMA ▼ 24.65 7.2 10.2x 3.7% LOTO
o Banks MCB, and SBM should be on your watch
list for their attractive PERs. Their lower Loan-
Deposit Ratios than in recent years suggests
room to improve Interest Income once the
economy re-ignites.
o Companies with an appreciable fraction of their
Global Business operations geared towards India
are poised to face turbulent times ahead while
opportunities are expected to be in Africa.
o Gaming companies LOTO and ASL that have
experienced a rough spell following a shift in
Government policies, which appear to have
stabilized.

ECONOMIC OUTLOOK 2017 03-Mar-2017
A: AXYS Stockbroking Ltd, 6th Floor, Dias Pier Building, Le Caudan Waterfront, Caudan, Port-Louis, 11307 12
T: (230) 405 4000 E: [email protected] W: axysstockbroking,com BRN: C07007948
Travel & Leisure
Accommodation & Food Services
Direct
LCP
@ Δ [%] Key Ratios
2-Mar YoY PER DY Activity
NMHL ▲ 20.95 -1.6 ▬ 0.0% Mtius, Sey, Moroc. (★ 4-5+)
LUX ▼ 58.00 -0.8 18.4x 2.0% Indian Ocean, Mid East, China (★ 3-5)
SUN ▲ 39.30 14.7 ▬ 0.0% Mtius, Mdves (★ 4-5)
CHSL ▲ 34.25 6.2 93.6x 1.9% Mtius, Sey, Mdves (★ 5-5+)
SCT ▲ 5.00 -9.1 32.4x 0.0% Mtius (★ 4)
MOLI ▬ 41.20 -1.4 ▬ 0.0% Hilton Mtius (★ 5)
TPL ▼ 6.10 5.5 35.2x 0.9% Indigo {Biz. Hotel} (★ 4-5)
ROGE ▲ 28.75 0.5 68.5x 3.1% VLH & NMHL (★ 3-5)
UTIN ▼ 9.50 -25.4 ▬ 0.0% Attitude (★ 3-5)
Indirect
LCP
@ Δ [%] Key Ratios
2-Mar YoY PER DY Through investment in
HTLS ▼ 30.90 -9.1 56.2x 2.0% CHSL
CIEL ▲ 6.38 -0.3 12.1x 2.8% SUN
MEDL ▼ 63.00 4.1 46.3x 2.7% Tamarina (★ 4)
EUDC ▲ 18.00 16.1 16.3x 4.4% Palmeraie (★ 4)
GAMMA ▼ 24.65 7.2 10.2x 3.7% MOLI
UNSE ▼ 26.00 -23.5 ▬ 0.0% SCT
LFL ▲ 31.50 17.8 7.1x 3.8% TPL
LMLC ▲ 215.00 26.3 9.8x 3.7% TPL
PAD ▲ 97.75 2.9 21.1x 3.3% TPL, MEDL
ENL(P) ▲ 26.00 -4.6 131.4x 3.0% TPL, VLH, NMHL
ENLL ▲ 43.40 -7.7 #### 2.9% NMHL, VLH, TPL
Transport & ICT
Direct
LCP
@ Δ [%] Key Ratios
2-Mar YoY PER DY Activity
MK ▲ 14.55 7.8 1.3x 0.0% Airline
RHT ▬ 25.25 -6.5 68.7x 4.4% Public Transport (Bus)
UBS ▬ 36.35 12.5 9.9x 2.8% Public Transport (Bus)
MFD ▬ 9.84 -6.3 11.1x 2.0% Freeport & Logistics
ROGE ▲ 28.75 0.5 68.5x 3.1% Logistics
IBL ▲ 36.20 48.1 565.8x 1.0% Logistics
Indirect
LCP
@ Δ [%] Key Ratios
2-Mar YoY PER DY Through investment in
PAD ▲ 97.75 2.9 21.1x 3.3% MFD
ENLL ▲ 43.40 -7.7 #### 2.9% ROGE
ENL(P) ▲ 26.00 -4.6 131.4x 3.0% ENLL
o With Tourism having picked up momentum, we
expect hoteliers to improve their bottom lines
through higher room rates in spite of high
indebtedness. On the flip side, weaker EUR and
GBP could impact revenue as will planned
renovations of hotels in the coming low season.
SUN, CHSL, and TPL are likely to experience the
least disruptive low-seasons from renovations.
o Logistics companies MFD, ROGE and IBL
are expected to fare substantially better in
the medium term should the planned
enhancement in port infrastructure
materialize. On the other hand, public
transport companies RHT and UBS could
face rough times if they do not alter their
existing operating models once the Metro
becomes live.

ECONOMIC OUTLOOK 2017 03-Mar-2017
A: AXYS Stockbroking Ltd, 6th Floor, Dias Pier Building, Le Caudan Waterfront, Caudan, Port-Louis, 11307 13
T: (230) 405 4000 E: [email protected] W: axysstockbroking,com BRN: C07007948
Agriculture
Direct
LCP
@ Δ [%] Key Ratios
2-Mar YoY PER DY Activity
CSE ▲ 105.00 2.9 11.9x 4.3% Farming (Sugar, Lifestock)
UNSE ▼ 26.00 -23.5 ▬ 0.0% Farming (Sugar, Crops)
INNO ▲ 40.00 -5.9 17.7x 4.6% Farming (Poultry)
ALTEO ▲ 30.50 8.9 23.8x 2.7% Farming (Sugar)
TERRA ▲ 32.15 5.4 17.4x 2.6% Farming (Sugar)
OMNI ▲ 63.00 -10.6 ▬ 3.2% Farming (Sugar)
MEDL ▼ 63.00 4.1 46.3x 2.7% Farming (Sugar)
ENLL ▲ 43.40 -7.7 #### 2.9% Farming (Sugar) & Foods
ROGE ▲ 28.75 0.5 68.5x 3.1% Farming (Sugar)
Indirect
LCP
@ Δ [%] Key Ratios
2-Mar YoY PER DY Through investment in
ENL(P) ▲ 26.00 -4.6 131.4x 3.0% ENLL & Eclosia
CIEL ▲ 6.38 -0.3 12.1x 2.8% ALTEO
PAD ▲ 97.75 2.9 21.1x 3.3% MEDL
IBL ▲ 36.20 48.1 565.8x 1.0% Fishing + ALTEO
Manufacturing
Staples
Direct
LCP
@ Δ [%] Key Ratios
2-Mar YoY PER DY Activity
INNO ▲ 40.00 -5.9 17.7x 4.6% Dairy & Yogurt
MOR ▲ 28.00 11.1 17.7x 4.6% Edible Oils
PBL ▬ 420.00 16.7 18.5x 2.3% Beverages
QBL ▲ 8.90 34.8 3.4x 11.2% Beverages (Soft only)
LMLC ▲ 215.00 26.3 9.8x 3.7% Flour
LFL ▲ 31.50 17.8 7.1x 3.8% Livestock feeds
MIL ▬ 923.00 0.0 28.7x 2.2% Margarine
SAIL ▲ 18.60 -7.0 3.9x 5.4% Soap & Detergents
MCOS ▬ 25.00 -16.7 ▬ 2.0% Cosmetics
PCCL ▬ 25.00 0.0 6.7x 2.0% Tissue & Toilet Paper
ALTEO ▲ 30.50 8.9 23.8x 2.7% Milling/Refining (Sugar)
TERRA ▲ 32.15 5.4 17.4x 2.6% Milling (Special Sugars)
OMNI ▲ 63.00 -10.6 ▬ 3.2% Milling/Refining (Sugar)
MEDL ▼ 63.00 4.1 46.3x 2.7% Milling (Sugar)
IBL ▲ 36.20 48.1 565.8x 1.0% Fish Processing
Indirect
LCP
@ Δ [%] Key Ratios
2-Mar YoY PER DY Through investment in
IBL ▲ 36.20 48.1 565.8x 1.0% Fishing & Proc. + PBL
PHIN ▲ 268.75 16.8 13.5x 3.1% PBL
CIEL ▲ 6.38 -0.3 12.1x 2.8% ALTEO
o The Primary sector, once the lifeline of Mauritius,
has been relegated to 3rd place. Sugarcane fields
are increasingly being abandoned or turned into
property developments. Although Government is
encouraging growing increasingly “bio” vegetables
locally to ensure subsistence, these are unlikely to
bring in massive profits. Sugarcane farmers,
ALTEO, TERRA, OMNI, MEDL, ENLL, UNSE,
CSE will experience cyclical swings in profitability
in-line with sugar prices. Fishing (IBL) is also a
cyclical activity with Mauritius facing stiff
completion from Latin American and Asian
countries when attempting to penetrate
developed markets.
o Like traders, manufacturers of edible and
household items, MOR, QBL, MIL, SAIL, MCOS,
& PCCL, aimed at the local market are finding it
increasingly difficult to grow margins due to tariff-
free imports produced in SADC/COMESA
increasingly find their way on shelves. Sugar
millers/refiners (ALTEO, TERRA, OMNI) and
seafood companies (IBL) on the other hand face
cyclical up-turns and downturns. While higher
sugar prices bode well for sugar conglomerates,
the end of the EU quota system this year will bring
forth a fresh set of challenges.

ECONOMIC OUTLOOK 2017 03-Mar-2017
A: AXYS Stockbroking Ltd, 6th Floor, Dias Pier Building, Le Caudan Waterfront, Caudan, Port-Louis, 11307 14
T: (230) 405 4000 E: [email protected] W: axysstockbroking,com BRN: C07007948
Manufacturing
Discretionary
Direct
LCP
@ Δ [%] Key Ratios
2-Mar YoY PER DY Activity
CTL ▼ 42.00 6.6 7.0x 7.7% Textiles
PIM ▲ 65.00 4.8 8.8x 5.4% Plastics
GAZ ▲ 65.00 -15.6 19.5x 4.2% Gases (Medical & Industrial)
MCFI ▼ 17.40 -4.1 93.0x 0.0% Fertilizers + CHEM
CHEM ▼ 17.20 1.2 11.4x 6.4% Chemicals
BYCH ▼ 4.02 -19.6 83.1x 2.0% Chemicals
ENLC ▲ 14.30 -19.7 ▬ 0.0% Goods + Bldg Mat
EUDC ▲ 18.00 16.1 16.3x 4.4% Distillery
Indirect
LCP
@ Δ [%] Key Ratios
2-Mar YoY PER DY Through investment in
HML ▼ 66.00 -21.4 63.5x 2.7% MCFI, BYCH, CHEM
UTIN ▼ 9.50 -25.4 ▬ 0.0% Liquid Fertilizers + GAZ
PAD ▲ 97.75 2.9 21.1x 3.3% EUDC
CIEL ▲ 6.38 -0.3 12.1x 2.8% CTL
Trade & Repairs
Direct LCP @ Δ [%] Key Ratios
3-Mar YoY PER DY Activity
INNO ▲ 40.00 -5.9 17.7x 4.6% Foods & Diapers
CMPL ▼ 8.50 -40.5 ▬ 0.0% Supermarket Chain
ENLC ▲ 14.30 -19.2 ▬ 0.0% Car dealerships
ABC ▲ 92.00 8.2 5.7x 2.4% Car dealerships
ACC ▲ 145.50 -4.9 5.6x 2.7% Trye & Spare Parts
MSIL ▬ 30.65 -3.0 7.6x 3.3% Tyre re-threader
VEM ▲ 119.00 32.2 12.3x 2.5% Petrol stations
IBL ▲ 36.20 47.7 565.8x 1.0% Retail (Supermarkets)
TERRA ▲ 32.15 5.4 17.4x 2.6% Specialised stores + HML
HML ▼ 66.00 -21.4 63.5x 2.7% Technology + CMPL
o Manufacturers focusing on exports (CTL) are
hurting from uncertainty in their export markets
and weak currencies while those producing for
the local market (MCFI, CHEM, BYCH, PIM) are
impacted by both slowing demand for their goods
and imports.
o Consumption has been surprisingly resilient in
recent years. Despite a pick-up in inflation, we
expect consumption to maintain its momentum
but will unlikely translate to profits for listed retail
focused entities who have seen margins shrink as
a consequence of an increasingly fractionated
market with more and more players competing
for a limited market.

ECONOMIC OUTLOOK 2017 03-Mar-2017
A: AXYS Stockbroking Ltd, 6th Floor, Dias Pier Building, Le Caudan Waterfront, Caudan, Port-Louis, 11307 15
T: (230) 405 4000 E: [email protected] W: axysstockbroking,com BRN: C07007948
Construction
Direct
LCP
@ Δ [%] Key Ratios
2-Mar YoY PER DY Activity
UBP ▲ 103.00 32.1 19.5x 2.9% Bldg Materials
GAMMA ▼ 24.65 7.2 10.2x 3.7% Bldg Materials & Contracting
BEEP ▲ 17.00 -6.1 ▬ 0.0% Bldg Materials
IBL ▲ 36.20 48.1 565.8x 1.0% Civil Engineering, M&E
ENLL ▲ 43.40 -7.7 #### 2.9% Contracting
FORT ▼ 141.50 1.3 4.0x 5.3% Engineering
Indirect
LCP
@ Δ [%] Key Ratios
2-Mar YoY PER DY Through investment in
TERRA ▲ 32.15 5.4 17.4x 2.6% Rehm Grinaker, Terrarock
HML ▼ 66.00 -21.4 63.5x 2.7% Rehm Grinaker
ENL(P) ▲ 26.00 -4.6 131.4x 3.0% ENLL
Real Estate
Direct
LCP
@ Δ [%] Key Ratios
2-Mar YoY PER DY Through investment in
ASCE ▼ 12.00 -9.8 26.8x 3.2% Retail & Offices
CAUD ▲ 0.99 -2.0 51.9x 0.0% Retail & Offices
CIMO ▼ 429.00 -3.4 13.8x 4.9% Retail
NOVUS ▬ 9.20 22.7 20.8x 4.9% Industrial & Office
APL ▬ 10.00 -0.5 24.4x 6.9% Hotel
COVI ▲ 6.26 0.6 17.9x 0.0% Hotel
UTDL ▲ 56.25 -19.6 59.5x 0.0% Offices & Land
BLFE ▼ 2.28 -34.5 ▬ 0.0% Property Development
ALTEO ▲ 30.50 8.9 23.8x 2.7% Property Development
MEDL ▼ 63.00 4.1 46.3x 2.7% Education focused Smart City
ENLL ▲ 43.40 -7.7 #### 2.9% Property Development
ROGE ▲ 28.75 0.5 68.5x 3.1% Property Development
OMNI ▲ 63.00 -10.6 ▬ 3.2% Airport focused Smart City
TERRA ▲ 32.15 5.4 17.4x 2.6% Upcoming Property Development
Indirect
LCP
@ Δ [%] Key Ratios
2-Mar YoY PER DY Through investment in
CIEL ▲ 6.38 -0.3 12.1x 2.8% ALTEO
PAD ▲ 97.75 2.9 21.1x 3.3% MEDL, CAUD
ENL(P) ▲ 26.00 -4.6 131.4x 3.0% ENLL, ROGE
o Companies producing construction materials
(UBP, GAMMA) and involved in contracting
(GAMMA, ENLL, TERRA, HML) are expected to
see appreciable improvements in coming years.
The timing of the boost is of course a function of
how fast or late Government will green-light the
various projects that have been announced in last
year’s budget.
o REIT-Type “Rental Income” focused companies
(APL, NOVUS, ASCE, COVI, CAUD and CIMO),
including GBL1s, are likely to remain good
sources of yields. In spite of a mushrooming of
malls, rentals are stable if not firming and usually
carry inflation linked escalation clauses.
o Property developers on the other hand
experienced cyclical phases of high losses
followed by an excellent year when the
development is delivered. ENLL and ROGE have
experienced slowing sales in Bel Ombre while
ALTEO is poised to deliver Amalthea in coming
months as will BLFE in Azuri phase 2. All of MEDL,
ENLL, OMNI and TERRA have projects in their
pipelines and are therefore expected to register
the resulting initial losses in coming years.

ECONOMIC OUTLOOK 2017 03-Mar-2017
A: AXYS Stockbroking Ltd, 6th Floor, Dias Pier Building, Le Caudan Waterfront, Caudan, Port-Louis, 11307 16
T: (230) 405 4000 E: [email protected] W: axysstockbroking,com BRN: C07007948
REFERENCES
International Monetary Fund, ‘World Economic Outlook October
2016’, <http://www.imf.org/external/pubs/ft/weo/2016/02/>. [October
2016].
International Monetary Fund, ‘World Economic Outlook Update
January 2017’,
<https://www.imf.org/external/pubs/ft/weo/2017/update/01>. [January
2017].
International Monetary Fund, ‘2015 Article IV Consultation -
Mauritius’, <http://www.imf.org/external/country/mus/>. [March
2016].
Minister of Finance and Economic Development, ‘Budget 2016-
2017’, < http://budget.mof.govmu.org/>. [July 2016].
Statistics Mauritius, ‘Digest of External Trade Statistics 2015’,
<http://statsmauritius.govmu.org/English/StatsbySubj/Pages/External-
Trade.aspx>. [October 2016].
Statistics Mauritius, ‘International Travel & Tourism’,
<http://statsmauritius.govmu.org/English/StatsbySubj/Pages/International
-Travel-and-Tourism.aspx>. [December 2016].
Statistics Mauritius, ‘Labour – Labour Force, Employment and
Unemployment’,
<http://statsmauritius.govmu.org/English/StatsbySubj/Pages/Labour.aspx
>. [May 2016].
Statistics Mauritius, ‘National Account and Investments’,
<http://statsmauritius.govmu.org/English/StatsbySubj/Pages/National-
Accounts.aspx>. [December 2016].
Board of Investment, ‘Speed to Market Scheme’,
<http://www.investmauritius.com/news-room/latest-news/mauritius-
launches-speed-to-market-scheme-to-boost-exports-to-the-european-
union.aspx>. [January 2017].
Board of Investment, ‘BOI issues first Smart City Certificate -
Omnicane’, <http://www.investmauritius.com/news-room/latest-
news/boi-issues-first-smart-city-certificate.aspx>. [September 2016].
Board of Investment, ‘BOI issues Smart City Certificate to Cap
Tamarin Ltée’ & ‘Letter of Intent for City of Moka’,
<http://www.investmauritius.com/news-room/latest-news/boi-issues-
smart-city-certificate-to-cap-tamarin-lt%C3%A9e.aspx>. [October
2016].
Mauritius JinFei Economic Trade and Cooperation Zone Co., Ltd,
‘Obtention of Letter of Intent for Smart City Scheme (SCS)
Certificate’, <http://www.jfjmy.5dlc.com/newsdefault/1996/19176>.
[October 2016].
Defi Media, ‘Projets: Medine investit Rs 1,3 Mddans sa Smart City
en 2017’, <http://defimedia.info/projets-medine-investit-rs-13-
mddans-sa-smart-city-en-2017>. [December 2016].
Defi Media,’16 «smart cities» sur le plan de travail’,
<http://defimedia.info/16-smart-cities-sur-le-plan-de-travail>.
[December 2015].
Bank of Mauritius 2017, ‘Monthly Statistical Bulletin January 2017’,
<https://www.bom.mu/publications-statistics/monthly-statistical-bulletin>.
[January 2017].
Bank of Mauritius 2017, ‘Key Repo Rate February 2017’,
<https://www.bom.mu/repo-rate>. [20 February 2017].
Bank of Mauritius 2017, ‘Consolidated Indicative Exchange Rates’,
<https://www.bom.mu/markets/foreign-exchange/consolidated-
indicative-exchange-rates>. [28 February 2017].
Bank of Mauritius 2017, ‘Government of Mauritius Treasury Bills
(GMTB)’, <https://www.bom.mu/markets/money-markets/gmtb>.
[February 2017].

ECONOMIC OUTLOOK 2017 03-Mar-2017
A: AXYS Stockbroking Ltd, 6th Floor, Dias Pier Building, Le Caudan Waterfront, Caudan, Port-Louis, 11307 17
T: (230) 405 4000 E: [email protected] W: axysstockbroking,com BRN: C07007948
DISCLAIMER
AXYS Stockbroking Ltd has issued this document without
consideration of the investment objectives, financial situation or
particular needs of any individual recipient. Recipients should not
act or rely on any recommendation in this document without
consulting their financial adviser to determine whether the
recommendation is appropriate to their investment of this
document.
This document is not, and should not be construed as, an offer to
sell or the solicitation of an offer to purchase or subscribe for any
investment. This document has been based on information obtained
from sources believed to be reliable but which have not been
independently verified.
AXYS Stockbroking Ltd makes no guarantee, representation or
warranty and accepts no responsibility or liability as to its accuracy
or completeness. AXYS Stockbroking Ltd and its officers, directors
and representatives may have positions in securities mentioned in
this document, or in related investments, and may from time to
time add to or dispose of such securities or investments. AXYS
Stockbroking Ltd is a member of the Stock Exchange of Mauritius
and is licensed by the Financial Services Commission.
AUTHORS
Bhavik Desai
Head of Research
Prerna Cheekhooree
Research Analyst
Alexis Corson
Investment Analyst
ACKNOWLEDGEMENTS
Kugan Parapen
Portfolio Manager
AXYS Investment Partners
Joy D’Souza
Head of Research
ApexAfrica Capital Ltd (part of AXYS Group)
Abizer Shafarali
Senior Research Analyst
ApexAfrica Capital Ltd (part of AXYS Group)
Harrison Ngugi
Research Analyst
ApexAfrica Capital Ltd (part of AXYS Group)
Jason Theeroovengadum
Chief Dealer
AXYS Leasing
Melvyn Chung Kai To
Managing Director
AXYS Stockbroking