Economic losses occurring due to brucellosis in Indian ...
19
1 Postprint This is an Accepted Manuscript of an article published in [Prev Vet Med] in 2015, Available online 23 March 2015 at http://www.sciencedirect.com/science/article/pii/S0167587715001087 (paywalled). Please cite as: Singh, B. B., Dhand, N. K., & Gill, J. P. S. (2015). Economic losses occurring due to brucellosis in Indian livestock populations. Preventive veterinary medicine, 119(3), 211-215. doi: http://dx.doi.org/10.1016/j.prevetmed.2015.03.013 Economic losses occurring due to brucellosis in Indian livestock populations B B Singh a , N K Dhand b and J P S Gill a a School of Public Health & Zoonoses, Guru Angad Dev Veterinary and Animal Sciences University, Ludhiana, Punjab 141004, India b Faculty of Veterinary Science, The University of Sydney, 425 Werombi Road, Camden, 2570 NSW, Australia. *Corresponding author. Tel.: +91 161 2414009; Fax: +91 161 2400822 E-mail address: [email protected] Abstract Brucellosis is a serious public health issue in India. Estimation of economic losses occurring due to brucellosis is required to help formulate prevention and control strategies, but has not been done in India. We estimated economic losses due to brucellosis by sourcing prevalence data from epidemiological surveys conducted in India. Data for livestock populations were obtained from official records. Probability distributions were used for many of the input parameters to account for uncertainty and variability. The analysis revealed that brucellosis in livestock is responsible for a median loss of US $ 3.4 billion (5 th – 95 th percentile 2.8–4.2 billion). The disease in cattle and buffalo accounted for 95.6% of the total losses occurring due to brucellosis in livestock populations. The disease is responsible for a loss of US$ 6.8 per cattle, US$18.2 per buffalo, US$ 0.7 per sheep, US$ 0.5 per goat and US$ 0.6 per pig. These losses are additional to the economic and social consequences of the disease in humans. The results suggest that the disease causes significant economic losses in the country and should be controlled on a priority basis. Keywords: bovine brucellosis; ovine brucellosis; porcine brucellosis; economic loss; India; developing countries; zoonoses; partial budgeting
Transcript of Economic losses occurring due to brucellosis in Indian ...

1
Postprint
This is an Accepted Manuscript of an article published in [Prev Vet Med] in 2015, Available
online 23 March 2015 at http://www.sciencedirect.com/science/article/pii/S0167587715001087 (paywalled).
Please cite as:
Singh, B. B., Dhand, N. K., & Gill, J. P. S. (2015). Economic losses occurring due to brucellosis in Indian livestock populations. Preventive veterinary medicine, 119(3), 211-215. doi: http://dx.doi.org/10.1016/j.prevetmed.2015.03.013
Economic losses occurring due to brucellosis in Indian
livestock populations
B B Singha, N K Dhandb and J P S Gilla
a School of Public Health & Zoonoses, Guru Angad Dev Veterinary and Animal Sciences University, Ludhiana, Punjab 141004, India
bFaculty of Veterinary Science, The University of Sydney, 425 Werombi Road, Camden, 2570 NSW, Australia.
*Corresponding author. Tel.: +91 161 2414009; Fax: +91 161 2400822
E-mail address: [email protected]
Abstract
Brucellosis is a serious public health issue in India. Estimation of economic losses occurring due to brucellosis is required to help formulate prevention and control strategies, but has not been done in India. We estimated economic losses due to brucellosis by sourcing prevalence data from epidemiological surveys conducted in India. Data for livestock populations were obtained from official records. Probability distributions were used for many of the input parameters to account for uncertainty and variability. The analysis revealed that brucellosis in livestock is responsible for a median loss of US $ 3.4 billion (5th–95th percentile 2.8–4.2 billion). The disease in cattle and buffalo accounted for 95.6% of the total losses occurring due to brucellosis in livestock populations. The disease is responsible for a loss of US$ 6.8 per cattle, US$18.2 per buffalo, US$ 0.7 per sheep, US$ 0.5 per goat and US$ 0.6 per pig. These losses are additional to the economic and social consequences of the disease in humans. The results suggest that the disease causes significant economic losses in the country and should be controlled on a priority basis.
Keywords: bovine brucellosis; ovine brucellosis; porcine brucellosis; economic loss; India; developing countries; zoonoses; partial budgeting

2
Highlights
This is the first systematic analysis of the economic losses occurring due to
brucellosis in livestock populations in India.
The analysis revealed that brucellosis in livestock is responsible for a median loss of
US $ 3.4 billion (5th–95th percentile 2.8–4.2 billion).
There is urgent need to formulate intervention policies for prevention and control of
this disease in India.
1. Introduction
First recorded in India in 1887 (IVRI, 1977), brucellosis has now become endemic throughout the country with prevalence of the disease ranging from 6.5% to 16.4% in different species of livestock (Aulakh et al., 2008; Kollannur et al., 2007; Lone et al., 2013; Shome et al., 2006; and Thoppil, 2000). Many factors such as absence of a control policy, failure to vaccinate young female calves, non implementation of test and slaughter, ban on cow slaughter in many Indian states, absence of treatment regimen and usual practice of selling positive reactor animals to other farmers are responsible for the spread of this disease among livestock in India.
The disease is a serious occupational hazard for humans, and has been found to be associated with farm workers, veterinarians, veterinary pharmacists, animal attendants, abattoir workers and laboratory attendants (Young, 1983). The seroprevalence of the disease in India has been found to be as high as 6.3% in veterinarians, 7.9% in veterinary pharmacists, 8.8% in animal attendants, 20.0% in laboratory workers, 10.5% in dairy farmers and 6.4% in abattoir workers (Bedi et al., 2007; Deepthy et al., 2013).
Brucellosis is being considered as an important economic concern (ILRI, 2012) with losses occurring in the human, livestock and wildlife populations. However, most data and evidence on the economic burden of brucellosis and benefits of its control are from the developed world even though the losses are believed to be higher in the developing countries (McDermott et al., 2013). The present paper presents economic losses occurring due to brucellosis in India.
2. Methods Losses occurring due to brucellosis as per Bennett (2003) and McInerney, (1996)
were estimated for sheep, goat, cattle, buffalo and pigs. The disease prevalence data were obtained from serological surveys (Aulakh et al., 2008; Kollannur et al., 2007; Lone et al., 2013; Shome et al., 2006; Thoppil, 2000) and livestock population data from official records (Table 1–supplementary material) (DAHD & F, 2010). Many input parameters such as decrease in carcass weight, milk production and draught power, life expectancy and reproductive rates were obtained from the published scientific literature (Table 1–supplementary material). The prices of animal carcasses and milk were obtained through market surveillance or from published scientific literature (Table 2–supplementary material). All the analyses were conducted using R-statistical program (R statistical package version 3.0.1. R Development Core Team, http://www.r-project.org). The detailed assumptions and the equations used in the analysis are presented as supplementary material in Tables 1 and 3, respectively.

3
Table 1. Total losses associated with brucellosis in livestock in India estimated in
the study
Species Type of losses Million US Dollars (1 US $ = Rs.
60/-)
Median 5th
– 95th
percentile
Sheep Production losses 44.9 41.3 – 48.8
Product losses 2.2 0.6 – 3.6
Foregone losses due to fecundity
reduction
0.8 0.2 – 1.7
Death losses 1.0 0.5 – 1.7
Total losses 48.9 44.7– 53.6
Goat Production losses 57.0 44.4– 72.4
Product losses 9.2 6.0– 13.2
Foregone losses due to fecundity
reduction
3.4 1.00 – 7.0
Death losses 1.8 0.9– 3.3
Total losses 71.6 55.6– 91.4
Cattle Production losses 736.2 687.0– 788.6
Product losses 291.3 152. 7 – 469.8
Foregone losses due to fecundity
reduction
129.7 39.3– 280.4
Death losses 185.5 86.9– 367.8
Total losses 1357.1 1077.7– 1742.4
Buffalo Production losses 986.6 739.7 – 1265.8
Product losses 561.7 337.6– 878.7
Foregone losses due to fecundity
reduction
145.7 42.6– 319.5
Death losses 209.9 97.5– 421.2
Total losses 1918.3 1374.2– 2651.8
Pig Production losses 3.8 3.1 – 4.5
Product losses 1.8 0.5 – 3.1

4
Foregone losses due to fecundity
reduction
1. 5 0. 5 – 2.8
Death losses 0.1 0.1 – 0.2
Total losses 7.1 5.2 – 9.5
Total
Losses
3425.3 2788.7 – 4239.0
Production losses for each species were calculated as losses occurring due to abortion in pregnant animals (equations 1 to 5), sterility (equation 6) and temporary infertility in animals that aborted (equations 7–8). Losses for each species were added to estimate total animal production losses.
Product losses were estimated by estimating and adding the losses due to decrease in milk production and carcass weight. Losses in milk production were estimated for the cattle, buffalo and goat industries as shown in equations 9-13 and then added. The losses in carcass weight were estimated for all the selected species considering the number of infected animals being slaughtered and the reduction in carcass weight (equations 14 - 17).
Forgone production due to fecundity reduction was estimated by accounting for foregone meat, milk and draught power in cattle; foregone milk and meat in buffalo; foregone milk and meat in goat; foregone meat and wool in sheep and foregone meat in pigs (see equations 18 – 41). To avoid double counting of losses, we only estimated foregone losses in the 85% of the breedable infected females that did not abort or become sterile but were infected with Brucella species. Foregone draught power for bull cattle was estimated by calculating the time required for an animal to cultivate a hectare of land and using market values for rent charged by tractor owner to work one hectare of land. This enabled us to estimate the cost of average draught power equivalence bull cattle per hour which was extrapolated to estimate draught energy produced per animal over lifetime.
Death losses included losses due to peri natal mortality in young animals and mortality in adult animals that aborted. The numbers of young ones with peri natal mortality were estimated as per equation 42 for each species. For estimating losses occurring due to death of adult females, the losses for the remaining productive life of the animal were estimated similar to the estimation of foregone losses due to unborn animals. Total producer losses due to death in animals for each species were estimated and summed up to estimate total producer losses due to death in all the livestock populations.
Beta probability distributions were applied to account for uncertainties in the prevalence of livestock brucellosis. Uniform distributions were used for estimating number of aborted animals, aborted animals that become sterile, perinatal mortality and mortality rate in aborted animals which are infected with brucellosis (Bernues et al., 1997). We also applied triangular distributions for estimating decrease in fecundity, carcass weight, milk production, draught power and wool output. To estimate actual farmer profits due to decrease in fecundity, uniform distributions were applied in the range of 10-20% as benefits could vary under different rearing conditions. The 5th and 95th percentiles for the estimates were calculated by running Monte Carlo simulations for 10,000 iterations.
3. Results Results presented in Table 1 suggest that brucellosis caused a loss of US $ 3.4 billion
in total (Fig. 1). The losses in cattle and buffalo industries accounted for 95.6% of the total

5
losses. The median production losses due to abortions, temporary infertility and sterility in adult animals were found to be US $ 735.7 million and US $ 985.4 million in cattle and buffalo, respectively. These losses significantly contributed towards losses occurring in cattle and buffalo industries. The loss in meat and milk resulted in a loss of US $ 292.9 million and US $ 557.1 in cattle and buffalo industries. The loss in meat resulted in a median loss of US $ 1.8 million in pig industry. Foregone milk, meat and draught power due to reduction in fecundity resulted in a median loss of US $ 131.7 million in the cattle industry. Foregone milk and meat due to reduction in fecundity in buffalo resulted in a median loss of US $ 145.8 million in buffalo industry. A median loss of 185.4 million and 210.8 million occurred due to death of adult animals and peri natal mortality in cattle and buffalo, respectively. The disease was found to be responsible for a loss of US$ 6.8 per cattle, US$18.2 per buffalo, US$0.7 per sheep, US$ 0.5 per goat and US$ 0.6 per pig in India.
Figure 1. Distributions of the losses due to brucellosis in India estimated in the study (in US dollars) (supplementary material).

6
4. Discussion
This is the first systematic analysis of economic losses occurring due to brucellosis in livestock populations in India. The losses were found to be as much as 18.7 times higher than that reported for cystic echinococcosis in livestock species in previous studies (Singh et al., 2014). Brucellosis is also a serious economic concern in several other countries (Samartino, 2002, Roth et al. 2003, Santos et al., 2013) suggesting that brucellosis causes huge economic losses in the developing countries.
The decrease in milk production most significantly contributed towards foregone production due to fecundity reduction associated with brucellosis. This is a serious issue as a large Indian human population is dependent on the dairy industry for their livelihood. On the other hand, losses in the cattle meat industry were fairly low. As discussed in the previous studies, this disparity is due to ban on cow slaughter in most of the Indian states (Singh et al., 2014).
We selected prevalence estimates from the peer reviewed literature. The disease is endemic in India and the animal husbandry, production and management practices are almost similar throughout the country. As per a report of International Livestock Research Institute, 2011 (cited in Mcdermott et al., 2013), a brucellosis prevalence of 16.0 % has been reported for ruminants in South Asia which is comparable to the data used for bovine brucellosis in the present study. Many other studies have also reported comparable prevalence of the disease throughout the country. For example, a prevalence of 11.9% of bovine brucellosis has been reported from Gujarat, western India (Patel et al., 2014). Similarly, prevalence of Brucella antibodies by an avidin biotin enzyme-linked immune sorbent assay was found to be 12.1% (true prevalence, 11.2%) in cattle and buffalo populations in Punjab state of north India (Dhand et al., 2005). A south Indian study reported a bovine brucellosis prevalence of 18.4% using milk ring test (Mohamand et al., 2014). Thus, although not perfect, we believe that our data are the best available estimates of disease prevalence in the country. Sensitivity and specificity information about the diagnostic tests used was not generally available from the papers from which we sourced prevalence information. Therefore we used apparent, rather than true prevalence, for estimation of losses. Using sensitivity and specificity information of ‘similar’ tests from some secondary sources indicated that the true prevalence would have been higher in buffaloes and lower in all other species compared to the apparent prevalence. Therefore, the losses estimated would be different using true prevalence estimates but could not be estimated in this study. Most of the data were sourced from studies conducted in India or from official records in India and only data that was unavailable in India was sourced from overseas. However, we believe these values to be quite reasonable and applicable under present Indian conditions. For example Hugh Jones et al. (1975) carried out an assessment of eradication of bovine brucellosis in England and Wales in 1975. The assumptions in that study were used in the current analysis. The prevalence of positive reactors in England and Wales in 1973 was believed to be 11.5% (Hugh Jones et al., 1975) which is quite similar to present prevalence of bovine brucellosis in India. Similarly, we also sourced some of the data for assumptions from the studies carried out in California 25-40 years ago (Carpenter, 1976). These assumptions have also been used in estimating losses occurring due to brucellosis in New Zealand (Shepherd et al., 1982). The abortions attributable to Brucella infections were common in New Zealand in 1960s (Moller, 1967) and serological surveys at that time indicated that infection was widespread in cattle populations (Adlam, 1978). The current situation of bovine brucellosis in India is not very different to these countries some 40-50 years ago. The Indian dairy industry and production system is still believed to be 40-50 years behind the developed countries and dairying being carried out under the primitive conditions. We believe that further studies should be carried out for refinement of these losses once more data about brucellosis epidemiology is available from India. For example, we would like to obtain more accurate estimates of number of females that abort, females that show temporary infertility and fecundity reduction so as to refine and more accurately predict losses occurring due to brucellosis in livestock populations in India.

7
To account for variability and uncertainty, we applied uniform distribution for estimating number of aborted animals, aborted animals that become sterile, perinatal mortality and mortality rate in aborted animals as we believe that losses will be uniformly distributed over the entire distribution. The uniform distributions have also been previously applied in studies done to estimate production losses for other diseases (Benner et al., 2010; Budke et al., 2005). We applied triangular distributions for estimating decrease in fecundity, carcass weight, milk production, draught power and wool output as extreme values were considered less likely. In addition, we used beta probability distributions in prevalence estimates. The beta probability distributions are routinely used to account for variability and uncertainty in prevalence estimates.
In India, brucellosis has also been reported from pet animals (Renukardhaya et al., 2002). High sero-prevalence of brucellosis has been reported in wild animals such as yaks (Poephagus grunniens) (Bandyopadhyay et al., 2009). The losses occurring due to brucellosis in these animals could not be estimated. Therefore, we believe our estimates are an underestimate of actual losses occurring among animals in India. Additionally, huge health, psychological and socioeconomic losses also occur among humans which could not be accounted in the present study but are planned to be evaluated in a future study.
4. Conclusion
For the first time, a systematic analysis of economic losses occurring due to brucellosis has been undertaken in India. Although losses from most other livestock diseases have not been estimated and a risk ranking or for all livestock diseases has not been performed, the economic losses estimated in the present study clearly provide the evidence that brucellosis is a serious concern in India and that there is urgent need to formulate policies for prevention and control of this disease in the country.
Conflict of interest statement
No financial or personal relationships between the authors and other people or organizations have inappropriately influenced (bias) this work.
Acknowledgements
The authors wish to thank two anonymous reviewers for their valuable comments.
References
Adlam, G.H., 1978. The eradication of bovine brucellosis in New Zealand: history and objectives. NewZealand. Vet. J., 26 (3), 42-43.
Aulakh, H. K., Patil, P. K., Sharma, S., Kumar, H., Mahajan, V., Sandhu, K. S., 2008. A Study on the epidemiology of bovine brucellosis in Punjab (India) using Milk-ELISA. Acta. Vet. Brno. 77, 393-399.
Bandyopadhyay, S., Sasmal, D., Dutta, T.K., Ghosh, M.K., Sarkar, M., Sasmal, N.K., Bhattacharya, M., 2009. Seroprevalence of brucellosis in yaks (Poephagus grunniens) in India and evaluation of protective immunity to S19 vaccine. Trop. Anim. Health. Prod. 41, 587–592.
Banerjee, G.C. (Ed.), 1991. A text book of animal husbandry. Seventh Edn, Oxford & IBH Publishing Pvt. Ltd., Kolkata.

8
Bedi, J.S., Sharma, J.K., Gill, J.P.S., Aulakh, R.S., Sharma, C.S., Gupta, V.K., 2007. Seroepidemiological survey of Brucella agglutinins in animal handlers in Punjab, India. Indian. J. Anim. Sci. 77 (12), 1283-1285.
Benner, C., Carabin, H., Serrano, L.P.S., Budke, C.M., Carmena, D., 2010. Analysis of the economic impact of cystic echinococcosis in Spain. Bull. World. Health. Organ. 88, 49-57.
Bennett, R., 2003. The 'Direct Costs' of Livestock Disease: The Development of a System of Models for the Analysis of 30 Endemic Livestock Diseases in Great Britain. J. Agr. Econ., 54 (1), 55-71.
Bernues, A., Manrique, E., Maza, M.T., 1997. Economic evaluation of bovine brucellosis and tuberculosis eradication programmes in a mountain area of spain. Prev. Vet. Med. 30, 137 – 149.
Budke, C.M., Jiamin, Q., Qian, W., Torgerson, P.R., 2005. Economic effects of echinococcosis in a disease endemic region of the Tibetan Plateau. Am. J. Trop. Med. Hyg. 73(1), 2-10.
Carpenter, T.E., 1976. The application of benefit cost analysis to compare alternative approaches to the brucellosis problem in California. In: New techniques in veterinary epidemiology and economics. Reading.
DAHD & F, 2010. Basic Animal Husbandry Statistics. Department of Animal Husbandry, Dairying & Fisheries, Ministry of Agriculture, Governmentof India.
Deepthy, B.J., Sreejit, K., Jisha, P., Ravindran, P.C., 2013. Sero epidemiology of brucellosis among high risk occupational groups by conventional methods and indirect enzyme linked immunosorbent assay. Int. J. Curr. Res. 5 (10), 3195-3198.
Dhand, N.K., Gumber, S., Singh, B.B., Aradhana, Bal, M.S., Kumar, H., Sharma, D.R., Singh, J., Sandhu, K.S., 2005. A study on the epidemiology of brucellosis in Punjab (India) using Survey Toolbox. Rev. sci. tech. Off. Int. Epiz., 24 (3), 879-885.
Gomez, J., 1986. La brucellosis en La ganaderia de Almeria. In: Primeras jornadas Sobre Brucelosis, Colegio Oficial de veterinaries de Almeria, Almeria.
Hugh-Jones, M.E., Elllis, P.R., Felton, M.R., 1975. An assessment of the eradication of bovine brucellosis in England and Wales. University of Reading, Department of Horticulture and Agriculture, pp 75.
International Livestock Research Institute (ILRI), Institute of Zoology, Hanoi School of Public Health. 2012. – Mapping of poverty and likely zoonoses hotspots. Zoonoses Project 4. Report to the Department for International Development, UK. ILRI, Nairobi. Available at: www.dfid.gov.uk/r4d/Output/190314/Default.aspx (accessed on 5 July 2012).
IVRI., 1977. Indian veterinary research institute working document on brucellosis. FAO/WHO/National Brucellosis Reference Centre, Division of Veterinary Public Health, IVRI, Izatnagar, India, 1 – 93.
Kollannur, J.D., Rathore, R., Chauhan, R.S., 2007. Epidemiology and economics of brucellosis in animals and its zoonotic significance. ISAH. tartu. Estonia. 466-468.
Lone, I.M., Baba, M.A., Shah, M.M., Iqbal, A., Sakina, A., 2013. Seroprevalence of brucellosis in sheep of organized and unorganized sector of Kashmir valley. Vet. World. 6(8), 530-533, doi:10.5455/vetworld.2013.530-533.
McDermott, J., Grace, D., Zinsstag, J., 2013. Economics of brucellosis impact and control in low-income countries. Rev. sci. tech. Off. int. Epiz. 32 (1), 249-261.

9
McInerney, J. P., 1996. Old Economics for New Problems - Livestock Disease: Presidential Address. J. Agr. Econ., 47, 295-314.
Mohamand, N., Gunaseelan, L., Sukumar, B., Porteen, K., 2014. Milk Ring Test for spot identification of Brucella abortus infection in single cow herds. J. Adv. Vet. Anim. Res., 1(2), 70-72.
Moller, K., Newling, P.E., Robson, H.J., Hansen, G.J., Meursinge, J. A., 1967. A survey of abortions and long return intervals in dairy herds in the Huntly district. NewZealand. Vet. J., 15 (8), 137-142.
NABARD, 2010. Model Bankable Projects – Animal Husbandry. National Bank for Agriculture and Rural Development, Government of India.
Patel, M.D., Patel, P.R., Prajapati, M.G., Kanani, A.N., Tyagi, K.K., Fulsoundar, A.B., 2014. Prevalence and risk factor's analysis of bovine brucellosis in peri-urban areas under intensive system of production in Gujarat, India. Vet. World., 7(7), 509-516.
Phaniraja, K.L., Panchasara, H.H., 2009. Indian draught animals power. Vet. World., 2(10), 404-407.
Ranjan, S. K., Rawat, A.S., 2011. Indian meat industry red meat manual (Annexure VI). Published by Agricultural & Processed Food Products Expert Development Authority, Government of India.
Renukardhya, G.J., Isloor, S., Rajasekhar, M., 2002. Epidemiology, zoonotic aspects, vaccination and control/eradication of brucellosis in India. Vet. Microbiol. 90, 183-195.
Roth, F., Zinsstag, J., Orkhon, D., Chimed-Ochir, G., Hutton, G., Cosivi, O., Carrin, G., Otte, J., 2003. Human health benefits from livestock vaccination for brucellosis: case study. Bull. World. Health. Organ. 81, 867-876.
Samartino, L.E., 2002. Brucellosis in Argentina. Vet. Microbiol. 90, 71-80.
Santos, R.L., Martins, T.M., Borges, A.M., Paixão, T.A., 2013. Economic losses due to bovine brucellosis in Brazil. Pesquisa. Veterinária. Brasileira. 33(6), 759-764.
Shepherd, A.A., Simpson, B.H., Davidson, R.M., 1982. An economic evaluation of the New Zealand bovine brucellosis eradication scheme. Tech. Series. OIE. 3, 69-78.
Shome, R., Shome, B.R., Deivanai, M., Desai, G.S., Patil, S.S., Bhure, S.K., Prabhudas, K., 2006. Seroprevalence of brucellosis in small ruminants. Indian. J. Compar. Microbiol. Immunol. Infect. Dis. 27 (1), 13-15.
Singh, B.B., Dhand, N.K., Ghatak, S., Gill, J.P.S., 2014. Economic losses due to cystic echinococcosis in India: Need for urgent action to control the disease. Prev. Vet. Med. 113 (1), 1-12.
Thoppil, S.T., 2000. Serodiagnosis of brucellosis in pigs and man and differentiation of cross reactions due to Yersinia enterocolitica O:9. M.V.Sc. thesis submitted to the University of Agricultural Sciences, Bangalore, India.
Wright, I.A., Deka, R., Thorpe, W., Lapar, M.L., 2010. The pig sector in northeast India: status, constraints and oppurtunities. International symposium on Sustainable land use and rural development in mountainous regions of southeast Asia, Honoi.
Young, E.J., 1983. Human brucellosis. Rev. Infect. Dis. (5), 821–842.

10
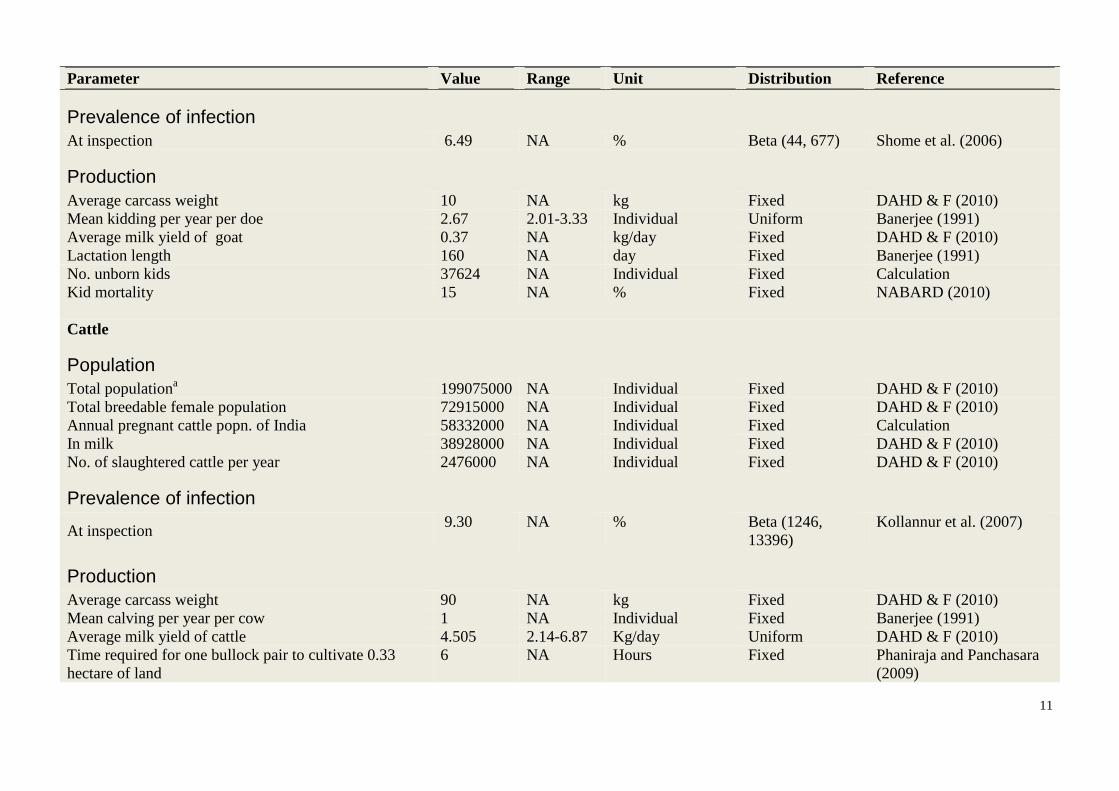
Table 1. Supplementary material
Epidemiological parameters used to estimate the economic losses associated with brucellosis in livestock, India
Parameter Value Range Unit Distribution Reference
Sheep
Population
Total population 71558000 NA Individual Fixed DAHD & F (2010)
Total breedable female population 53684000 NA Individual Fixed DAHD & F (2010)
Annual pregnant sheep popn. of India 42947200 NA Individual Fixed Calculation
No. of sheep slaughtered per year 23269000 NA Individual Fixed DAHD & F (2010)
Prevalence of infection
Prevalence of infection 6.50 NA % Beta (430, 6615) Lone et al. (2013)
Production
Sheep carcass 13 kg Fixed DAHD & F (2010)
Wool per Sheep 1.0 NA Kg/year Fixed Banerjee (1991)
Mean lambing per year per ewe 1.25 0.9-1.6 Individual Uniform Banerjee (1991)
No. unborn lambs 82304 NA Individual Fixed Calculation
Lamb mortality rate 10 NA % Fixed NABARD (2010)
Goats
Population
Total populationa 140537000 NA Individual Fixed DAHD & F (2010)
Total breedable female 62489000 NA Individual Fixed DAHD & F (2010)
Annual pregnant goat popn. of India 49991200 NA Individual Fixed Calculation
In milk 28868000 NA Individual Fixed DAHD & F (2010)
No. of goats slaughtered per year 50707000 NA Individual Fixed DAHD & F (2010)
11
Parameter Value Range Unit Distribution Reference
Prevalence of infection
At inspection 6.49 NA % Beta (44, 677) Shome et al. (2006)
Production
Average carcass weight 10 NA kg Fixed DAHD & F (2010)
Mean kidding per year per doe 2.67 2.01-3.33 Individual Uniform Banerjee (1991)
Average milk yield of goat 0.37 NA kg/day Fixed DAHD & F (2010)
Lactation length 160 NA day Fixed Banerjee (1991)
No. unborn kids 37624 NA Individual Fixed Calculation
Kid mortality 15 NA % Fixed NABARD (2010)
Cattle
Population
Total populationa 199075000 NA Individual Fixed DAHD & F (2010)
Total breedable female population 72915000 NA Individual Fixed DAHD & F (2010)
Annual pregnant cattle popn. of India 58332000 NA Individual Fixed Calculation
In milk 38928000 NA Individual Fixed DAHD & F (2010)
No. of slaughtered cattle per year 2476000 NA Individual Fixed DAHD & F (2010)
Prevalence of infection
At inspection 9.30 NA % Beta (1246,
13396)
Kollannur et al. (2007)
Production
Average carcass weight 90 NA kg Fixed DAHD & F (2010)
Mean calving per year per cow 1 NA Individual Fixed Banerjee (1991)
Average milk yield of cattle 4.505 2.14-6.87 Kg/day Uniform DAHD & F (2010)
Time required for one bullock pair to cultivate 0.33
hectare of land
6 NA Hours Fixed Phaniraja and Panchasara
(2009)

12
Parameter Value Range Unit Distribution Reference
Percentage of females reared for milk 100 NA % Fixed Singh et al. (2014)
Percentage of male population slaughtered 5 NA % Fixed Singh et al. (2014)
Percentage of male population used for draught power 30 NA % Fixed Singh et al. (2014)
Calf mortality 5 NA % Fixed NABARD (2010)
No. of unborn calves 216157 NA Individual Fixed Calculation
Average working hrs per year per draught cattle 360 NA hr Fixed Calculation
Buffalo
Population
Total populationa 105343000 NA Individual Fixed DAHD & F (2010)
In milk 35479000 NA Individual Fixed DAHD & F (2010)
Breedable Female population 54475000 NA Individual Fixed DAHD & F (2010)
Annual pregnant buffalo popn. of India 43580000 NA Individual Fixed Calculation
No. of slaughtered Buffalo per year 5884000 NA Individual Fixed DAHD & F (2010)
Prevalence of infection
At inspection 16.41 NA % Beta (32, 195) Aulakh et al. (2008)
Production
Average carcass weight 106 NA kg Fixed DAHD & F (2010)
Mean calving per year 1 NA Individual Fixed Banerjee (1991)
Average milk yield of dairy buffalo 4.57 NA Kg/day Fixed DAHD & F (2010)
No. of unborn calves 130631 NA Individual Fixed Calculation
Calf mortality 5 NA % Fixed NABARD (2010)
Pigs
Population
Total populationa 11134000 NA Individual Fixed DAHD & F (2010)
No. of pigs slaughtered 6746000 NA Individual Fixed DAHD & F (2010)
Total no. of breedable female 3055000 NA Individual Fixed DAHD & F (2010)

13
Parameter Value Range Unit Distribution Reference
Annual pregnant sow popn. of India 2444000 NA Individual Fixed Calculation
Prevalence of infection
At inspection 9.50 NA % Beta (72, 756) Thoppil (2000)
Production
Average weight of pig carcass 35 NA kg Fixed DAHD & F (2010)
Mean no. of piglets per year 16 NA Individual Fixed Banerjee (1991)
No. of unborn pigs 83072 NA Individual Fixed Calculation
Piglet mortality 20 NA % Fixed NABARD (2010)
Productivity losses – all livestock (assumptions) Percentage of abortion in infected animals 0.15 0.10- 0.20 % uniform Bernues et al. (1997);
Hugh Jones et al. (1975);
Carpenter (1976);
Shepherd et al. (1982);
Gomez (1986);
Murillo (1989)
Percentage of aborted animals which become sterile 0.2 0.10-0.30 % uniform
Mortality risk in aborted animals 0.01
0.005-
0.015 % uniform
Percentage of peri natal mortality in young ones from
infected animals 0.10 0.05-0.15 % Triangular
Decrease in milk production 0.15 0.10-0.20 % Triangular
Decrease in carcass weight 0.05 0.0-0.10 %
Temporary infertility in infected animals 2 NA Months Fixed Hugh Jones et al. (1975)
Decrease in fecundity 5.5 0.0–11.0 % decrease per
year
Triangular Singh et al. (2014)
Decrease in draught power output 2 0.0–4.0 % decrease per
year
Triangular Singh et al. (2014)
Decrease in wool output 2.5 0.0–5.0 % decrease per
year
Triangular See text
Productive lifespan 35 NA % of average
lifespan
Fixed See text
Farmer’s benefit from unborn animal produce 15 10 – 20 % Uniform See text
14
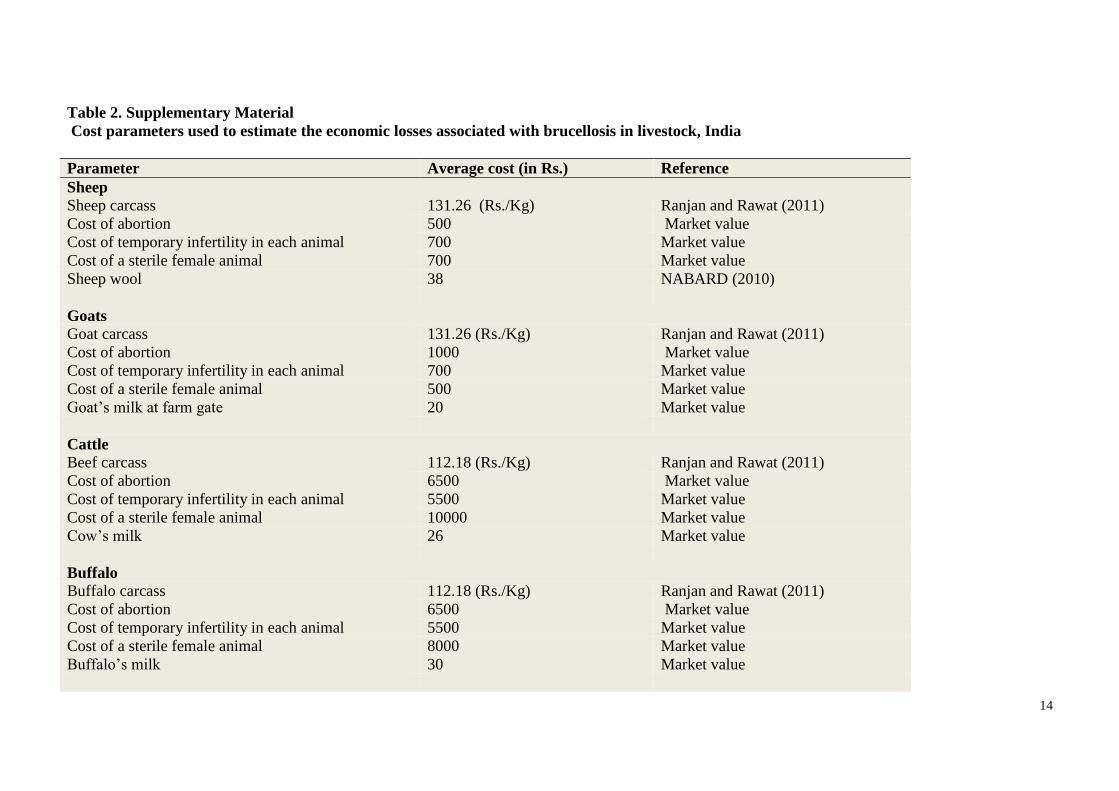
Table 2. Supplementary Material
Cost parameters used to estimate the economic losses associated with brucellosis in livestock, India
Parameter Average cost (in Rs.) Reference
Sheep Sheep carcass 131.26 (Rs./Kg) Ranjan and Rawat (2011)
Cost of abortion 500 Market value
Cost of temporary infertility in each animal 700 Market value
Cost of a sterile female animal 700 Market value
Sheep wool 38 NABARD (2010)
Goats Goat carcass 131.26 (Rs./Kg) Ranjan and Rawat (2011)
Cost of abortion 1000 Market value
Cost of temporary infertility in each animal 700 Market value
Cost of a sterile female animal 500 Market value
Goat’s milk at farm gate 20 Market value
Cattle Beef carcass 112.18 (Rs./Kg) Ranjan and Rawat (2011)
Cost of abortion 6500 Market value
Cost of temporary infertility in each animal 5500 Market value
Cost of a sterile female animal 10000 Market value
Cow’s milk 26 Market value
Buffalo Buffalo carcass 112.18 (Rs./Kg) Ranjan and Rawat (2011)
Cost of abortion 6500 Market value
Cost of temporary infertility in each animal 5500 Market value
Cost of a sterile female animal 8000 Market value
Buffalo’s milk 30 Market value

15
Pigs Pig carcass 95 (Rs./Kg) Wright et al. 2010
Cost of abortion 500 Market value
Cost of temporary infertility in each animal 700 Market value
Cost of a sterile female animal 500 Market value
Rent charged by tractor owner to work one hectare of
land
1125 (Rs.) Market value
Table 3. Supplementary Material
Equations used for estimating losses occurring due to brucellosis in livestock populations in India.
Losses due to brucellosis in livestock populations
Animal Production Losses
Losses due to abortions
Pregnant population of India = Total breedable female livestock population of India × 0.8 ...
(1)
Total pregnant population infected with
brucellosis = Pregnant population of India × prevalence of infection
...
(2)
Number of deaths among infected animals that
aborted =
Total pregnant population infected with brucellosis × proportion of animals aborted ×
mortality risk in aborted animals ...(3)
Number of survivors among infected animals
that aborted =
Total pregnant population infected with brucellosis – Number of deaths among infected
animals that aborted
...
(4)
Losses due to abortions occurring due to
brucellosis = Number of survivors among infected animals that aborted × cost of each abortion
...
(5)
Losses due to sterility in animals that aborted

16
Losses due to sterility in aborted animals = Total pregnant population aborted due to brucellosis x proportion of aborted animal which
become sterile x replacement cost of a sterile animal
...
(6)
Losses due to temporary infertility in animals
Total breedable female population infected
with brucellosis = Total breedable female population of India per year × prevalence of infection
...
(7)
Losses due to temporary infertility in animals = Total breedable female population infected with brucellosis x cost of temporary infertility in
each animal
...
(8)
Animal Product Losses
Losses in milk production
Number of infected ‘in milk’ animals = Total number of female animals in milk × Prevalence of infection . (9)
Milk production per animal per lactation = Average milk production per animal per day × lactation length (days) .
(10)
Milk loss per animal per annum due to
brucellosis =
Milk production per animal per lactation × Proportional reduction in milk production due to
brucellosis per year
.
(11)
Milk loss due to brucellosis = Milk loss per animal due to brucellosis × Number of infected ‘in milk’ animals .
(12)
Cost of lost milk in animals = Total milk loss due to brucellosis × Price of milk .
(13)
Losses in carcass weight
Number of infected animal slaughtered per
year = Number of animal slaughtered per year × Prevalence of infection at inspection
...
(14)

17
Loss of carcass weight per animal due to
brucellosis = Average weight of carcass × Proportional reduction in carcass weight
...
(15)
Total loss of carcass weight = Number of infected animal slaughtered per year × Loss of carcass weight per animal due to
brucellosis
...
(16)
Cost of carcass weight loss in animals = Total loss of carcass weight × Price of meat ...
(17)
Forgone production due to fecundity reduction
Number of infected breedable females = Total breedable female population × Prevalence of infection at inspection ...
(18)
Number of infected breedable females having
fecundity reduction
Number of infected breedable females – Total pregnant livestock population aborted due to
brucellosis
...
(19)
Number of unborn offspring = Number of infected breedable females having fecundity reduction × Mean numbers of
offspring per year per animal × Decrease in fecundity
...
(20)
Number of unborn offspring that would have
survived = Unborn offspring × (1 – Newborn offspring mortality rate)
...
(21)
Number of unborn offspring infected with
brucellosis = Unborn offspring that would have survived × Prevalence of infection at inspection
...
(22)
Number of healthy unborn offspring without
brucellosis = Unborn offspring that would have survived – Unborn offspring infected with brucellosis
...
(23)
Number of unborn male or female offspring
without brucellosis = Healthy unborn offspring without brucellosis × Percentage of male or female offspring born
...
(24)
Foregone meat
Number of unborn male offspring without
brucellosis that would have been slaughtered =
Unborn male offspring without brucellosis × Proportion of male animals that undergo
slaughter
...
(25)
Productive lifespan = Average lifespan × proportion of lifespan in production ...

18
(26)
Meat loss due to brucellosis = Healthy unborn male offspring without brucellosis that would have been slaughtered ×
Average weight of carcass
...
(27)
Cost of lost meat = Meat loss due to brucellosis × Price of meat ...
(28)
Foregone draught power
Unborn male offspring without brucellosis
that would have been used for draught =
Unborn male offspring without brucellosis × Proportion of male animals used for draught
purpose
...
(29)
Average draught power equivalence bull cattle
per hour =
Rent charged by tractor owner to work one hectare of land/ Time required by one bull cattle
to cultivate same piece of land
...
(30)
Draught energy produced per animal over
lifetime =
Average draught power equivalence bull cattle per hour × Working hours per year per
animal x Productive lifespan
...
(31)
Total cost of lost draught power = Draught energy produced per animal over lifetime × Healthy unborn male offspring without
brucellosis that would have been used for draught purposes
...
(32)
Foregone milk
Milk produced per animal over lifetime = Milk produced per animal per lactation × Productive lifespan ...
(33)
Total milk loss from unborn healthy female
offspring =
Milk produced per animal over lifetime × Healthy unborn female offspring without
brucellosis
...
(34)
Cost of lost milk = Total milk loss from unborn healthy female offspring × Price of milk ...
(35)

19
Foregone wool
Wool produced per animal over lifetime = Productive lifespan × Average wool produced per animal/year ...
(36)
Wool loss due to brucellosis = Healthy unborn offspring without brucellosis × wool produced per animal over lifetime ...
(37)
Cost of lost wool = Wool loss due to brucellosis × Price of wool ...
(38)
Total foregone production due to fecundity reduction
Losses from healthy unborn offspring without
brucellosis = cost of lost meat + cost of lost draught power + cost of lost milk + cost of lost wool
...
(39)
Losses due to fecundity reduction = Losses from healthy unborn offspring without brucellosis + Losses from healthy unborn
offspring with brucellosis
...
(40)
Actual loss in farmers' profit due to fecundity
reduction = Total loss due to fecundity reduction × farmer’s profit percentage
...
(41)
Death losses
Peri natal mortality in young animals
Number of young ones with peri natal
mortality =
Total brucellosis infected pregnant female population not aborted x peri natal mortality risk
in young ones born from infected animals
...
(42)