Economic Integration in Europe: Its Effects on Canadaeconomics.ca/2005/papers/0253.pdf · Economic...
52
Economic Integration in Europe: Its Effects on Canada Richard Cameron Denise Côté Christopher Graham International Department Bank of Canada May 2005 Abstract For the past half century, European countries have undertaken a series of measures that have liberalized trade and factor flows among member states of the European Union (EU). They have also harmonized various government policies, including external commercial policy and monetary policy. This increased integration has greatly expanded economic transactions within Europe, possibly at the expense of trade and factor flows with non-member states, including Canada. In this paper, we examine how Europe’s increasing economic integration has affected its trade with Canada. Based on a Canadian export share model that controls for relative price competitiveness and relative income, we find evidence that increased European economic integration has reduced Canada’s relative exports to the EU. This decline can be attributed almost completely to a dramatic fall in the relative importance of Canadian non-energy commodity exports to the United Kingdom. Moreover, when increased Canada-United States trade is accounted for, Canada’s export share to the EU, excluding the United Kingdom, has been stable over the past fifty years while that of the UK has trended down. This shift in UK imports was likely driven primarily by Britain’s co-founding of the European Free Trade Association in 1960 as well as that country’s accession to the European Community (EC) in 1973 which left Canada, and other Commonwealth countries, such as Australia and New Zealand, without their pre- existing preferential trade treatment. Prepared for presentation at the Bank of Canada conference, Canada in the Global Economy , 18 & 19 November 2004. The views expressed in this paper are those of the authors, not the Bank of Canada. Richard Cameron represents International Trade Canada.
Transcript of Economic Integration in Europe: Its Effects on Canadaeconomics.ca/2005/papers/0253.pdf · Economic...

at havehaveandwithinludingted itsprice
nomicalmostodityde isstablewas960nada,
pre-
ank of
Economic Integration in Europe: Its Effects on Canada
Richard CameronDenise Côté
Christopher Graham
International DepartmentBank of Canada
May 2005
Abstract
For the past half century, European countries have undertaken a series of measures thliberalized trade and factor flows among member states of the European Union (EU). Theyalso harmonized various government policies, including external commercial policymonetary policy. This increased integration has greatly expanded economic transactionsEurope, possibly at the expense of trade and factor flows with non-member states, incCanada. In this paper, we examine how Europe’s increasing economic integration has affectrade with Canada. Based on a Canadian export share model that controls for relativecompetitiveness and relative income, we find evidence that increased European ecointegration has reduced Canada’s relative exports to the EU. This decline can be attributedcompletely to a dramatic fall in the relative importance of Canadian non-energy commexports to the United Kingdom. Moreover, when increased Canada-United States traaccounted for, Canada’s export share to the EU, excluding the United Kingdom, has beenover the past fifty years while that of the UK has trended down. This shift in UK importslikely driven primarily by Britain’s co-founding of the European Free Trade Association in 1as well as that country’s accession to the European Community (EC) in 1973 which left Caand other Commonwealth countries, such as Australia and New Zealand, without theirexisting preferential trade treatment.
Prepared for presentation at the Bank of Canada conference,Canada in the Global Economy, 18& 19 November 2004. The views expressed in this paper are those of the authors, not the BCanada. Richard Cameron represents International Trade Canada.


. . . . 6
. . . 6
. . . . 8
. . . 11
. . . 14
. . . . 15
. . . 19
.
iii
Contents
Acknowledgements. . . . . . . . . . . . . . . . . . . . . . . . . . . . . . . . . . . . . . . . . . . . . . . . . . . . . . . . . . . . iv
1. Introduction . . . . . . . . . . . . . . . . . . . . . . . . . . . . . . . . . . . . . . . . . . . . . . . . . . . . . . . . . . . . . . 1
2. Economic Integration in the European Union and Trade Relations with Canada . . . . .
2.1 The evolution of economic integration in the European Union . . . . . . . . . . . . . . .
2.2 Canada-European Union trade relations . . . . . . . . . . . . . . . . . . . . . . . . . . . . . . . .
3. Stylized Facts . . . . . . . . . . . . . . . . . . . . . . . . . . . . . . . . . . . . . . . . . . . . . . . . . . . . . . . . . . . . 11
3.1 Aggregate trade flows. . . . . . . . . . . . . . . . . . . . . . . . . . . . . . . . . . . . . . . . . . . . . .
3.2 Sectoral trade flows. . . . . . . . . . . . . . . . . . . . . . . . . . . . . . . . . . . . . . . . . . . . . . . .
3.3 Investment between Canada and the European Union . . . . . . . . . . . . . . . . . . . .
4. Canadian Export Share Model . . . . . . . . . . . . . . . . . . . . . . . . . . . . . . . . . . . . . . . . . . . .
5. Conclusions . . . . . . . . . . . . . . . . . . . . . . . . . . . . . . . . . . . . . . . . . . . . . . . . . . . . . . . . . . . . . 27
Bibliography . . . . . . . . . . . . . . . . . . . . . . . . . . . . . . . . . . . . . . . . . . . . . . . . . . . . . . . . . . . . . . . . . 30
Appendix A: Data Description . . . . . . . . . . . . . . . . . . . . . . . . . . . . . . . . . . . . . . . . . . . . . . . . . . 33
Appendix B: Figures. . . . . . . . . . . . . . . . . . . . . . . . . . . . . . . . . . . . . . . . . . . . . . . . . . . . . . . . . . . 34

iding
from
ion at
owell,
n, we
tte and
iv
Acknowledgements
We would first like to thank Lawrence Schembri for proposing this research project and prov
useful comments. We would also like to express our appreciation for helpful suggestions
Michael Bordo and Eva Ortega and our discussant Marcel Fratzscher for his helpful discuss
the conference. We thank Jeannine Bailliu, Robert Lafrance, Maureen Molot, James P
Charles St-Arnaud, and participants at a Bank of Canada workshop for comments. In additio
would like to thank our research assistants Suzanne Desjardins, Judy Jones, Sylvie Male
Joan Teske for help in assembling our database.

1
at have
have
and
n of a
ently,
ibly at
ly, the
ted its
gan in
lation
at the
tra-EU
” was
y 1990s
the
g the
the
largestantial
nitednomicublic
It is not possible to forecast with any degree of precision theprobable over-all effects on Canadian trade of the currentmovement towards European integration. ...[If] the UnitedKingdom becomes a Member of the [European] Community, thelong-term advantages will have to be very great to compensateCanada for the loss of the preferential position now enjoyed in theU.K. market.
L. D. Wilgress - 1962
1. Introduction
For the past half century, European countries have undertaken a series of measures th
liberalized trade and factor flows among member states of the European Union (EU). They
also harmonized various government policies, including external commercial policy
monetary policy. As a result of these changes, the EU has extended beyond the definitio
common market and is approaching an economic, and possibly a political union. Consequ
this increased integration has greatly expanded economic transactions within Europe, poss
the expense of trade and factor flows with non-member states, including Canada. According
purpose of this paper is to examine how Europe’s increasing economic integration has affec
trade with Canada.
From a historical perspective, the increase in postwar economic integration in Europe be
earnest with the 1957 Treaty of Rome and was gradually intensified over the years by legis
such as the Single European Act of 1987. This latter act in particular caused concern th
removal of barriers to trade between European nations could come at the expense of ex
trade partners. This apprehension regarding the construction of a “Fortress Europe
especially pronounced among U.S. and Japanese authorities during the late 1980s and earl
(Aho 1994).1
From the Canadian perspective, following the United Kingdom’s initiative to co-found
European Free Trade Association (EFTA) in 1960, concerns were expressed regardin
possible impact on Canadian exports of the United Kingdom’s prospective entry into
European Economic Community (EC) (Wilgress 1962, Nadeau 1985, Hart 2002).2 Indeed, at the
1. Such concerns were significant given that the United States and the EU, in particular, maintain thebilateral trading and investment relationship in the world, with investors from the EU supplying a substamount of capital to the United States.
2. The European Free Trade Association (EFTA) originally included six countries in addition to the UKingdom, namely Austria, Denmark, Norway, Portugal, Sweden, and Switzerland. The European EcoCommunity (EC) originally included six countries, namely Belgium, Luxembourg, France, the Federal Repof Germany, Italy and the Netherlands. See Section 2 for more details.

2
nited
s (i.e.,
rket.
the
Tariff
unity’s
bers
ze the
h has
d the
ct has
99.
tries,
mon
FTA
973,
North
d the
and
for the
inters
993)
padaki
-tariff
l EU
mon
37 per
and ford post-
allowsoccursrtnersourceue and
time, the United Kingdom was Canada’s second most important trading partner after the U
States, and many Canadian exports, along with those of other Commonwealth countrie
Australia and New Zealand), enjoyed long standing preferential treatment in the British ma3
In the end, the United Kingdom joined the European Community (EC) in 1973, at which time
special access afforded to Canadian exports in the British market came to an end.
preferences were lost, and from that point on, Canadian exports faced the European Comm
common external tariffs, while competing imports into the United Kingdom from other mem
of the Community were admitted free of tariffs.
Partly in response to these concerns, a significant body of literature has grown to analy
impact of increased European integration on trade and factor flows. Most of this researc
focused on two central issues: the effect of commercial integration (or customs unions) an
effect of currency integration (or monetary union) on trade and real GDP. The latter aspe
come under increased focus since the advent of the European monetary union (EMU) in 194
With regard to the effects of the European Community on the welfare of European coun
Belassa (1967, 1975) provides evidence of net trade creation resulting from the Com
Market.5,6 Similarly, a 1995 United Nations study finds evidence of trade creation between E
and EC countries following the liberalization of trade between the two country groups in 1
however, this trade creation was accompanied by some trade diversion in the case of
America. Haaland (1993) investigates the welfare effects of the European Community an
European Free Trade Association, finding evidence of positive welfare effects for the EFTA
EC countries, with the former area benefiting the most, and some degree of trade diversion
US and Japan. Similar conclusions are reached by Haaland and Norman (1992) and W
(1997). In a survey of the literature regarding the economic effects of EC integration, Ohly (1
argues that the consensus view suggests the overall effects of EC integration are positive. Pa
(1998) evaluates the welfare effects of the Europe 1992 program (i.e., the removal of non
barriers) in a general multicountry, multisector equilibrium model. Her results show that al
countries are likely to benefit from the completion of the single European market (Com
3. In the mid-1940s, the UK’s share of Canadian exports was about 27 per cent while that of the U.S.wascent. In 2003, UK’s share was 1.6 per cent and U.S.’s share was 86 per cent.
4. For a brief but thorough literature review on this issue, see Andrew Rose (2004) and references therein.5. Balassa uses an ex-post income elasticity analysis of Common Market trade (income elasticities of dem
imports of all commodities). It has since been argued that income elasticities varied substantially pre- anintegration, making Balassa’s results sensitive to the sample period.
6. In Viner’s framework, as discussed by Clausing (2001), trade creation occurs when the lowering of tariffspartner country imports to replace high-cost domestic production; this improves welfare. Trade diversion,when the removal of tariffs causes trade to be diverted from a third country in favour of trade with the pacountry, despite the fact that, were the countries treated equally, the third country would be the lower costof imports. Overall welfare increases when gains to consumers surplus outweigh the loss of tariff revenproducer surplus. Welfare depends therefore on the extent of trade creation relative to trade diversion.

3
rgest
and
and
time, the
re very
ada’s
as of
has
e with
en as a
that of
econd
nding
ial
ct of
etween
olicy
g the
ated
aken to
nada is
tential
tment
and
onomicTrade
g from
f totalst export.
Market) with Italy, Greece and the United Kingdom benefiting the most (i.e., seeing the la
gains in welfare) with limited degree of trade diversion for the rest of the world.7 Focusing more
specifically on the effects of Western European integration on third-party countries, Head
Mayer (2001) find evidence of an important increase in the difficulty faced by American
Japanese producers in accessing the European market during the early 1980s. At the same
authors find evidence of a gradual fall in border effects for intra-European trade.8
Studies regarding the economic impact of increased European integration on Canada a
limited, likely because the European Union accounts for a relatively small share of the Can
total trade (5 per cent of total Canadian exports and 10 per cent of total Canadian imports
2003). Moreover, even though the level of trade volume between Canada and the EU
continued to grow during the past fifty years, it has risen at a slower rate than Canada’s trad
other regions of the world. Consequently, overall trade between Canada and the EU has fall
share of each area’s total trade. Nonetheless, although this share is only a small fraction of
the United States, the European Union remains economically important as Canada’s s
largest trading partner.9
One of the few existing studies on EU integration and Canada-EU trade is a Canadian Sta
Senate Committee on Foreign Affairs report presented in July of 1996 entitledEuropean
Integration: The Implications for Canada. This eighty-six page report identified several potent
implications for Canada regarding Europe’s upcoming monetary union, including: the effe
EMU on the Canadian dollar exchange rate, the effect on trade and investment patterns b
Canada and the EU, implications for the balance of power in international economic p
coordination forums such as the G-7, and the spectre of increased protectionism includin
creation of a “Fortress Europe”. The report then went on to make twenty-five rel
recommendations. Of particular interest, the Committee suggested that studies be undert
assess Canada–EU trade patterns and to discover in which sectors of the EU market Ca
losing/gaining market share. The Committee also recommended an analysis of the po
impact on Canada of future EU enlargement, with a focus on potential “trade and inves
diversion.” Finally, the Committee recommended that the Department of Foreign Affairs
7. As an aside, similar welfare analyses have been performed on the topic of Canada-United States ecintegration. For example, Clausing (2001) examined the effects of the Canada-United States FreeAgreement on trade patterns at the commodity level and found substantial trade creation effects resultintariff removal with little evidence of trade diversion with other countries.
8. Head and Mayer use the border-effect methodology over the 1976–1995 period.9. In terms of individual countries, China is currently Canada’s second largest trading partner in terms o
merchandise trade, having overtaken Japan in 2003. However, Japan remains Canada’s second largemarket while China now holds that position in terms of Canadian imports. The U.S. retains the top ranking

4
ance,
study
nada
ly be
In a
next
ntra-
party
report
ada
be
dollar
nada’s
more
cause
rtners
cusing
this
. In a
ns of
ld not
tween
ossible
a. The
se of
gh EU
ssment
.
o 61 perund 28
International Trade, in consultation with the Bank of Canada and the Department of Fin
undertake a study on the effects of the EU’s economic and monetary union on Canada.
The following year, the Department of Foreign Affairs and International Trade released a
entitled European Monetary Union and its Implications for Canada. This study, by Robert
Hannah (1997), examined the proposed EMU and concluded that its implications for Ca
would likely be minor. Indeed, the study suggested that, with time, Canada would probab
perceived increasingly as part of a North American market in a tripolar financial world.
similar paper, Crowley (1997) explores some possible developments in the EU over the
decade, tentatively concluding that the direct effect of EMU would likely be an increase in i
EU trade. In addition, the study noted that EMU could cause a reduction in trade with third-
countries outside the EU.
Updating their 1996 report, the Standing Senate Committee on Foreign Affairs presented a
in 1999 entitledEurope Revisited: Consequences of Increased European Integration for Can.
Overall, the Committee concluded that the short-term direct impact of EMU would likely
limited. It was also observed that, in the months after the launch of the euro, the Canadian
had not been affected by the new currency. The study also suggested that, given Ca
relatively small share of trade with EU members, Canada’s trade would likely become
hemispheric in nature. Nevertheless, the report argued that, in the long run, EMU could
structural reforms in Europe, prompting beneficial trade creation with open economy pa
such as Canada.10
The report also recommended analyzing a possible Canada-EU Free Trade Agreement, fo
on the implications of tariff elimination. In response, Cameron and Loukine (2001a) explored
issue, concluding that Canada and the EU would both benefit from the elimination of tariffs
separate but related paper, Cameron and Loukine (2001b) also examine the implicatio
European Union enlargement for Canada. Their results suggest that EU enlargement wou
have a large impact on Canada given the relatively small size of pre-existing trade be
Canada and the central and eastern European countries in question. Nevertheless, it is p
that EU accession could cause either trade diversion or trade creation effects for Canad
former could occur if the EU turned their trade toward the acceding countries at the expen
Canada. On the other hand, trade creation could occur if EU wealth was increased throu
enlargement, thus allowing European countries to trade more with Canada. Empirical asse
of this question, however, will have to await the release of sufficiently long time series data
10. Merchandise trade as a share of GDP has been trending upward for Canada (from 46 per cent in 1980 tcent in 2003), a sign of more open trade. On the other hand, this ratio for the European Union remained aroper cent over the same period.

5
s at
ting
eased
e
ion on
gration
e EU
s been
as
allen
dian
hare
tory is
has
r solely
nomic
result
in EU
trade
al of
ers in
essary
onomy, otheraturee to actions.t has aof thestomstion. In
onomic
the terms trade
ark,en and
While adopting a general definition of economic integration, this present paper aim
contributing to the existing literature by documenting the stylized facts and presen
preliminary empirical evidence, using an export share model, regarding the effects of incr
European economic integration on Canada.11 To our knowledge, no existing studies hav
attempted to empirically assess the effects of increased European economic integrat
Canada. The few studies mentioned previously that do discuss European economic inte
from a Canadian perspective focus primarily on an analysis of the stylized facts.
In general, examination of the stylized facts suggests that, while Canada’s trade with th
continues to rise in terms of levels (in real terms), the EU’s share of total Canadian trade ha
declining since the 1950s.12,13More specifically, while the EU’s share of Canadian imports h
remained roughly level over this period, the EU’s share of Canadian exports has f
significantly. This decline coincides with a dramatic fall in the relative importance of Cana
non-energy commodity exports to the United Kingdom. In terms of investment, the EU’s s
has been relatively stable over past decades, while, at the regional level, the investment s
similar to that discussed above for trade flows. Namely, Canada’s investment in the UK
declined markedly as a share of total Canadian direct investment in the EU.
What has caused the decline in the EU’s share of Canadian exports? Can it be accounted fo
by the fundamental determinants of trade performance, or does Europe’s increasing eco
integration also play a role? Admittedly, the issue of trade creation and trade diversion as a
of Europe’s increasing economic integration is best addressed by examining the trend
imports within member countries and with other non-EU trading partners. In such a case,
diversion would occur if Europe’s increasing economic integration, in particular, the remov
tariffs across EU member countries, caused trade to be diverted from non-EU trading partn
favour of EU member states. A more sophisticated counterfactual experiment would be nec
11. In general, this concept of integration refers to an economic environment where different sectors of an ecor, more generally, different countries work together efficiently and are mutually interdependent. Howevermore narrow definitions of the term “economic integration” also exist in the literature. For instance, literdealing with the theory of customs unions usually defines the term “economic integration” in referencreallocation of resources and/or production across countries resulting from the removal of trade restriSuch a reallocation is based on each country specializing in the products or lines of production in which icomparative advantage. Alternatively, the term “economic integration” may also be defined as parteconomic development process. In this framework, financial integration, commercial integration (or cuunions), and real capital market integration are some examples of types and stages of economic integrathis context, monetary integration and common currencies can be interpreted as the highest level of ecintegration.
12. Canada’s merchandise trade represents 85 per cent of its total trade. In this paper, we will therefore use“trade” to refer specifically to merchandise trade. Note also that the EU’s share of Canada’s total servicehas been declining over the last twenty years.
13. In the analysis of this paper, the term “European Union” refers to the EU15 (Austria, Belgium, DenmFinland, France, Germany, Greece, Ireland, Italy, Luxembourg, the Netherlands, Portugal, Spain, Swedthe United Kingdom) unless otherwise specified.

6
of our
s and
ylized
s to the
ance
ased
tional
er the
and the
g the
rovides
orts to
ased
sses the
eriod.
only
ance,
by
7, the
mong
apital.
pean
dom)
EFTA
well as
to assess such a welfare effect of tariff removal. This issue is, however, beyond the scope
analysis.
Based on a Canadian export share model which controls for relative price competitivenes
relative income, we find some evidence over the 1972-2003 period, consistent with the st
facts, that increased European economic integration has reduced Canada’s relative export
EU. This decline can be attributed almost completely to a dramatic fall in the relative import
of Canadian exports to the United Kingdom. Moreover, these findings stand when incre
Canada-United States trade is accounted for.
The remainder of this paper is organized as follows: Section 2 describes the major institu
changes that contributed to increased economic integration in the European economy ov
past several decades and discusses the evolution of trade relations between Canada
European community over the same period. Section 3 reviews the stylized facts regardin
trade and investment relationship between Canada and the European Union. Section 4 p
empirical evidence on the effect of increased European integration on Canada’s relative exp
the EU. Section 5 concludes and suggests areas for future research.
2. Economic Integration in the European Union and TradeRelations with Canada
This section briefly describes the major institutional changes that contributed to incre
economic integration in the European economy over the past several decades. It then discu
evolution of trade relations between Canada and the European community over the same p
2.1 The evolution of economic integration in the European Union
Europe’s present drive toward economic integration took its first significant step in 1952,
three years after the end of post-world war two reconstruction, when “the Six” (Germany, Fr
Italy, Belgium, Luxembourg, and the Netherlands) took a critical step in reunifying Europe
establishing the European Coal and Steel Community (ECSC). Five years later, in 195
Treaty of Rome was signed, creating the European Economic Community (EEC) which, a
other things, marked the beginning of the push towards free movement of labour and c
Indeed, it was in response to the removal of intra-EEC tariff barriers that several other Euro
countries (Austria, Denmark, Norway, Portugal, Sweden, Switzerland, and the United King
formed the European Free Trade Association (EFTA) in 1960. In essence, the goal of the
was to liberalize trade and counterbalance the EEC. In 1967, the ECSC and the EEC (as

7
EC).
hese
etary
o limit
When
d in
rate
e of
rogress
EC and
n the
etary
), a
uced,
t at a
nited
n a
2 per
7, the
ong
labour,
ithin
f free
From
o the
and
nd of
espite
992,
the
ibility
the European Atomic Energy Community) merged to form the European Community (
Following the establishment of the EFTA and EC, tariffs on internal trade within each of t
groups were almost entirely removed by the end of the 1960s.
In 1970, the Werner Report laid out, for the first time, the eventual steps to European mon
union. In 1972, “the snake” exchange rate system was introduced, wherein the Six agreed t
the margin of currency fluctuations to a 4.5 per cent band around an agreed central parity.
the United Kingdom and Denmark left the EFTA and acceded to the EC along with Irelan
1973, they also joined “the snake.” However, this first attempt at European exchange
coordination fell victim to the effects of the oil-price crises in the late 1970s. By 1978, only fiv
nine member states remained on “the snake.” The mid-1970s had, nonetheless, brought p
on another front. A significant free trade agreement had been reached in 1974 between the
the EFTA. Indeed, by the end of the 1970s, virtually all tariff barriers had been removed o
trade of industrial products within Western Europe.
The experience of “the snake” paved the way for the establishment of the European Mon
System (EMS) in 1979. Within the EMS, the concept of the European Currency Unit (ECU
virtual currency based on relative GNP and trade values for all EC countries, was introd
along with the exchange rate mechanism (ERM). The ERM marked the second attemp
coordinated EC exchange rate policy and initially included all EC countries except the U
Kingdom. Participants in the ERM were originally permitted, like “the snake,” to move withi
4.5 per cent band around a central parity with the ECU, except for Italy, which adopted a 1
cent band because of its higher inflation rate.
In 1981, Greece acceded to the EC, followed five years later by Spain and Portugal. In 198
original Treaty of Rome was modified by the Single European Act, which formalized, am
other things, the plan to create a single European economic market in goods and services,
and capital. In addition, the Single European Act included a program for deeper integration w
the European Community through the removal of non-tariff barriers, the establishment o
labour and production factor flows, and the harmonization of standards by the end of 1992.
this point on, the term European Union was commonly, although informally, used to refer t
EC. In the following years, the ERM expanded to include Spain, the United Kingdom,
Portugal in 1989, 1990, and 1992, respectively, although using the wider 12 per cent ba
fluctuation (Italy had, meanwhile, adopted the standard 4.5 per cent band in 1990). D
several revaluations within the ERM, the mechanism functioned relatively smoothly until 1
when speculative currency attacks forced the United Kingdom and Italy to withdraw from
arrangement. The following year, a new 30 per cent band was adopted to provide added flex

8
1996,
ty in
evel
Union
99,
set of
ective
fficial
9 the
the
ic
any,
en and
cess
stern
years
nship.
ell as a
omic
ropean
work
ment
both
omic
legal
ration
, Italy,
any,
joined
and reduce the threat of speculative attacks. Italy subsequently rejoined the ERM in
whereas the United Kingdom has since abstained.
The formal European Union (EU) as we know it today was born out of the Maastricht Trea
1993.14 Besides enacting a common foreign and security policy, and dealing with EU-l
matters of justice, this treaty specified the three steps required for Economic and Monetary
(EMU): by the end of 1993, capital flows were to be completely freed within the EU; by 19
member states preparing to adopt the euro currency upon its launch had to satisfy a
convergence criteria by which major economic policies were coordinated across nations; eff
at the beginning of 1999, the European Central Bank would be established, along with the o
euro currency for which member-country conversion rates were irrevocably set. As of 199
Economic and Monetary Union (EMU) was officially established (with the circulation of
common currency following in 2002).15 The union, marking the final stage of econom
integration according to some, now includes Austria, Belgium, Finland, France, Germ
Greece, Ireland, Italy, Luxembourg, the Netherlands, Portugal and Spain. Denmark, Swed
the United Kingdom have abstained, to this point, from joining EMU. More recently, the pro
of European economic integration continued in May of 2004 when ten central and ea
European countries joined the European Union with plans to adopt the common currency in
to come.16
2.2 Canada-European Union trade relations
Canada and the European Union maintain a decades old political and economic relatio
Relations between the two are covered by the World Trade Organization agreements as w
diversity of bilateral framework and sectoral agreements. More specifically, the econ
partnership dates back to 1958, when Canada accredited its first Ambassador to the Eu
Economic Community (EEC). In 1976, the EEC and Canada signed a historic Frame
Agreement for Commercial and Economic Co-operation, the first international agree
between the EEC and an industrialized country. This framework agreement, which called on
parties to “develop and diversify their reciprocal commercial exchanges and to foster econ
co-operation”, provided for regular dialogue on trade at several levels, and provided the
basis for further collaboration between the two. Under this agreement; the Joint Coope
14. The original member states of the EU were Belgium, Denmark, France, Germany, Greece, IrelandLuxembourg, the Netherlands, Portugal, Spain, and the United Kingdom.
15. The Economic and Monetary Union originally consisted of Austria, Belgium, Finland, France, GermIreland, Italy, Luxembourg, the Netherlands, Portugal and Spain. Greece joined later in 2001.
16. Poland, Hungary, the Czech Republic, Estonia, Latvia, Lithuania, Slovakia, Slovenia, Cyprus, and Maltathe EU on 1 May 2004.
9
of sub-
EEC
a wide
s and
ework
a-EU
arly)
ncy of
ned in
) was
genda
s on
nment
ltural
anced
ade to
pact
CERT)
Nuclear81); thenologystoms998);
Committee (JCC) was established. This committee meets every year and has a number
committees including the Trade and Investment Sub-Committee (TISC). Since 1976, as the
has evolved into the EU, Canada and the EU have concluded several agreements covering
range of economic activities ranging from fisheries and wines and spirits to veterinary issue
nuclear research.17
By 1990, there was a desire to build on existing agreements and establish a political fram
for Canada-Europe relations. The result was the Transatlantic Declaration on Canad
Relations, which set the institutional framework forming the basis for biannual (i.e., twice ye
Summit meetings between the Prime Minister of Canada and his counterpart in the Preside
the European Union and the President of the European Commission.18 The Declaration also
established biannual Ministerial meetings.
In recognition of the broad nature of common interests, the Canada-EU Action Plan was sig
1996 to extend cooperation across a wide range of subjects falling under four headings:
• economic and trade relations
• foreign policy and security issues
• transnational issues
• fostering links between the EU and Canada
Under the trade and economic relations umbrella, a new EU-Canada trade initiative (ECTI
launched in 1998, on the eve of the introduction of the euro currency. The ECTI set out an a
of priorities for developing bilateral economic relations into the new century. Current issue
the ECTI agenda include: mutual recognition and regulatory cooperation, services, gover
procurement, intellectual property, competition, business-to-business contacts, cu
cooperation, and electronic commerce. It also includes a commitment to regular and enh
discussions on multilateral issues.
Also established under this heading was a vehicle for businesses involved in Canada-EU tr
make known their views to the trade Ministers on high-level policy issues which have an im
on Canada-EU trade and investment relations. As such, the Canada-Europe Round Table (
was established in 1999.
17. Several sectoral agreements are in place including: the Agreement on Research in Peaceful Uses ofEnergy (1959); the Agreement on Cooperation in Nuclear Research (1998); the Fisheries Agreement (19Agreement on Fisheries Enforcement and Conservation (1995); the Agreement on Science and TechCooperation (1995, expanded in 1998); the Agreement on Education and Training (1996); the CuCooperation Agreement (1997); the Mutual Recognition Agreement (1998); the Veterinary Agreement (1the Competition Agreement (1999); and the Agreement on Trade in Wine and Spirit Drinks (2003).
18. The Presidency of the EU rotates every six months among the Member States.

10
iew to
g with
ulties
ndards,
(e.g.,
ns on
the
elling,
rvice
lations
sarily
cement
ed to
ement
the
due
mic
l and
e and
ents are
ted by
umber,
anola.
olicy
ss of
s.
ancialpment;
Under the auspices of ECTI, both the EU and Canada conducted business surveys with a v
assessing the business case for a closer type of Canada-EU economic cooperation. Alon
general market factors, the surveys identified regulatory barriers as the main source of diffic
to bilateral trade and investment. From the European perspective, health and safety sta
labelling, packaging, provincial liquor boards, geographical indicators, customs formalities
the requirement to use 10-digit HS codes), lack of diploma recognition, and certain restrictio
investment were identified. Many of the same types of difficulties were also identified from
Canadian perspective, in particular: sanitary and technical regulations, packaging, lab
certification requirements, crop protection rules, and bureaucracy in establishing se
companies in the EU.
From these surveys, it was concluded that a new impetus should be given to the bilateral re
through a major political initiative, although a classical free trade negotiation was not neces
the most appropriate instrument for this purpose. Thus, a new Trade and Investment Enhan
Agreement (TIEA) between Canada and the EU was signed in March 2004. TIEA is intend
be a forward-looking, wide-ranging bilateral trade and investment enhancement agre
covering a new generation of issues and outstanding barriers. In particular, it will tackle
significant impact of regulatory barriers in bilateral trade and investment and pay
consideration to the increasingly prominent role of investment in the bilateral econo
relationship.19
Although the 1976 framework agreement and subsequent instruments of commercia
economic cooperation have facilitated efforts by both sides to manage and resolve trad
investment disputes, Canada-EU trade and economic relations are so broad that disagreem
almost inevitable. In recent years, trade relations between the two partners have been tain
long standing barrier issues for such products as chrysolite asbestos, automobiles, wine, l
seafood, beef reared on growth hormones, wheat, and transgenic products like c
Furthermore, the Canadian government believes that the EU’s Common Agricultural P
(CAP), in particular price support and production subsidies, continues to restrict the acce
Canadian agricultural products to the EU while distorting the markets of third-party countrie
19. TIEA will address issues such as: mutual recognition of professional qualifications; e-commerce; finservices; government procurement; trade and investment facilitation; competition; sustainable develointellectual property rights; and science and technology cooperation.

11
and the
te trade
per to
de flow
nalysis
he past
tions.
eached
e the
eriod,
S$1.1
.
at a
as a
3, after
ts for
.3 per
ve been
raged
ghout
Japan
that
nd its
dian
at the
3. Stylized Facts
This section of the paper summarizes the stylized facts regarding trade between Canada
European Union over the past several decades. The analysis first investigates aggrega
flows between Canada and the EU, and their major trading partners, before digging dee
discuss trade between Canada and the individual EU member states. Broad sectoral tra
data are also examined to assess the Canada-EU trade relationship in more detail. The a
then examines the evolution of investment between Canada and the European Union over t
half century.
3.1 Aggregate trade flows
Canada and the European Union maintain important and economically significant trade rela
Total merchandise trade (exports plus imports) between the European Union and Canada r
a record level of US$3.6 billion at the end of 2003, having grown almost 86 per cent sinc
establishment of the European Union in the fourth quarter of 1993. Over the same p
however, Canada’s trade deficit with the EU increased by almost 250 per cent to a level of U
billion, implying that Canada is increasingly importing more from the EU than it is exporting20
Although the volume of trade between Canada and the EU continues to grow, it is rising
slower rate than Canada’s trade with other regions of the world. Viewing these trade flows
share of each area’s total trade provides some additional context.
3.1.1 The Canadian perspective
From the Canadian perspective, the EU was Canada’s second largest trading partner in 200
the United States, in terms of both imports and exports. More specifically, the EU accoun
11.5 per cent of total Canadian imports (versus 59 per cent accounted for by the U.S.) and 5
cent of total Canadian exports (versus 85 per cent for the U.S.). These shares, however, ha
decreasing over time. As is visible in Figure 1, the EU’s share of Canadian imports ave
about 14.5 per cent in the 1960s. This share subsequently fell to about 10 per cent throu
much of the 1980s and 1990s before rising somewhat to its current level. At the same time,
accounted for a growing share of total Canadian imports until the early 1990s at which time
country entered a protracted economic slowdown. Meanwhile, economic reforms in China a
entry into the World Trade Organization have led it to account for a growing share of Cana
imports since the early 1980s, rising from about 0.2 per cent at that time to over 6 per cent
20. Canada has consistently maintained a merchandise trade deficit with the EU members since 1984.

12
port
ports
has
m has
y from
. At the
to over
cline
dom.
over
is was
UK
to the
with
. As
960.
faced
ift in
he UK
ed the
ment
with
ies in
the
equal
l of its
erse
beforeailable
lier of
end of 2003. In terms of individual countries, China is now Canada’s second largest im
market after the U.S. Taking a look at the country-by-country breakdown of Canadian im
from the EU (Figures 2 and 3), it is clear that the composition of imports from the EU
remained largely the same since 1980. Of note, the share of imports from the United Kingdo
declined from about 30 per cent to about 22 per cent.
On the export side, the European Union’s share of Canada’s exports has declined steadil
about 25 per cent in the 1960s to about 5 per cent where it has been since the late 1990s
same time, the United States’ share has increased notably, from about 60 per cent in 1960
85 per cent at the end of 2003 (Figure 4). As Figures 5 and 6 illustrate, the EU’s relative de
was driven primarily by a steep drop in the share of Canadian exports to the United King
Indeed, as a share of total Canadian exports to the EU, the United Kingdom has fallen from
85 per cent in the 1950s to about 23 per cent by the mid-1990s.21 In volume terms, although
Canadian exports to the EU have continued to rise since the 1950s, Figure 7 shows that th
not always true for the United Kingdom. In fact, the volume of Canadian exports to the
declined 54 per cent between 1970 and 1985. In contrast, the volume of Canadian exports
rest of the EU (excluding the UK) saw a steady upward trend. These stylized facts are in line
the UK’s increasing economic integration with other European countries over this period
mentioned previously, the UK helped found the European Free Trade Association in 1
Through the removal of tariffs between the UK and other EFTA members, Canada now
increased competition in the British market.22 Thirteen years later, when the United Kingdom
acceded to the European Community, Canada faced an even more dramatic sh
competitiveness. In 1960, before the UK’s accession, 97 per cent of Canadian exports to t
entered duty-free. This compared to about 75 per cent of Canadian exports which enter
European Community without tariffs. Moreover, Canada maintained preferential tariff treat
with the UK on all dutiable goods and 42 per cent of non-dutiable goods, in comparison
goods from the EC. For all other goods, Canada stood on equal footing with the EC countr
terms of UK tariff rates. After the UK’s accession to the EC, Britain shifted its tariffs to match
common European Community external tariff rates. This process occurred gradually in five
steps from 1973 to 1977. As a result, Canada (and other Commonwealth countries) lost al
former preferential tariff treatment with the UK and in many cases actually faced rev
preferences compared to other EC countries (Hart 2002, Wilgress 1962).
21. Based on available exports data. Time series for exports to some members of the EU are not available1986. However, data for the six largest EU countries in terms of Canadian export shares to the EU are avfrom 1949.
22. For example, Hart (2002) notes that EFTA tariff cuts led Norway to threaten Canada as the top suppaluminum to Britain.

13
orts,
om,
th the
the
forty
cent)
share
in the
tates
ward
ppears
ports
early
nd, the
pan’s
At the
ce the
.2 per
elled
does
d trade
2004.
line in
lative
K’s
munity
for 12.7o and
Standing in stark contrast with the significant decline in the UK’s share of Canadian exp
Figure 4 illustrates that the rest of the European Union, excluding the United Kingd
experienced a very modest decline over the period of 1950 to 2003.
Taken together, the steady decline in the EU’s share of Canadian exports combined wi
relative stability of Canada’s share of imports from the EU has left Canada with
aforementioned increasing bilateral trade deficit with the European Union over the last
years.
3.1.2 The European Union perspective
From the EU’s perspective, Canada currently ranks eleventh in terms of EU imports (0.7 per
and fourteenth in terms of exports (0.8 per cent). As illustrated in Figures 8 and 9, Canada’s
of EU exports fell from about 2 per cent at the beginning of the 1960s to about 0.8 per cent
early 1980s where it has largely remained since that time. Concurrently, the United S
oscillated around 8 per cent of total EU exports, while “Other Asia” and Japan trended up
until the mid-1990s. China’s share of EU exports has been rising since the mid-1980s and a
to be accelerating. At the end of 2003 China’s share was over 1.6 per cent of total EU ex
compared to only about 0.5 per cent at the beginning of the 1990s.
In terms of EU imports, Canada’s share declined steadily from about 2.6 per cent in the
1960s to about 0.7 per cent where it has been since the second half of 1992. On the other ha
U.S. share of total EU imports declined in the 1960s and again since mid-2001, while Ja
share increased rapidly until the mid-1980s (it has been in decline since the early 1990s).
same time, the importance of China and “Other Asia” has been trending upward strongly sin
mid-1980s. More recently, China’s share seems to be gaining speed, posting a level of 4
cent, roughly double its value only five years previously. Interestingly, the residual line lab
“Others” in Figures 10 and 11 makes up roughly twice as much of the EU’s total imports as
the United States. Since the mid-1990s growth in this share has been driven by increase
with the ten central and eastern European countries that acceded to the European Union in23
In general, the EU import story mirrors that described above for Canadian exports. The dec
Canada’s share of EU imports can be attributed almost completely to a dramatic fall in the re
importance of the United Kingdom’s imports from Canada resulting primarily from the U
accession to the European Free Trade Association (1960) and, later, the European Com
23. Fuelled by free trade agreements signed in the early to mid-1990s, the ten acceding countries accountedper cent of total extra-euro zone imports in 2002, up from 4.3 per cent in 1990 (See Anderton, di MaurMoneta 2004, Table 5, p. 21).

14
ward
tralia
nited
trade.
whole,
ained
s the
ion of
ure 15
make
adian
ure
Section
have
same
xports
at the
ities.
r was
t (the
and
al role
line in
ergy
any
, zinc
r states
ealth
(1973). However, Figure 12 provides some additional details. Interestingly, a similar down
trend in the share of UK imports also took place in other Commonwealth countries (e.g., Aus
and New Zealand) who, like Canada, also lost their preferential trade treatment with the U
Kingdom over the 1960s and 1970s.
3.2 Sectoral trade flows
Broad sectoral data provide additional insight into the stylized facts regarding Canada-EU
As discussed in the previous section, the EU’s share of total Canadian imports has, on the
remained fairly stable since the 1960s. The sectoral composition of these imports has rem
much the same as it was 20 years ago (Figure 13). Figure 14, which disaggregate
commodities sector into energy and non-energy components, shows that the composit
commodity imports has also remained roughly the same since the mid-1980s. Likewise, Fig
shows little change over this period in the relative importance of the various sub-sectors that
up the total machinery and equipment sector. In addition, when the major sectors of Can
imports from the EU are viewed in relation to total Canadian imports from all countries (Fig
16) we see that the modest rise in the EU’s share of Canadian imports since the 1990s (see
3.1) was driven primarily by machinery and equipment.
Turning now to Canadian exports to the European Union, Figure 17 shows that commodities
declined significantly since the 1960s as a share of total Canadian exports to the EU. At the
time, the importance of the machinery and equipment sector has risen while other types of e
have remained fairly stable. Looking at a more disaggregated level, Figure 18 illustrates th
decline in the importance of the commodity sector was entirely due to non-energy commod
Similarly, Figure 19 shows that the rising importance of the machinery and equipment secto
driven primarily by aircraft products and other residual types of machinery and equipmen
increase in the latter is spread fairly evenly between the miscellaneous machinery
miscellaneous equipment categories). As noted previously, Canada-UK trade plays a pivot
in the trend of Canadian exports to the EU over the past 50 years. Indeed, the noted dec
Canadian non-energy commodities to the EU was driven primarily by a fall in non-en
commodities to the United Kingdom (Figures 20 and 21). As noted in Hart (2002), m
Canadian non-energy commodity exports to the UK, such as wheat, barley, aluminum, lead
and chemicals, faced reverse tariff preferences compared to European Community membe
following the UK’s accession to the EC in 1973. Such goods had previously held Commonw
trade preference over other countries.24

15
4 (i.e.,
at the
was
bly to
e 22
ies in
h the
mports
to a
lted
r, the
een
e in
h the
d this
adian
This
DIA)
erized
ldings
t, led
firms
as that
ital at
P),away
modityce theoffice. For a
The same general story holds true once these numbers are made consistent with Figure
when viewed as a share of Canada’s total exports). In brief, Figures 20 and 21 illustrate th
significant decline in the relative importance of the EU as an export market for Canada
overwhelmingly due to the decreasing relative importance of commodity exports, most nota
the United Kingdom (almost entirely in the form of non-energy commodities). Indeed, Figur
shows that this trend is evident, not only in exports to the European Union, but to all countr
general.25
In summary, the stylized facts show that the relative importance of Canada’s trade wit
European Union has, in general, fallen over past decades. While the Canadian share of i
from the EU have remained fairly stable, exports to the EU have declined primarily due
marked fall in non-energy commodity exports to the United Kingdom. This shift likely resu
primarily from the UK’s accession to the European Free Trade Association (1960) and, late
European Community (1973), within a context of generally weakening historical ties betw
Canada and the UK. A similar downward trend in the share of UK imports also took plac
Australia and New Zealand who, like Canada, lost their preferential trade treatment wit
United Kingdom over the 1960s and early 1970s.
3.3 Investment between Canada and the European Union
For much of its history, Canada has been a net importer of direct investment capital an
situation has been equally true of the Canada-EU investment relation. Up until 1996, Can
holdings of direct investment in the EU were always lower than EU holdings in Canada.
situation changed with strong additions to the stock of Canadian direct investment abroad (C
in the EU in both 1997 and 1998, and carried through until 1999. The year 2000 was charact
by unprecedented levels of merger and acquisition activity. Canadian direct investment ho
in the EU shot up by 39.7 per cent while EU holdings in Canada rocketed up by 85.9 per cen
by France with a 458.5 per cent increase in its FDI holdings in Canada. Notable Canadian
that were acquired by French investors included Seagrams and Newbridge. The net result w
Canada again found itself in the position of being a net importer of EU direct investment cap
24. Part of the UK’s adoption of common EC external tariffs included the Common Agricultural Policy (CAwhich led the UK to become more self-sufficient in agricultural goods, while substituting some importsfrom countries like Canada and toward other EC member states (Nadeau 1985).
25. Comparative advantage continues to drive a significant portion of Canada’s trade especially in comexports. However, the trend towards increasing two-way trade in industrial goods has risen significantly sinmid-1980s. In the machinery and equipment category, for example, the rapidly growing importance ofmachines and telecommunications equipment in both exports and imports has fuelled two-way tradereview of trends in Canada’s Merchandise trade, see Dion (2000).

16
n and
adian
t of
cent
the EU
e US
od at
gain,
han in
from
DIA
t of the
1966.
dian
st over
per
en 15
1990
e year
eded to
rriers in
estic
iary.
eign
country
the close of the year 2000. It was only in 2003 that Canada again reversed the situatio
became a net exporter of capital to the EU.
In 2003, Canadians invested just over $14.1 billion in the EU, raising the stock of total Can
direct investment in the EU to $99.1 billion. At this level, the EU accounted for 24.8 per cen
the stock of total Canadian direct investment abroad (CDIA), second only to the 41.3 per
invested in the United States. Indeed, Canadian investors have increased their holdings in
almost 361 times since the Treaty of Rome came into effect in 1957.26 By way of comparison,
Canadian investment to all countries has grown nearly 182 times since 1957 and CDIA to th
has grown 107 times over the same period.
On the inward side, the stock of foreign direct investment (FDI) in Canada from the EU sto
$96.7 billion in 2003, some 63.2 times larger than the $1.5 billion level estimated for 1957. A
this pace has been faster than either that of total FDI in Canada (33.9 times larger in 2003 t
1957) or that for US FDI in Canada (25.8 times). Last year, the net flow of direct investment
the EU was $1.5 billion.
More globally, Canada’s share of outward direct investment in the EU as a share of total C
has risen over the years (Figure 23). Until 1956, the EU accounted for less than ten per cen
total. In 1957, the EU’s share registered 10.2 per cent and climbed to over 19 per cent by
Thereafter, it slowly drifted down, falling to 11.4 per cent in 1984. Three years later, Cana
investment activity into the EU began to accelerate and by 1990 the region represented ju
one-fifth of total CDIA where it remained for the next dozen years, before jumping to 24.8
cent of the total in 2003.
As shown in Figure 24, on the inward side, the EU’s share of total FDI in Canada sat betwe
and 20 per cent until 1986, when it reached 20.3 per cent. It had risen to over 24 per cent by
before sliding back to 20.4 per cent by 1999. The strong European investments made in th
2000 then pushed the EU’s share to just over 30 per cent. The EU’s share subsequently rec
about 27 per cent in 2003.
As mentioned earlier in Section 2.2, Canadian businesses have experienced regulatory ba
the EU markets. One possible way of circumventing these barriers is to establish a dom
presence within the EU market (i.e., CDIA) and sell to that market through a local subsid
Unfortunately, there is not much available information on the activities of Canadian for
26. Outward and inward direct investment stock data with the EU have been constructed back to 1957 using the availabletime series for the EU15 member countries.

17
, and,
oughly
have
oming
nt of
lar
cent
three
he UK
edging
er cent
cent
share
tward
stment
ative
p the
UK,
from a
tries
affiliates abroad. Only recently has Statistics Canada begun to produce such information
thus, the data only exist for a limited number of years.
Nonetheless, Table 1 shows that Canadian companies have, in recent years, provided r
twice as much in goods and services directly via their foreign affiliates in the EU than they
through traditional export channels. Moreover, it seems that the direct sales route is bec
more important, rising to two and a quarter times exports in 2001 from twice the amou
exports only a year earlier.
In terms of regional distribution, investment flows with the United Kingdom are of particu
importance. When the UK joined the European Community in 1973, it accounted for 56 per
of the stock of EU FDI in Canada. Some sixteen years earlier, in 1957, it represented over
quarters of EU investment in Canada; over the next sixteen years, to the end of the 1980s, t
more-or-less maintained its share in the 55 per cent range; since then, its share has been
downwards and now represents 28 per cent of EU holdings in Canada. Likewise, about 56 p
of all Canadian direct investment in the EU was placed in the UK in 1973, down from 84 per
in 1957, but more than the 41 per cent observed in 2003. These figures represent relative
declines of almost two thirds on the inward investment side and one half for Canadian ou
investment between 1957 and 2003. Thus, the overarching story of Canada-EU direct inve
relations has been one of the relative diminishing role of the UK or, alternatively, of the rel
increased role of other member countries, notably France, Germany, and the Netherlands.
On the inward investment side, these three other countries, in addition to the UK, make u
bulk of EU holdings in Canada. Over 1957-2003, these three countries, along with the
accounted for an average of 87.9 per cent of total EU direct investment in Canada, ranging
low of 81.8 per cent in 1999 to a high of 96.5 per cent in 1989. In 2003, these four coun
Table 1: Canada-EU commercial relations: Exports Versus Foreign-Affiliated Salesa
a. Source: Statistics Canada.
($Canadian millions)
Long-run factors Goods & services exports Foreign Affiliate Sales Ratio
(1) (2) (2) as per cent of (1)
1999 29 102 62 000 213
2000 33 843 67 000 198
2001 33 766 77 000 228

18
ister a
57 and
ed that
again
ntioned
r 2000
nt in
ff in the
FDI in
0, and
rlands
15.3
r 2000
sition
total
r EU
been
ded to
of the
ition,
the
on),
lion).
in the
their
r cent
this
accounted for 84.1 per cent of all EU FDI in Canada. They are also the only countries to reg
greater-than-10 per cent share of EU investment in Canada in any of the years between 19
2003.
France first registered a greater-than-10 per cent share in 1968 and managed to exce
threshold over the next dozen years before falling under the mark in 1981. In 1989, France
exceeded the 10 per cent threshold and has continued to do so in every year since. As me
earlier, France engaged in some rather sizeable merger and acquisition activity in the yea
(Figure 25). As a result of that activity, France’s share of EU holdings jumped to 38.6 per ce
that year from 12.8 per cent the year before. Some of the acquired assets have been sold o
ensuing years and, as of 2003, France accounted for almost a third (32.7 per cent) of all EU
Canada, or $31.6 billion.
The Netherlands first breeched the 10 per cent threshold over 1965-1966, then in 1969-197
again over 1975-1977, and has remained over that level since 1980. In 2003, the Nethe
accounted for 15.8 per cent of total EU FDI in Canada, equivalent to FDI holdings of $
billion.
Germany surpassed the 10 per cent threshold in 1975 and continued to do so until the yea
when the sizeable additions to total EU holdings (led by the French merger and acqui
activity) caused the German share to fall below the 10 per cent level. At 7.6 per cent of the
EU investment in Canada in 2003, or $7.3 billion, Germany is the smallest of the top fou
investors in Canada.
Turning to the outward investment side, Canadian direct investment into the EU has also
highly concentrated. In terms of preferred investment locations, Canadian investors have ten
invest in those European countries which have most invested in Canada. That is, much
Canadian FDI in the EU is situated in Britain, France, Germany, and the Netherlands. In add
Ireland is also a major destination of CDIA in the EU (Figure 26).
At 40.1 per cent of the total, or $40.7 billion, the UK remains the largest recipient of CDIA in
EU, followed by Ireland (18.4 per cent, or $18.2 billion), France (11.7 per cent, or $11.6 billi
the Netherlands (10.8 per cent, or $10.7 billion), and Germany (7.9 per cent, or $7.8 bil
Together, these five countries accounted, on average, for about 88.8 per cent of total CDIA
EU over 1957-2003. In 2003, these countries contributed 89.8 per cent of the total, and
collective shares have ranged from 86.1 per cent (in 1976) to 96.4 per cent (in 1957).
Excluding investment in the UK, Canadian investors have not often placed more than 10 pe
of their holdings of CDIA in the EU in other European countries. CDIA in France exceeded

19
tion of
nt in
U.
year
ns for
r cent
ve not
3; this
limited
ards
irically
ress
ry-pair
rding
nalysis
at this
eased
of each
r solely
nomic
verall
nd, a
ly and
foreign
werence year,
urteen
10 per cent threshold between 1974 and 1976 and again over 1988-1989. With the acquisi
the French firm Pechiney by Alcan in December of 2003, the stock of Canadian investme
France grew 156.4 per cent last year, to $11.6 billion, or 11.7 per cent of total CDIA in the E
Ireland has captured more than 10 per cent of CDIA in the EU since 1993 (except for the
2000) and the Netherlands since 1998. Germany, lone amongst the top 5 destinatio
Canadian FDI in the EU, is the only nation in this group not to have surpassed the 10 pe
threshold at least once.
In summary, although Canada-UK investment levels have risen in absolute terms, they ha
kept pace with those between Canada and the other EU member nations over 1957-200
explains the broad movement in shares over this period. Thus, there appears to have been a
shift in the focus of Canada-EU investment relations away from the UK and, particularly, tow
France, the Netherlands, Germany and, perhaps, Ireland.
4. Canadian Export Share Model
Assessing the impact of increased European integration on trade with Canada is an emp
difficult exercise given the complexity of modeling economic integration. We attempt to add
the issue with a simple export share model using a panel dataset based on count
observations between Canada and each of the European Union countries.27,28We would like to
stress that the scope of our empirical analysis is limited to explaining the stylized facts rega
Canadian exports to EU member countries as presented in the previous section. Thus, our a
does not attempt to account for movement in the EU’s share of Canadian imports given th
variable is driven by Canadian domestic factors that are unrelated to the issue of incr
European economic integration.
As discussed previously, overall trade between Canada and the EU has fallen as a share
area’s total trade. What has caused the decline in these shares? Can they be accounted fo
by the fundamental determinants of trade performance or does Europe’s increasing eco
integration also play a role? In this section, we investigate the factors contributing to the o
decline in Canadian exports to the EU as a share of total Canadian exports. To this e
theoretically-based reduced-form export share model is developed combining both supp
demand determinants of export performance, such as relative price competitiveness and
27. All data are taken from Statistics Canada, OECD (2004), BIS, and IMF databases. All foreign variablesconverted to Canadian dollars. Constant dollar and price index series were rebased to 2000 as the referein cases where base years were different. Mnemonics are described in Appendix A.
28. Based on data availability, the term “European Union” refers throughout our empirical analysis to the fomembers of the EU (before the May 2004 expansion) excluding Luxembourg, unless otherwise noted.

20
the
n
reased
o the
g the
(1) and
n step
, the
ase
t.
price
, (
vel ofg bothe valid
:
income. By specifying our model in relative terms (i.e., shares), we implicitly account for
general increase in world trade openness.29 Linear time trend and dummy variables are the
added to the basic model to capture excess trade resulting from other factors, such as inc
European economic integration.
In developing our model, we proceed in two steps. We first specify Canadian exports t
individual EU member countries, as well as total Canadian exports to all countries usin
aforementioned fundamental determinants. Thus, defining Canada as country i, Equations
(2) specify Canadian real exports to country j and total Canadian real exports, respectively. I
two, the export share equation is then obtained by dividing Equation (1) by Equation (2)
results of which are given as Equation (3).30
where the variables are defined as:
Xijt : Canadian exports to country j,Xit: total Canadian exports,PXit: the Canadian export price
deflator at time t,Xijt /PXit: Canadian real exports to country j,Xit/PXit: total Canadian real
exports,Y(i or j or w) t: real GDP in country i or j or in the world at time t,Pit: the GDP price
deflator in country i at time t,Pjt: the GDP price deflator in country j at time t,Pwt: the world price
deflator at time t, nerjit : the nominal exchange rate between country j and i (where an incre
corresponds to an appreciation of currency i versus currency j) and neerit: the nominal effective
Canadian exchange rate (an increase is an appreciation of the Canadian dollar).
Looking further at Equation (1),Xijt /PXit denotes real exports from Canada to country j at time
The export performance of Canada with respect to country j depends primarily on its
competitiveness relative to country j as measured by its real bilateral exchange ratePit/
Pjt)*nerjit , and also on the Canadian dollar level of real income in country j, denotedYjt*nerijt .
29. Ideally, we would also like to explain the level of Canadian real exports to EU countries as well as the leCanadian real exports to the world. However, we did not find evidence of cointegration in level terms, usinthe panel Johansen cointegration test and within a panel error-correction model. Thus, we could not makempirical inferences.
30. Estimating the export share model as specified in Equation 3, implicitly imposes the following restrictionsβ0 =α10/α20, β1 = α11/α21, andβ2 = α12/α22.
Xijt /PXit= α10 +α11(Pit/Pjt)*nerjit + α12Yjt*nerijt + εijt , (1)
Xit/PXit= α20 + α21(Pit/Pwt)*neerit + α22Ywt/neerit+ εit, (2)
Xijt /Xit = β0 + β1(Pwt/Pjt)*(nerjit /neerit)+ β2(Yjt*nerijt)/(Ywt/neerit) + εxijt (3)

21
his
on its
and.
te for
in
r
xports
cted to
ring 14
bourg
6 to
Least
ao and
on
en the
mation
share
ent in
re, the
ected
n the
tor ofprice
it mayur shareables,
n modeln, thus
In Equation (2),Xit/PXit denotes total Canadian real exports to the world at time t. In t
traditional export equation, Canada’s export performance is expected to depend primarily
relative price competitiveness versus all trading partners, in addition to the level of world dem
Relative price competitiveness is captured by the price of Canada’s goods,Pit, relative to the price
of world goods,Pwt, expressed in Canadian dollars using the nominal effective exchange ra
Canada, denoted (Pit/Pwt)*neerit. The level of world demand (or world real GDP) is expressed
Canadian dollars and is denoted,Ywt/neerit. The latter specifies shifts in world demand fo
Canada’s export goods.
Finally, expressing Canadian real exports to country j as a share of total Canadian real e
yields the export share function as represented by Equation (3). This export share is expe
depend on the ratio of relative price competitiveness, denoted (Pwt/Pjt)*(nerjit /neerit), in addition
to the relative income of country j as a share of world income, (Yjt*nerijt)/(Ywt/neerit).31
Empirical estimation of the export share equation (Equation (3)) uses a panel dataset cove
country-pairs (i.e., exports from Canada to each of the EU15 countries, excluding Luxem
due to data availability).32 The data are of a quarterly frequency and include the period 198
2003.33 The estimated long-run parameters are obtained using the panel Dynamic Ordinary
Squares (DOLS) leads-and-lags procedure which corrects for potential endogeneity bias (K
Chiang 2000, Mark and Sul 2002).34 These estimates are derived with four leads and four lags
the first difference of the two fundamental determinants. Note that our results are robust wh
lag process is reduced from fourth order to second order. Table 2 presents the panel esti
results for Canadian exports to the EU as a share of total Canadian exports.
Overall, our basecase results (Equation 3 reported in column 1) for the Canadian export
equation suggest that relative income accounts for about 57 per cent of the long-run movem
the Canadian export volume to the EU as a share of total Canadian exports. Furthermo
estimated parameter associated with EU income relative to world income takes the exp
positive sign and is statistically significant. On the other hand, the estimated parameter o
relative exchange rate is not statistically significant.
31. Admittedly, the foreign price deflator of country j at time t should be measured by the domestic price deflacountry j at time t (price of domestic substitutes). For reasons of data availability, however, we use the GDPdeflator for each country in the calculation of the relative bilateral real exchange rate.
32. All panel estimations and statistical tests were performed using the Stata and Eviews packages.33. Although it is theoretically inappropriate for a bounded variable such as a share to be truly nonstationary,
nevertheless be so, in a statistical sense, over a given sample period. This is the case for several of ovariables over our sample period. Indeed, we find evidence of a unit root in the level of all relevant varibased on the Hadri panel stationarity test.
34. We test for cointegration using the panel Johansen cointegration test and through a panel error-correctiousing the Granger Representation Theorem (1987). In both cases, we reject the null of no cointegratioallowing valid inferences.

22
me,
ample
unted
fied in
After
trade
of the
stically
he first-. Whiteenotes
e from
In column 2 of Table 2, after controlling for relative price competitiveness and relative inco
the basecase equation is augmented with a linear time trend over the entire estimation s
period to help account for the trend decline in the EU’s share of Canadian exports not acco
for by movements in its long-run determinants (see column (2)). Because our model is speci
terms of shares, the general increase in world trade openness is implicitly accounted for.
controlling for fundamental determinants, our trend variable, therefore, captures excess
resulting from other factors, such as increased European economic integration. Although
expected negative sign, the estimated parameter associated with the EU trend is not stati
significant.
Table 2: Canadian Export Share Equation (1986–2003)a
a. The panel DOLS estimation procedure uses four leads and four lags. The estimated parameters of tdifference terms are constrained to be the same across countries (i.e., homogeneous dynamics)heteroskedasticity-consistent errors are used in the calculation of the t-statistics (in parentheses). *(**) dthat the parameter is statistically different from zero at a 10 per cent (5 per cent) level. Critical values arKao and Chiang (2000).
Panel estimations, Canada and 14 EU countries, Sample: 1986:01–2003:04, N=1008
Dependent variable:Xijt /Xit
Long-run factors (1) (2) (3) (4)
Constant -0.008(0.97)
-0.005(0.53)
0.007(1.47)
0.007(1.53)
Relative bilateral realexchange rateb:
(Pwt/Pjt)*(nerjit /neerit)
b. + (-) appreciation (depreciation) of the Canadian dollar.
0.009(1.13)
0.009(1.01)
-0.001(0.38)
-0.003(1.07)
Relative income of country jas a ratio to world income:(Yjt*nerijt)/(Ywt/neerit)
0.159(4.65)**
0.157(4.46)**
0.117(6.99)**
0.116(6.84)**
EU Trend -0.00002(1.16)
-0.00004(2.12)*
UK dummy 0.011(15.43)**
0.031(17.44)**
UK Trend -0.0002(13.87)**
EU Trend (ex-UK) -0.00003(1.94)
RBAR2 0.5701 0.5735 0.7793 0.8109

23
nited
ould
same
untry
that
antly
d, the
ecting
nadian
ile the
on has
om
total
uding a
r EU
that
oted
More
trend
ports
n Table
adian
972 to
rts to
rted in
mated
the
e only
pected
Francevariable
Reflecting the extraordinarily strong historical trade relationship between Canada and the U
Kingdom, we are interested in determining whether the inclusion of a UK dummy variable w
significantly change our results. We therefore re-estimate our panel regressions over the
sample period including a dummy variable that takes a value of one only for Canada-UK co
pair observations and zero otherwise. The results, reported in column 3 of Table 2, show
including a dummy variable for the UK’s share of Canadian exports does indeed signific
increase the explanatory power of the estimated equation (from 0.57 to 0.78). As expecte
estimated parameter associated with the UK dummy variable takes a positive value refl
larger Canadian exports to the UK, on average over our sample, as a share of total Ca
exports. At the same time, the estimated parameter on relative income falls modestly, wh
estimated parameter on the relative exchange rate remains statistically insignificant.35
As discussed in section 3, the relative importance of Canada’s exports to the European Uni
primarily been driven by a marked fall in non-energy commodity exports to the United Kingd
(Figures 4 and 6). Given this dramatic fall in exports to the United Kingdom as a share of
Canadian exports, we re-estimate our panel regressions over the same sample period incl
UK-specific linear time trend variable along with a separate trend for exports to all the othe
countries (i.e., excluding the UK). The results, reported in column 4 of Table 2, show
including a distinct UK linear time trend variable and another for the other EU countries (den
EU ex-UK) increases the explanatory power of the estimated equation (from 0.78 to 0.81).
importantly, the estimated parameter on the UK trend is ten times that of the EU ex-UK
variable consistent with the stylized facts reported earlier.
As mentioned previously, the dramatic fall in the United Kingdom’s share of Canadian ex
began in the early 1950s (based on available data). The estimation results reported above, i
2, cover the period 1986 to 2003. By removing three country pairs from the sample (i.e., Can
exports to Greece, Spain and Portugal), we are able to extend the sample period to cover 1
2003. This longer sample helps to more fully incorporate the large and gradual fall in expo
the United Kingdom as a share of total Canadian exports. The results of this exercise, repo
Table 3, reveal that extending our sample period back to 1972 effectively doubles the esti
parameter on both the UK dummy variable and the UK-specific linear time trend while
estimated parameters on the other explanatory variables remain broadly unchanged. Th
exception is the estimated parameter on the relative exchange rate which takes the ex
35. As an aside, when dummy variables for other major country-pairs (e.g., Canadian exports to Germany,and the Netherlands) are included in the regression, the estimated parameter for the Canada-UK dummydominates in size.

24
rend
and
dian
, also
kes a
ada.
first-White*(**)ical
negative sign and is statistically significant when the UK dummy variable and the two t
variables are also included.
In summary, while fundamental trade determinants (i.e., relative price competitiveness
relative income growth over the period) explain, in part, the EU’s declining share of Cana
exports over the period, the characteristics of Canada-United Kingdom trade, in particular
played an important role. A dummy variable for the Canada-United Kingdom country pair ta
relatively large positive parameter, indicative of the UK’s relatively strong trade ties with Can
Table 3: Canadian Export Share Equation (1972–2003)a
a. The panel DOLS estimation procedure uses four leads and four lags. The estimated parameters of thedifference terms are constrained to be the same across countries (i.e., homogeneous dynamics).heteroskedasticity-consistent errors are used in the calculation of the t-statistics (in parentheses).denotes that the parameter is statistically different from zero at a 10 per cent (5 per cent) level. Critvalues are from Kao and Chiang (2000).
Panel estimations, Canada and 11 EU countries, Sample: 1972:01–2003:04, N=1408
Dependent variable:Xijt /Xit
Long-run factors (1) (2) (3) (4) (5)Excludingthe U.S.
Constant -0.013(1.09)
-0.011(0.70)
0.009(1.19)
0.014(2.29)*
0.049(2.03)*
Relative bilateral realexchange rateb:
(Pwt/Pjt)*(nerjit /neerit)
b. + (-) appreciation (depreciation) of the Canadian dollar.
0.016(1.29)
0.015(1.03)
-0.002(0.30)
-0.008(2.16)*
-0.049(2.33)*
Relative income of country jas a ratio to world income:(Yjt*nerijt)/(Ywt/neerit)
0.165(3.19)**
0.164(3.08)**
0.119(3.84)**
0.113(4.40)**
0.303(4.37)**
EU Trend -0.00001(0.42)
-0.00005(2.49)*
UK dummy 0.019(8.35)**
0.050(22.22)**
0.142(12.72)**
UK Trend -0.0004(16.34)**
-0.0006(9.05)**
EU Trend (ex-UK) -0.00004(2.41)*
0.00007(2.84)*
RBAR2 0.4473 0.4483 0.7027 0.8421 0.8209

25
ically
adian
ding
ntly,
iable.
dom,
ntries
a are
ip in
h are
mmy
ith the
umn 4
les are
in the
omic
are of
nited
e the
r cent
mn 4
gh of
t imply
gin in
nadian
hly
tion in
near
that
In addition, a linear time trend for the same country pair takes a negative and highly statist
significant estimated parameter, reflecting the dramatic decline in the UK’s share of Can
exports. At the same time, a single trend variable included for all other EU countries (exclu
the UK) takes a smaller, but still statistically significant, negative parameter. More importa
the estimated parameter on the UK trend is roughly ten times that of the EU ex-UK trend var
This is consistent with the fact that Canada’s exports to the EU, excluding the United King
only trended down very modestly over the period.
These empirical results are further substantiated by narrowing our sample down to six cou
(Belgium, France, Germany, Italy, the Netherlands, and the United Kingdom) for which dat
available from 1960 to 2003. This sample period allows us to fully cover the UK’s membersh
the EFTA and the European Community up until 2003. The results of this exercise, whic
available upon request, effectively double the estimated parameter on both the UK du
variable and the UK-specific linear time trend while the estimated parameter associated w
EU ex-UK trend variable remains unchanged, when compared to the results reported in col
of Table 3. At the same time, the estimated parameters on the other explanatory variab
reduced roughly by half. Hence, these results provide additional evidence that the decline
EU’s share of Canadian exports was largely driven by the United Kingdom’s increased econ
integration with Western Europe during the 1960’s and 1970s.
In order to capture the effects resulting from changes in the relative tariff rate on the EU’s sh
Canadian exports, we included data on relative tariff rates charged by the EU and the U
States on imports from Canada. Taking the ratio of the EU tariff rate to that of the U.S., we us
U.S. rate as a proxy for the average world tariff rate (recall that the U.S. comprises 80-85 pe
of Canada’s exports over this period). This tariff ratio was added to the specification in colu
of Table 3. However, our results show that the estimated parameter on the tariff ratio, althou
the expected negative sign, was not statistically significant. Nonetheless, this result does no
that tariff changes have had no impact on Canada-EU trade patterns. Our tariff data only be
1988 and, thus, may not adequately capture the steep decline in the UK’s share of Ca
exports since the early 1970s.36 At the same time, Clausing (2001) argues that the use of hig
aggregated data to estimate the effects of integration does not allow one to exploit the varia
tariff rates that occur at the commodity level. Thus, in our empirical work, our dummy and li
time trend variables likely capture the effect from changes in tariff and non-tariff barriers.
36. As an alternative, the ratio of the UK tariff rate to the U.S. tariff rate may better reflect the shift in tariff ratesmost affected Canada.

26
EU’s
model,
are of
of the
aphic
mental
certain
xports
lls by
EU’s
lative
ntly
’s total
(where
are of
rrency
f total
eciates
around
share
e two
t much
nited
are of
e 27).
ons
the
0 and
lf and
rally
New
early
nse in
Returning to our 1972 to 2003 sample, Figure 27 illustrates the relationship between the
share of Canadian exports and the two fundamental determinants used in our export share
namely the EU’s share of world real income and the real bilateral exchange rate as a sh
Canada’s real effective exchange rate. Alone, these two factors explain about 45 per cent
variance in the EU’s share of Canadian exports (see column 1 of Table 3). The gr
representation in Figure 27 reveals the expected co-movement between the two funda
determinants and the EU’s share of Canadian exports. This co-movement appears less
after about 1990. Overall, part of the general trend decline in the EU’s share of Canadian e
appears to be consistent with a gradual trend decline in the EU’s income share, which fa
about half over the period shown in Figure 27. In addition, periods of notable strength in the
income share (e.g., late 1970s and late 1980s) correspond to intervals of growing re
Canadian exports to the EU. Likewise, when the EU’s share of world income falls significa
(e.g., early 1980s), Canadian exports to the EU generally decline as a share of Canada
exports.
At the same time, a clear negative relationship is visible between the relative exchange rate
a higher value corresponds to a relative appreciation of the Canadian dollar) and the EU’s sh
Canadian exports. When the Canadian dollar appreciates strongly versus the EU cu
(relative to the Canadian effective exchange rate), exports to the EU fall as a share o
Canadian exports (e.g., early 1980s). On the other hand, when the Canadian dollar depr
versus the EU currencies in relative terms, the EU’s share of Canadian exports grows (e.g.,
1980, mid to late 1980s).
Despite these facts, it also appears that a portion of the general downward trend in the EU’s
of Canadian exports over the 1972 to 2003 period cannot be accounted for by thes
fundamental factors. The stylized facts and empirical results presented above suggest tha
of this downward trend is attributable to the relative decline in Canada’s exports to the U
Kingdom. Indeed, when the UK is excluded, Canadian exports to the rest of the EU, as a sh
total Canadian exports, appear to follow the fundamental determinants more closely (Figur
Accordingly, the UK dummy variable and UK trend included in our empirical specificati
explain roughly half of the adjusted R2 (0.8402) estimated by our export share model over
1972 to 2003 period. When Britain co-founded the European Free Trade Association in 196
then acceded to the European Community in 1973, it removed trade barriers between itse
the rest of Western Europe. This shift in trade policy occurred within a context of gene
weakening historical ties between Canada and Britain. Indeed, like Canada, Australia and
Zealand lost their preferential trade treatment with the United Kingdom over the 1960s and
1970s. In this sense, the story may partially be one of trade diversion, but not in a classic se
27
m all
en its
1965.
nt of
North
facts
years.
nadian
over
in our
uding
uding a
ated
alue
e of
n the
to rise
been
has
allen
ative
UK
de
1973
land),
rican
which increased economic integration would have diverted Canadian real exports away fro
European Union countries and not just the United Kingdom (recall Figure 7).
At the same time, it is important to keep in mind that Canada was making strides to strength
trade ties with the United States over the same period by signing the bilateral Auto Pact in
More recently, North American economic integration increased significantly with the adve
the Canada-U.S. Free Trade Agreement in 1989 and the subsequent signing of the
American Free Trade Agreement (NAFTA) in 1994. Indeed, as reported in the stylized
section, the U.S. share of Canadian exports has substantially increased over the past fifty
This increase in the U.S. share may have contributed to the decline in the EU’s share of Ca
exports over the same period.
To empirically analyze this issue, we re-estimate our panel regression of column 4 in Table 3
the 1972 to 2003 sample period, but we exclude Canadian exports to the United States
calculation of total Canadian exports. The results, reported in column 5, show that excl
Canadian exports to the U.S. increases the estimated parameters on all the variables incl
significant increase in the UK dummy (three times larger). More importantly, the estim
parameter on the EU ex-UK trend variable now takes on a significant small positive v
consistent with our main conclusion that excluding the United Kingdom, the EU’s shar
Canadian exports has remained relatively unchanged over the past fifty years.
5. Conclusions
This paper has examined the effects of increasing European economic integration o
European Union’s trade with Canada over the past fifty years.
In broad terms, the stylized facts suggest that, while Canada’s trade with the EU continues
in terms of levels (export and import volumes), the EU’s share of total Canadian trade has
declining since the 1950s. More specifically, while the EU’s share of Canadian imports
remained roughly level over this period, the EU’s share of Canadian exports has f
significantly. This decline can be attributed almost completely to a dramatic fall in the rel
importance of Canadian non-energy commodity exports to the United Kingdom. This shift in
imports was likely driven primarily by Britain’s co-founding of the European Free Tra
Association in 1960 as well as that country’s accession to the European Community (EC) in
which left Canada (and other Commonwealth countries, such as Australia and New Zea
without its pre-existing preferential trade treatment. At the same time, increased North Ame
28
rimary
of total
gh the
ussed
has
ing of
esting
lands
trade
e model
sistent
nada’s
hile
er the
, the
g the
ively
. In
cant
s of
ntries
ult is
only
n this
two
caused
ned
ent by
y also
e 1965
North
economic integration has further boosted the United States’ dominance as Canada’s p
export market.
In terms of investment, the EU has been relatively stable over past decades both as a share
Canadian investment abroad and as a share of total foreign investment in Canada, althou
latter has declined modestly. At the regional level, the investment story is similar to that disc
above for trade flows. Namely, the UK’s share of total Canadian direct investment in the EU
fallen dramatically, as has the UK’s share of total EU investment in Canada. Since the sign
the Treaty of Rome in 1957, these shares have fallen by at least half, with Canada inv
relatively more in Ireland and the Netherlands while, on the flipside, France and the Nether
are investing relatively more in Canada.
To empirically analyze these stylized facts, the study uses a quarterly panel dataset of
between Canada and fifteen European Union countries. Estimates based on an export shar
(over the 1986 - 2003, 1972 - 2003 and 1960 - 2003 periods) provide some evidence con
with the idea that increased European economic integration may have helped reduce Ca
relative exports to the EU, and most notably, the United Kingdom. More specifically, w
fundamental trade determinants (i.e., relative price competitiveness and relative income ov
period) explain about half of the EU’s declining share of Canadian exports over the period
United Kingdom, in particular, also played a separate, but important, role (roughly explainin
other half). A dummy variable for the Canada-United Kingdom country pair takes a relat
large positive parameter, indicative of the UK’s relatively strong trade ties with Canada
addition, a linear trend for the United Kingdom takes a negative and highly statistically signifi
estimated parameter, reflecting the UK’s gradually declining relative importance in term
Canada’s exports. At the same time, a single trend variable included for all other EU cou
(excluding the UK) takes a very small statistically significant negative parameter. This res
consistent with the fact that Canada’s exports to the EU, excluding the United Kingdom,
gradually trended down over the period.
Clearly, the evolution of Canada-United Kingdom trade has been an important influence i
downward trend. Within the context of generally weakening historical ties between the
countries, evidence suggests that the UK’s declining importance to Canadian exports was
primarily by the UK’s increased economic integration with Western Europe, as mentio
previously. As a result of this process of integration, Canada lost its preferential trade treatm
the United Kingdom. However, at the same time, the EU’s share of Canadian exports ma
have been affected by increased Canada-United States economic integration (e.g., th
Canada-U.S. Auto Pact, the 1989 Canada-U.S. Free Trade Agreement and the 1994

29
s to the
. Our
owever,
e past
es not
50s, it
United
ralia
xports
n the
62 (as
oss of
be an
ilize a
ed by
with
panded
also
d the
n, EU
price
other
other
ificant
ration.
n new
ched in
in May
American Free Trade Agreement). To the extent these factors increased Canadian export
United States, they would also reduce the European Union’s relative export importance
results suggest that, when increased Canada-United States trade is accounted for, h
Canada’s export share to the EU, excluding the United Kingdom, has been stable over th
fifty years while that of the UK has trended down.
In summary, our analysis suggests that while increased European economic integration do
appear to have resulted in a decline in the general EU-wide trade with Canada since the 19
has nevertheless played a very significant role in regards to Canada’s exports to the
Kingdom. Indeed, given that a similar decline occurred in the former British colonies of Aust
and New Zealand, evidence suggests that the majority of the decline in Canada’s relative e
to the EU was caused by the UK’s growing economic integration with the rest of Europe. I
end, it appears that there was some validity to the concern expressed by L.D. Wilgress in 19
quoted at the beginning of this paper), at least in terms of export shares. Indeed, the l
Canada’s former preferential trade treatment under the British Commonwealth proved to
important factor in this regard.
Looking toward future research, the empirical analysis of this paper could be extended to ut
larger sample of country pairs, subsuming the indirect effect on Canada-EU trade caus
bilateral trade with and between other countries (e.g., intra-EU trade; extra-EU trade
countries such as the United States, Japan, Switzerland and China). As a result, such an ex
model would better capture the effect of increased European economic integration while
controlling for other factors such as increased North American economic integration an
recent favourable supply-side developments in China. As shown in the stylized facts sectio
trade with Asia has been on the rise, especially with China. Indeed, the increase in relative
competitiveness resulting from favourable supply-side developments in China contribute,
things being equal, to increased trade with that country, while possibly reducing trade with
trading partners. These facts draw attention to the importance of accounting for any sign
change in extra-European trade patterns resulting from factors unrelated to European integ
Dependent on available data, future research could also account for EU trade with the te
European Union member states. Indeed, although significant trade agreements were rea
the early 1990s between the EU15 and the ten future members, their accession to the EU
of 2004 marked another large step toward European economic integration.
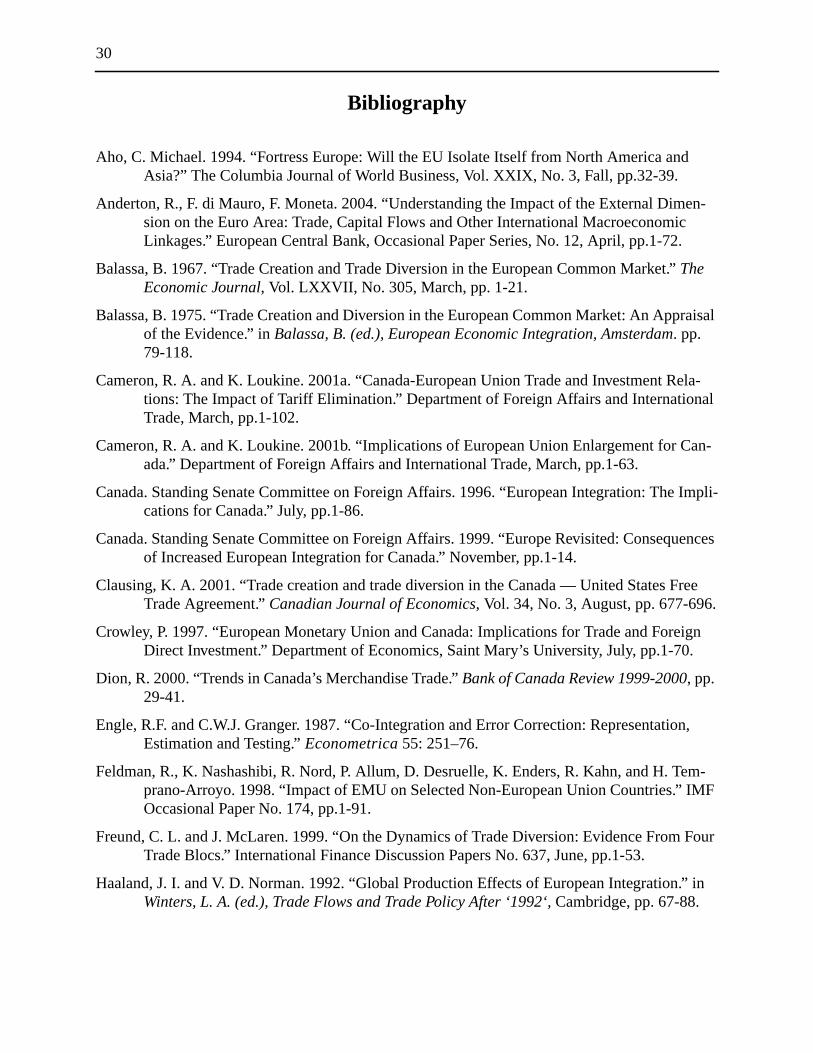
30
en-
.
aisal
ela-al
an-
Impli-
ences
ree.
ign.
n,
em-F
our
” in
Bibliography
Aho, C. Michael. 1994. “Fortress Europe: Will the EU Isolate Itself from North America andAsia?” The Columbia Journal of World Business, Vol. XXIX, No. 3, Fall, pp.32-39.
Anderton, R., F. di Mauro, F. Moneta. 2004. “Understanding the Impact of the External Dimsion on the Euro Area: Trade, Capital Flows and Other International MacroeconomicLinkages.” European Central Bank, Occasional Paper Series, No. 12, April, pp.1-72
Balassa, B. 1967. “Trade Creation and Trade Diversion in the European Common Market.”TheEconomic Journal, Vol. LXXVII, No. 305, March, pp. 1-21.
Balassa, B. 1975. “Trade Creation and Diversion in the European Common Market: An Approf the Evidence.” inBalassa, B. (ed.), European Economic Integration, Amsterdam. pp.79-118.
Cameron, R. A. and K. Loukine. 2001a. “Canada-European Union Trade and Investment Rtions: The Impact of Tariff Elimination.” Department of Foreign Affairs and InternationTrade, March, pp.1-102.
Cameron, R. A. and K. Loukine. 2001b. “Implications of European Union Enlargement for Cada.” Department of Foreign Affairs and International Trade, March, pp.1-63.
Canada. Standing Senate Committee on Foreign Affairs. 1996. “European Integration: Thecations for Canada.” July, pp.1-86.
Canada. Standing Senate Committee on Foreign Affairs. 1999. “Europe Revisited: Consequof Increased European Integration for Canada.” November, pp.1-14.
Clausing, K. A. 2001. “Trade creation and trade diversion in the Canada — United States FTrade Agreement.”Canadian Journal of Economics, Vol. 34, No. 3, August, pp. 677-696
Crowley, P. 1997. “European Monetary Union and Canada: Implications for Trade and ForeDirect Investment.” Department of Economics, Saint Mary’s University, July, pp.1-70
Dion, R. 2000. “Trends in Canada’s Merchandise Trade.”Bank of Canada Review 1999-2000, pp.29-41.
Engle, R.F. and C.W.J. Granger. 1987. “Co-Integration and Error Correction: RepresentatioEstimation and Testing.” Econometrica 55: 251–76.
Feldman, R., K. Nashashibi, R. Nord, P. Allum, D. Desruelle, K. Enders, R. Kahn, and H. Tprano-Arroyo. 1998. “Impact of EMU on Selected Non-European Union Countries.” IMOccasional Paper No. 174, pp.1-91.
Freund, C. L. and J. McLaren. 1999. “On the Dynamics of Trade Diversion: Evidence From FTrade Blocs.” International Finance Discussion Papers No. 637, June, pp.1-53.
Haaland, J. I. and V. D. Norman. 1992. “Global Production Effects of European Integration.Winters, L. A. (ed.), Trade Flows and Trade Policy After ‘1992‘,Cambridge, pp. 67-88.

31
nd
t of
.”
e”.”e tra-
ch,
ssionion
al
un No.
tatis-
sons
an-
ur-l for
ltiple
e.”
Haaland, J. I. 1993. “Welfare Effects of ‘1992’: A General Equilibrium Assessment for EC aEFTA Countries.” CEPR Discussion Paper No. 828, July, pp.1-26.
Hannah, R. 1997. “European Monetary Union and its Implications for Canada.” DepartmenForeign Affairs and International Trade, March, pp.1-30.
Hart, M. 2002. “A Trading Nation: Canadian Trade Policy from Colonialism to GlobalizationThe University of British Coliumbia Press, pp.1-557.
Head, K. and T. Mayer. 2001. “Effet frontière, intégration économique et “Forteresse EuropCentre d’Études Prospectives et d’Informations Internationales (CEPII), Document dvail No. 2001-06, Septembre, pp.1-41.
Holtham, G. 1993. “Economic Integration After Maastricht.” Institute for Public Policy Researpp.1-43.
Kao, C. and M.-H. Chiang. 2000. “On the Estimation and Inference of a Cointegrated Regrein Panel Data.” inAdvances in Econometrics: Nonstationary Panels, Panel Cointegratand Dynamic Panels, Vol. 15, pp.179-222.
Lopez-Cordova, J. E. and C. M. Meissner. 2003. “Exchange-Rate Regimes and InternationTrade: Evidence from the Classical Gold Standard Era.”The American Economic ReviewVol. 93 No.1, March, pp. 344-353.
Mark, N. C. and D. Sul. 2002. “Cointegration Vector Estimation by Panel DOLS and Long-RMoney Demand.” National Bureau of Economic Research, Technical Working Paper287, December, pp. 1-24.
Marth, M., “Foreign affiliate trade statistics — Canadian operations abroad, 1999 to 2001”, Stics Canada Catalogue Number 11F0027MIE - No. 013.
Monahan, P. 1992. “Political and Economic Integration: The European Experience and Lesfor Canada.” York University Centre for Public Law and Public Policy, Study No. 10,pp.1-54.
Nadeau, B. 1985. “Britain’s Entry into the European Economic Community and its Effect on Cada’s Agricultural Exports.” The Institute for Research on Public Policy, pp.1-111.
OECD. 2004. OECD Monthly Statistics of International Trade, Volume 2004/4: April.
Ohly, C. 1993. “What Have We Learned About the Economic Effects of EC Integration? A Svey of the Literature.” Commission of the European Communities Directorate-GeneraEconomic and Financial Affairs, Economic Papers No. 103, Sept. pp.1-50.
Papadaki, E. 1998. “Welfare effects of the completion of the single European market.” inGlobalTrading Arrangements in Transition, Christos C. Paraskevopoulos (ed.),York University,Canada and the Athenian Policy Forum.
Pedroni, P. 1999. “Critical Values for Cointegration Tests in Heterogeneous Panels with MuRegressors.”Oxford Bulletin of Economics and Statistics, 61, November, pp.653-670.
Rose, A. K. 2004. “A Meta-Analysis of the Effect of Common Currencies on International TradNBER Working Paper No. w10373, March, pp.1-24.
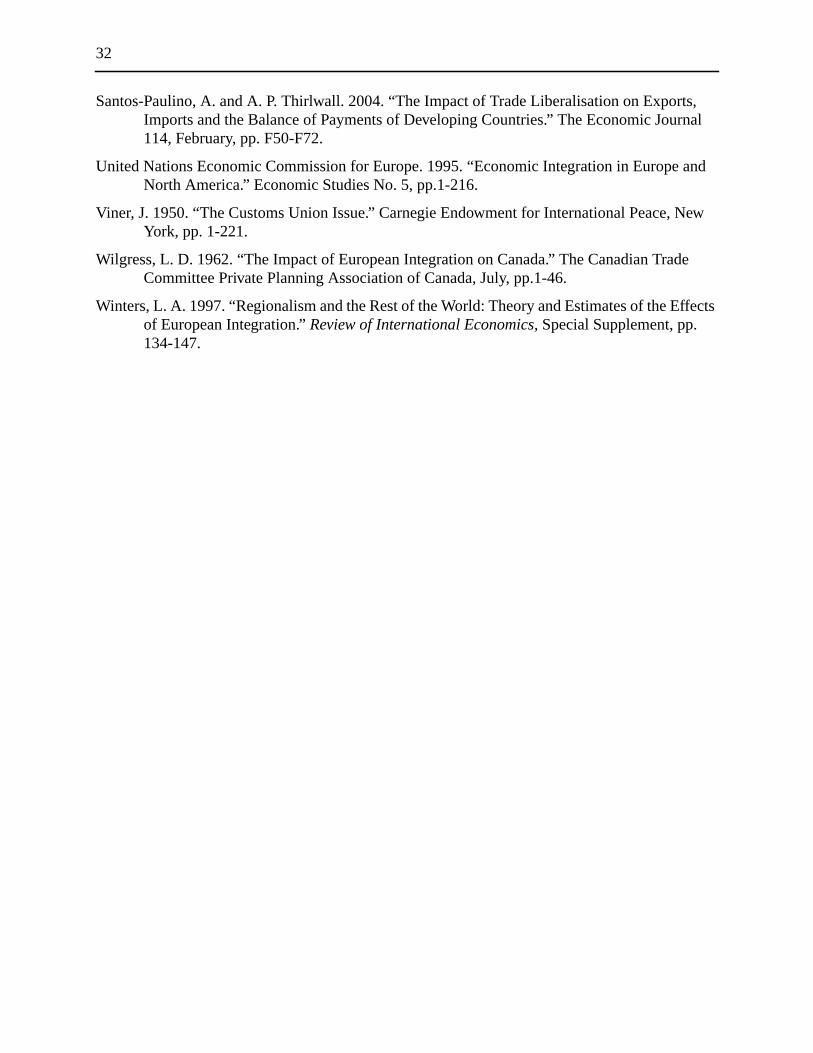
32
s,nal
and
New
e
ects
Santos-Paulino, A. and A. P. Thirlwall. 2004. “The Impact of Trade Liberalisation on ExportImports and the Balance of Payments of Developing Countries.” The Economic Jour114, February, pp. F50-F72.
United Nations Economic Commission for Europe. 1995. “Economic Integration in Europe North America.” Economic Studies No. 5, pp.1-216.
Viner, J. 1950. “The Customs Union Issue.” Carnegie Endowment for International Peace, York, pp. 1-221.
Wilgress, L. D. 1962. “The Impact of European Integration on Canada.” The Canadian TradCommittee Private Planning Association of Canada, July, pp.1-46.
Winters, L. A. 1997. “Regionalism and the Rest of the World: Theory and Estimates of the Effof European Integration.”Review of International Economics,Special Supplement, pp.134-147.

33
atistics
n
ins a
da and
y i
its
Appendix A: Data Description
This appendix describes the data mnemonics used in this paper. Data are taken from St
Canada, OECD (2004), BIS, and IMF databases.37 All time-series mnemonics consist of a
“economic variable” component, as shown in the table below. Each mnemonic also conta
second component that denotes the country.
37. Note that any Canadian statistics taken from OECD (2004) were originally collected by Statistics Canasupplied to the OECD.
Mnemonic Description
Economic Variable Component
M<country> Value of merchandise imports
ner<j><i> Nominal bilateral exchange rate between country j and i (+: appreciation of currencversus currency j), expressed as an index (2000=100)
neer<i> Nominal effective exchange rate of country i (+: appreciation of currency i versus main trading partners), expressed as an index (2000=100)
P<country> GDP price deflator (2000=100)
PC<country> Consumer price index (2000=100)
PM<country> Goods import price deflator (2000=100)
PX<country> Goods export price deflator (2000=100)
Pw World price deflator (2000=100)
X<country> Value of merchandise exports
Y<country> Real GDP
<Country> Component
EMU Countries Austria (aut), Belgium (belg), Finland (fin), France (fr), Germany (gy), Greece (gr),Ireland (ire), Italy (it), Luxembourg (lux), theNetherlands (neth),Portugal (pt), Spain(sp).
EU15 Countries EMU Countries plus Denmark (dnk),Sweden (swed),and the United Kingdom (uk).
Other Countries Canada (ca), China (china),Japan (jpn), Switzerland (swit),United States of America(us).

34
Appendix B: Figures
USAMexico
JapanChina
Other AsiaEU
Others
Figure 1Canadian Imports by Country
(Share of Total Canadian Imports)
Per
cen
t
AustriaBelgium
DenmarkFinland
FranceGermany
GreeceIreland
Figure 2Canadian Imports From Individual EU15 Countries(Share of Total Canadian Imports From the EU15)
Per
cen
t

35
ItalyLuxembourg
The NetherlandsPortugal
SpainSweden
United Kingdom
Figure 3Canadian Imports From Individual EU15 Countries(Share of Total Canadian Imports From the EU15)
Per
cen
t
USAMexico
JapanChina
Other AsiaEU
OthersEU ex UK
Figure 4Canadian Exports by Country
(Share of Total Canadian Exports)
Per
cen
t

36
AustriaBelgium/Luxembourg
DenmarkFinland
FranceGermany
GreeceIreland
Figure 5Canadian Exports to Individual EU15 Countries(Share of Total Canadian Exports to the EU15)
Per
cen
t
ItalyThe Netherlands
PortugalSpain
SwedenUnited Kingdom
Figure 6Canadian Exports to Individual EU15 Countries(Share of Total Canadian Exports to the EU15)
Per
cen
t
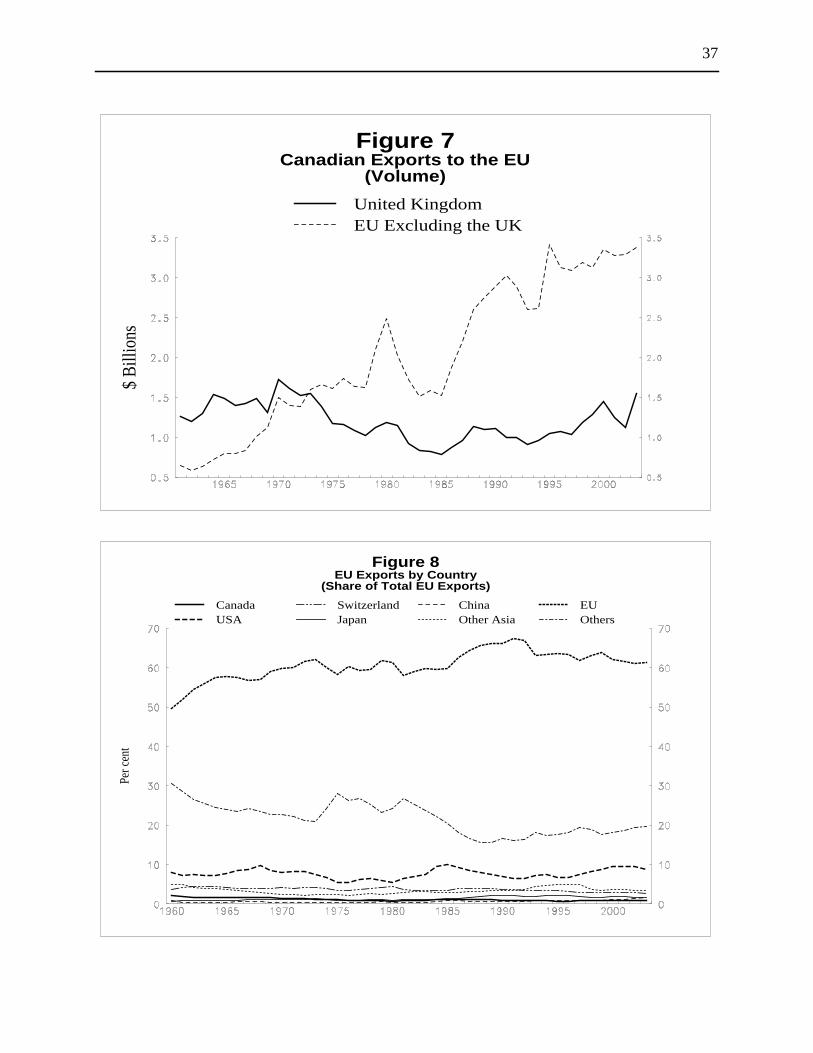
37
United KingdomEU Excluding the UK
Figure 7Canadian Exports to the EU
(Volume)
$ B
illio
ns
CanadaUSA
SwitzerlandJapan
ChinaOther Asia
EUOthers
Figure 8EU Exports by Country
(Share of Total EU Exports)
Per
cen
t

38
CanadaUSA
SwitzerlandJapan
ChinaOther Asia
Figure 9EU Exports by Country
(Share of Total EU Exports)
Per
cen
t
CanadaUSA
SwitzerlandJapan
ChinaOther Asia
EUOthers
Figure 10EU Imports by Country
(Share of Total EU Imports)
Per c
ent

39
CanadaUSA
SwitzerlandJapan
ChinaOther Asia
Others
Figure 11EU Imports by Country
(Share of Total EU Imports)
Per c
ent
CanadaUSA
EU Average*Australia
New ZealandWorld
Japan
Figure 12United Kingdom Imports by Country
(Share of Total UK Imports)
Per
cen
t
* Four largest EU trading partners.

40
CommoditiesTotal Machinery & Equipment
Consumer GoodsOthers
Figure 13Canadian Imports from the EU by Sector
(Share of Total Imports from the EU)
Per
cen
t
Total Commodities Energy Non-Energy
Figure 14Canadian Commodity Imports from the EU by Sub-Sector
(Share of Total Imports from the EU)
Per
cen
t

41
Total Machinery & EquipmentAutomotive Products
Computers and Office EquipmentOther Machinery and Equipment
Figure 15Canadian M & E Imports from the EU by Sub-Sector
(Share of Total Imports from the EU)
Per
cen
t
CommoditiesTotal Machinery & Equipment
Consumer GoodsOthers
Figure 16Canadian Imports from EU by Sector
(Share of Total Imports From All Countries)
Per
cen
t
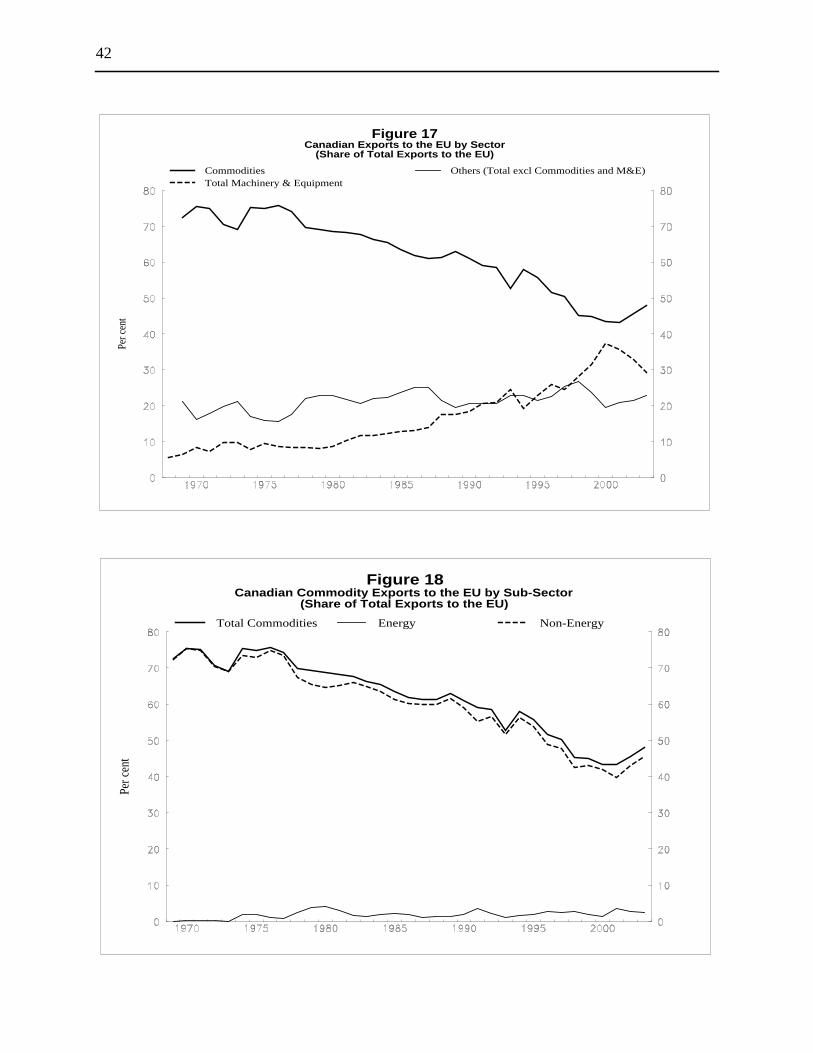
42
CommoditiesTotal Machinery & Equipment
Others (Total excl Commodities and M&E)
Figure 17Canadian Exports to the EU by Sector
(Share of Total Exports to the EU)
Per
cen
t
Total Commodities Energy Non-Energy
Figure 18Canadian Commodity Exports to the EU by Sub-Sector
(Share of Total Exports to the EU)
Per
cen
t

43
Total Machinery & EquipmentAutomotive ProductsAircraft Products
Computers and Office EquipmentTelecommunications EquipmentOther Machinery and Equipment
Figure 19Canadian M & E Exports to the EU by Sub-Sector
(Share of Total Exports to the EU)
Per
cen
t
CommoditiesTotal Machinery & Equipment
Others (Total excl Commodities and M&E)
Figure 20Canadian Exports to the EU by Sector
(Share of Total Exports to All Countries)
Per
cen
t

44
Total Commodities Energy Non-Energy
Figure 21Canadian Commodity Exports to the UK by Sub-Sector
(Share of Total Canadian Exports to All Countries)
Per
cen
t
CommoditiesTotal Machinery & Equipment
Others (Total excl Commodities and M&E)
Figure 22Canadian Exports to All Countries by Sector
(Share of Total Exports to All Countries)
Per
cen
t

45
EU-15UK
IrelandGermany
FranceThe Netherlands
Figure 23Canadian Direct Investment Abroad by Country
(Share of the Total Canadian Investment Abroad)
Per
cen
t
EU-15UK
GermanyFrance
The Netherlands
Figure 24Foreign Direct Investment in Canada by Country
(Share of the Total Foreign Direct Investment in Canada)
Per
cen
t

46
FranceGermany
The NetherlandsUK
Figure 25Foreign Direct Investment in Canada by Country
(Share of EU Foreign Direct Investment in Canada)
Per
cen
t
FranceGermany
The NetherlandsUK
Ireland
Figure 26Canadian Direct Investment Abroad by Country(Share of Total Canadian Investment in the EU)
Per
cen
t

47
Canadian Exports to the EU (Share of Total Exports)Canadian Exports to the EU Excl. UK (Share of Total Exports)EU Real GDP (Share of World Real GDP)Relative Canada-EU Bilateral Real Exchange Rates**
Figure 27Fundamental Determinants of Canadian Exports to the EU*
Per
cen
t
* Simple average of individual EU15 countries.** + (-) appreciation (depreciation) of the Canadian dollar.

48